
Synthesis and Evaluation of a 18F-Labeled Ligand for PET Imaging of Colony-Stimulating Factor 1 Receptor

 , ,
, ,
Abstract
1. Introduction
2. Results and Discussion
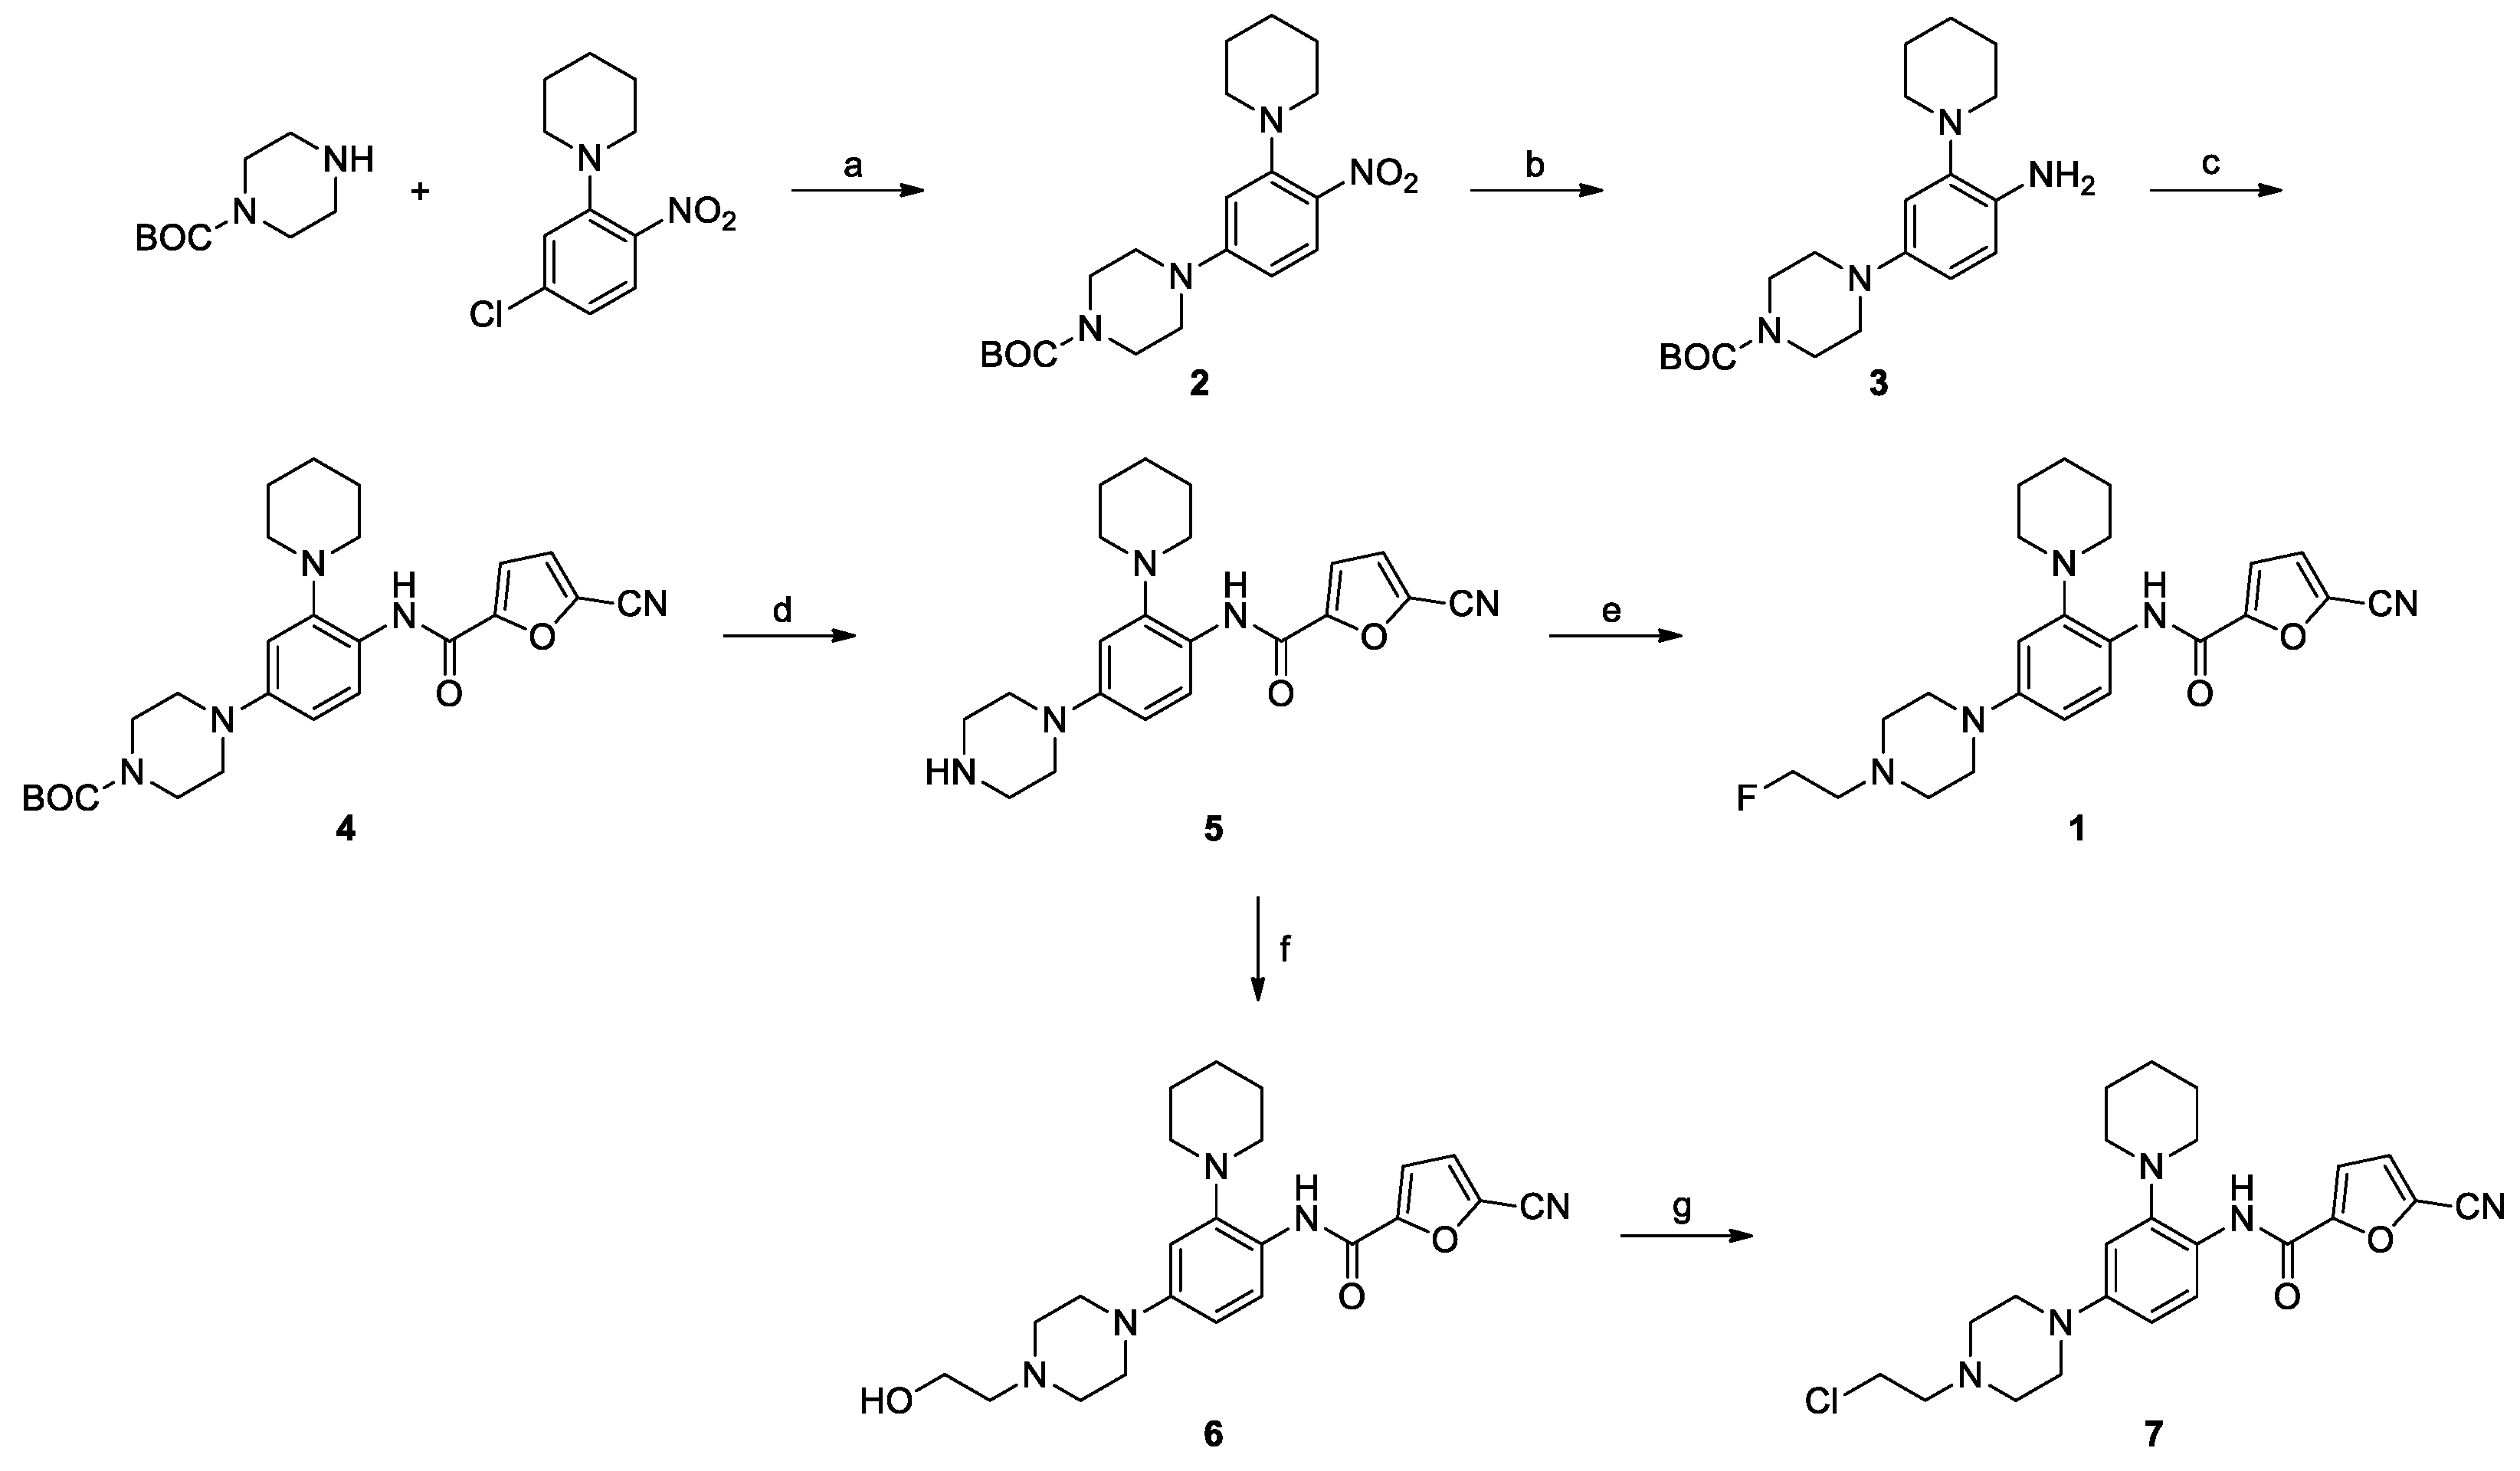
2.1. Chemical Synthesis
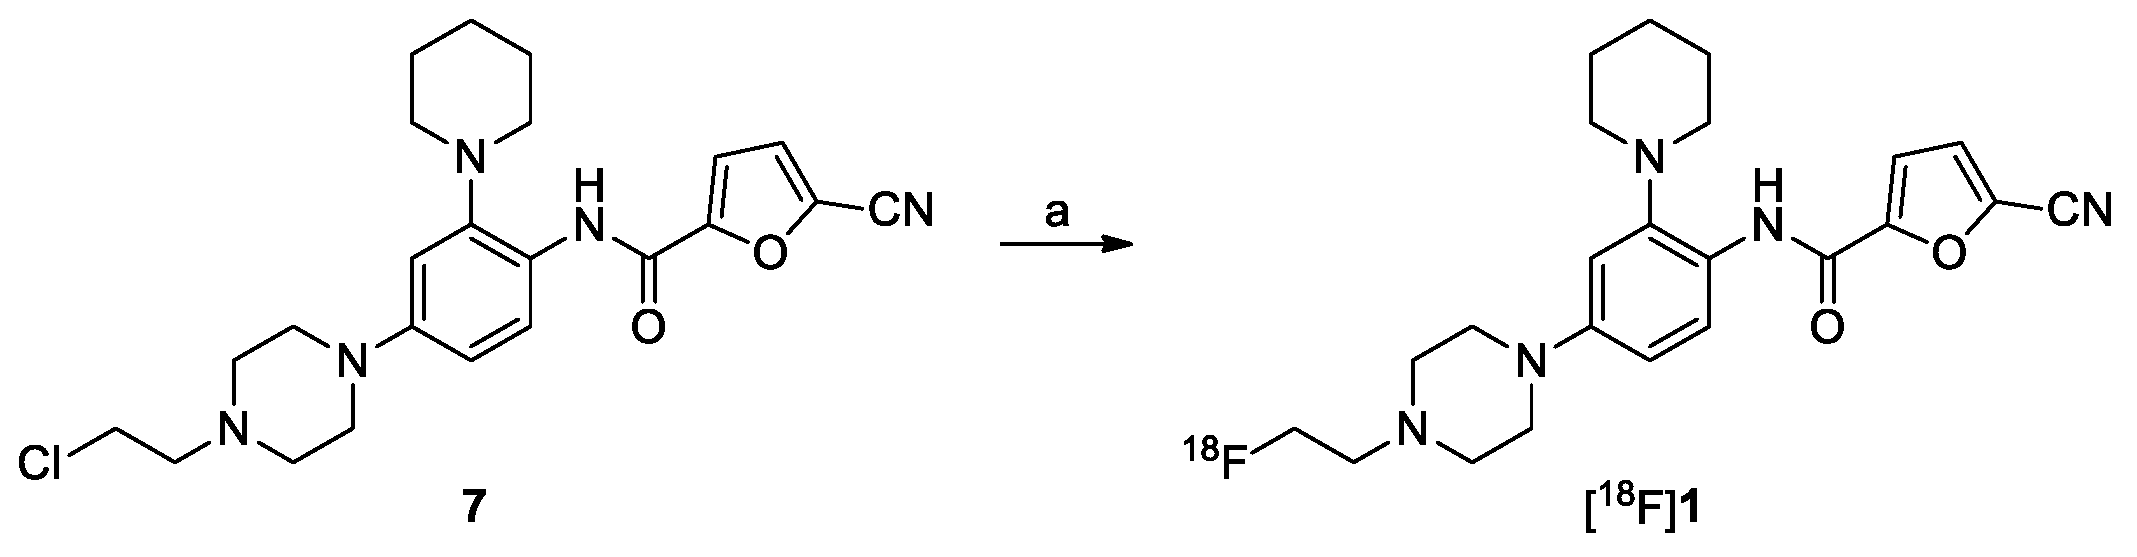
2.2. Radiochemical Synthesis of [18F]1
2.3. In Vitro Studies
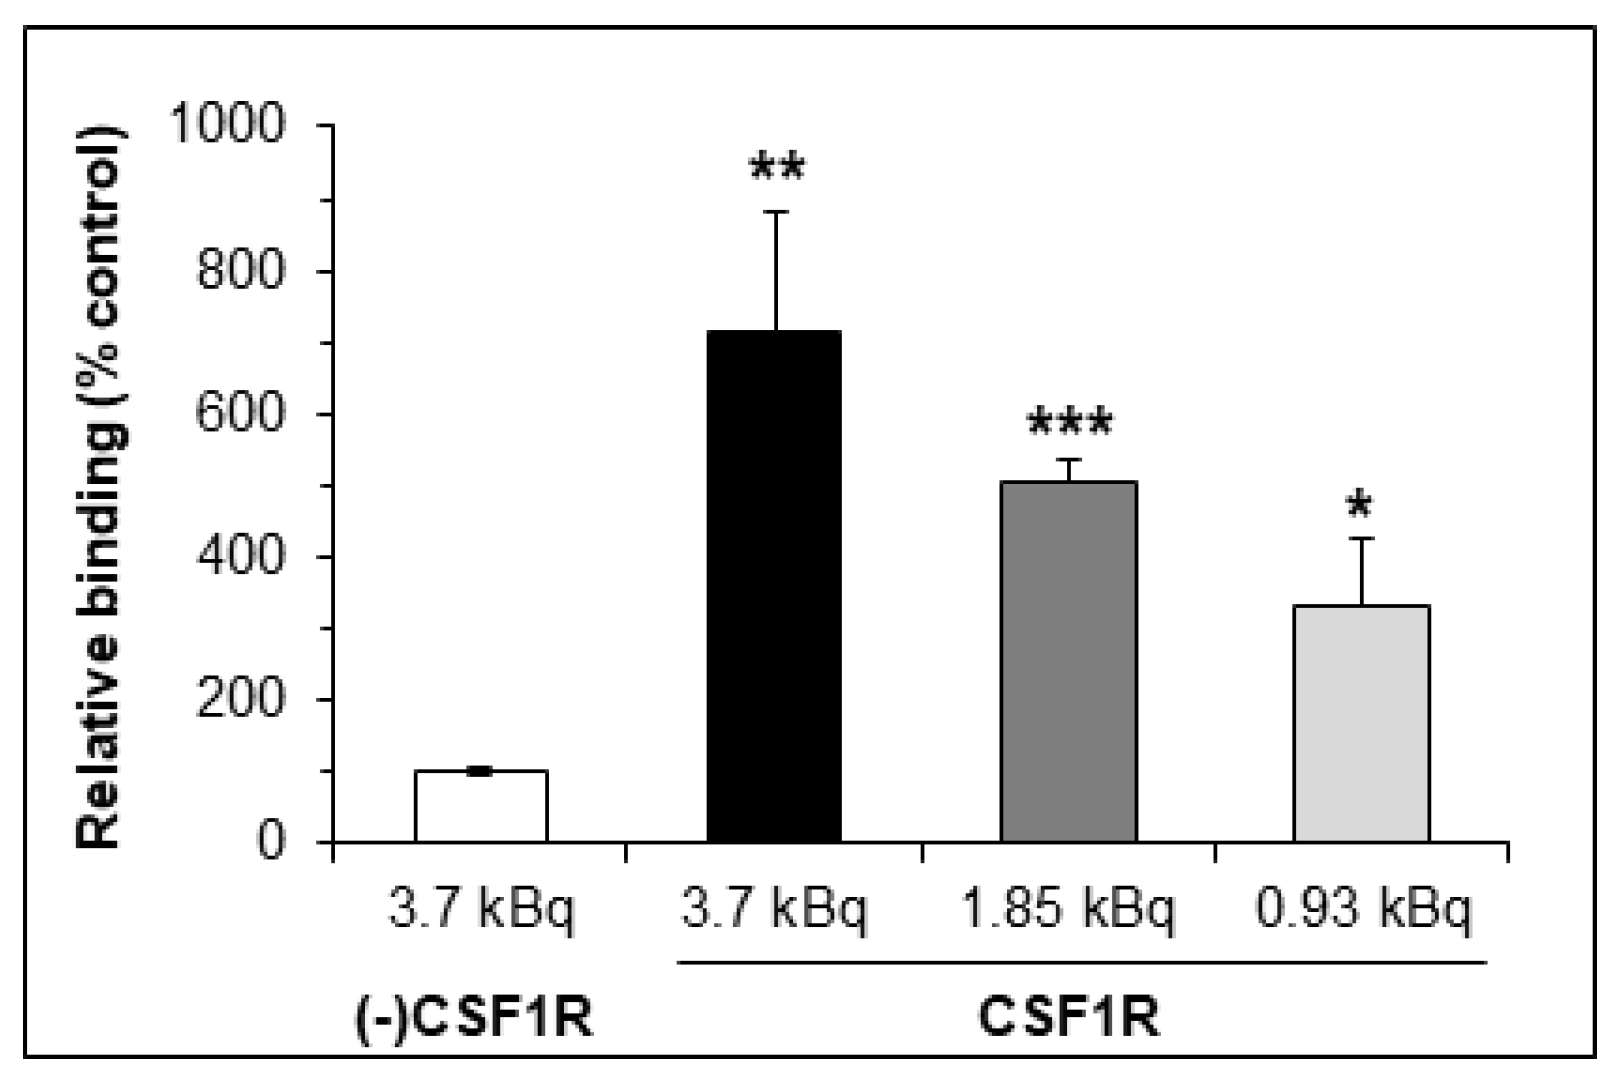
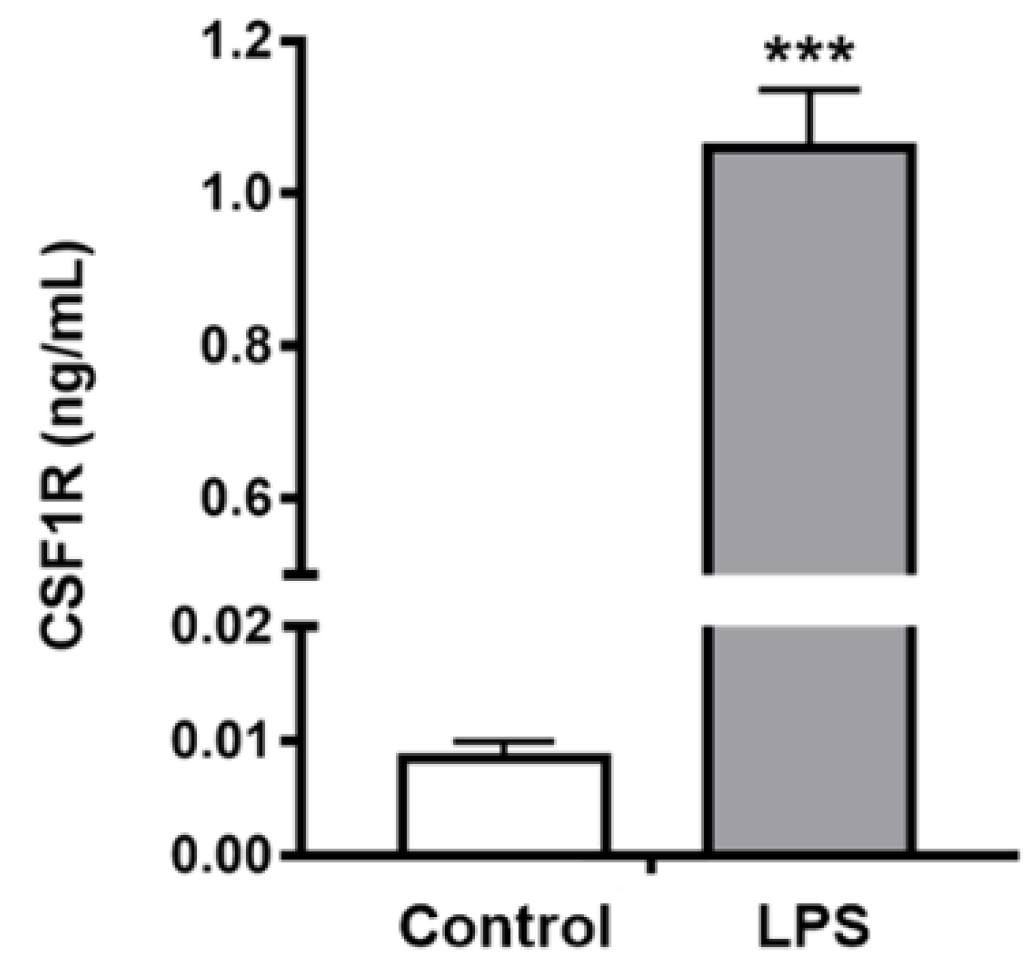
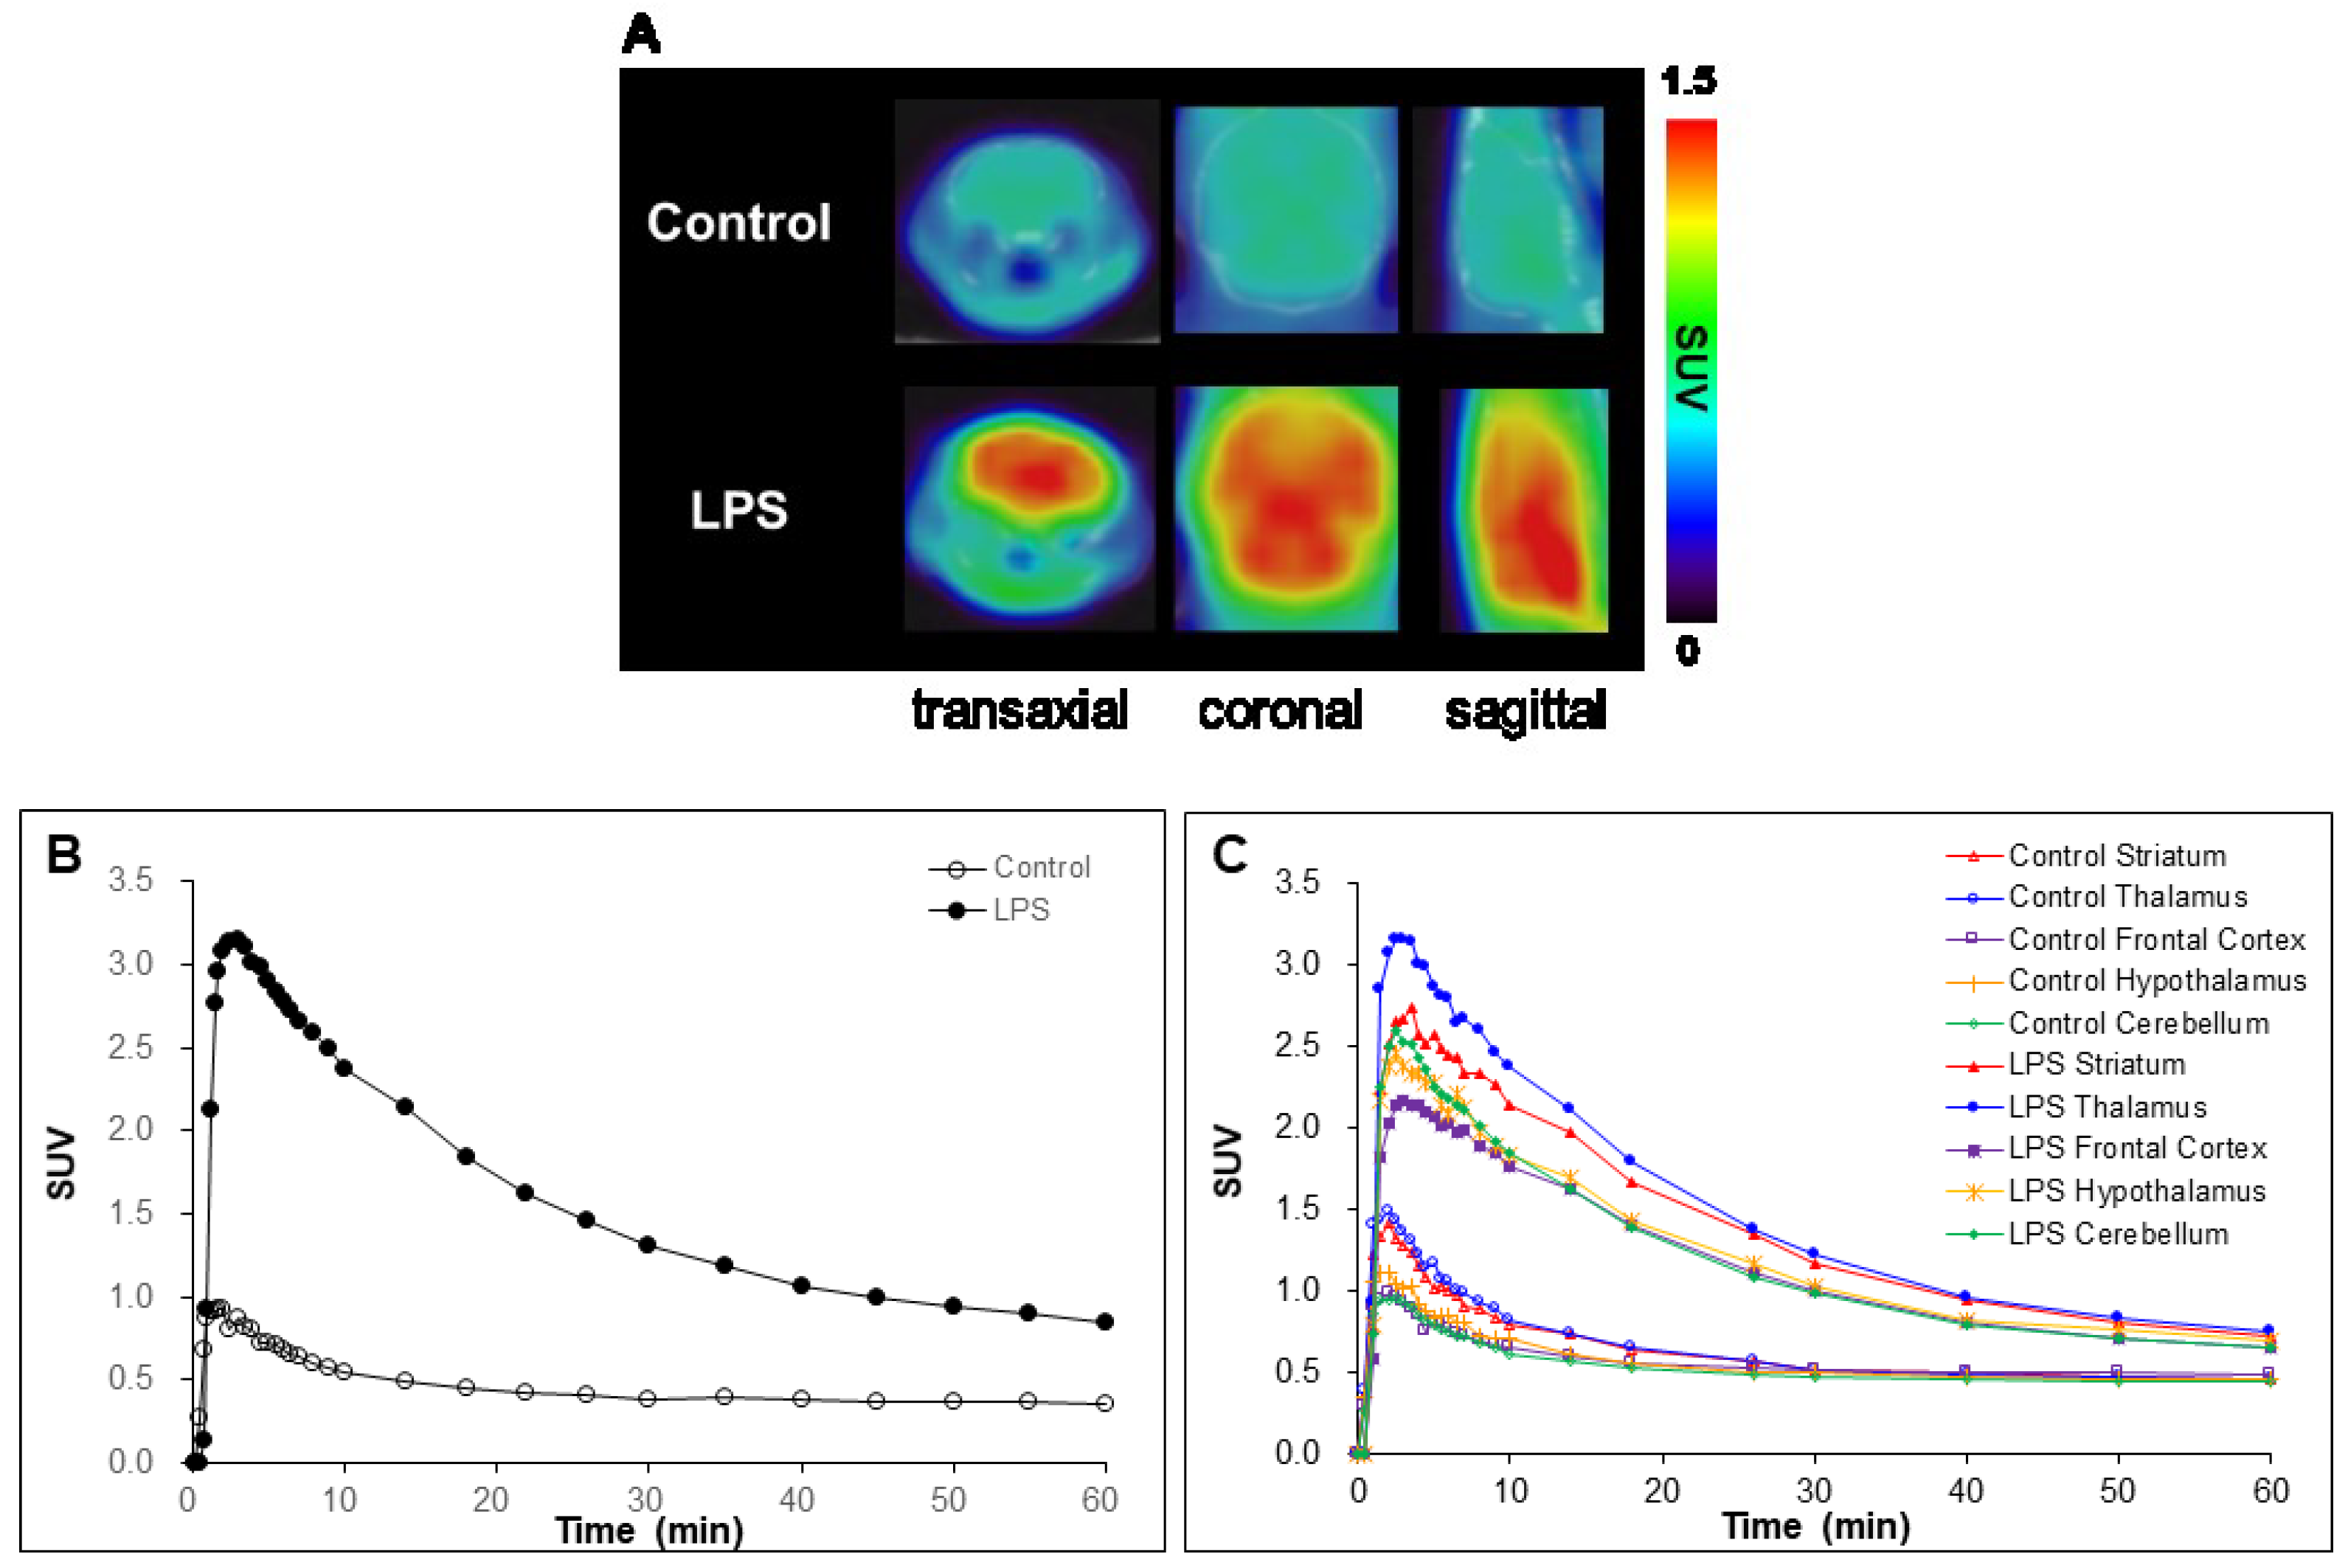
2.4. In Vivo Studies
3. Materials and Methods
3.1. General
3.2. Synthesis of Ligand 1
3.2.1. tert-Butyl 4-(4-Nitro-3-(piperidin-1-yl)phenyl)piperazine-1-carboxylate (2)
3.2.2. tert-Butyl 4-(4-Amino-3-(piperidin-1-yl)phenyl)piperazine-1-carboxylate (3)
3.2.3. tert-Butyl 4-(4-(5-Cyanofuran-2-carboxamido)-3-(piperidin-1-yl)phenyl)piperazine-1-carboxylate (4)
3.2.4. 5-Cyano-N-(4-(piperazin-1-yl)-2-(piperidin-1-yl)phenyl)furan-2-carboxamide (5)
3.2.5. 5-Cyano-N-(4-(4-(2-fluoroethyl)piperazin-1-yl)-2-(piperidin-1-yl)phenyl)furan-2-carboxamide (1)
3.3. Synthesis of Precursor (7)
3.3.1. 5-Cyano-N-(4-(4-(2-hydroxyethyl)piperazin-1-yl)-2-(piperidin-1-yl)phenyl)furan-2-carboxamide (6)
3.3.2. 5-Cyano-N-(4-(4-(2-chloroethyl)piperazin-1-yl)-2-(piperidin-1-yl)phenyl)furan-2-carboxamide (7)
3.4. Radiochemical Synthesis
3.5. In Vitro Studies
3.5.1. Binding Assay
3.5.2. Partition Coefficient
3.5.3. Binding Study of [18F]1 to CSF1R
3.6. In Vivo Studies
3.6.1. Animals
3.6.2. CSF1R Levels in Mouse Brain
3.6.3. MicroPET/CT Imaging
3.6.4. Ex Vivo Biodistribution
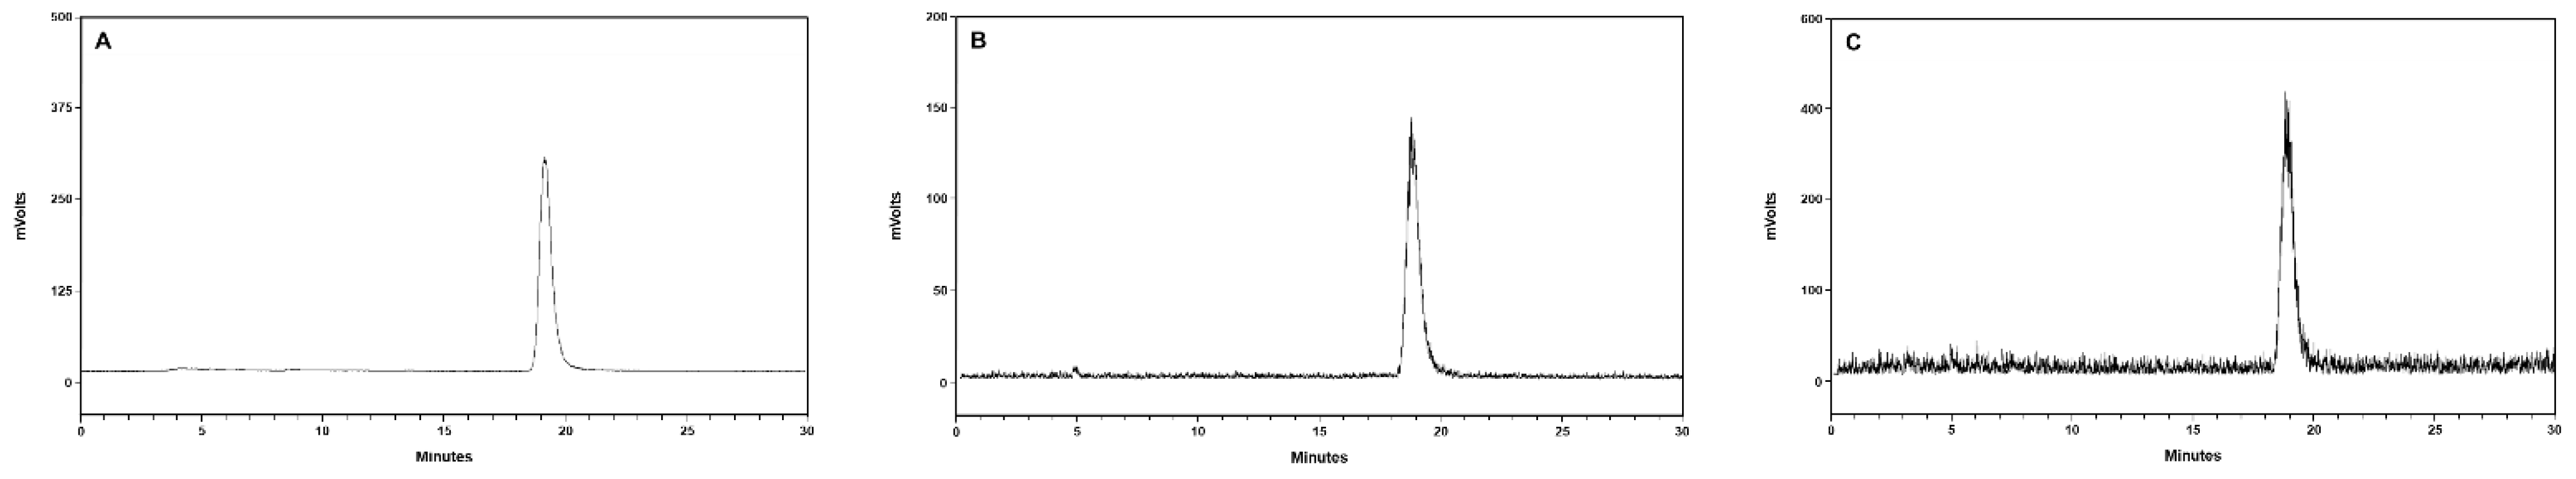
3.6.5. Metabolism
3.7. Statistical Analysis
4. Conclusions
Supplementary Materials
Author Contributions
Funding
Institutional Review Board Statement
Informed Consent Statement
Data Availability Statement
Acknowledgments
Conflicts of Interest
References
- Jessen, K.R.; Mirsky, R. Glial cells in the enteric nervous system contain glial fibrillary acidic protein. Nature 1980, 286, 736–737. [Google Scholar] [CrossRef] [PubMed]
- Hemonnot, A.-L.; Hua, J.; Ulmann, L.; Hirbec, H. Microglia in Alzheimer disease: Well-known targets and new opportunities. Front. Aging Neurosci. 2019, 11, 233. [Google Scholar] [CrossRef] [PubMed]
- Mittelbronn, M.; Dietz, K.; Schluesener, H.J.; Meyermann, R. Local distribution of microglia in the normal adult human central nervous system differs by up to one order of magnitude. Acta Neuropathol. 2001, 101, 249–255. [Google Scholar] [CrossRef]
- Streit, W.J.; Kincaid-Colton, C.A. The brain’s immune system. Sci. Am. 1995, 273, 54–61. [Google Scholar] [CrossRef] [PubMed]
- Webers, A.; Heneka, M.T.; Gleeson, P.A. The role of innate immune responses and neuroinflammation in amyloid accumulation and progression of Alzheimer’s disease. Immunol. Cell Biol. 2020, 98, 28v41. [Google Scholar] [CrossRef] [PubMed]
- Streit, W.J.; Mrak, R.E.; Griffin, W.S.T. Microglia and neuroinflammation: A pathological perspective. J. Neuroinflam. 2004, 1, 14. [Google Scholar] [CrossRef] [PubMed][Green Version]
- Guzman-Martinez, L.; Maccioni, R.B.; Andrade, V.; Navarrete, L.P.; Pastor, M.G.; Ramos-Escobar, N. Neuroinflammation as a common feature of neurodegenerative disorders. Front. Pharmacol. 2019, 10, 1008. [Google Scholar] [CrossRef]
- Heneka, M.T.; Carson, M.J.; Khoury, J.E.; Landreth, G.E.; Brosseron, F.; Feinstein, D.L.; Jacobs, A.H.; Wyss-Coray, T.; Vitorica, J.; Ransohoff, R.M.; et al. Neuroinflammation in Alzheimer’s disease. Lancet Neurol. 2015, 14, 388–405. [Google Scholar] [CrossRef]
- Boche, D.; Gerhard, A.; Rodriguez-Vieitez, E.; on behalf of the MINC Faculty. Prospects and challenges of imaging neuroinflammation beyond TSPO in Alzheimer’s disease. Eur. J. Nucl. Med. Mol. Imaging 2019, 46, 2831–2847. [Google Scholar] [CrossRef]
- Narayanaswami, V.; Dahl, K.; Bernard-Gauthier, V.; Josephson, L.; Cumming, P.; Vasdev, N. Emerging PET radiotracers and targets for imaging of neuroinflammation in neurodegenerative diseases: Outlook beyond TSPO. Mol. Imaging 2018, 17, 1536012118792317. [Google Scholar] [CrossRef]
- Jain, P.; Chaney, A.M.; Carlson, M.L.; Jackson, I.M.; Rao, A.; James, M.J. Neuroinflammation PET imaging: Current opinion and future directions. J. Nucl. Med. 2020, 61, 1107–1112. [Google Scholar] [CrossRef]
- Tournier, B.B.; Tsartsalis, S.; Ceyzériat, K.; Garibotto, V.; Millet, P. In vivo TSPO signal and neuroinflammation in Alzheimer’s disease. Cells 2020, 9, 1941. [Google Scholar] [CrossRef] [PubMed]
- Kreisl, W.C.; Kim, M.J.; Coughlin, J.M.; Henter, I.D.; Owen, D.R.; Innis, R.B. PET imaging of neuroinflammation in neurological disorders. Lancet 2020, 19, 940–950. [Google Scholar] [CrossRef]
- Janssen, B.; Mach, R.H. Development of Brain PET Imaging Agents: Strategies for Imaging Neuroinflammation in Alzheimer’s Disease. In Progress in Molecular Biology and Translational Science; Becker, J.T., Cohen, A.D., Eds.; Academic Press: Amsterdam, The Netherlands, 2019; Volume 165, pp. 371–399. [Google Scholar]
- Werry, E.L.; Bright, F.M.; Piguet, O.; Ittner, L.M.; Halliday, G.M.; Hodges, J.R.; Kiernan, M.C.; Loy, C.T.; Kril, J.J.; Kassiou, M. Recent developments in TSPO PET imaging as a biomarker of neuroinflammation in neurodegenerative disorders. Int. J. Mol. Sci. 2019, 20, 3161. [Google Scholar] [CrossRef] [PubMed]
- Kumari, A.; Silakari, O.; Singh, R.K. Recent advances in colony stimulating factor-1 receptor/c-FMS as an emerging target for various therapeutic implications. Biomed. Pharmacother. 2018, 103, 662–679. [Google Scholar] [CrossRef]
- Lin, H.; Lee, E.; Hestir, K.; Leo, C.; Huang, M.; Bosch, E.; Halenbeck, R.; Wu, G.; Zhou, A.; Behrens, D.; et al. Discovery of a cytokine and its receptor by functional screening of the extracellular proteome. Science 2008, 320, 807–811. [Google Scholar] [CrossRef]
- Horti, A.G.; Naik, R.; Foss, C.A.; Minn, I.; Misheneva, V.; Du, Y.; Wang, Y.; Mathews, W.B.; Wu, Y.; Hall, A.; et al. PET Imaging of microglia by targeting macrophage colony-stimulating factor 1 receptor (CSF1R). Proc. Natl. Acad. Sci. USA 2019, 116, 1686–1691. [Google Scholar] [CrossRef]
- Muñoz-Garcia, J.; Cochonneau, D.; Télétchéa, S.; Moranton, E.; Lanoe, D.; Brion, R.; Lézot, F.; Heymann, M.-F.; Heymann, D. The twin cytokines interleukin-34 and CSF-1: Masterful conductors of macrophage homeostasis. Theranostics 2021, 11, 1568–1593. [Google Scholar] [CrossRef]
- Chitu, V.; Gokhan, S.; Nandi, S.; Mehler, M.F.; Stanley, E.R. Emerging roles for CSF-1 receptor and its ligands in the nervous system. Trends Neurosci. 2016, 39, 378–393. [Google Scholar] [CrossRef]
- Sarlus, H.; Heneka, M.T. Microglia in Alzheimer’s disease. J. Clin. Investig. 2017, 127, 3240–3249. [Google Scholar] [CrossRef]
- Murphy, G.M., Jr.; Zhao, F.; Yang, L.; Cordell, B. Expression of macrophage colony-stimulating factor receptor is increased in the AβPPV717F transgenic mouse model of Alzheimer’s disease. Am. J. Pathol. 2000, 157, 895–904. [Google Scholar] [CrossRef]
- Akiyama, H.; Nishimura, T.; Kondo, H.; Ikeda, K.; Hayashi, Y.; McGeer, P.L. Expression of the receptor for macrophage colony stimulating factor by brain microglia and its upregulation in brains of patients with Alzheimer’s disease and amyotrophic lateral sclerosis. Brain Res. 1994, 639, 171–174. [Google Scholar] [CrossRef]
- Bernard-Gauthier, V.; Schirrmacher, R. 5-(4-((4-[18F]Fluorobenzyl)oxy)-3-methoxybenzyl) pyrimidine-2,4-diamine: A selective dual inhibitor for potential PET imaging of Trk/CSF-1R. Bioorg. Med. Chem. Lett. 2014, 24, 4784–4790. [Google Scholar] [CrossRef]
- Singleton, T.A.; Bdair, H.; Bailey, J.J.; Choi, S.; Aliaga, A.; Rosa-Neto, P.; Schirrmacher, R.; Bernard-Gauthier, V.; Kostikov, A. Efficient radiosynthesis and preclinical evaluation of [18F]FOMPyD as a positron emission tomography tracer candidate for TrkB/C receptor imaging. J. Label. Compd. Radiopharm. 2020, 63, 144–150. [Google Scholar] [CrossRef]
- Zhou, X.; Ji, B.; Seki, C.; Nagai, Y.; Minamimoto, T.; Fujinaga, M.; Zhang, M.R.; Saito, T.; Saido, T.C.; Suhara, T.; et al. PET imaging of colony-stimulating factor 1 receptor: A head-to-head comparison of a novel radioligand, 11 C-GW2580, and 11 C-CPPC, in mouse models of acute and chronic neuroinflammation and a rhesus monkey. J. Cereb. Blood Flow Metab. 2021, 41, 2410–2422. [Google Scholar] [CrossRef] [PubMed]
- Tanzey, S.S.; Shao, X.; Stauff, J.; Arteaga, J.; Sherman, P.; Scott, P.J.H.; Mossine, A.V. Synthesis and initial in vivo evaluation of [11C]AZ683—a novel PET radiotracer for colony stimulating factor 1 receptor (CSF1R). Pharmaceuticals 2018, 11, 136. [Google Scholar] [CrossRef] [PubMed]
- van der Wildt, B.; Miao, Z.; Reyes, S.T.; Park, J.H.; Klockow, J.L.; Zhao, N.; Romero, A.; Guo, S.G.; Shen, B.; Windhorst, A.D.; et al. BLZ945 derivatives for PET imaging of colony stimulating factor-1 receptors in the brain. Nucl. Med. Biol. 2021, 100, 44–51. [Google Scholar] [CrossRef] [PubMed]
- Mathews, W.B.; Wu, Y.; Horti, A.G.; Naik, R.; Hall, A.W.; Holt, D.P.; Dannals, R.F. Radiosynthesis and validation of [5-cyano-N-(4-(4-[11C]methylpiperazin-1-yl)-2-(piperidin-1-yl)-phenyl)furan-2-carboxamide] ([11C]CPPC), a PET radiotracer for imaging CSF1R, a microglia-specific marker. J. Label. Compd. Radiopharm. 2019, 62, 903–908. [Google Scholar] [CrossRef]
- Illig, C.R.; Chen, J.; Wall, M.J.; Wilson, K.J.; Ballentine, S.K.; Rudolph, M.J.; DesJarlais, R.L.; Chen, Y.; Schubert, C.; Petrounia, I.; et al. Discovery of novel FMS kinase inhibitors as anti-inflammatory agents. Bioorg. Med. Chem. Lett. 2008, 18, 1642–1648. [Google Scholar] [CrossRef]
- Peng, Z.; Maxwell, D.S.; Sun, D.; Basvoju, A.; Prasad, B.; Pal, A.; Wang, S.; Balatoni, J.; Ghosh, P.; Lim, S.T.; et al. Imatinib analogs as potential agents for PET imaging of Bcr-Abl and c-KIT expression at a kinase level. Bioorg. Med. Chem. 2014, 1, 623–632. [Google Scholar] [CrossRef]
- Vazquez, N.; Missault, S.; Vangestel, C.; Deleye, S.; Thomae, D.; Van der Veken, P.; Augustyns, K.; Staelens, S.; Dedeurwaerdere, S.; Wyffels, L. Evaluation of [18F]BR420 and [18F]BR351 as radiotracers for MMP-9 imaging in colorectal cancer. J. Label. Compd. Radiopharm. 2017, 60, 69–79. [Google Scholar] [CrossRef]
- Kniess, T.; Laube, M.; Brust, P.; Steinbach, J. 2-[18F]Fluoroethyl tosylate – a versatile tool for building 18F-based radiotracers for positron emission tomography. Med. Chem. Commun. 2015, 6, 1714–1754. [Google Scholar] [CrossRef]
- Bauman, A.; Piel, M.; Schirrmacher, R.; Rösch, F. Efficient alkali iodide promoted 18F-fluoroethylations with 2-[18F]fluoroethyl tosylate and 1-bromo-2-[18F]fluoroethane. Tetrahedron Lett. 2003, 44, 9165–9167. [Google Scholar] [CrossRef]
- Kim, H.; Choe, Y.S. High-yield synthesis of a tau PET radioligand and its nonradioactive ligand using an alternative protection and deprotection strategy. J. Label. Compd. Radiopharm. 2021, 64, 150–158. [Google Scholar] [CrossRef] [PubMed]
- Qin, L.; Wu, X.; Block, M.L.; Liu, Y.; Breese, G.R.; Hong, J.S.; Knapp, D.J.; Crews, F.T. Systemic LPS causes chronic neuroinflammation and progressive neurodegeneration. Glia 2007, 55, 453–462. [Google Scholar] [CrossRef] [PubMed]
- Nandi, S.; Gokhan, S.; Dai, X.-M.; Wei, S.; Enikolopov, G.; Lin, H.; Mehler, M.F.; Stanley, E.R. The CSF-1 receptor ligands IL-34 and CSF-1 exhibit distinct developmental brain expression patterns and regulate neural progenitor cell maintenance and maturation. Dev. Biol. 2012, 367, 100–113. [Google Scholar] [CrossRef] [PubMed]
- Knight, A.C.; Varlow, C.; Zi, T.; Liang, S.H.; Josephson, L.; Schmidt, K.; Patel, S.; Vasdev, N. In vitro evaluation of [3H]CPPC as a tool radioligand for CSF-1R. ACS Chem. Neurosci. 2021, 12, 998–1006. [Google Scholar] [CrossRef] [PubMed]
- Piel, M.; Schirrmacher, R.; Höhnemann, S.; Hamkens, W.; Kohl, B.; Jansen, M.; Schmitt, U.; Lüddens, H.; Dannhardt, G.; Rösch, F. Synthesis and evaluation of 5,7-dichloro-4-(3-{4-[4-(2-[18F]fluoroethyl)-piperazin-1-yl]-phenyl}-ureido)-1,2,3,4-tetrahydroquinoline-2-carboxylic acid as a potential NMDA ligand to study glutamatergic neurotransmission in vivo. J. Label. Compd. Radiopharm. 2003, 46, 645–659. [Google Scholar] [CrossRef]
- Veach, D.R.; Namavari, M.; Pillarsetty, N.; Santos, E.B.; Beresten-Kochetkov, T.; Lambek, C.; Punzalan, B.J.; Antczak, C.; Smith-Jones, P.M.; Djaballah, H.; et al. Synthesis and biological evaluation of a fluorine-18 derivative of dasatinib. J. Med. Chem. 2007, 50, 5853–5857. [Google Scholar] [CrossRef]
- Breyholz, H.-J.; Wagner, S.; Faust, A.; Riemann, B.; Höltke, C.; Hermann, S.; Schober, O.; Schäfers, M.; Kopka, K. Radiofluorinated pyrimidine-2,4,6-triones as molecular probes for noninvasive MMP-targeted imaging. ChemMedChem 2010, 5, 777–789. [Google Scholar] [CrossRef]


| Ligand | IC50 (nM) |
|---|---|
| CPPC | 1.56 ± 0.08 |
| 1 | 3.42 ± 0.33 |
| Control | LPS | LPS+block | |
|---|---|---|---|
| blood | 0.93 ± 0.05 | 1.21 ± 0.11 | 1.30 ± 0.11 |
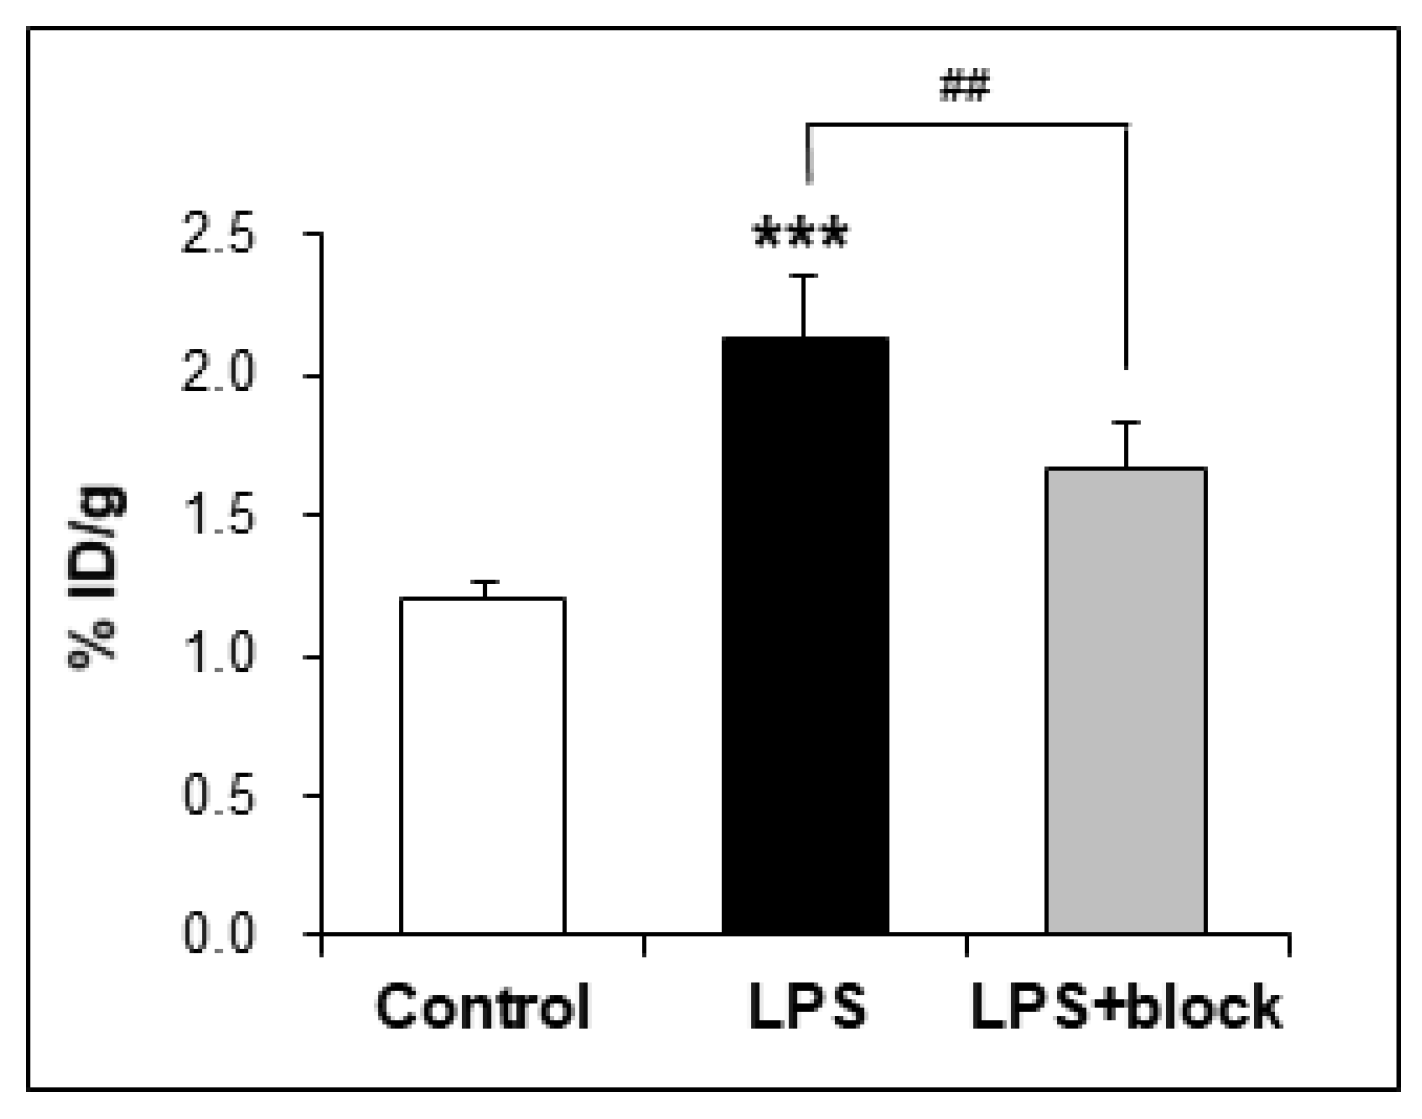
| brain | 1.20 ± 0.06 | 2.14 ± 0.19 | 1.67 ± 0.16 |
| muscle | 0.96 ± 0.10 | 1.03 ± 0.07 | 1.20 ± 0.19 |
| femur | 1.80 ± 0.09 | 1.95 ± 0.44 | 2.11 ± 0.37 |
| liver | 6.87 ± 0.48 | 6.04 ± 0.91 | 3.15 ± 0.62 |
| spleen | 1.58 ± 0.20 | 2.47 ± 0.19 | 1.45 ± 0.13 |
| kidney | 1.97 ± 0.05 | 2.23 ± 0.08 | 2.04 ± 0.10 |
Publisher’s Note: MDPI stays neutral with regard to jurisdictional claims in published maps and institutional affiliations. |
© 2022 by the authors. Licensee MDPI, Basel, Switzerland. This article is an open access article distributed under the terms and conditions of the Creative Commons Attribution (CC BY) license (https://creativecommons.org/licenses/by/4.0/).
Share and Cite
Lee, H.; Park, J.-H.; Kim, H.; Woo, S.-k.; Choi, J.Y.; Lee, K.-H.; Choe, Y.S. Synthesis and Evaluation of a 18F-Labeled Ligand for PET Imaging of Colony-Stimulating Factor 1 Receptor. Pharmaceuticals 2022, 15, 276. https://doi.org/10.3390/ph15030276
Lee H, Park J-H, Kim H, Woo S-k, Choi JY, Lee K-H, Choe YS. Synthesis and Evaluation of a 18F-Labeled Ligand for PET Imaging of Colony-Stimulating Factor 1 Receptor. Pharmaceuticals. 2022; 15(3):276. https://doi.org/10.3390/ph15030276
Chicago/Turabian StyleLee, Hyeokjin, Ji-Hun Park, Hyunjung Kim, Sang-keun Woo, Joon Young Choi, Kyung-Han Lee, and Yearn Seong Choe. 2022. "Synthesis and Evaluation of a 18F-Labeled Ligand for PET Imaging of Colony-Stimulating Factor 1 Receptor" Pharmaceuticals 15, no. 3: 276. https://doi.org/10.3390/ph15030276
APA StyleLee, H., Park, J.-H., Kim, H., Woo, S.-k., Choi, J. Y., Lee, K.-H., & Choe, Y. S. (2022). Synthesis and Evaluation of a 18F-Labeled Ligand for PET Imaging of Colony-Stimulating Factor 1 Receptor. Pharmaceuticals, 15(3), 276. https://doi.org/10.3390/ph15030276