
Synergistic Adverse Effects of Azithromycin and Hydroxychloroquine on Human Cardiomyocytes at a Clinically Relevant Treatment Duration

 , , and
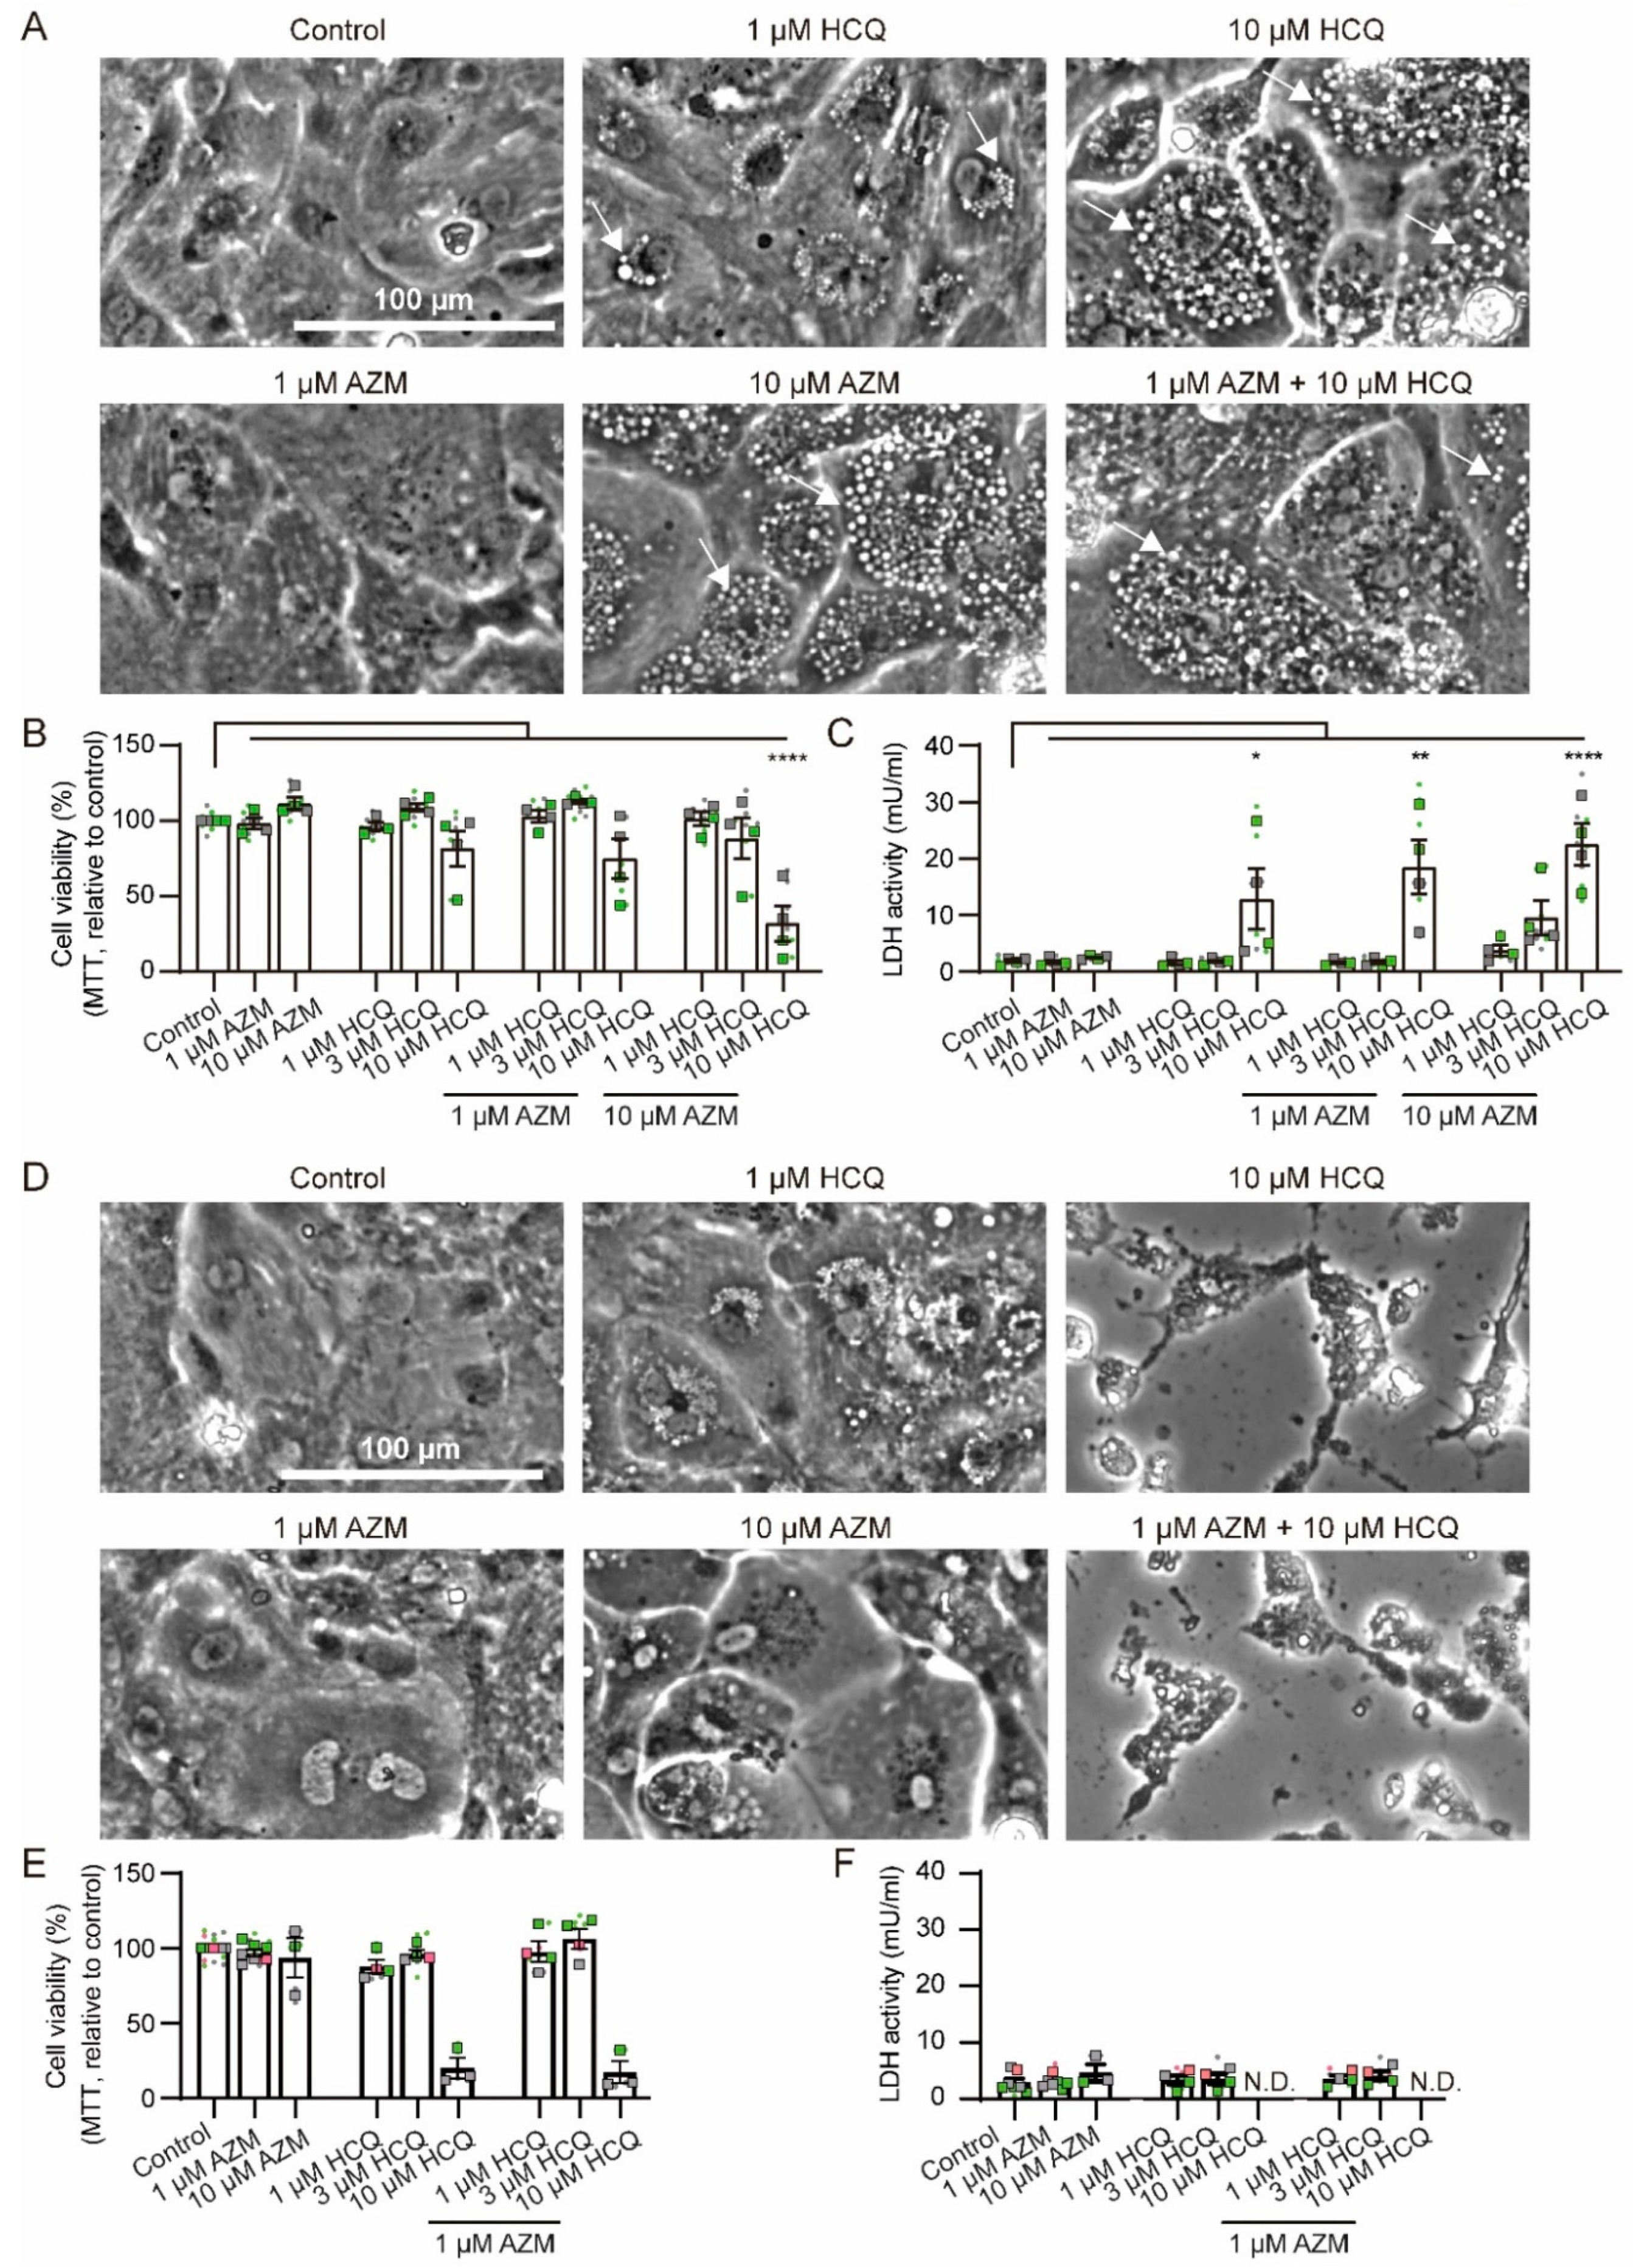
Abstract
:1. Introduction
2. Results
2.1. Effects of HCQ and AZM on Cell Morphology and Viability
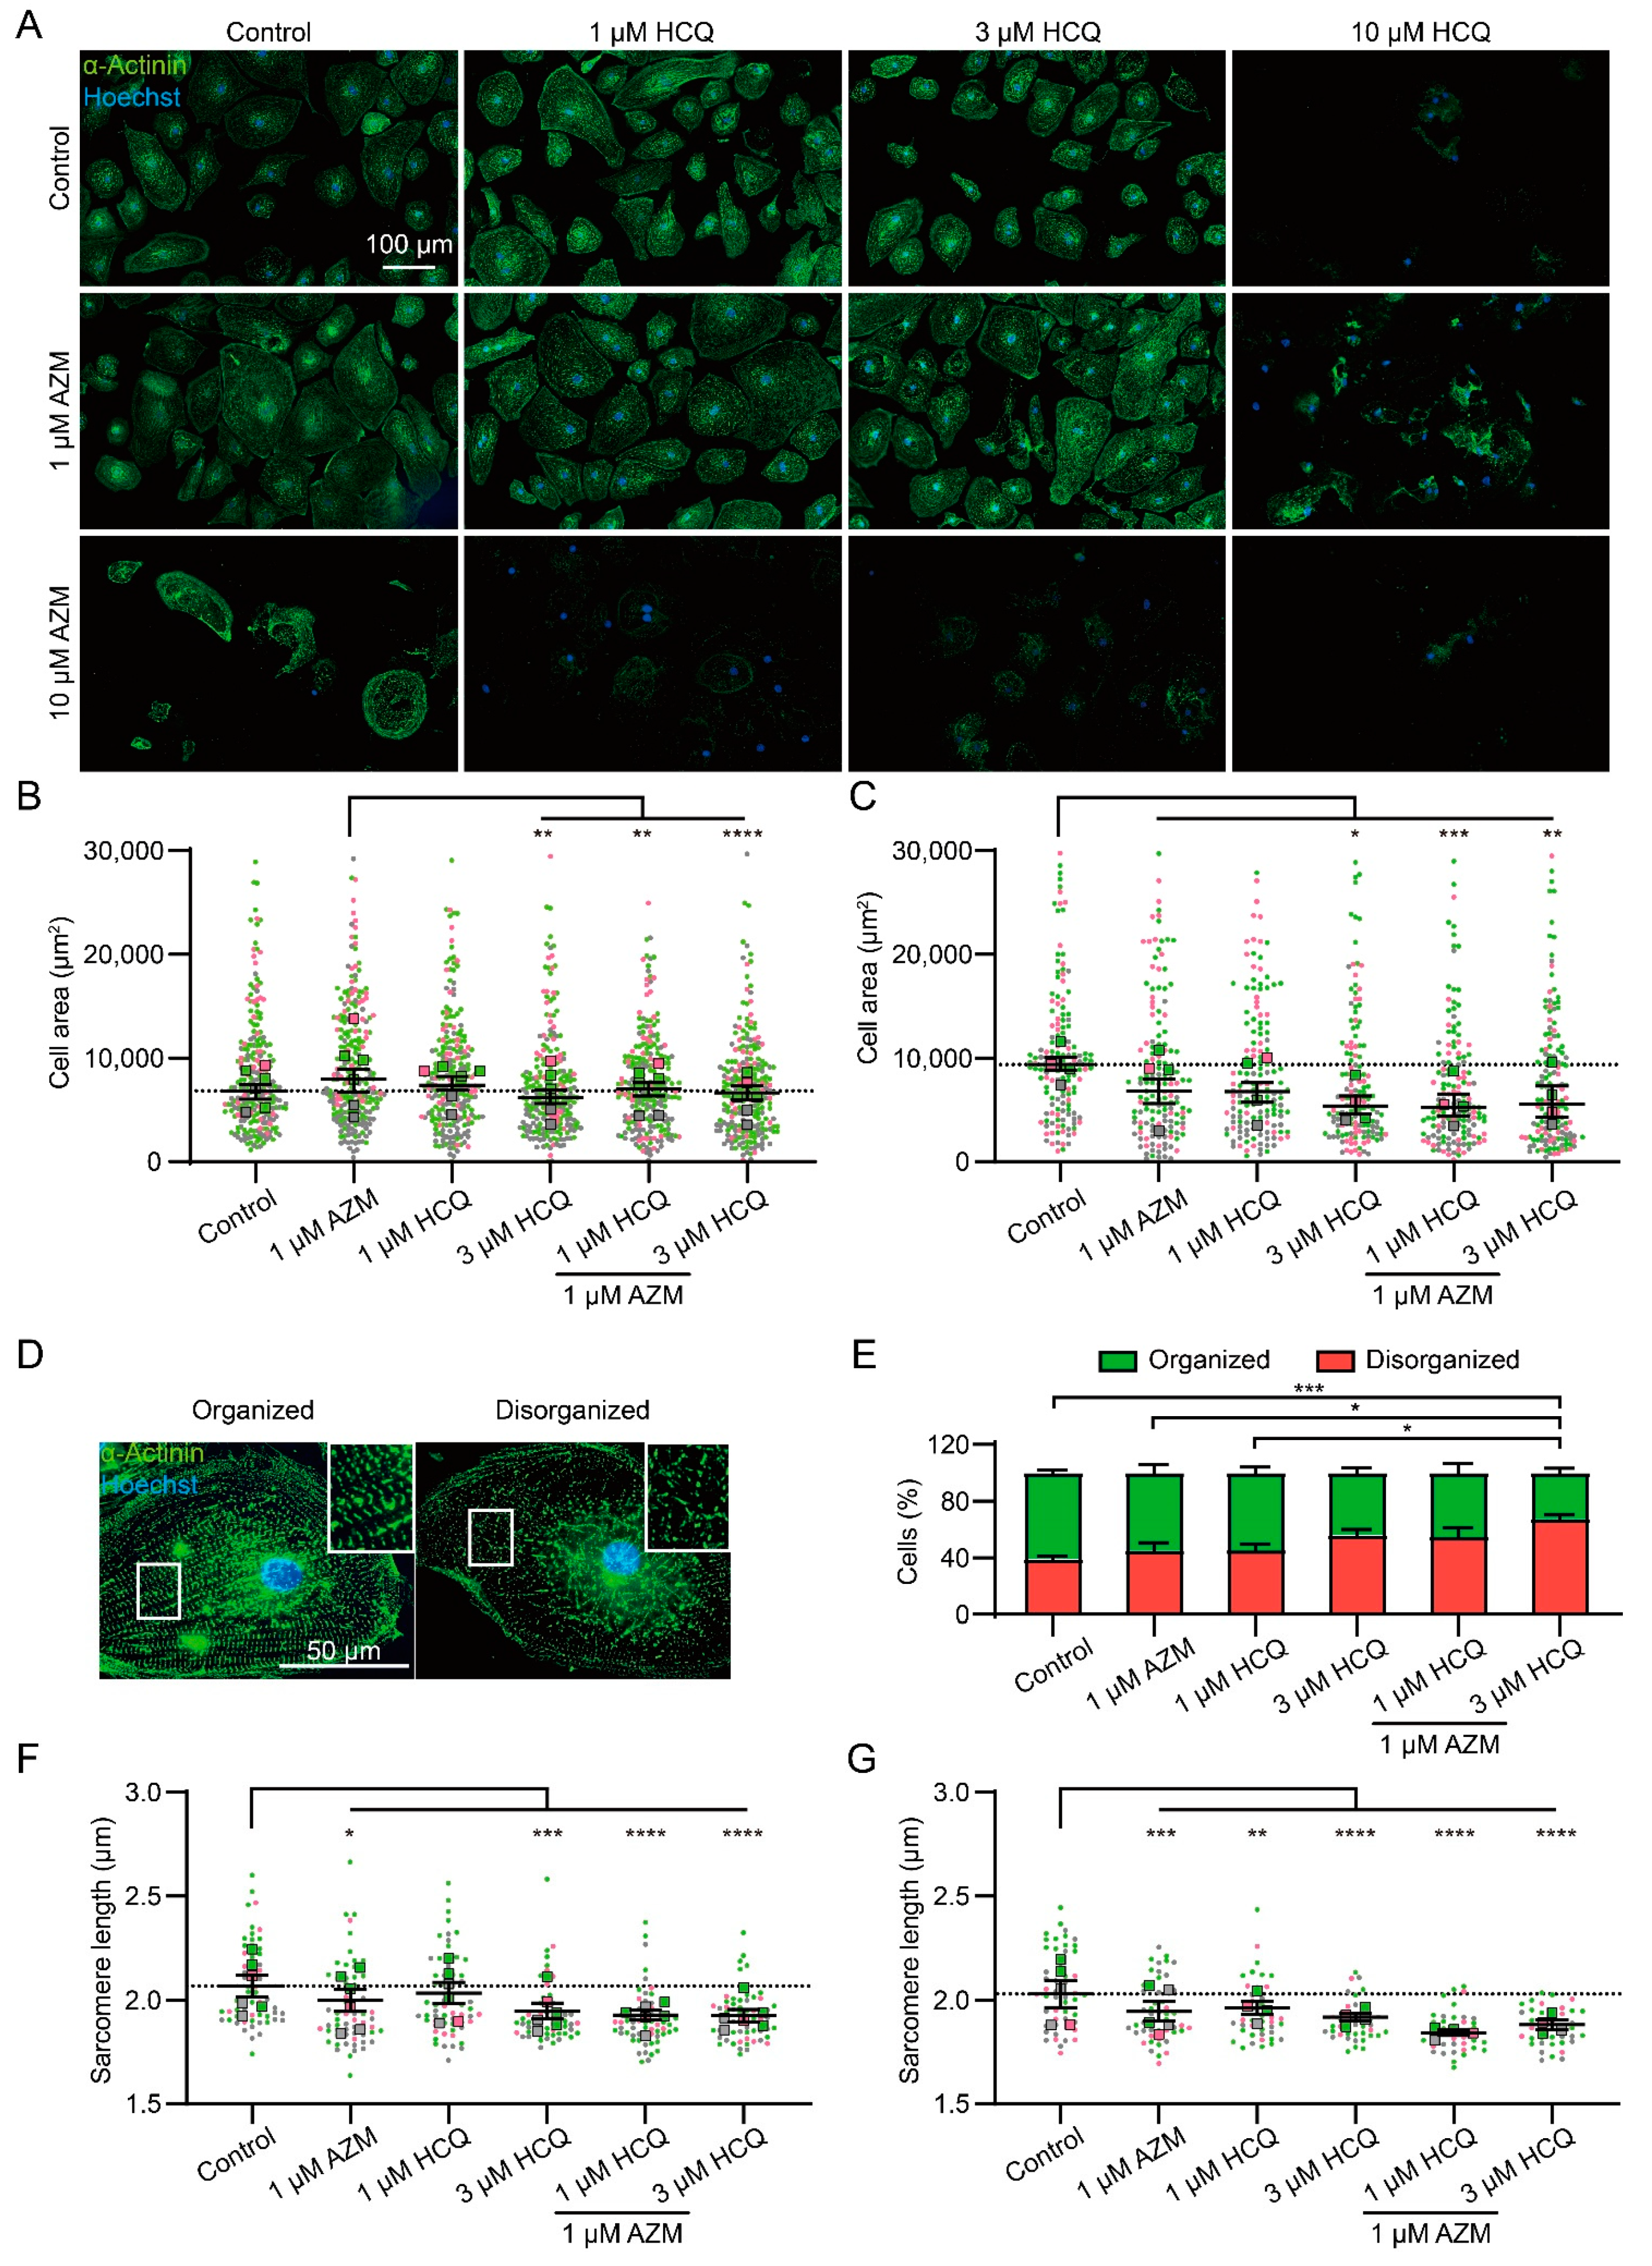
2.2. HCQ and AZM Affect the Structural Organization of iPSC-CMs
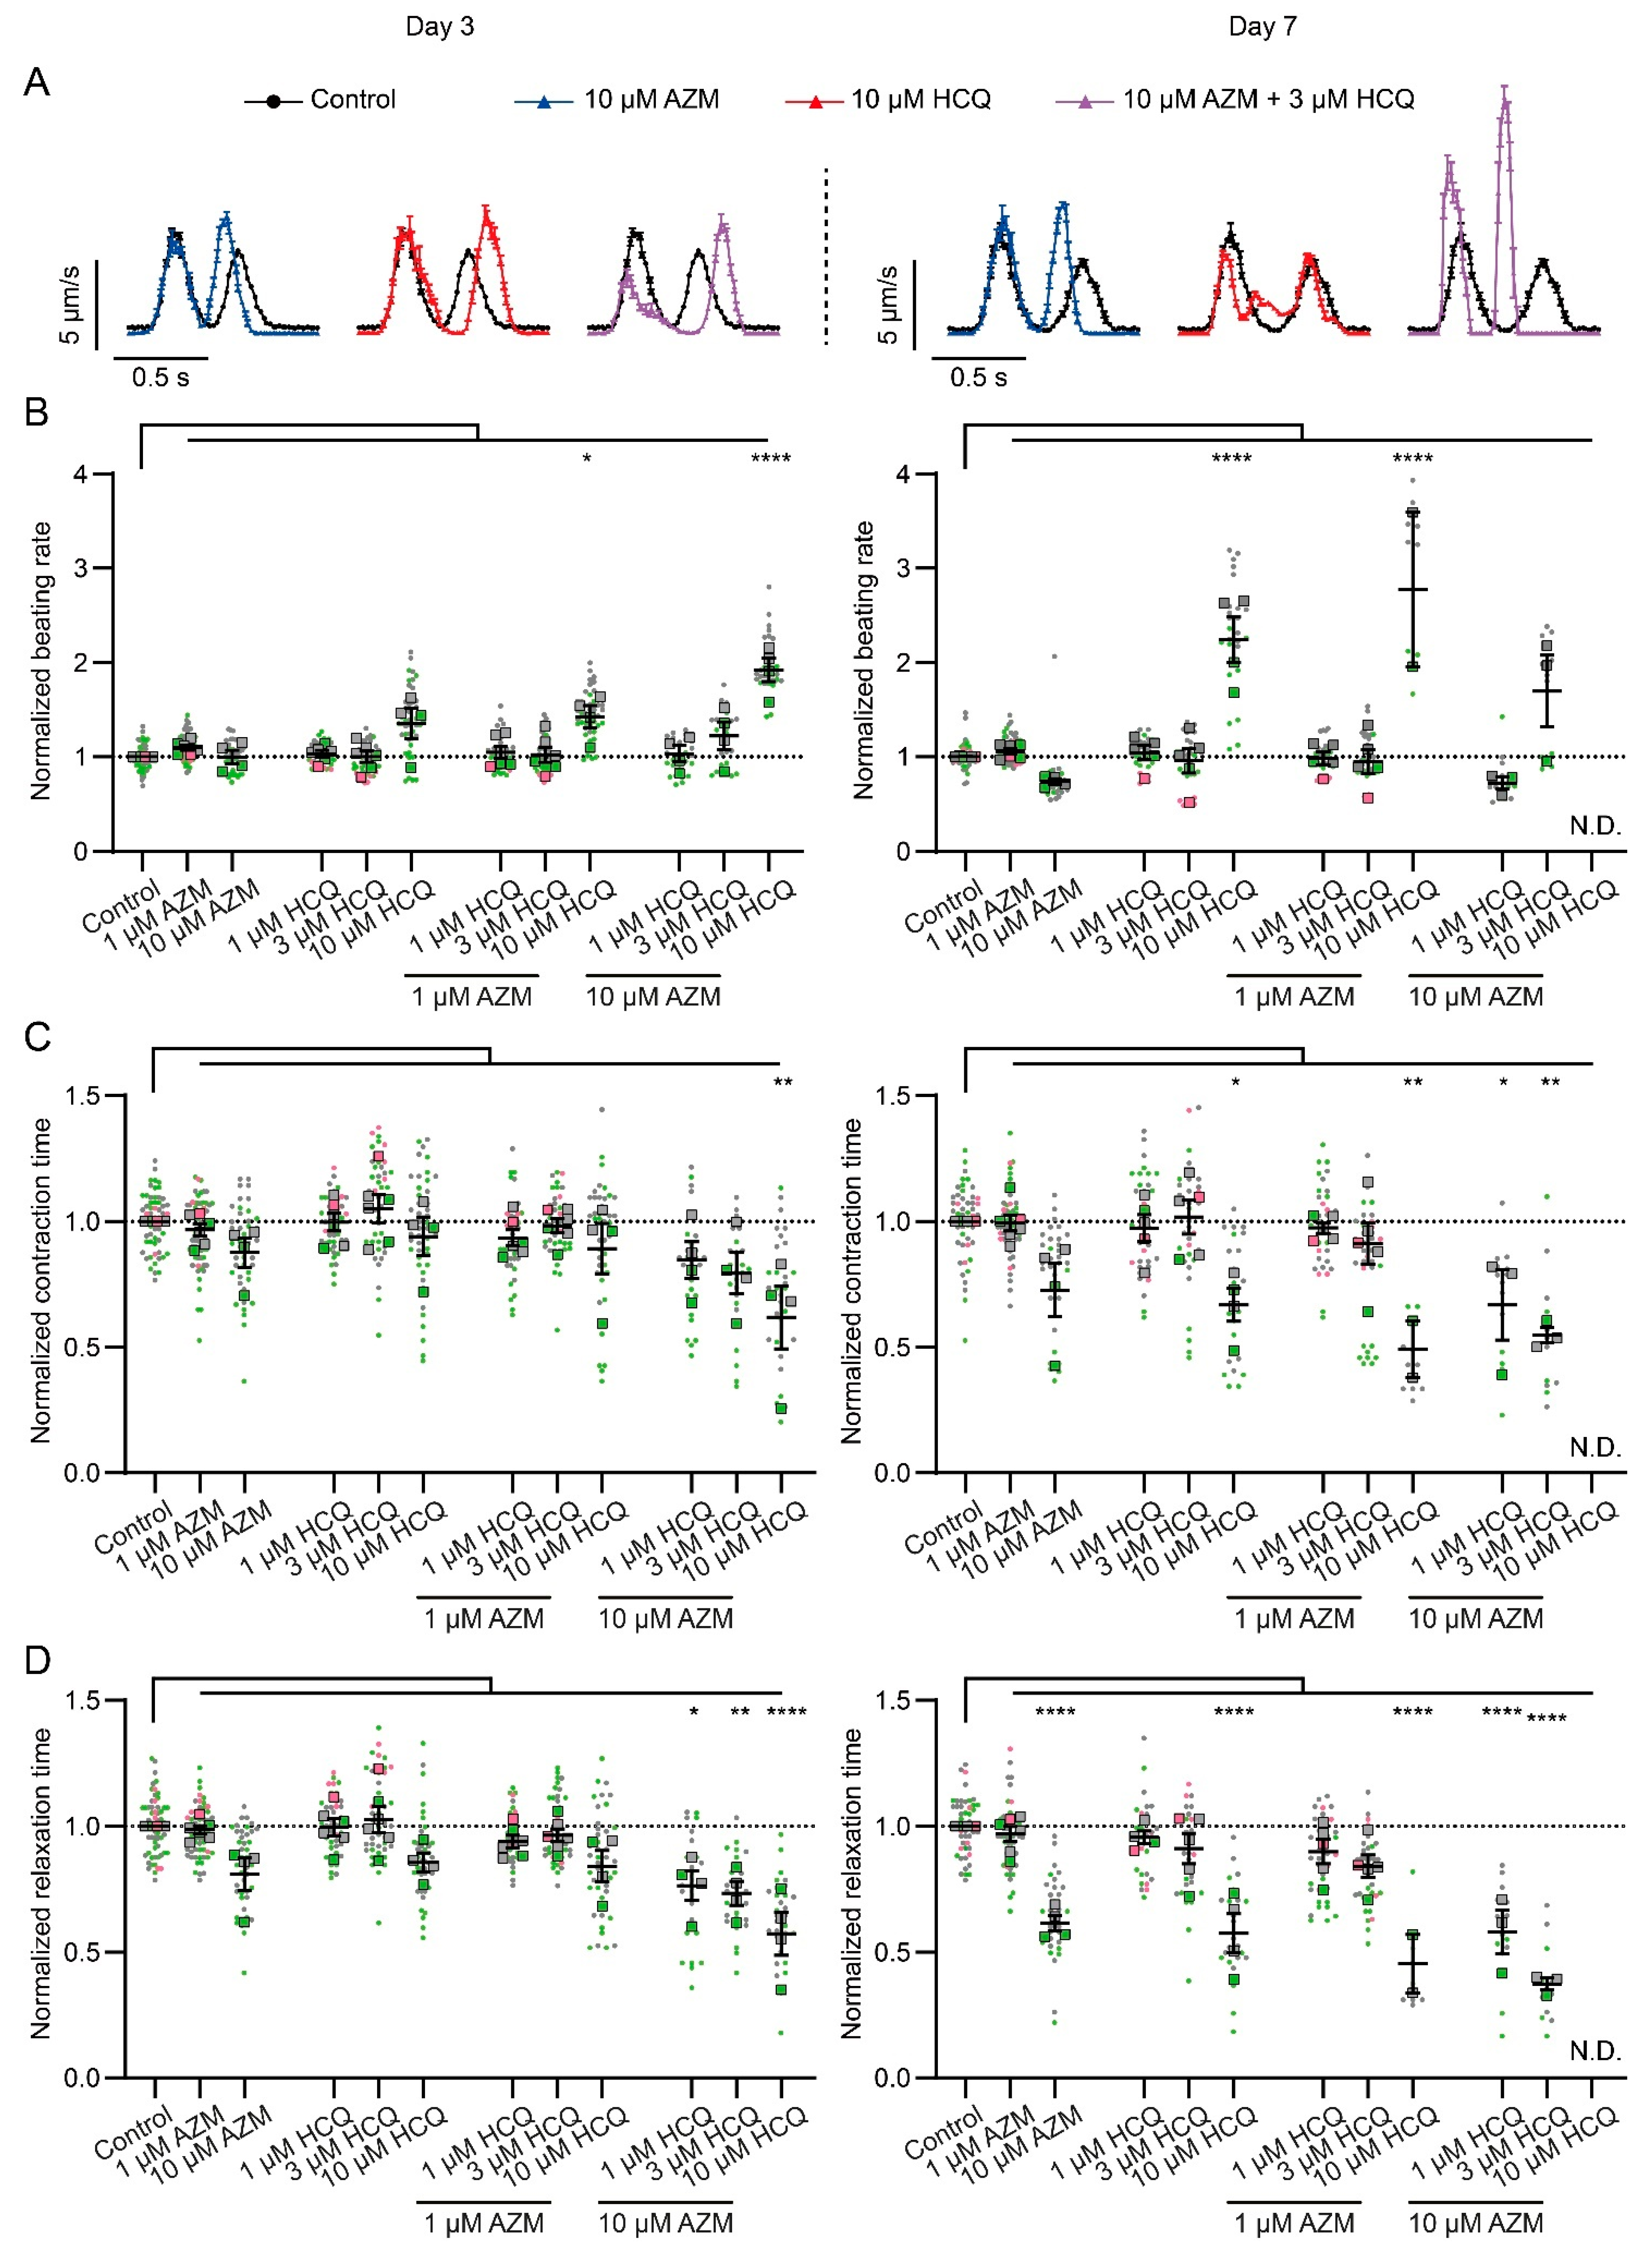
2.3. HCQ and AZM Alter the Contractility of iPSC-CMs
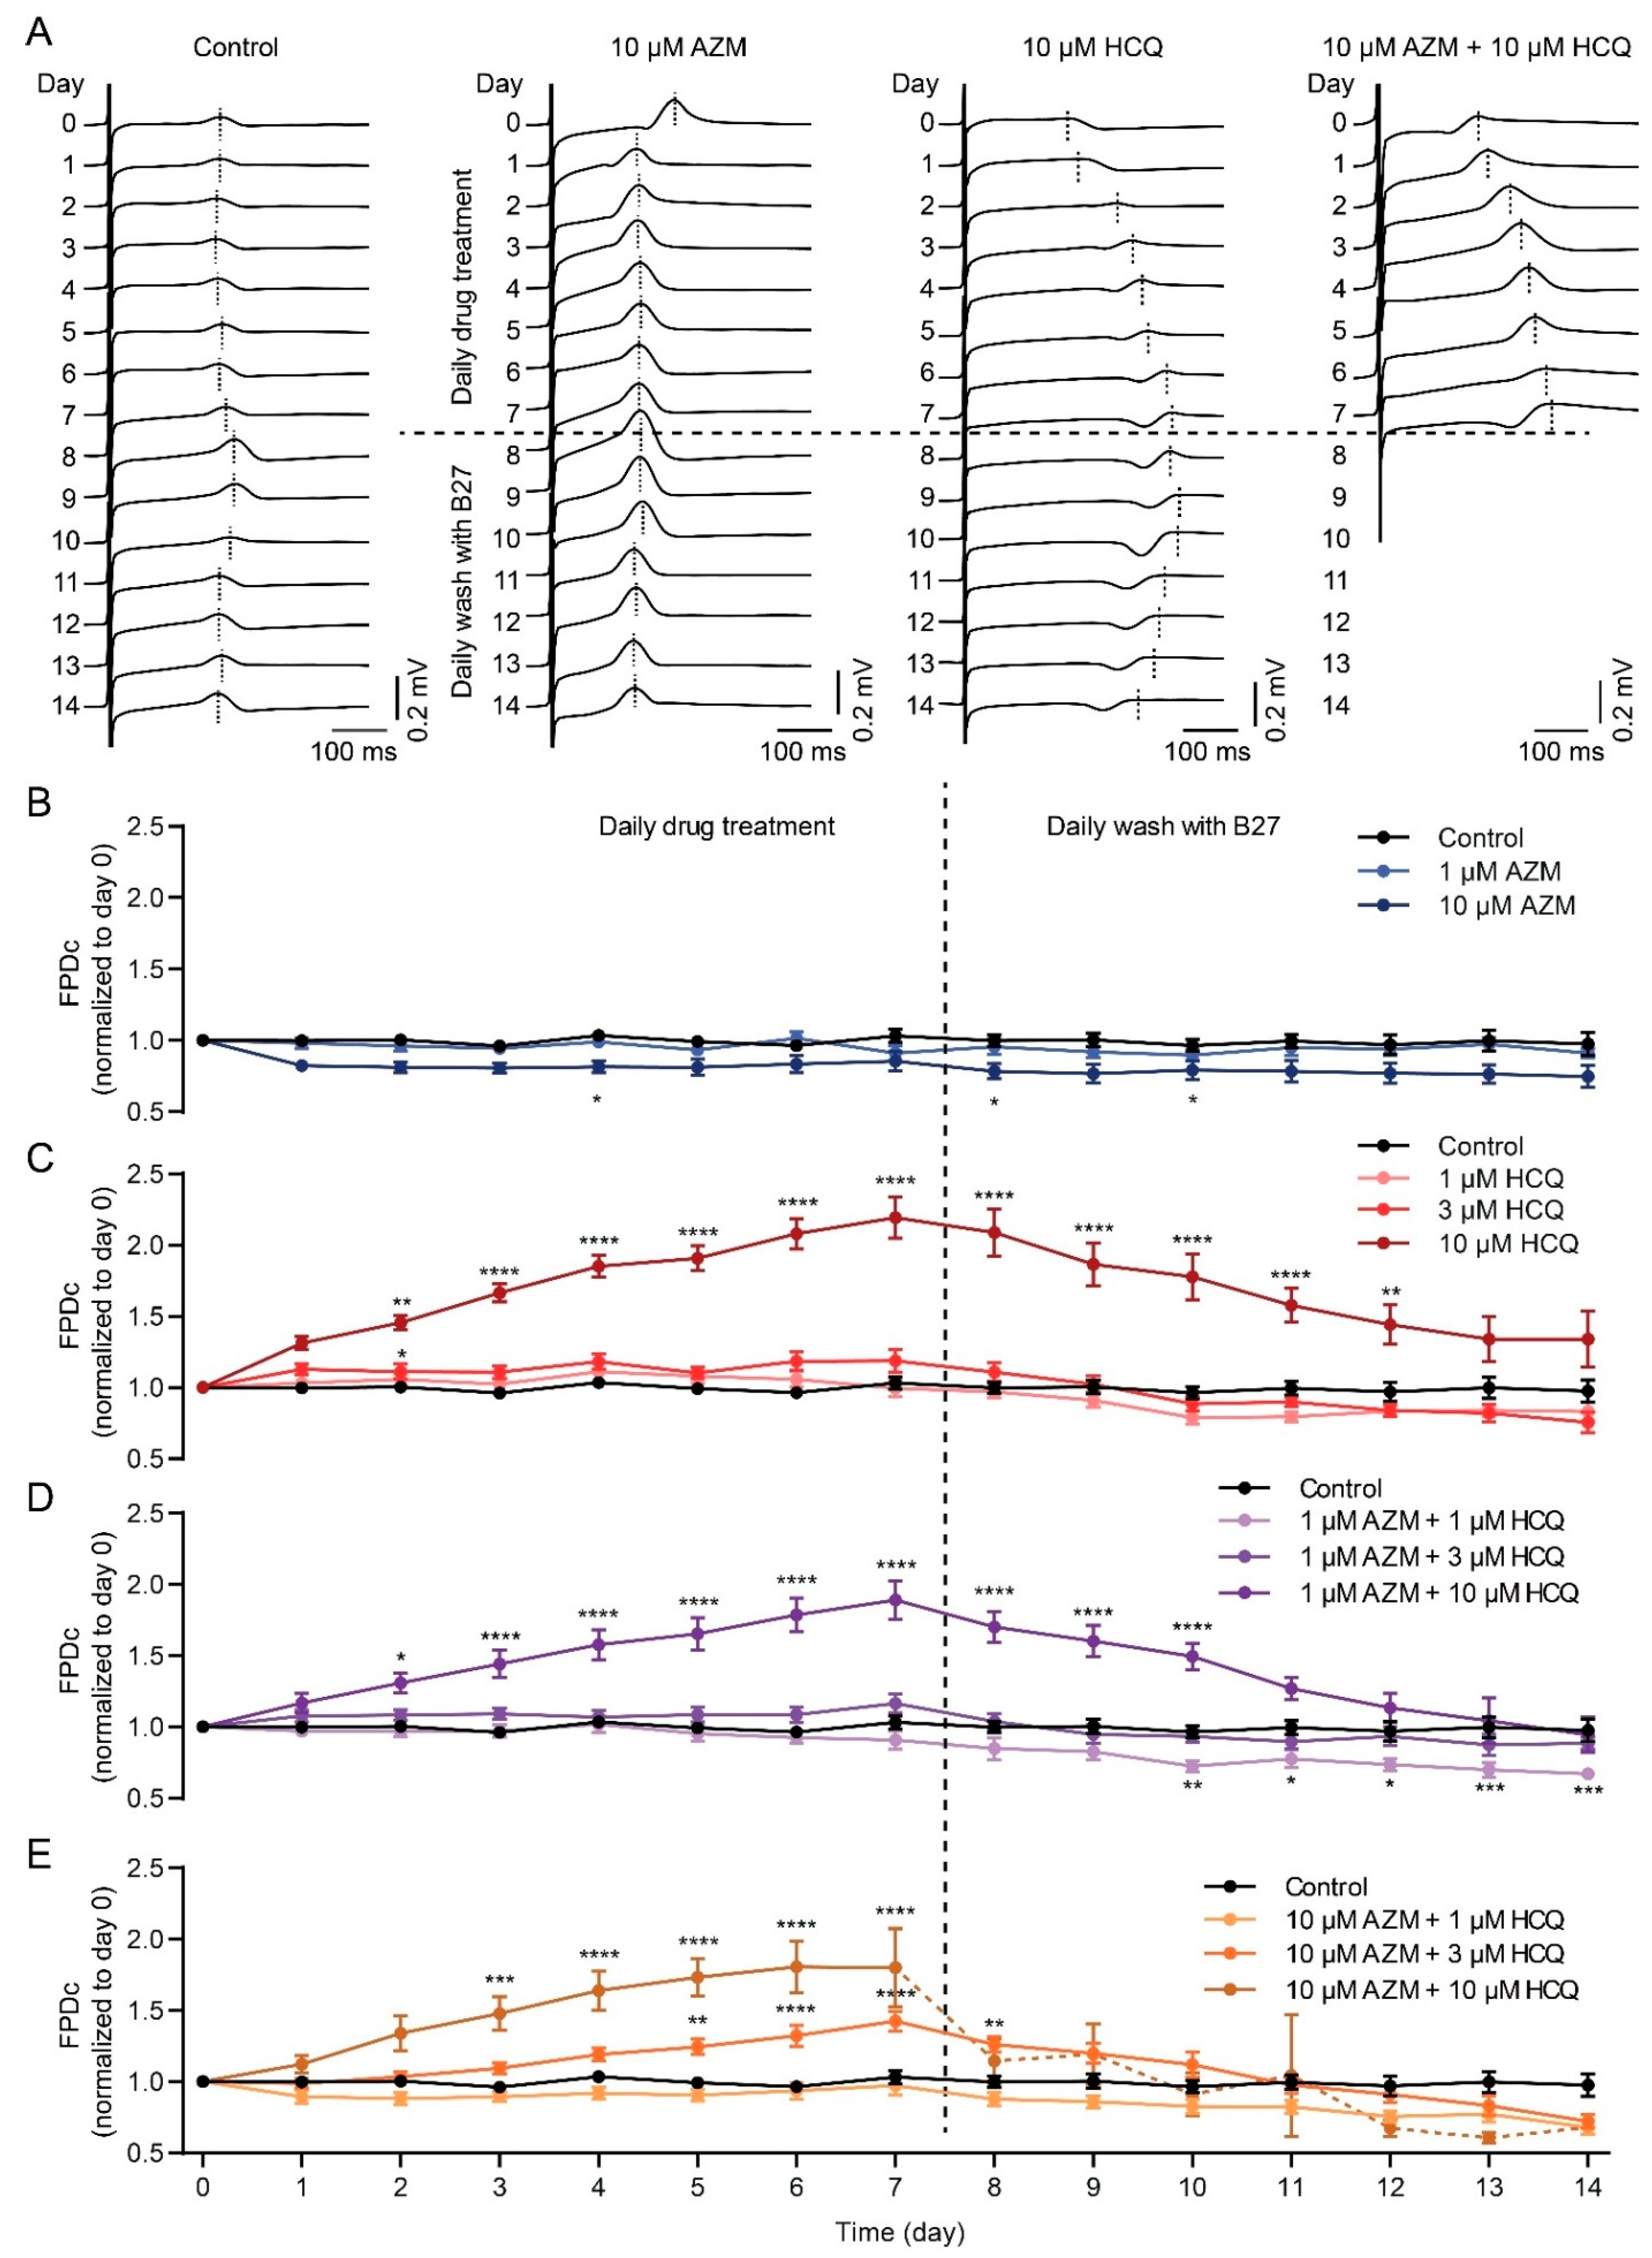
2.4. HCQ and AZM Lead to the Prolongation of Field Potential Duration in iPSC-CMs
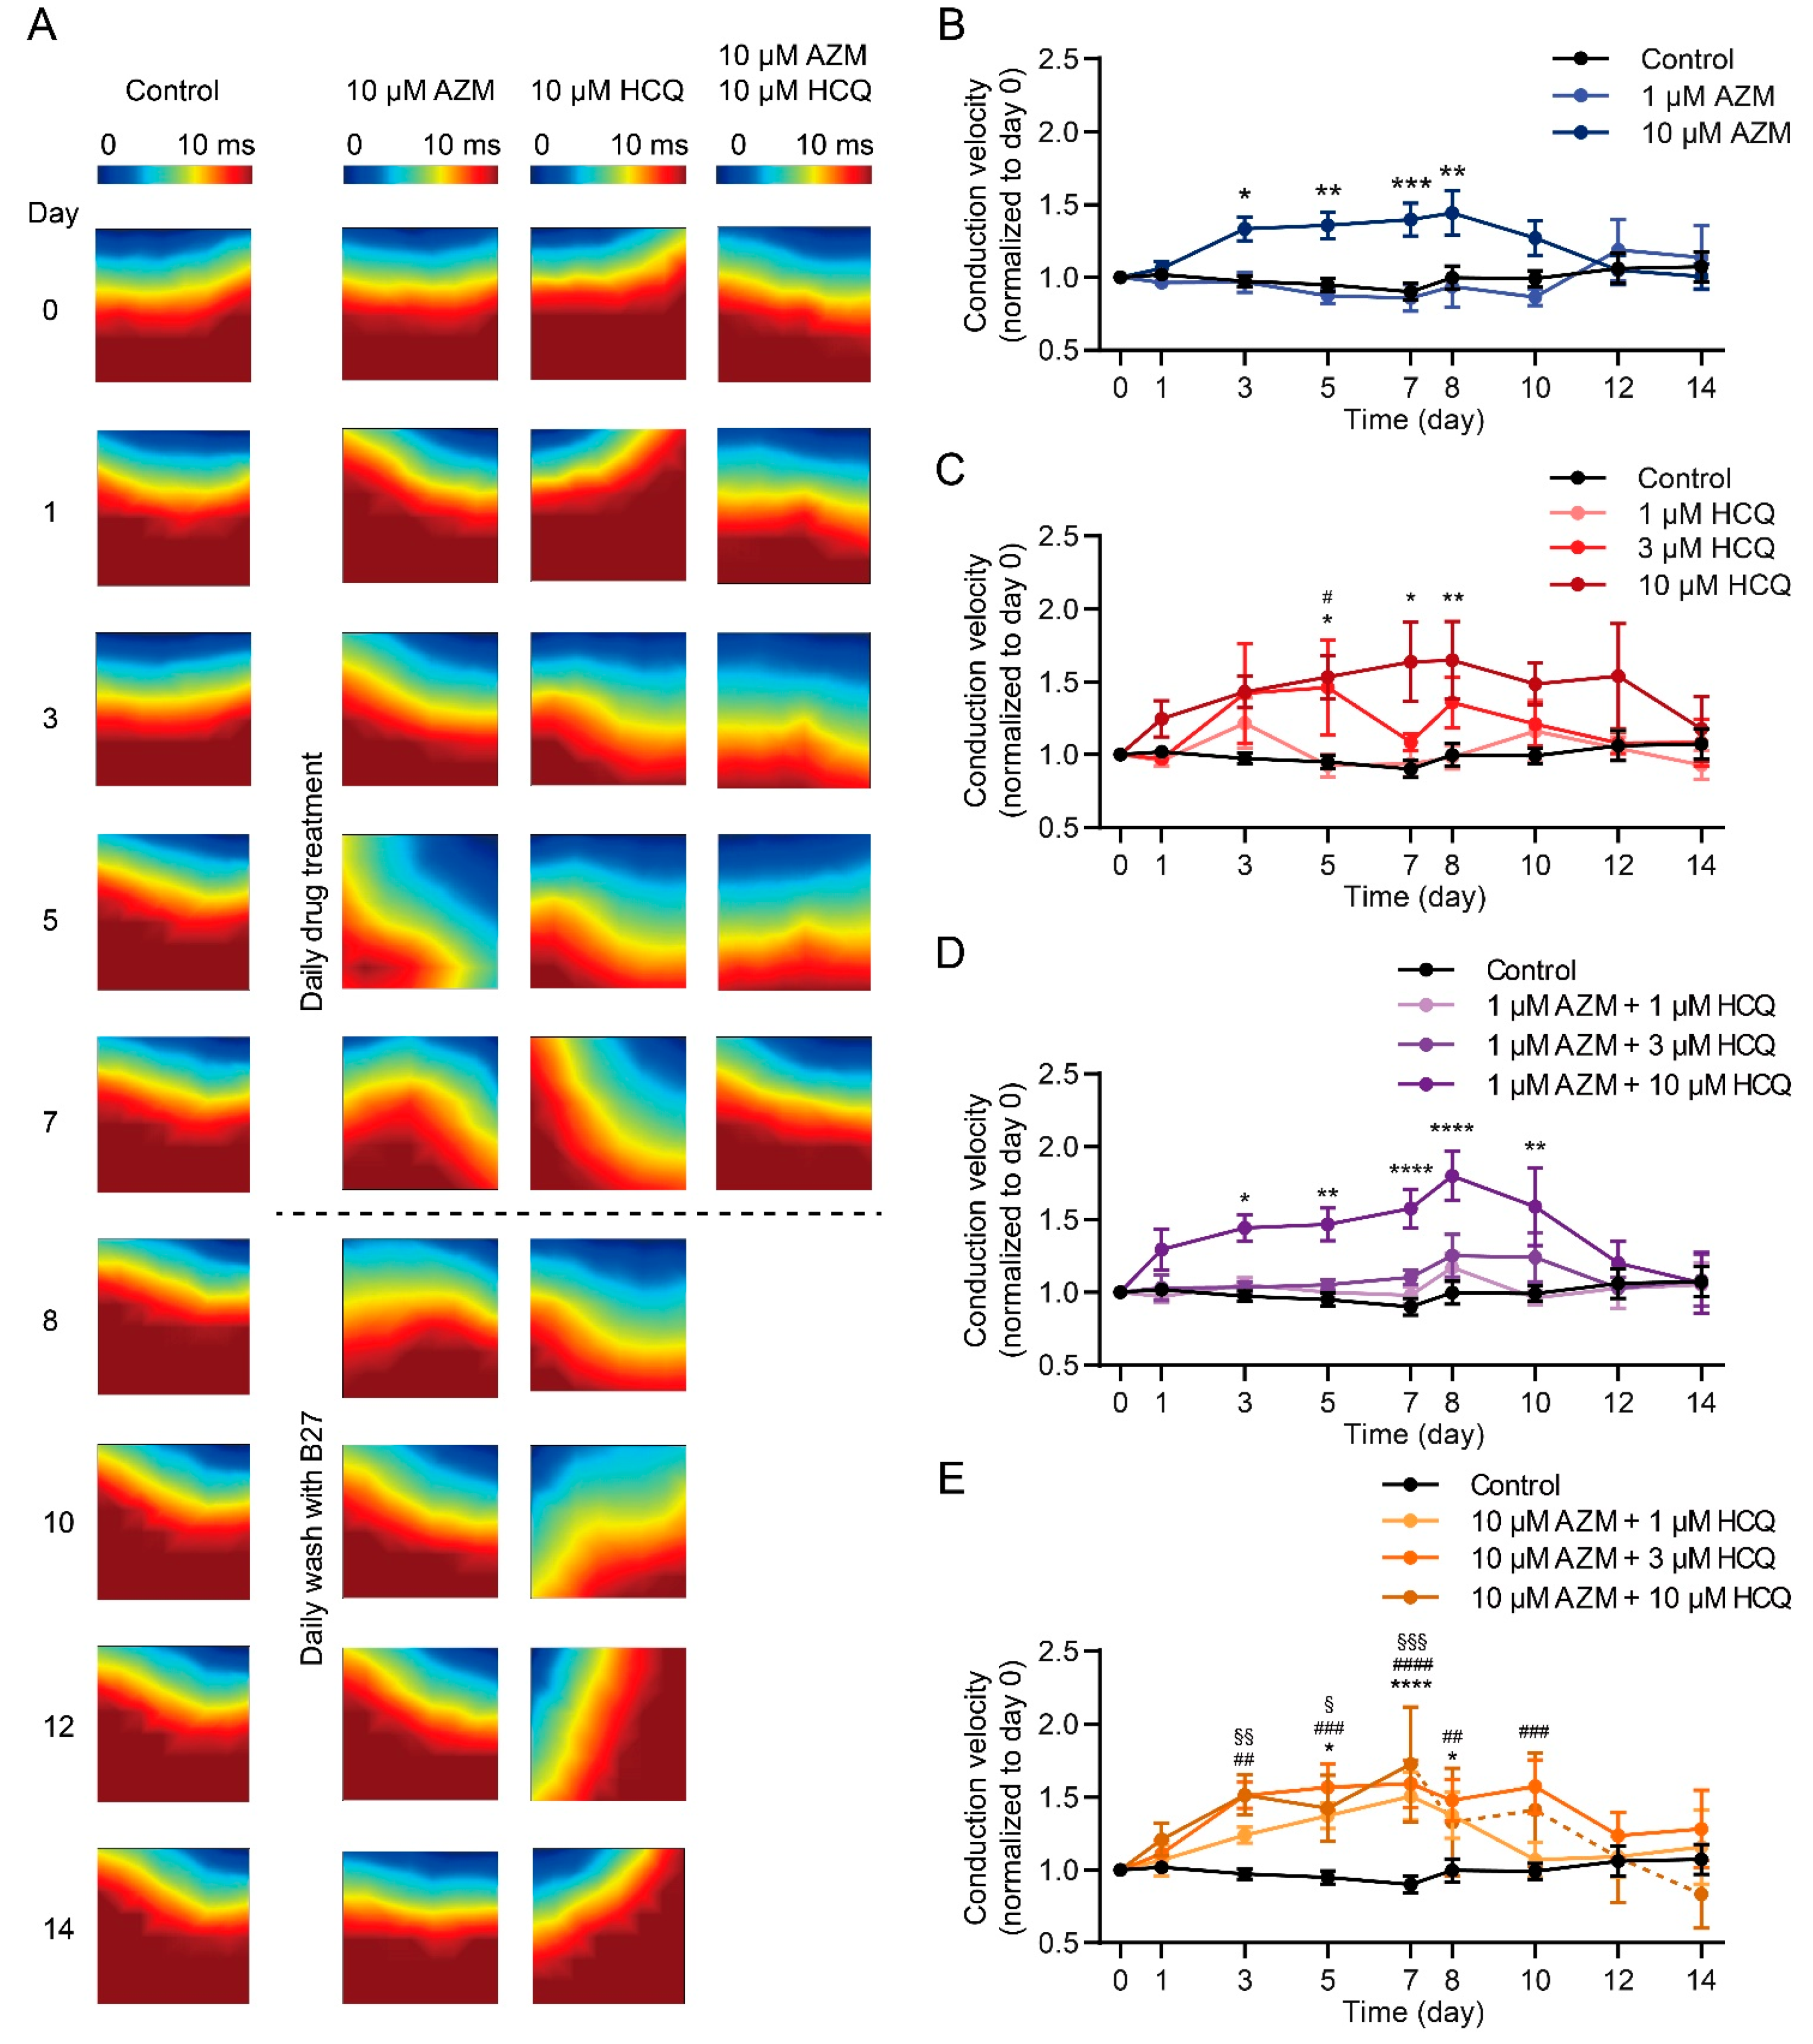
2.5. HCQ and AZM Independently and Synergistically Augment the Conduction Velocity of iPSC-CMs
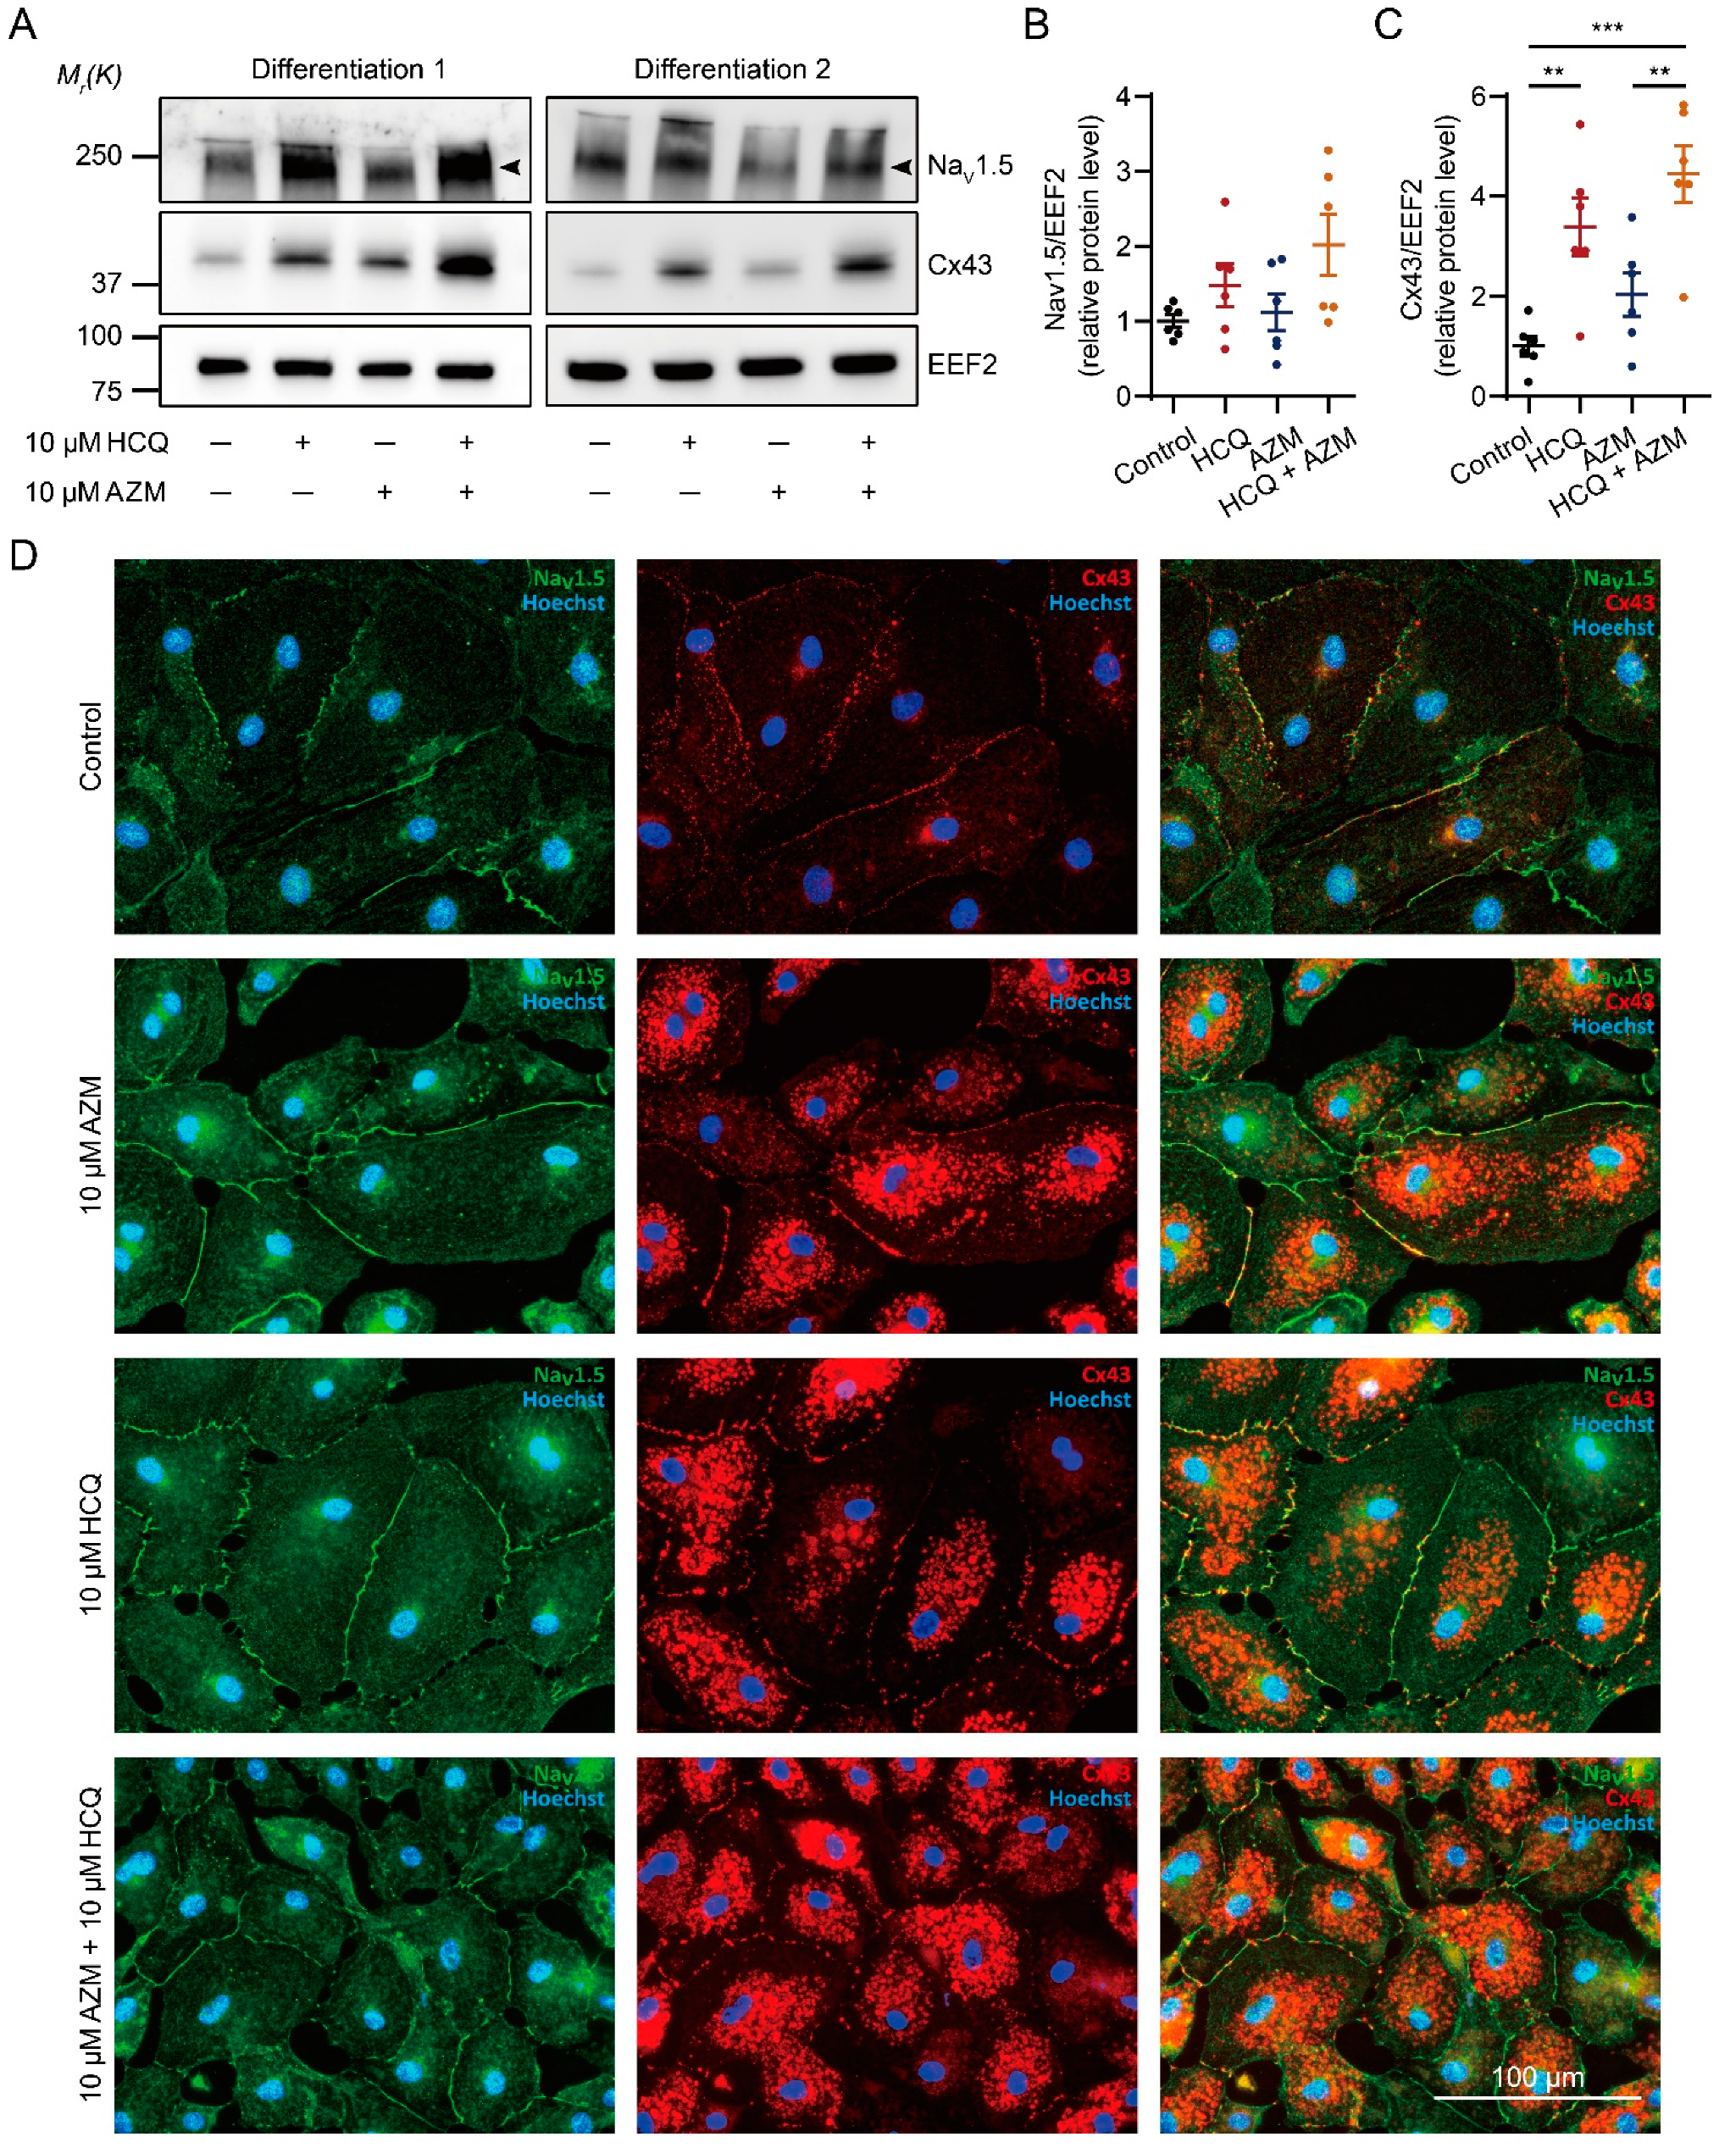
2.6. HCQ and AZM Synergistically Enhance the Expression of Cx43 and Alter the Steady-State Kinetics of INa in iPSC-CMs
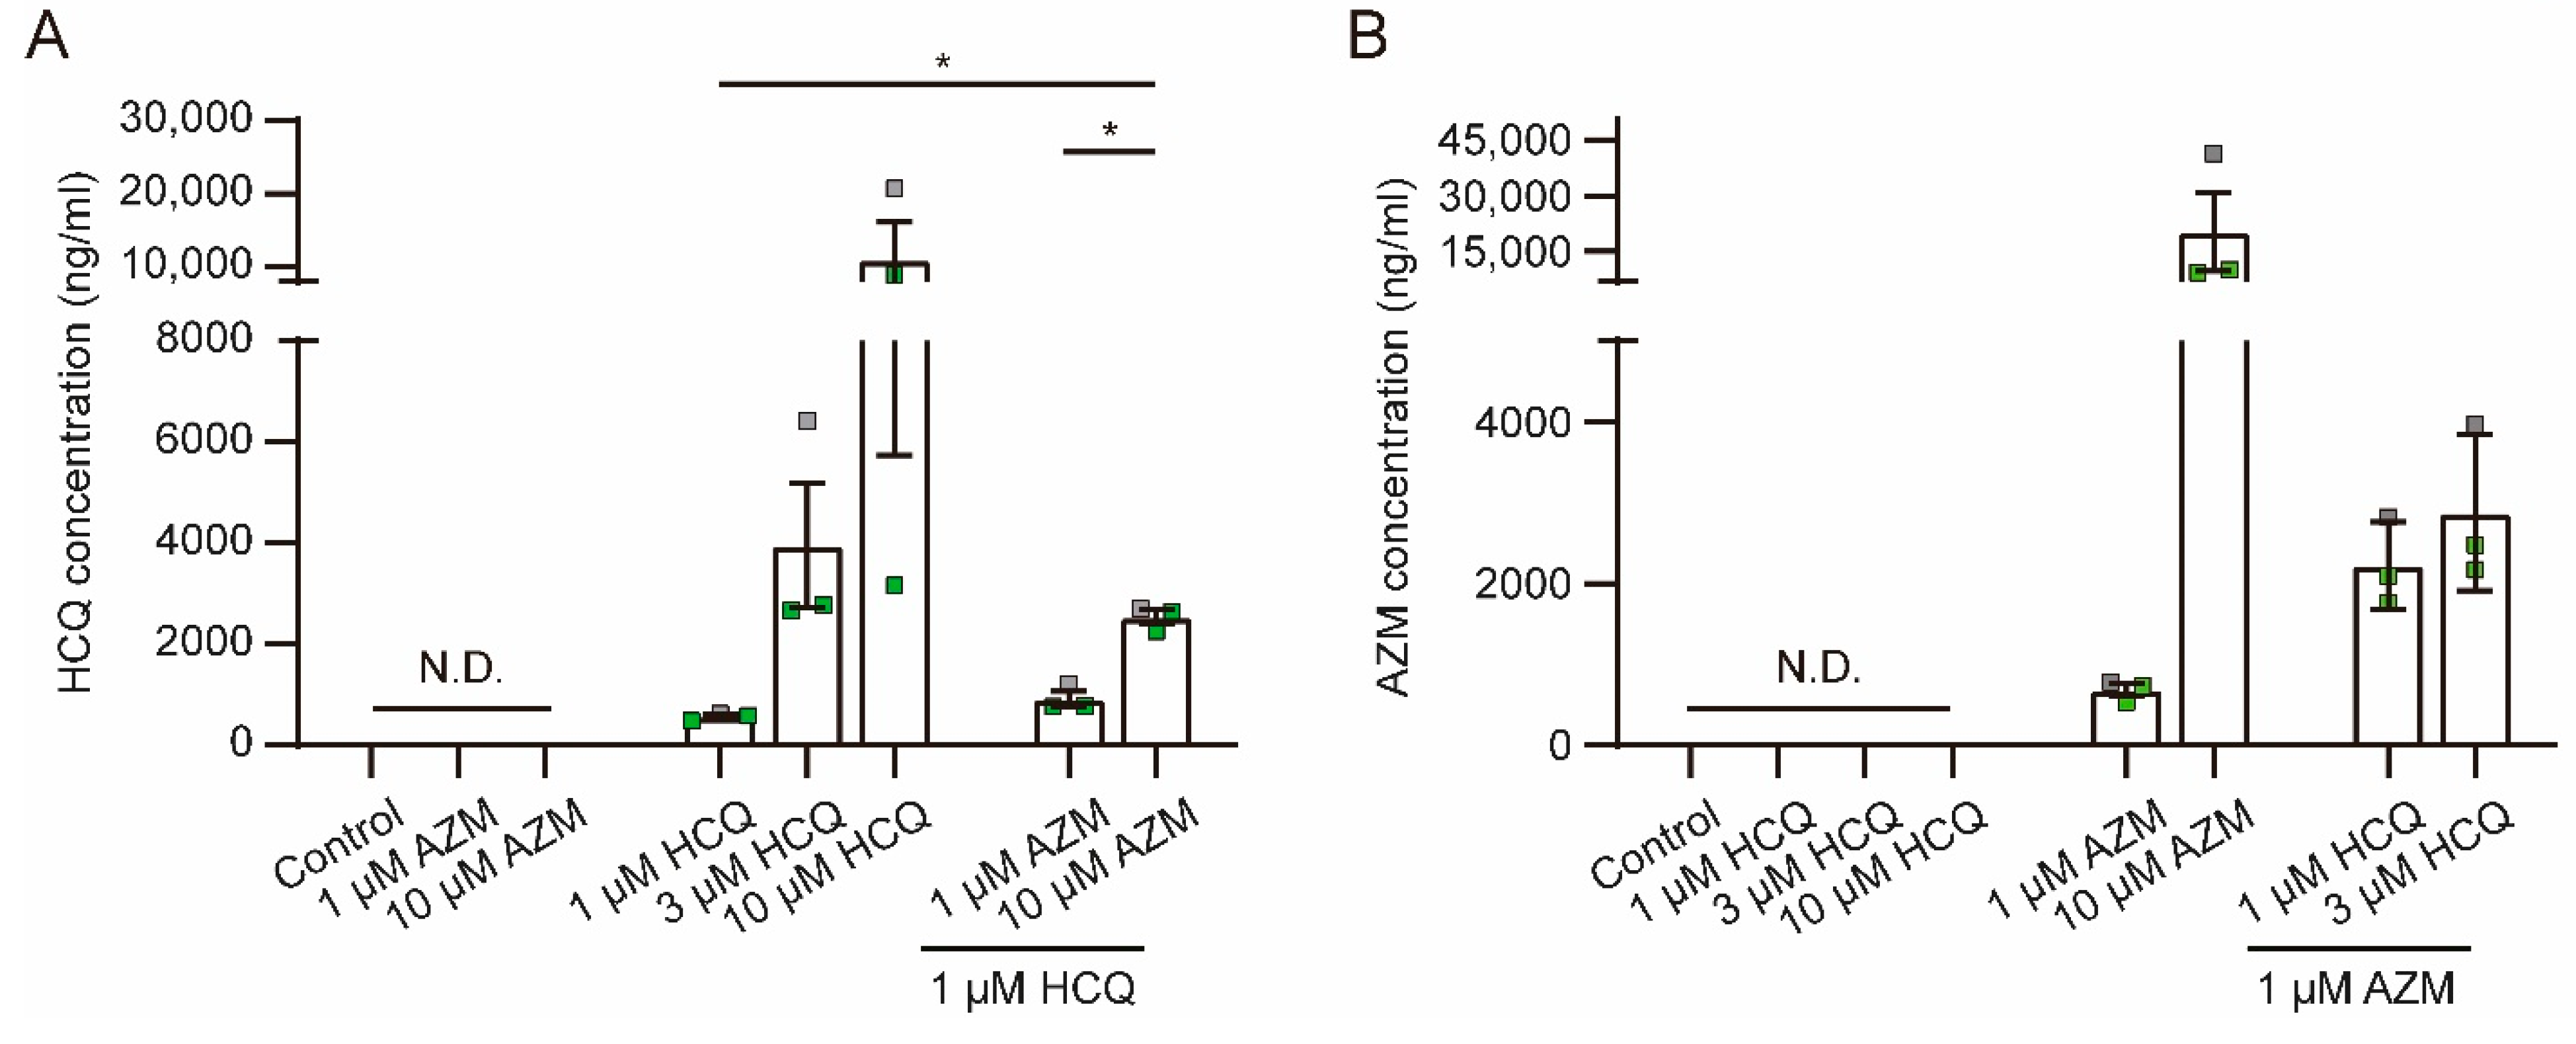
2.7. HCQ and AZM Accumulate in iPSC-CMs
3. Discussion
3.1. HCQ and AZM Differentially Affect iPSC-CM Viability and Functionality
3.2. Synergic Effects between AZM and HCQ
3.3. Mechanistic Evidence of AZM and HCQ Combination
3.4. Study Limitations
4. Materials and Methods
4.1. Culture and Maintenance of iPSCs
4.2. Differentiation of iPSCs into Cardiomyocytes and Drug Treatment
4.3. Video-Based Contraction Analysis
4.4. Immunofluorescence Staining
4.5. Multi-Electrode Array
4.6. Automated Patch-Clamp
4.7. Western Blot
4.8. Lactate Dehydrogenase Measurement
4.9. MTT Assay
4.10. Determination of HCQ and AZM Concentrations in Cell Lysates
4.11. Statistics
5. Conclusions
Supplementary Materials
Author Contributions
Funding
Institutional Review Board Statement
Informed Consent Statement
Data Availability Statement
Acknowledgments
Conflicts of Interest
Abbreviations
References
- Mamoshina, P.; Rodriguez, B.; Bueno-Orovio, A. Toward a broader view of mechanisms of drug cardiotoxicity. Cell Rep. Med. 2021, 2, 100216. [Google Scholar] [CrossRef] [PubMed]
- Ma, W.; Wei, S.; Zhang, B.; Li, W. Molecular Mechanisms of Cardiomyocyte Death in Drug-Induced Cardiotoxicity. Front. Cell Dev. Biol. 2020, 8, 434. [Google Scholar] [CrossRef]
- Gautret, P.; Lagier, J.C.; Parola, P.; Hoang, V.T.; Meddeb, L.; Mailhe, M.; Doudier, B.; Courjon, J.; Giordanengo, V.; Vieira, V.E.; et al. Hydroxychloroquine and azithromycin as a treatment of COVID-19: Results of an open-label non-randomized clinical trial. Int. J. Antimicrob. Agents 2020, 56, 105949. [Google Scholar] [CrossRef] [PubMed]
- Andreani, J.; Le Bideau, M.; Duflot, I.; Jardot, P.; Rolland, C.; Boxberger, M.; Wurtz, N.; Rolain, J.-M.; Colson, P.; La Scola, B.; et al. In vitro testing of combined hydroxychloroquine and azithromycin on SARS-CoV-2 shows synergistic effect. Microb. Pathog. 2020, 145, 104228. [Google Scholar] [CrossRef]
- Dixit, S.B.; Zirpe, K.G.; Kulkarni, A.P.; Chaudhry, D.; Govil, D.; Mehta, Y.; Jog, S.A.; Khatib, K.I.; Pandit, R.A.; Samavedam, S.; et al. Current Approaches to COVID-19: Therapy and Prevention. Indian J. Crit. Care Med. 2020, 24, 838–846. [Google Scholar] [CrossRef]
- Furtado, R.H.M.; Berwanger, O.; Fonseca, H.A.; Correa, T.D.; Ferraz, L.R.; Lapa, M.G.; Zampieri, F.G.; Veiga, V.C.; Azevedo, L.C.P.; Rosa, R.G.; et al. Azithromycin in addition to standard of care versus standard of care alone in the treatment of patients admitted to the hospital with severe COVID-19 in Brazil (COALITION II): A randomised clinical trial. Lancet 2020, 396, 959–967. [Google Scholar] [CrossRef]
- Geleris, J.; Sun, Y.; Platt, J.; Zucker, J.; Baldwin, M.; Hripcsak, G.; Labella, A.; Manson, D.K.; Kubin, C.; Barr, R.G.; et al. Observational Study of Hydroxychloroquine in Hospitalized Patients with COVID-19. N. Engl. J. Med. 2020, 382, 2411–2418. [Google Scholar] [CrossRef]
- Chorin, E.; Dai, M.; Shulman, E.; Wadhwani, L.; Bar-Cohen, R.; Barbhaiya, C.; Aizer, A.; Holmes, D.; Bernstein, S.; Spinelli, M.; et al. The QT interval in patients with COVID-19 treated with hydroxychloroquine and azithromycin. Nat. Med. 2020, 26, 808–809. [Google Scholar] [CrossRef] [PubMed]
- Mercuro, N.J.; Yen, C.F.; Shim, D.J.; Maher, T.R.; McCoy, C.M.; Zimetbaum, P.J.; Gold, H.S. Risk of QT Interval Prolongation Associated With Use of Hydroxychloroquine With or Without Concomitant Azithromycin Among Hospitalized Patients Testing Positive for Coronavirus Disease 2019 (COVID-19). JAMA Cardiol. 2020, 5, 1036–1041. [Google Scholar] [CrossRef]
- Saleh, M.; Gabriels, J.; Chang, D.; Kim, B.S.; Mansoor, A.; Mahmood, E.; Makker, P.; Ismail, H.; Goldner, B.; Willner, J.; et al. Effect of Chloroquine, Hydroxychloroquine, and Azithromycin on the Corrected QT Interval in Patients With SARS-CoV-2 Infection. Circ. Arrhythm. Electrophysiol. 2020, 13, e008662. [Google Scholar] [CrossRef]
- Ramireddy, A.; Chugh, H.; Reinier, K.; Ebinger, J.; Park, E.; Thompson, M.; Cingolani, E.; Cheng, S.; Marban, E.; Albert, C.M.; et al. Experience With Hydroxychloroquine and Azithromycin in the Coronavirus Disease 2019 Pandemic: Implications for QT Interval Monitoring. J. Am. Heart Assoc. 2020, 9, e017144. [Google Scholar] [CrossRef] [PubMed]
- Yang, Y.P.; Hu, L.F.; Zheng, H.F.; Mao, C.J.; Hu, W.D.; Xiong, K.P.; Wang, F.; Liu, C.F. Application and interpretation of current autophagy inhibitors and activators. Acta Pharmacol. Sin. 2013, 34, 625–635. [Google Scholar] [CrossRef] [PubMed] [Green Version]
- Wang, X.; Pan, Z.; Wang, J.; Wang, H.; Fan, H.; Gong, T.; Sun, Q.; Feng, Y.; Liang, P. Characterization of the molecular mechanisms underlying azithromycin-induced cardiotoxicity using human-induced pluripotent stem cell-derived cardiomyocytes. Clin. Transl. Med. 2021, 11, e549. [Google Scholar] [CrossRef] [PubMed]
- Chatre, C.; Roubille, F.; Vernhet, H.; Jorgensen, C.; Pers, Y.-M. Cardiac Complications Attributed to Chloroquine and Hydroxychloroquine: A Systematic Review of the Literature. Drug Saf. 2018, 41, 919–931. [Google Scholar] [CrossRef]
- Roden, D.M.; Harrington, R.A.; Poppas, A.; Russo, A.M. Considerations for Drug Interactions on QTc in Exploratory COVID-19 Treatment. Circulation 2020, 141, e906–e907. [Google Scholar] [CrossRef] [Green Version]
- Capel, R.A.; Herring, N.; Kalla, M.; Yavari, A.; Mirams, G.R.; Douglas, G.; Bub, G.; Channon, K.; Paterson, D.J.; Terrar, D.A.; et al. Hydroxychloroquine reduces heart rate by modulating the hyperpolarization-activated current If: Novel electrophysiological insights and therapeutic potential. Heart Rhythm 2015, 12, 2186–2194. [Google Scholar] [CrossRef] [Green Version]
- Huang, B.H.; Wu, C.H.; Hsia, C.P.; Chen, C.Y. Azithromycin-induced torsade de pointes. Pacing Clin. Electrophysiol. 2007, 30, 1579–1582. [Google Scholar] [CrossRef]
- Ray, W.A.; Murray, K.T.; Hall, K.; Arbogast, P.G.; Stein, C.M. Azithromycin and the Risk of Cardiovascular Death. N. Engl. J. Med. 2012, 366, 1881–1890. [Google Scholar] [CrossRef]
- Kezerashvili, A.; Khattak, H.; Barsky, A.; Nazari, R.; Fisher, J.D. Azithromycin as a cause of QT-interval prolongation and torsade de pointes in the absence of other known precipitating factors. J. Interv. Card. Electrophysiol. 2007, 18, 243–246. [Google Scholar] [CrossRef]
- Wang, G.; Lu, C.-J.; Trafford, A.W.; Tian, X.; Flores, H.M.; Maj, P.; Zhang, K.; Niu, Y.; Wang, L.; Du, Y.; et al. Mechanistic insights into ventricular arrhythmogenesis of hydroxychloroquine and azithromycin for the treatment of COVID-19. bioRxiv 2020, 2020.2005.2021.108605. [Google Scholar] [CrossRef]
- Yanagida, S.; Satsuka, A.; Hayashi, S.; Ono, A.; Kanda, Y. Comprehensive Cardiotoxicity Assessment of COVID-19 Treatments Using Human-Induced Pluripotent Stem Cell-Derived Cardiomyocytes. Toxicol. Sci. 2021, 183, 227–239. [Google Scholar] [CrossRef] [PubMed]
- Yang, Z.; Prinsen, J.K.; Bersell, K.R.; Shen, W.; Yermalitskaya, L.; Sidorova, T.; Luis, P.B.; Hall, L.; Zhang, W.; Du, L.; et al. Azithromycin Causes a Novel Proarrhythmic Syndrome. Circ. Arrhythm. Electrophysiol. 2017, 10, e003560. [Google Scholar] [CrossRef] [Green Version]
- Touret, F.; Gilles, M.; Barral, K.; Nougairede, A.; van Helden, J.; Decroly, E.; de Lamballerie, X.; Coutard, B. In vitro screening of a FDA approved chemical library reveals potential inhibitors of SARS-CoV-2 replication. Sci. Rep. 2020, 10, 13093. [Google Scholar] [CrossRef] [PubMed]
- Durcan, L.; Clarke, W.A.; Magder, L.S.; Petri, M. Hydroxychloroquine Blood Levels in Systemic Lupus Erythematosus: Clarifying Dosing Controversies and Improving Adherence. J. Rheumatol. 2015, 42, 2092–2097. [Google Scholar] [CrossRef] [Green Version]
- Yao, X.; Ye, F.; Zhang, M.; Cui, C.; Huang, B.; Niu, P.; Liu, X.; Zhao, L.; Dong, E.; Song, C.; et al. In Vitro Antiviral Activity and Projection of Optimized Dosing Design of Hydroxychloroquine for the Treatment of Severe Acute Respiratory Syndrome Coronavirus 2 (SARS-CoV-2). Clin. Infect. Dis. 2020, 71, 732–739. [Google Scholar] [CrossRef] [PubMed] [Green Version]
- Jeong, B.H.; Jeon, K.; Park, H.Y.; Moon, S.M.; Kim, S.Y.; Lee, S.Y.; Shin, S.J.; Daley, C.L.; Koh, W.J. Peak Plasma Concentration of Azithromycin and Treatment Responses in Mycobacterium avium Complex Lung Disease. Antimicrob. Agents Chemother. 2016, 60, 6076–6083. [Google Scholar] [CrossRef] [Green Version]
- Zuckerman, J.M. The newer macrolides: Azithromycin and clarithromycin. Infect. Dis. Clin. N. Am. 2000, 14, 449–462. [Google Scholar] [CrossRef]
- Tett, S.E.; Cutler, D.J.; Day, R.O.; Brown, K.F. A dose-ranging study of the pharmacokinetics of hydroxy-chloroquine following intravenous administration to healthy volunteers. Br. J. Clin. Pharmacol. 1988, 26, 303–313. [Google Scholar] [CrossRef] [Green Version]
- Zheng, S.; Matzneller, P.; Zeitlinger, M.; Schmidt, S. Development of a population pharmacokinetic model characterizing the tissue distribution of azithromycin in healthy subjects. Antimicrob. Agents Chemother. 2014, 58, 6675–6684. [Google Scholar] [CrossRef] [Green Version]
- Liu, J.; Cao, R.; Xu, M.; Wang, X.; Zhang, H.; Hu, H.; Li, Y.; Hu, Z.; Zhong, W.; Wang, M. Hydroxychloroquine, a less toxic derivative of chloroquine, is effective in inhibiting SARS-CoV-2 infection in vitro. Cell Discov. 2020, 6, 16. [Google Scholar] [CrossRef] [Green Version]
- Araujo, F.G.; Shepard, R.M.; Remington, J.S. In vivo activity of the macrolide antibiotics azithromycin, roxithromycin and spiramycin against Toxoplasma gondii. Eur. J. Clin. Microbiol. Infect. Dis. 1991, 10, 519–524. [Google Scholar] [CrossRef]
- Cavalcanti, A.B.; Zampieri, F.G.; Rosa, R.G.; Azevedo, L.C.P.; Veiga, V.C.; Avezum, A.; Damiani, L.P.; Marcadenti, A.; Kawano-Dourado, L.; Lisboa, T.; et al. Hydroxychloroquine with or without Azithromycin in Mild-to-Moderate COVID-19. N. Engl. J. Med. 2020, 383, 2041–2052. [Google Scholar] [CrossRef] [PubMed]
- O’Laughlin, J.P.; Mehta, P.H.; Wong, B.C. Life Threatening Severe QTc Prolongation in Patient with Systemic Lupus Erythematosus due to Hydroxychloroquine. Case Rep. Cardiol. 2016, 2016, 4626279. [Google Scholar] [CrossRef] [Green Version]
- Chen, C.Y.; Wang, F.L.; Lin, C.C. Chronic hydroxychloroquine use associated with QT prolongation and refractory ventricular arrhythmia. Clin. Toxicol. 2006, 44, 173–175. [Google Scholar] [CrossRef] [PubMed]
- Karbassi, E.; Fenix, A.; Marchiano, S.; Muraoka, N.; Nakamura, K.; Yang, X.; Murry, C.E. Cardiomyocyte maturation: Advances in knowledge and implications for regenerative medicine. Nat. Rev. Cardiol. 2020, 17, 341–359. [Google Scholar] [CrossRef] [PubMed]
- Kolanowski, T.J.; Busek, M.; Schubert, M.; Dmitrieva, A.; Binnewerg, B.; Poche, J.; Fisher, K.; Schmieder, F.; Grunzner, S.; Hansen, S.; et al. Enhanced structural maturation of human induced pluripotent stem cell-derived cardiomyocytes under a controlled microenvironment in a microfluidic system. Acta Biomater. 2020, 102, 273–286. [Google Scholar] [CrossRef]
- Huebsch, N.; Loskill, P.; Mandegar, M.A.; Marks, N.C.; Sheehan, A.S.; Ma, Z.; Mathur, A.; Nguyen, T.N.; Yoo, J.C.; Judge, L.M.; et al. Automated Video-Based Analysis of Contractility and Calcium Flux in Human-Induced Pluripotent Stem Cell-Derived Cardiomyocytes Cultured over Different Spatial Scales. Tissue Eng. Part C Methods 2015, 21, 467–479. [Google Scholar] [CrossRef] [PubMed]
- Lane, J.C.E.; Weaver, J.; Kostka, K.; Duarte-Salles, T.; Abrahao, M.T.F.; Alghoul, H.; Alser, O.; Alshammari, T.M.; Biedermann, P.; Burn, E.; et al. Safety of hydroxychloroquine, alone and in combination with azithromycin, in light of rapid wide-spread use for COVID-19: A multinational, network cohort and self-controlled case series study. medRxiv 2020, 2020.2004.2008.20054551. [Google Scholar] [CrossRef] [Green Version]
- King, J.H.; Huang, C.L.; Fraser, J.A. Determinants of myocardial conduction velocity: Implications for arrhythmogenesis. Front. Physiol. 2013, 4, 154. [Google Scholar] [CrossRef] [Green Version]
- Khuroo, M.S. Chloroquine and hydroxychloroquine in coronavirus disease 2019 (COVID-19). Facts, fiction and the hype: A critical appraisal. Int. J. Antimicrob. Agents 2020, 56, 106101. [Google Scholar] [CrossRef]
- Kitani, T.; Ong, S.G.; Lam, C.K.; Rhee, J.W.; Zhang, J.Z.; Oikonomopoulos, A.; Ma, N.; Tian, L.; Lee, J.; Telli, M.L.; et al. Human-Induced Pluripotent Stem Cell Model of Trastuzumab-Induced Cardiac Dysfunction in Patients With Breast Cancer. Circulation 2019, 139, 2451–2465. [Google Scholar] [CrossRef]
- Rosenberg, E.S.; Dufort, E.M.; Udo, T.; Wilberschied, L.A.; Kumar, J.; Tesoriero, J.; Weinberg, P.; Kirkwood, J.; Muse, A.; DeHovitz, J.; et al. Association of Treatment With Hydroxychloroquine or Azithromycin With In-Hospital Mortality in Patients With COVID-19 in New York State. JAMA 2020, 323, 2493–2502. [Google Scholar] [CrossRef] [PubMed]
- Takeda, A.; Takano, N.; Kokuba, H.; Hino, H.; Moriya, S.; Abe, A.; Hiramoto, M.; Tsukahara, K.; Miyazawa, K. Macrolide antibiotics enhance the antitumor effect of lansoprazole resulting in lysosomal membrane permeabilizationassociated cell death. Int. J. Oncol. 2020, 57, 1280–1292. [Google Scholar] [CrossRef] [PubMed]
- Mukai, S.; Moriya, S.; Hiramoto, M.; Kazama, H.; Kokuba, H.; Che, X.F.; Yokoyama, T.; Sakamoto, S.; Sugawara, A.; Sunazuka, T.; et al. Macrolides sensitize EGFR-TKI-induced non-apoptotic cell death via blocking autophagy flux in pancreatic cancer cell lines. Int. J. Oncol. 2016, 48, 45–54. [Google Scholar] [CrossRef] [Green Version]
- Norinder, U.; Tuck, A.; Norgren, K.; Munic Kos, V. Existing highly accumulating lysosomotropic drugs with potential for repurposing to target COVID-19. Biomed. Pharmacother. 2020, 130, 110582. [Google Scholar] [CrossRef] [PubMed]
- Scherrmann, J.M. Intracellular ABCB1 as a Possible Mechanism to Explain the Synergistic Effect of Hydroxychloroquine-Azithromycin Combination in COVID-19 Therapy. AAPS J. 2020, 22, 86. [Google Scholar] [CrossRef]
- Cyganek, L.; Tiburcy, M.; Sekeres, K.; Gerstenberg, K.; Bohnenberger, H.; Lenz, C.; Henze, S.; Stauske, M.; Salinas, G.; Zimmermann, W.H.; et al. Deep phenotyping of human induced pluripotent stem cell-derived atrial and ventricular cardiomyocytes. JCI Insight 2018, 3, e99941. [Google Scholar] [CrossRef] [Green Version]
- Feyen, D.A.M.; McKeithan, W.L.; Bruyneel, A.A.N.; Spiering, S.; Hormann, L.; Ulmer, B.; Zhang, H.; Briganti, F.; Schweizer, M.; Hegyi, B.; et al. Metabolic Maturation Media Improve Physiological Function of Human iPSC-Derived Cardiomyocytes. Cell Rep. 2020, 32, 107925. [Google Scholar] [CrossRef]
- Laing, J.G.; Tadros, P.N.; Green, K.; Saffitz, J.E.; Beyer, E.C. Proteolysis of connexin43-containing gap junctions in normal and heat-stressed cardiac myocytes. Cardiovasc. Res. 1998, 38, 711–718. [Google Scholar] [CrossRef] [Green Version]
- Mauthe, M.; Orhon, I.; Rocchi, C.; Zhou, X.; Luhr, M.; Hijlkema, K.J.; Coppes, R.P.; Engedal, N.; Mari, M.; Reggiori, F. Chloroquine inhibits autophagic flux by decreasing autophagosome-lysosome fusion. Autophagy 2018, 14, 1435–1455. [Google Scholar] [CrossRef]
- Streckfuss-Bomeke, K.; Wolf, F.; Azizian, A.; Stauske, M.; Tiburcy, M.; Wagner, S.; Hubscher, D.; Dressel, R.; Chen, S.; Jende, J.; et al. Comparative study of human-induced pluripotent stem cells derived from bone marrow cells, hair keratinocytes, and skin fibroblasts. Eur. Heart J. 2013, 34, 2618–2629. [Google Scholar] [CrossRef] [PubMed] [Green Version]
- Rossler, U.; Hennig, A.F.; Stelzer, N.; Bose, S.; Kopp, J.; Soe, K.; Cyganek, L.; Zifarelli, G.; Ali, S.; von der Hagen, M.; et al. Efficient generation of osteoclasts from human induced pluripotent stem cells and functional investigations of lethal CLCN7-related osteopetrosis. J. Bone Miner. Res. 2021, 36, 1621–1635. [Google Scholar] [CrossRef] [PubMed]
- Li, W.; Luo, X.; Ulbricht, Y.; Wagner, M.; Piorkowski, C.; El-Armouche, A.; Guan, K. Establishment of an automated patch-clamp platform for electrophysiological and pharmacological evaluation of hiPSC-CMs. Stem Cell Res. 2019, 41, 101662. [Google Scholar] [CrossRef]
- Luo, X.; Li, W.; Kunzel, K.; Henze, S.; Cyganek, L.; Strano, A.; Poetsch, M.S.; Schubert, M.; Guan, K. IP3R-Mediated Compensatory Mechanism for Calcium Handling in Human Induced Pluripotent Stem Cell-Derived Cardiomyocytes With Cardiac Ryanodine Receptor Deficiency. Front. Cell Dev. Biol. 2020, 8, 772. [Google Scholar] [CrossRef] [PubMed]
- QuoData. Quality & Statistics GmbH. Available online: https://quodata.de/ (accessed on 19 August 2021).
- McQuin, C.; Goodman, A.; Chernyshev, V.; Kamentsky, L.; Cimini, B.A.; Karhohs, K.W.; Doan, M.; Ding, L.; Rafelski, S.M.; Thirstrup, D.; et al. CellProfiler 3.0: Next-generation image processing for biology. PLoS Biol. 2018, 16, e2005970. [Google Scholar] [CrossRef] [Green Version]
- Schindelin, J.; Arganda-Carreras, I.; Frise, E.; Kaynig, V.; Longair, M.; Pietzsch, T.; Preibisch, S.; Rueden, C.; Saalfeld, S.; Schmid, B.; et al. Fiji: An open-source platform for biological-image analysis. Nat. Methods 2012, 9, 676–682. [Google Scholar] [CrossRef] [Green Version]
- Li, W.; Stauske, M.; Luo, X.; Wagner, S.; Vollrath, M.; Mehnert, C.S.; Schubert, M.; Cyganek, L.; Chen, S.; Hasheminasab, S.M.; et al. Disease Phenotypes and Mechanisms of iPSC-Derived Cardiomyocytes From Brugada Syndrome Patients With a Loss-of-Function SCN5A Mutation. Front. Cell Dev. Biol. 2020, 8, 592893. [Google Scholar] [CrossRef]
- Li, W.; Luo, X.; Ulbricht, Y.; Guan, K. Blebbistatin protects iPSC-CMs from hypercontraction and facilitates automated patch-clamp based electrophysiological study. Stem Cell Res. 2021, 56, 102565. [Google Scholar] [CrossRef]


Publisher’s Note: MDPI stays neutral with regard to jurisdictional claims in published maps and institutional affiliations. |
© 2022 by the authors. Licensee MDPI, Basel, Switzerland. This article is an open access article distributed under the terms and conditions of the Creative Commons Attribution (CC BY) license (https://creativecommons.org/licenses/by/4.0/).
Share and Cite
Li, W.; Luo, X.; Poetsch, M.S.; Oertel, R.; Nichani, K.; Schneider, M.; Strano, A.; Hasse, M.; Steiner, R.-P.; Cyganek, L.; et al. Synergistic Adverse Effects of Azithromycin and Hydroxychloroquine on Human Cardiomyocytes at a Clinically Relevant Treatment Duration. Pharmaceuticals 2022, 15, 220. https://doi.org/10.3390/ph15020220
Li W, Luo X, Poetsch MS, Oertel R, Nichani K, Schneider M, Strano A, Hasse M, Steiner R-P, Cyganek L, et al. Synergistic Adverse Effects of Azithromycin and Hydroxychloroquine on Human Cardiomyocytes at a Clinically Relevant Treatment Duration. Pharmaceuticals. 2022; 15(2):220. https://doi.org/10.3390/ph15020220
Chicago/Turabian StyleLi, Wener, Xiaojing Luo, Mareike S. Poetsch, Reinhard Oertel, Kapil Nichani, Martin Schneider, Anna Strano, Marcel Hasse, Robert-Patrick Steiner, Lukas Cyganek, and et al. 2022. "Synergistic Adverse Effects of Azithromycin and Hydroxychloroquine on Human Cardiomyocytes at a Clinically Relevant Treatment Duration" Pharmaceuticals 15, no. 2: 220. https://doi.org/10.3390/ph15020220
APA StyleLi, W., Luo, X., Poetsch, M. S., Oertel, R., Nichani, K., Schneider, M., Strano, A., Hasse, M., Steiner, R.-P., Cyganek, L., Hettwer, K., Uhlig, S., Simon, K., Guan, K., & Schubert, M. (2022). Synergistic Adverse Effects of Azithromycin and Hydroxychloroquine on Human Cardiomyocytes at a Clinically Relevant Treatment Duration. Pharmaceuticals, 15(2), 220. https://doi.org/10.3390/ph15020220