
Preparation of Soluble Complex of Curcumin for the Potential Antagonistic Effects on Human Colorectal Adenocarcinoma Cells

 ,
,  ,
,  ,
,  , , ,
, , ,
Abstract
:
1. Introduction
2. Results and Discussion
2.1. PS Studies
2.2. In Silico Interaction
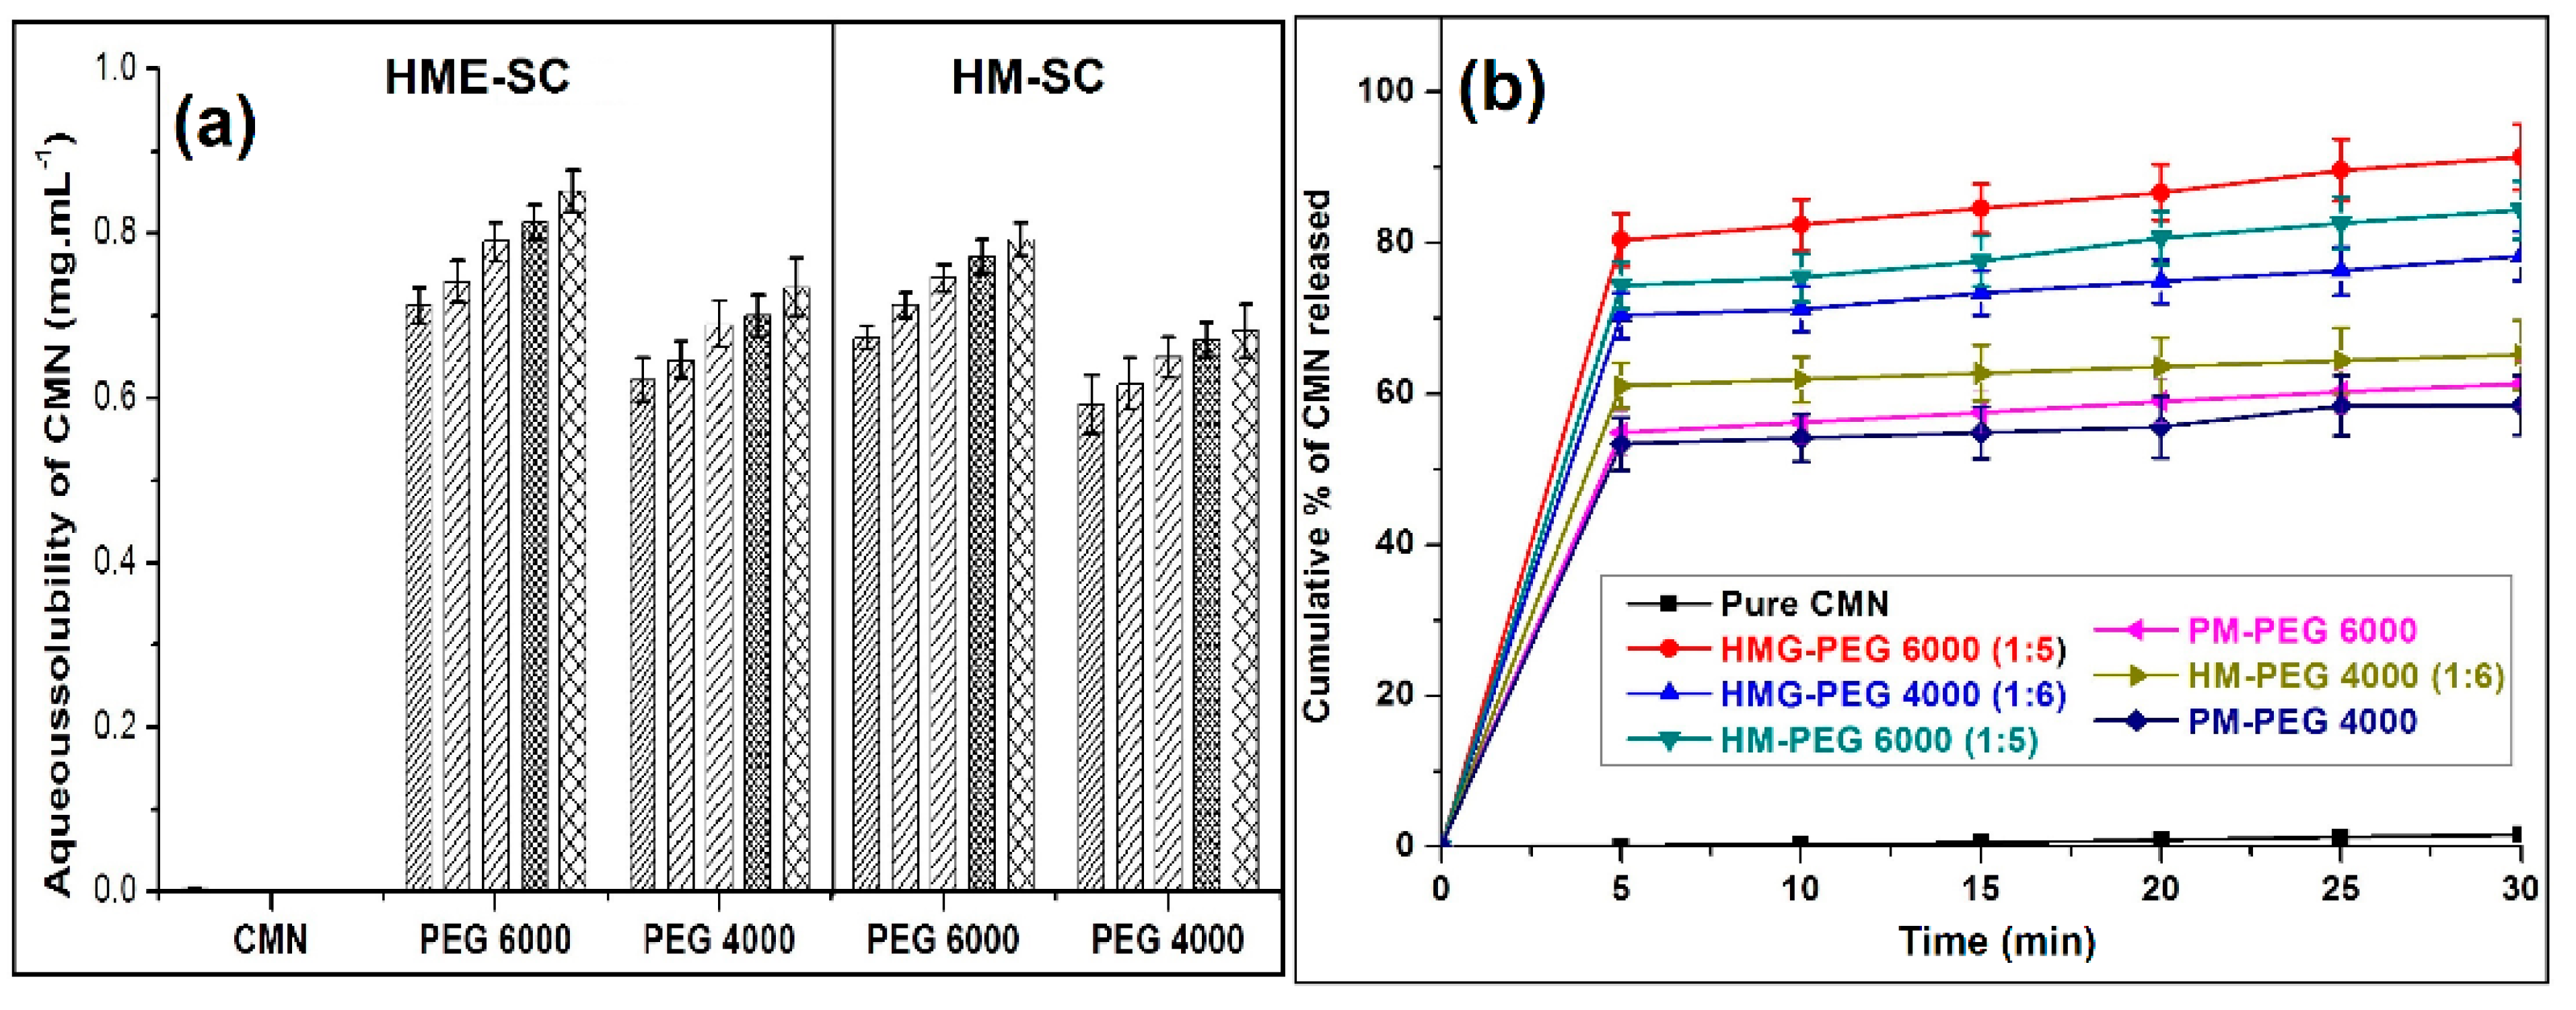
2.3. Solaq
2.4. Drug Release
2.5. Solid State Characteristics
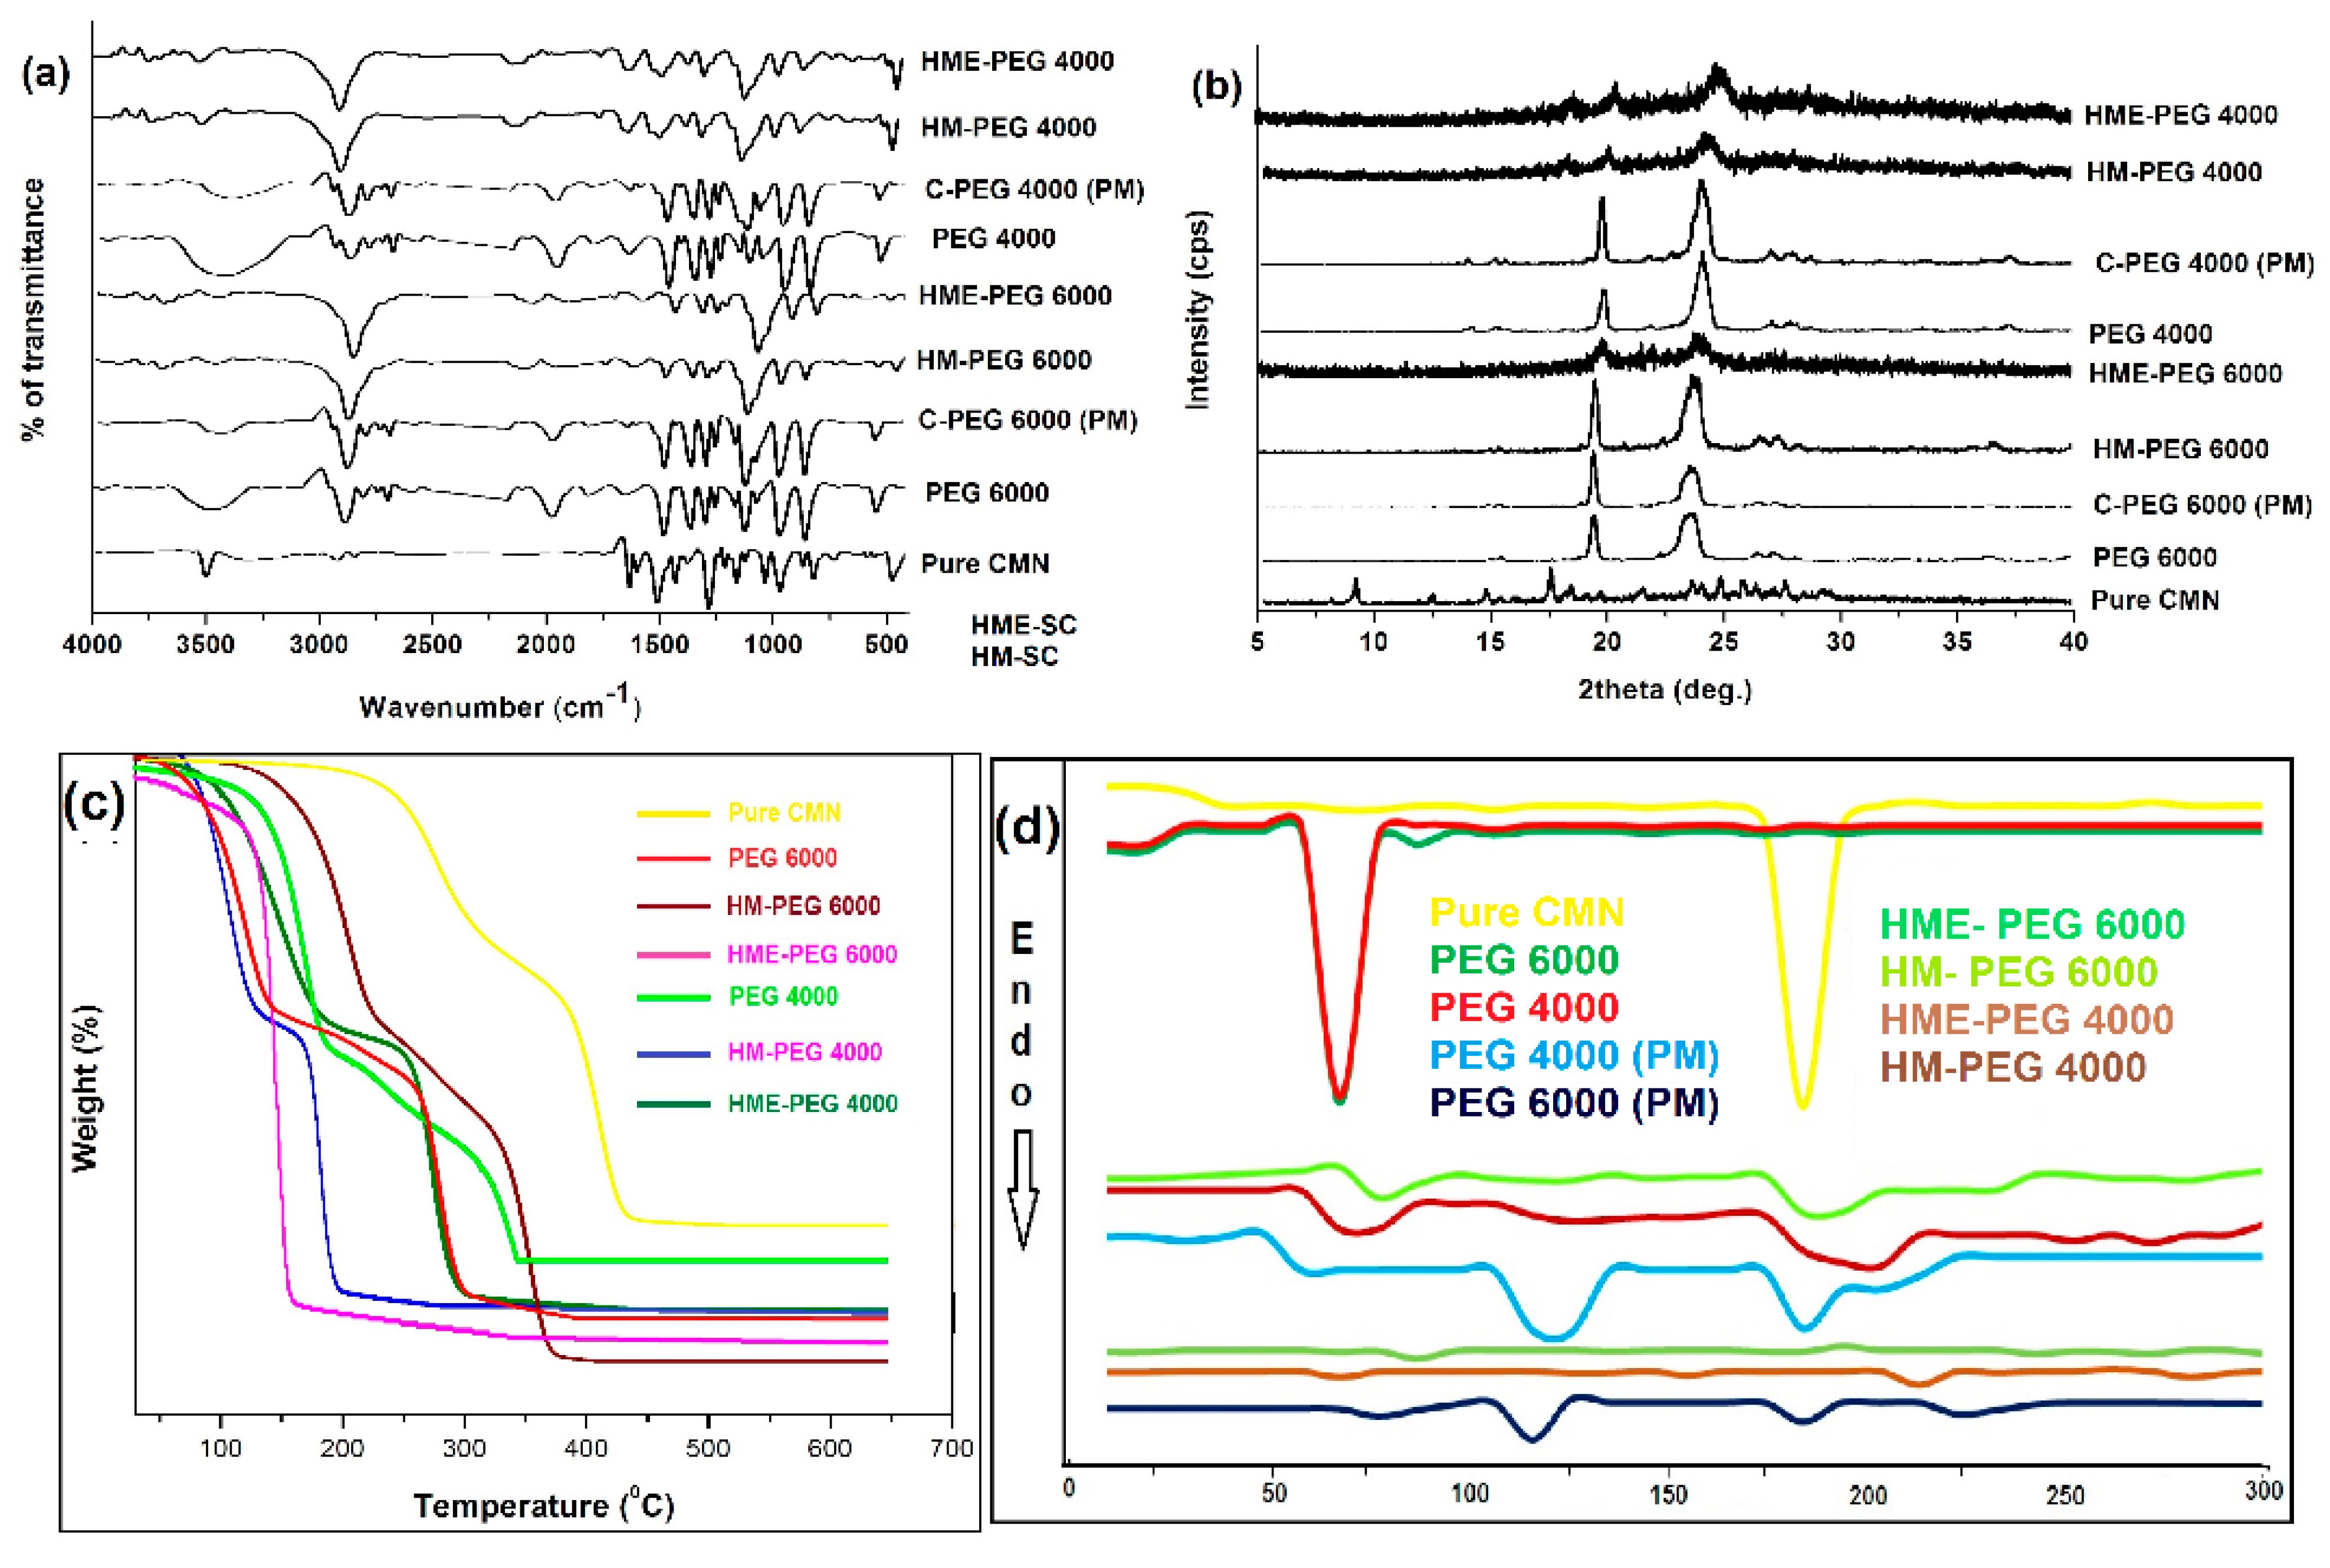
2.5.1. FTIR
2.5.2. PXRD
2.5.3. TGA
2.5.4. DSC
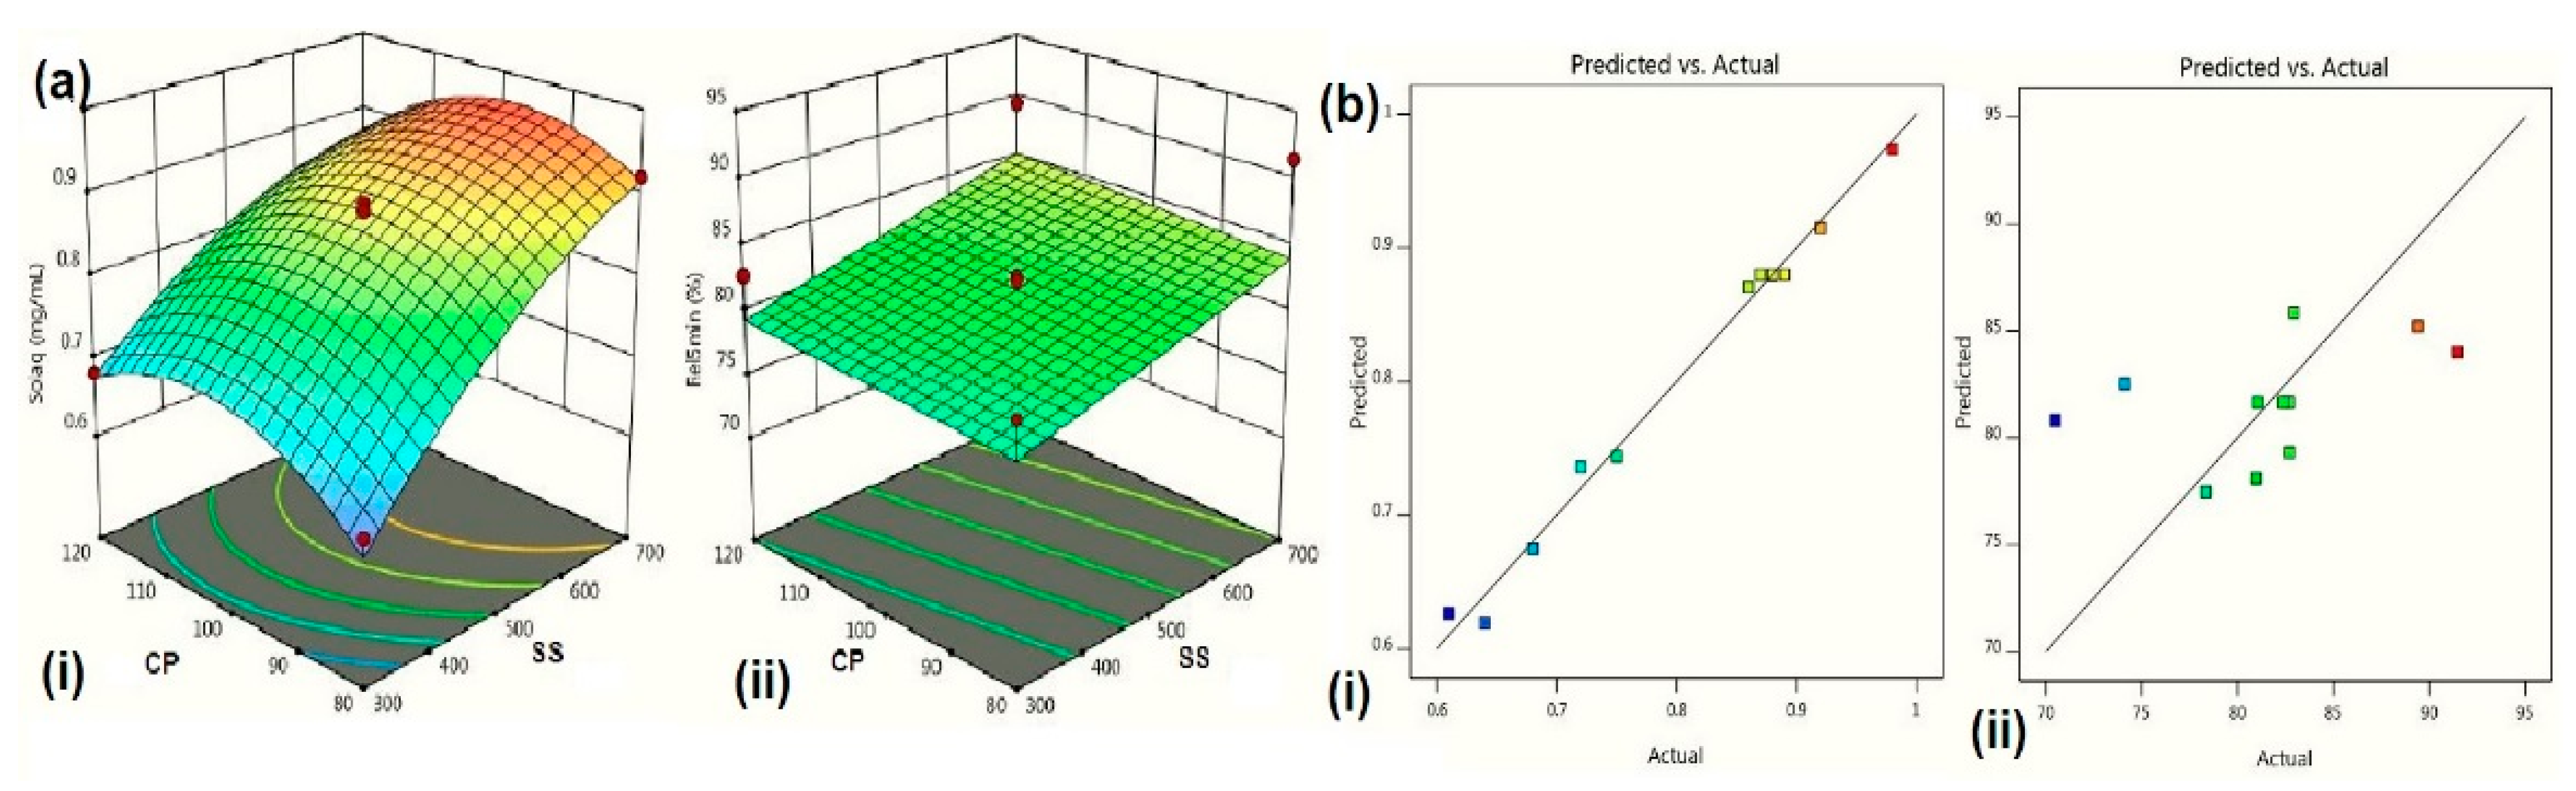
2.6. CCD Outcomes
2.6.1. Sloaq
2.6.2. Rel5min
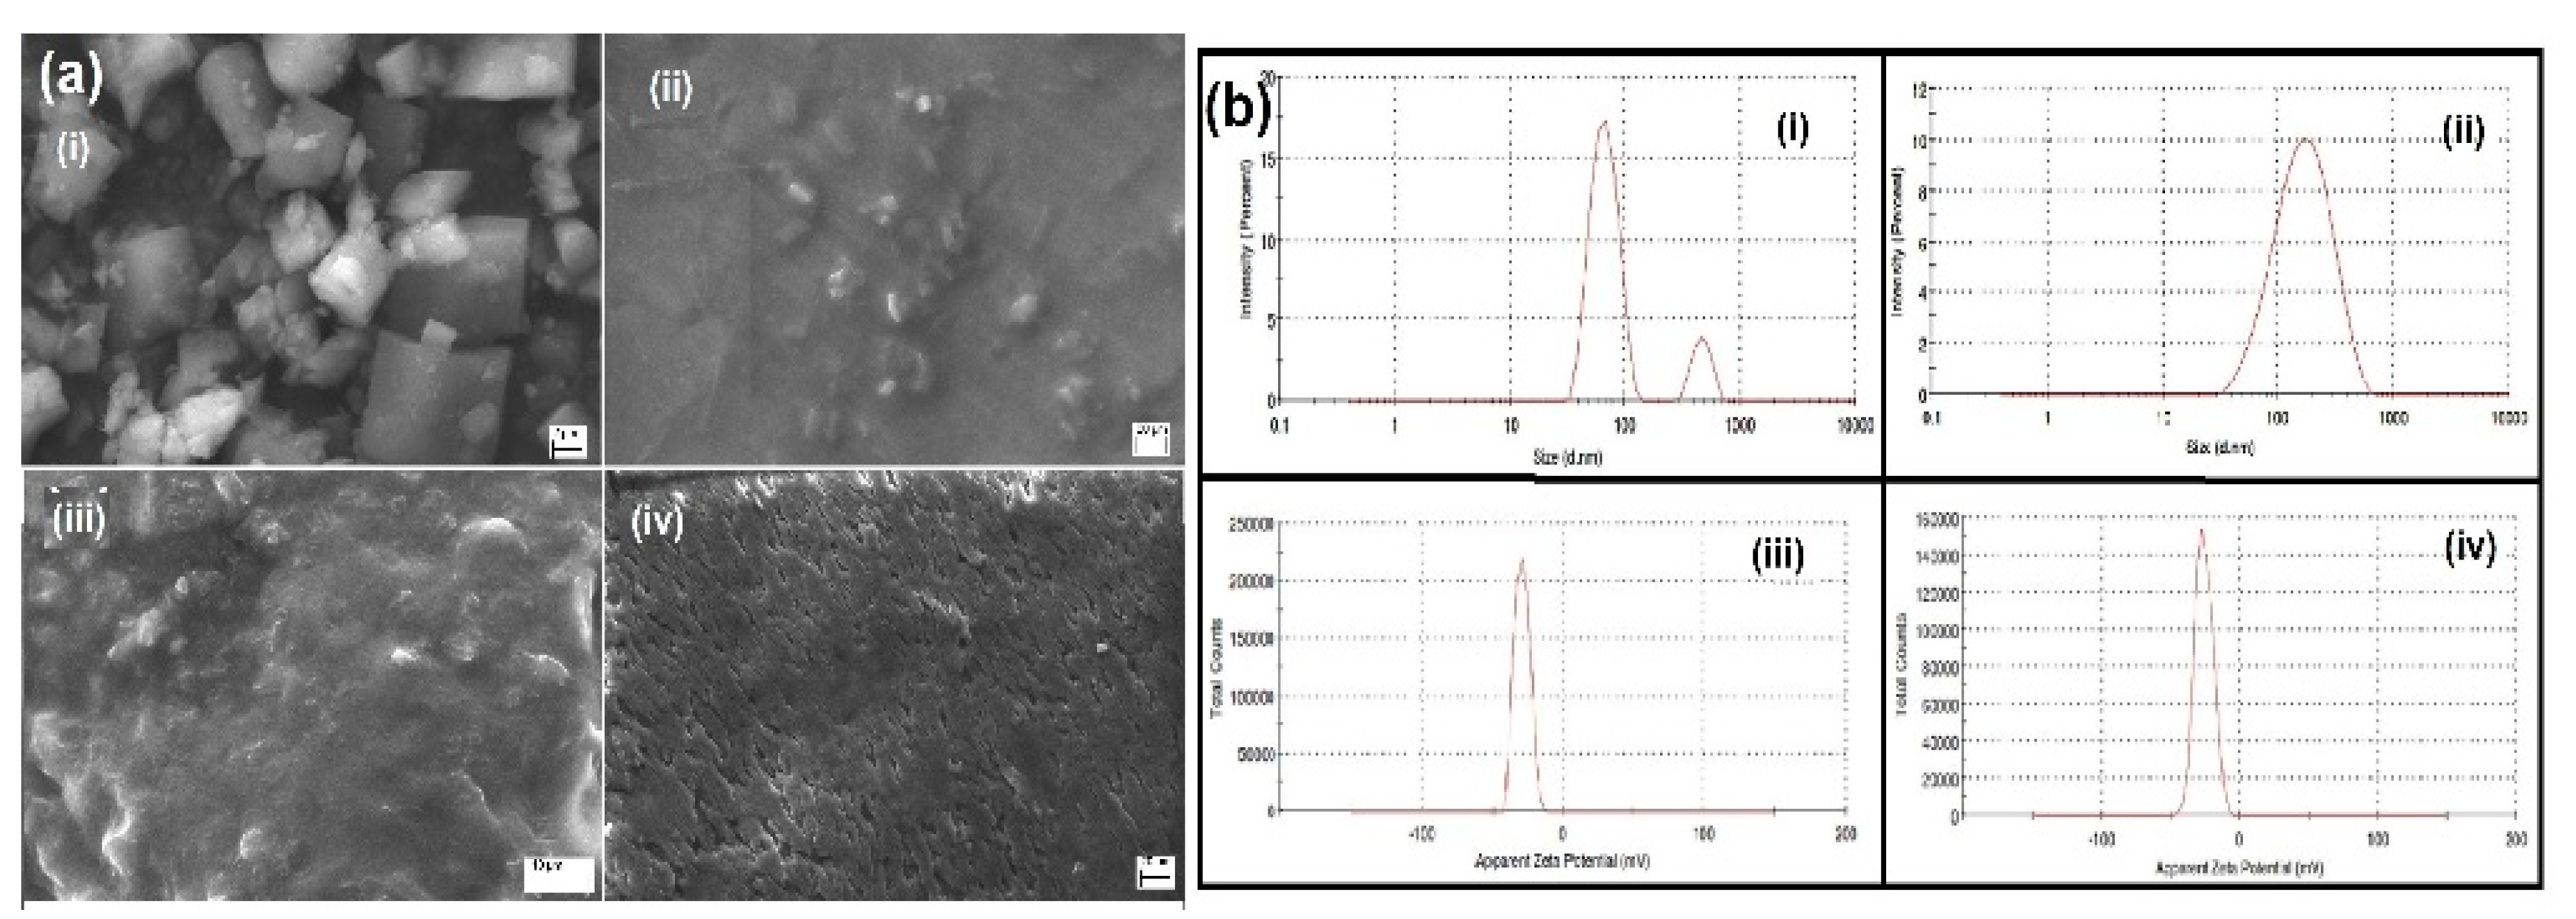
2.7. SEM
2.8. DLS
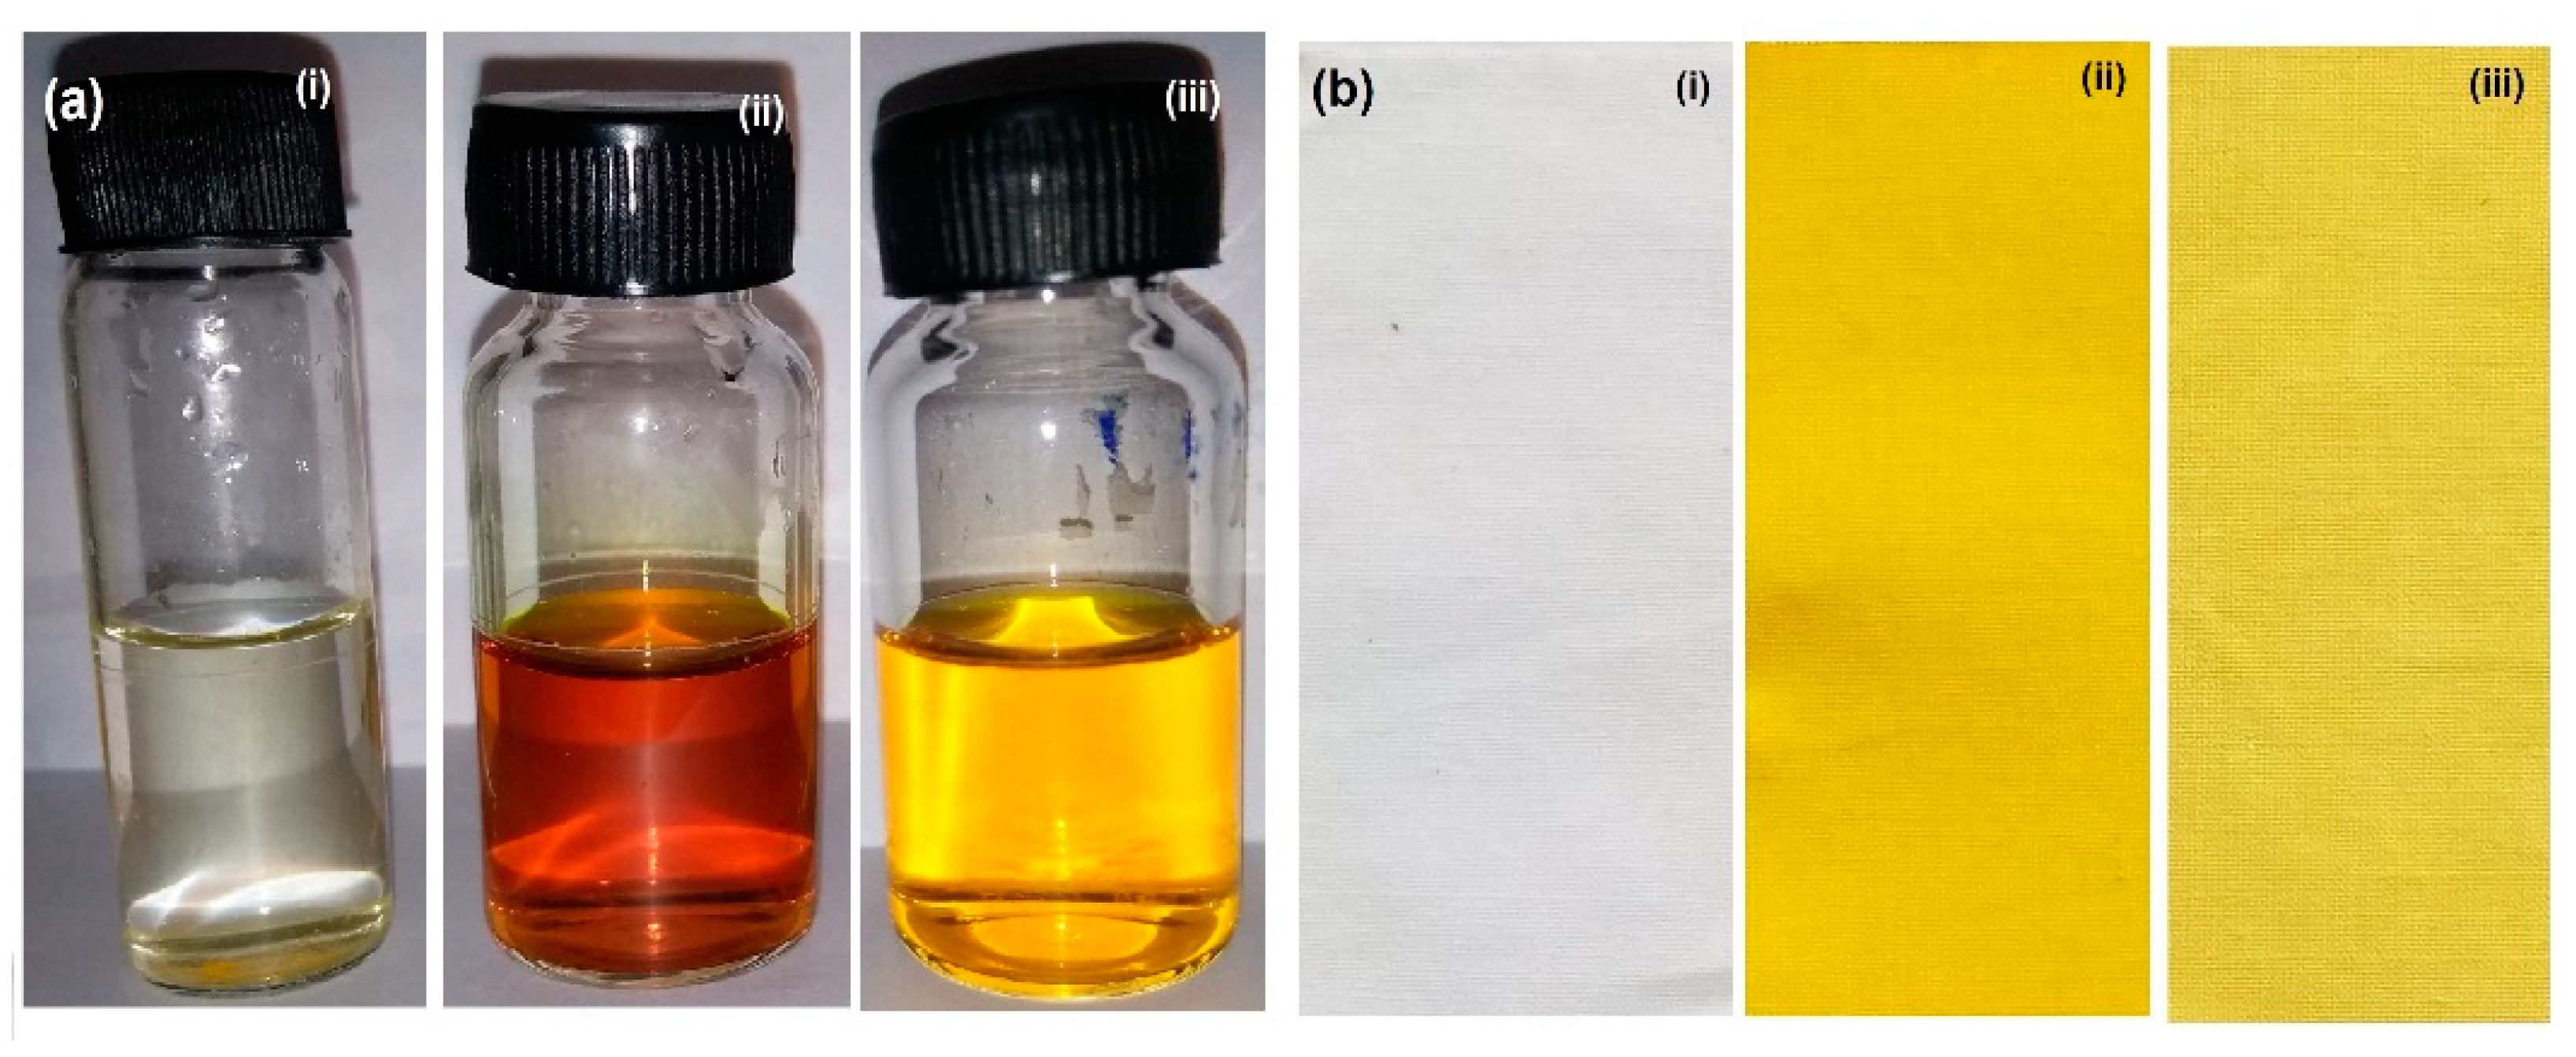
2.9. Dyeing Effect
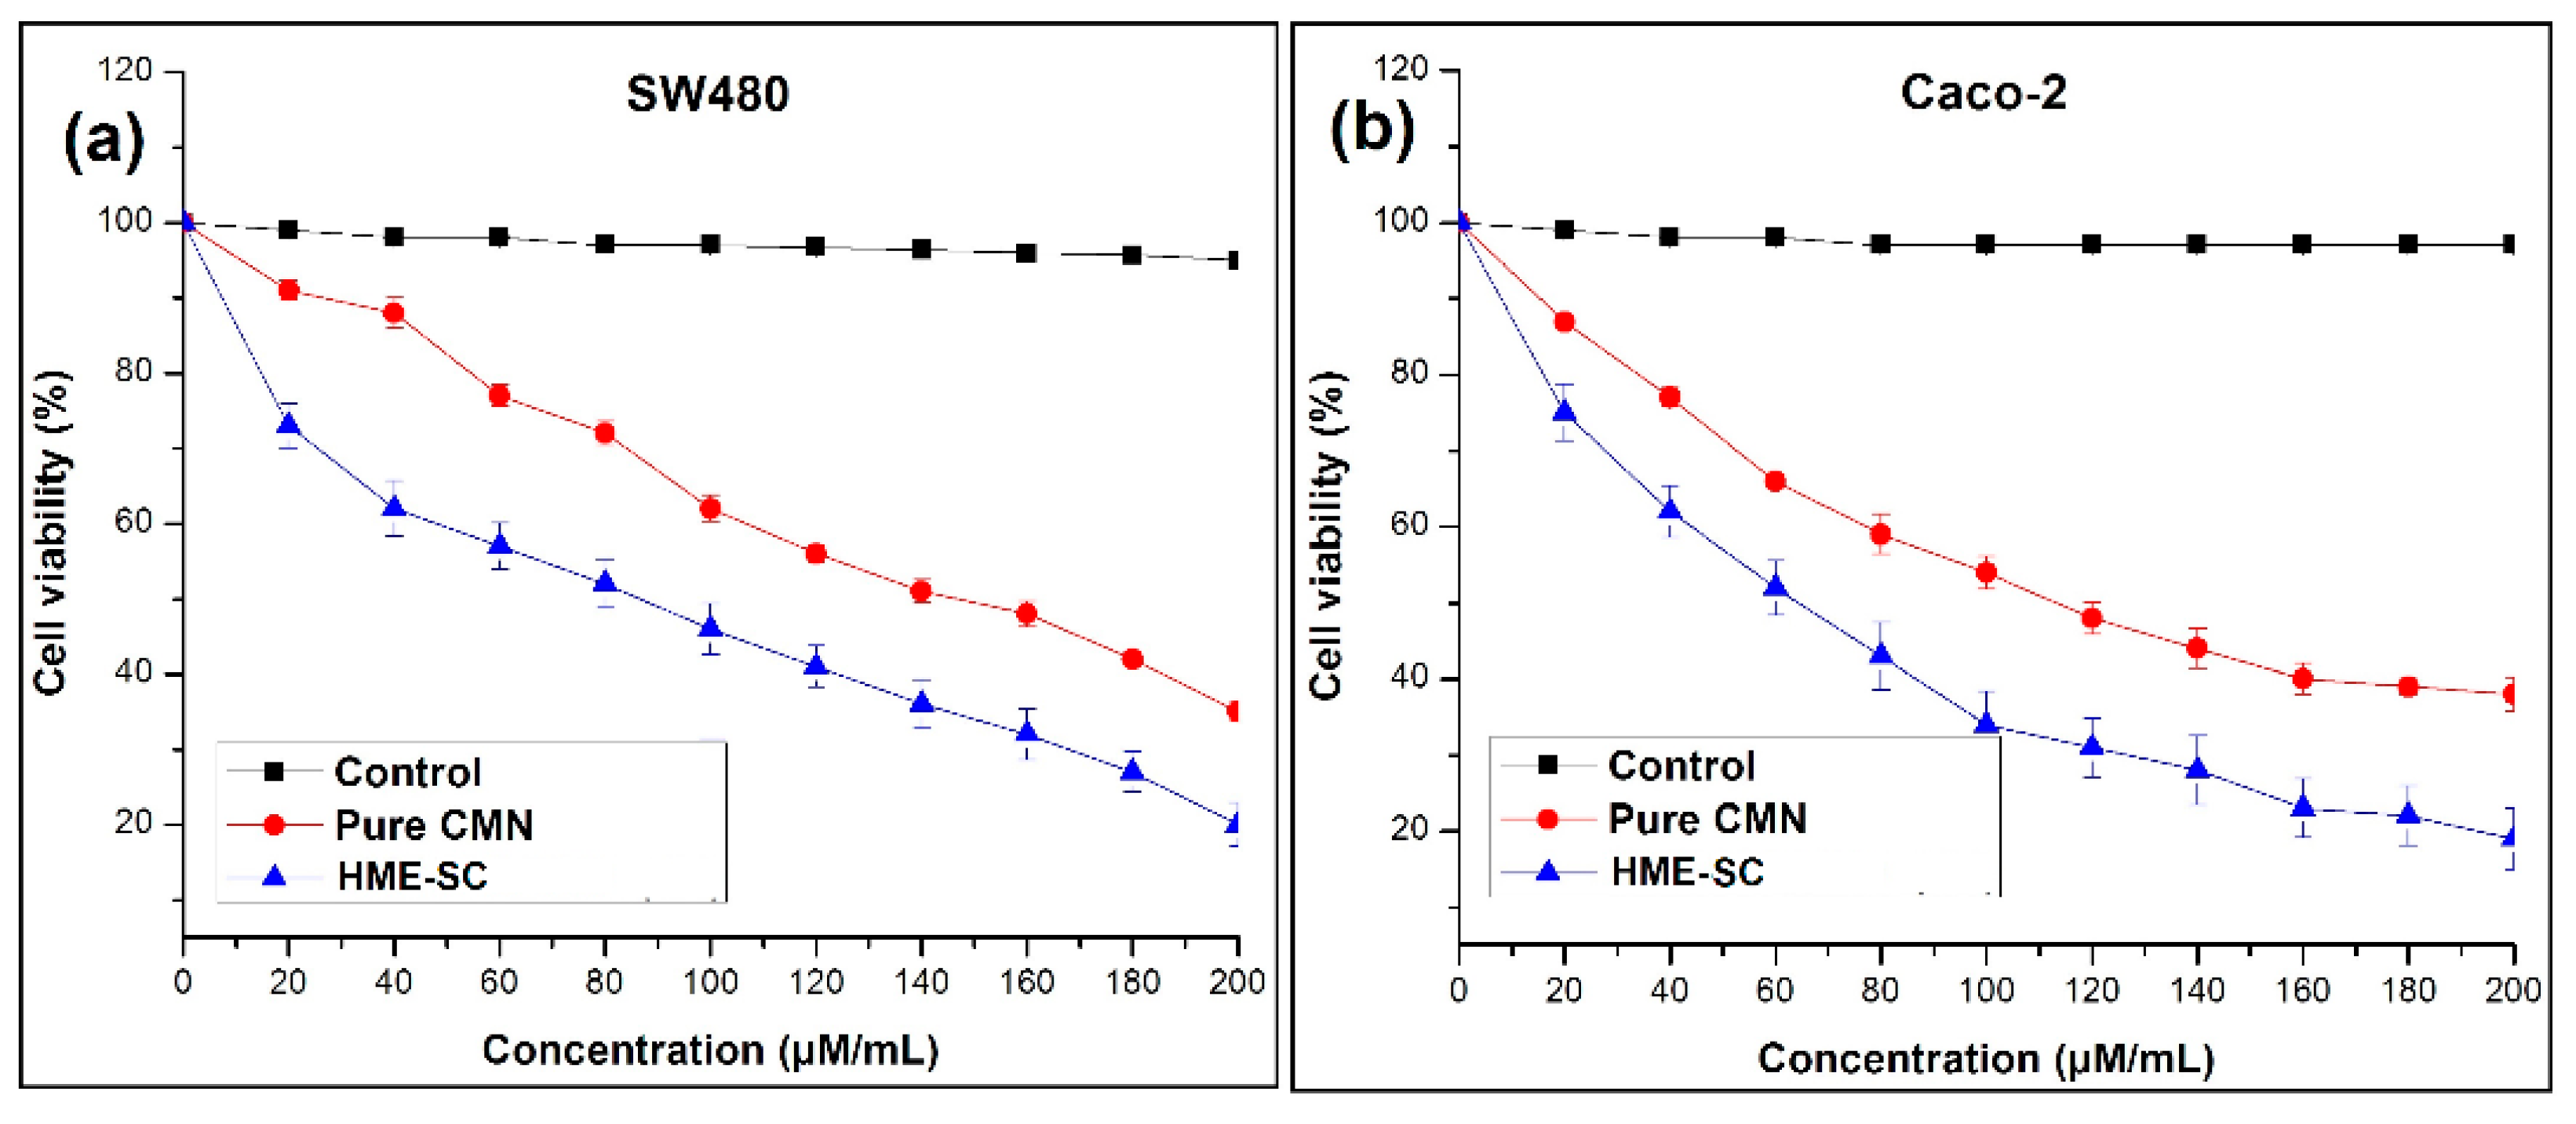
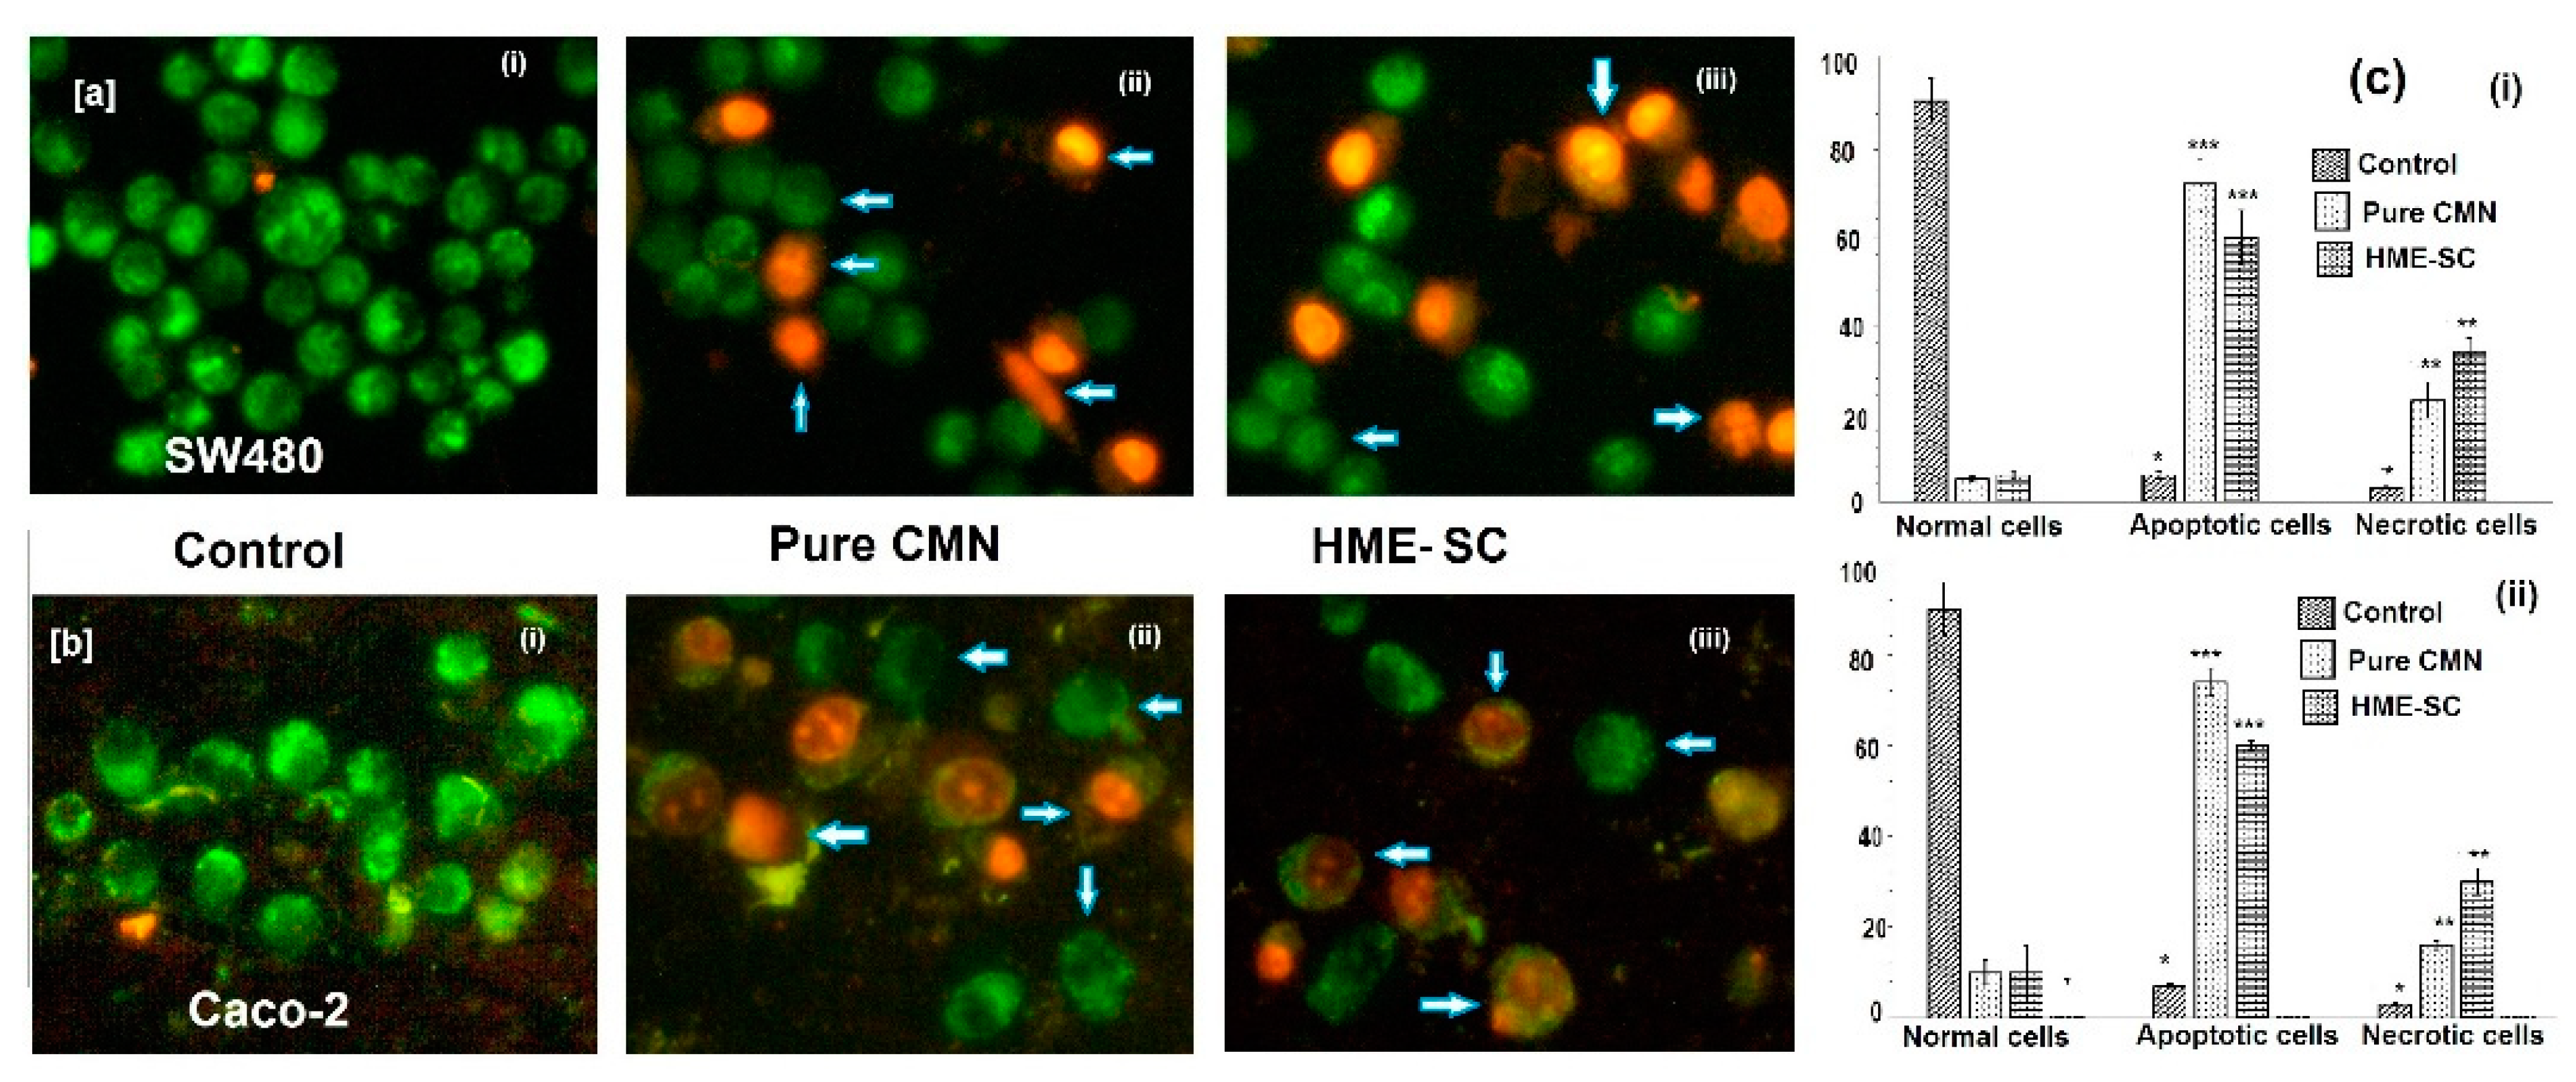
2.10. MTT Assay
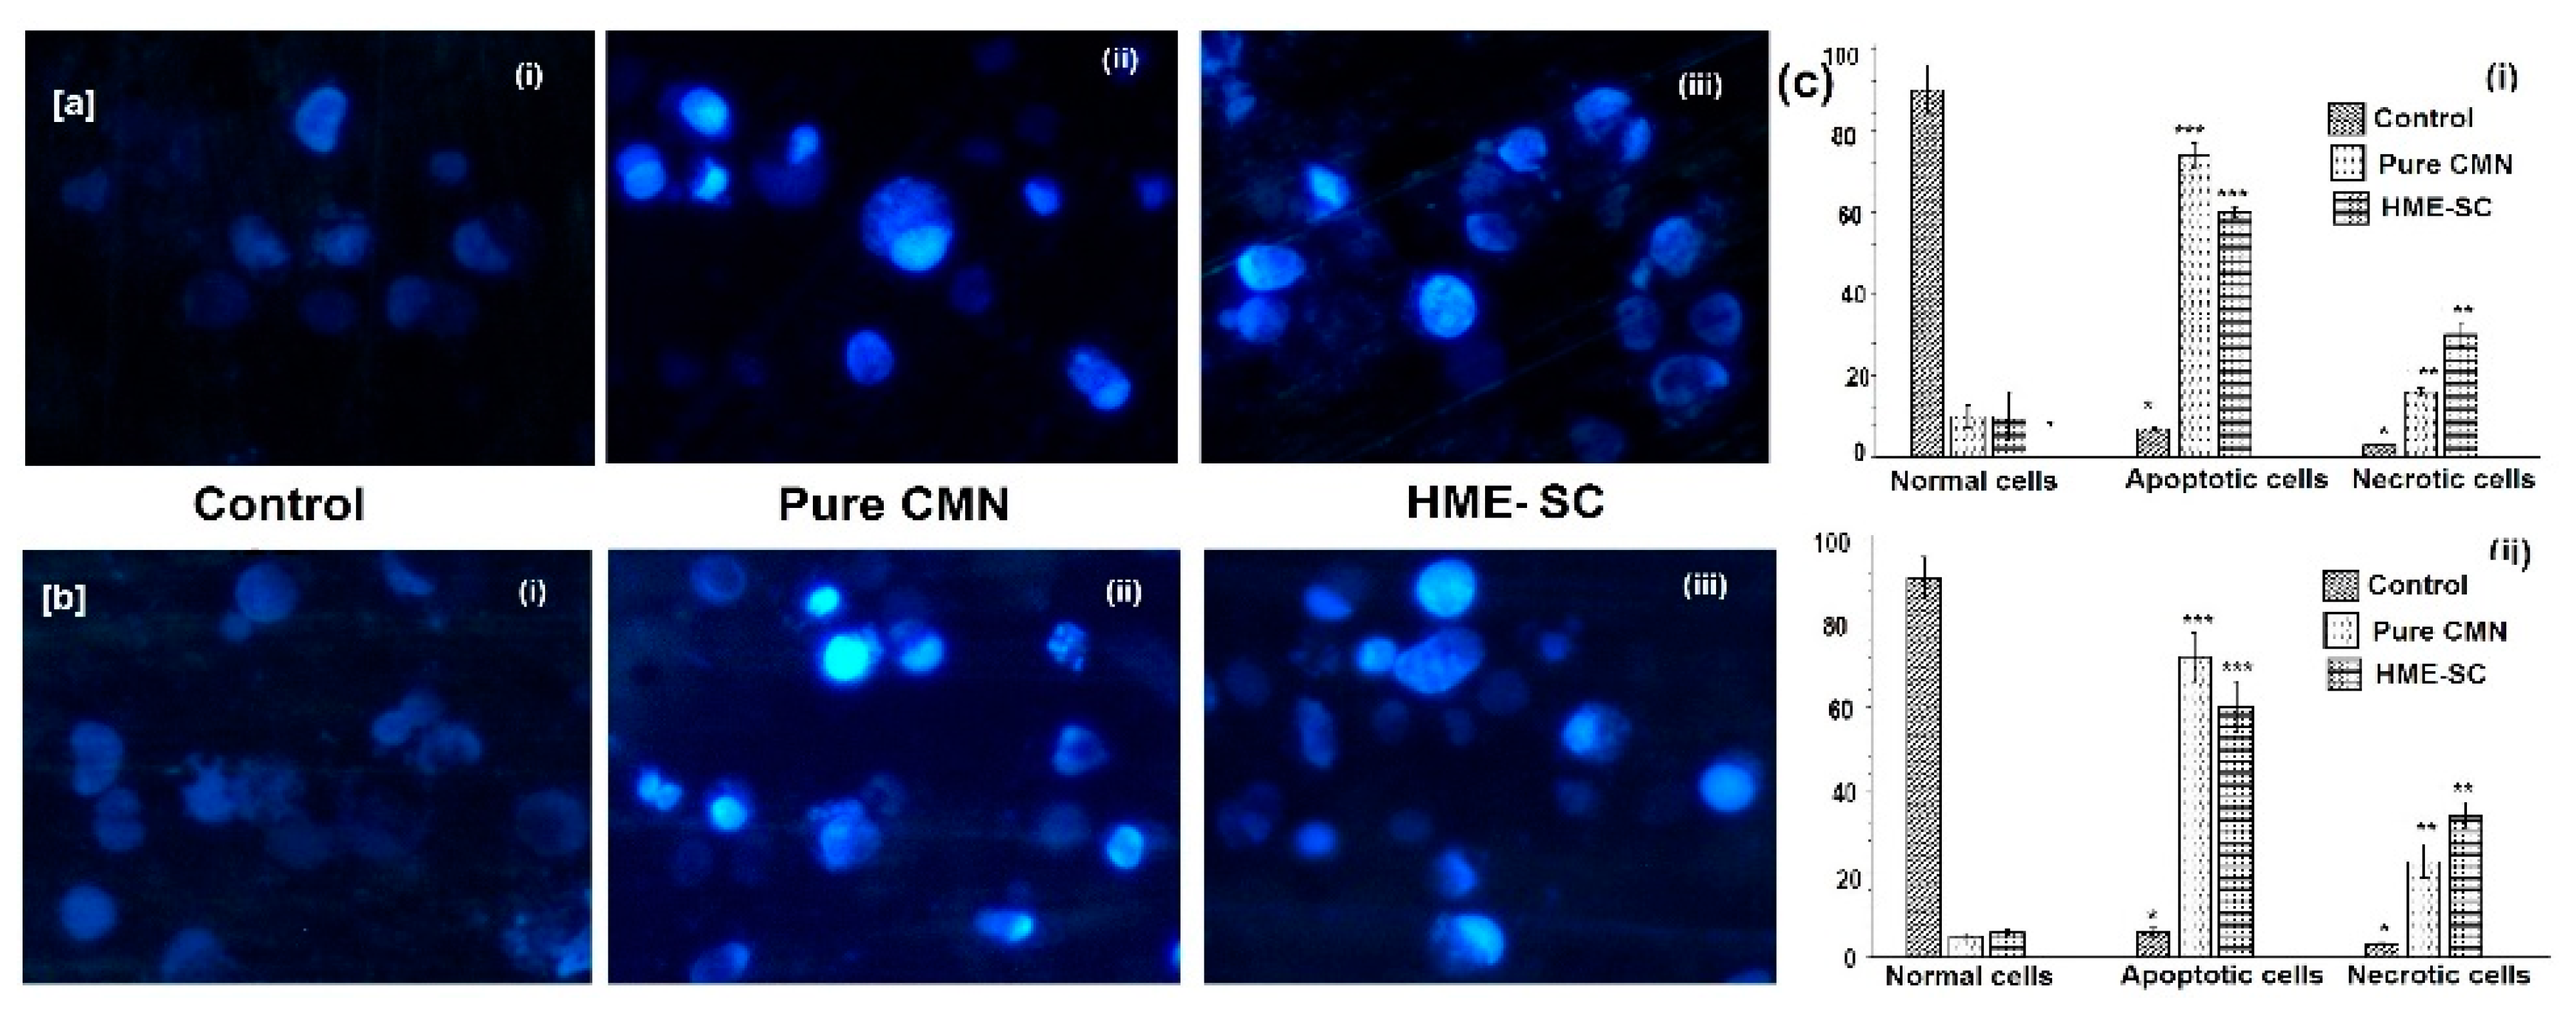
2.11. AO/EB Staining
2.12. Hoechst 33528 Staining
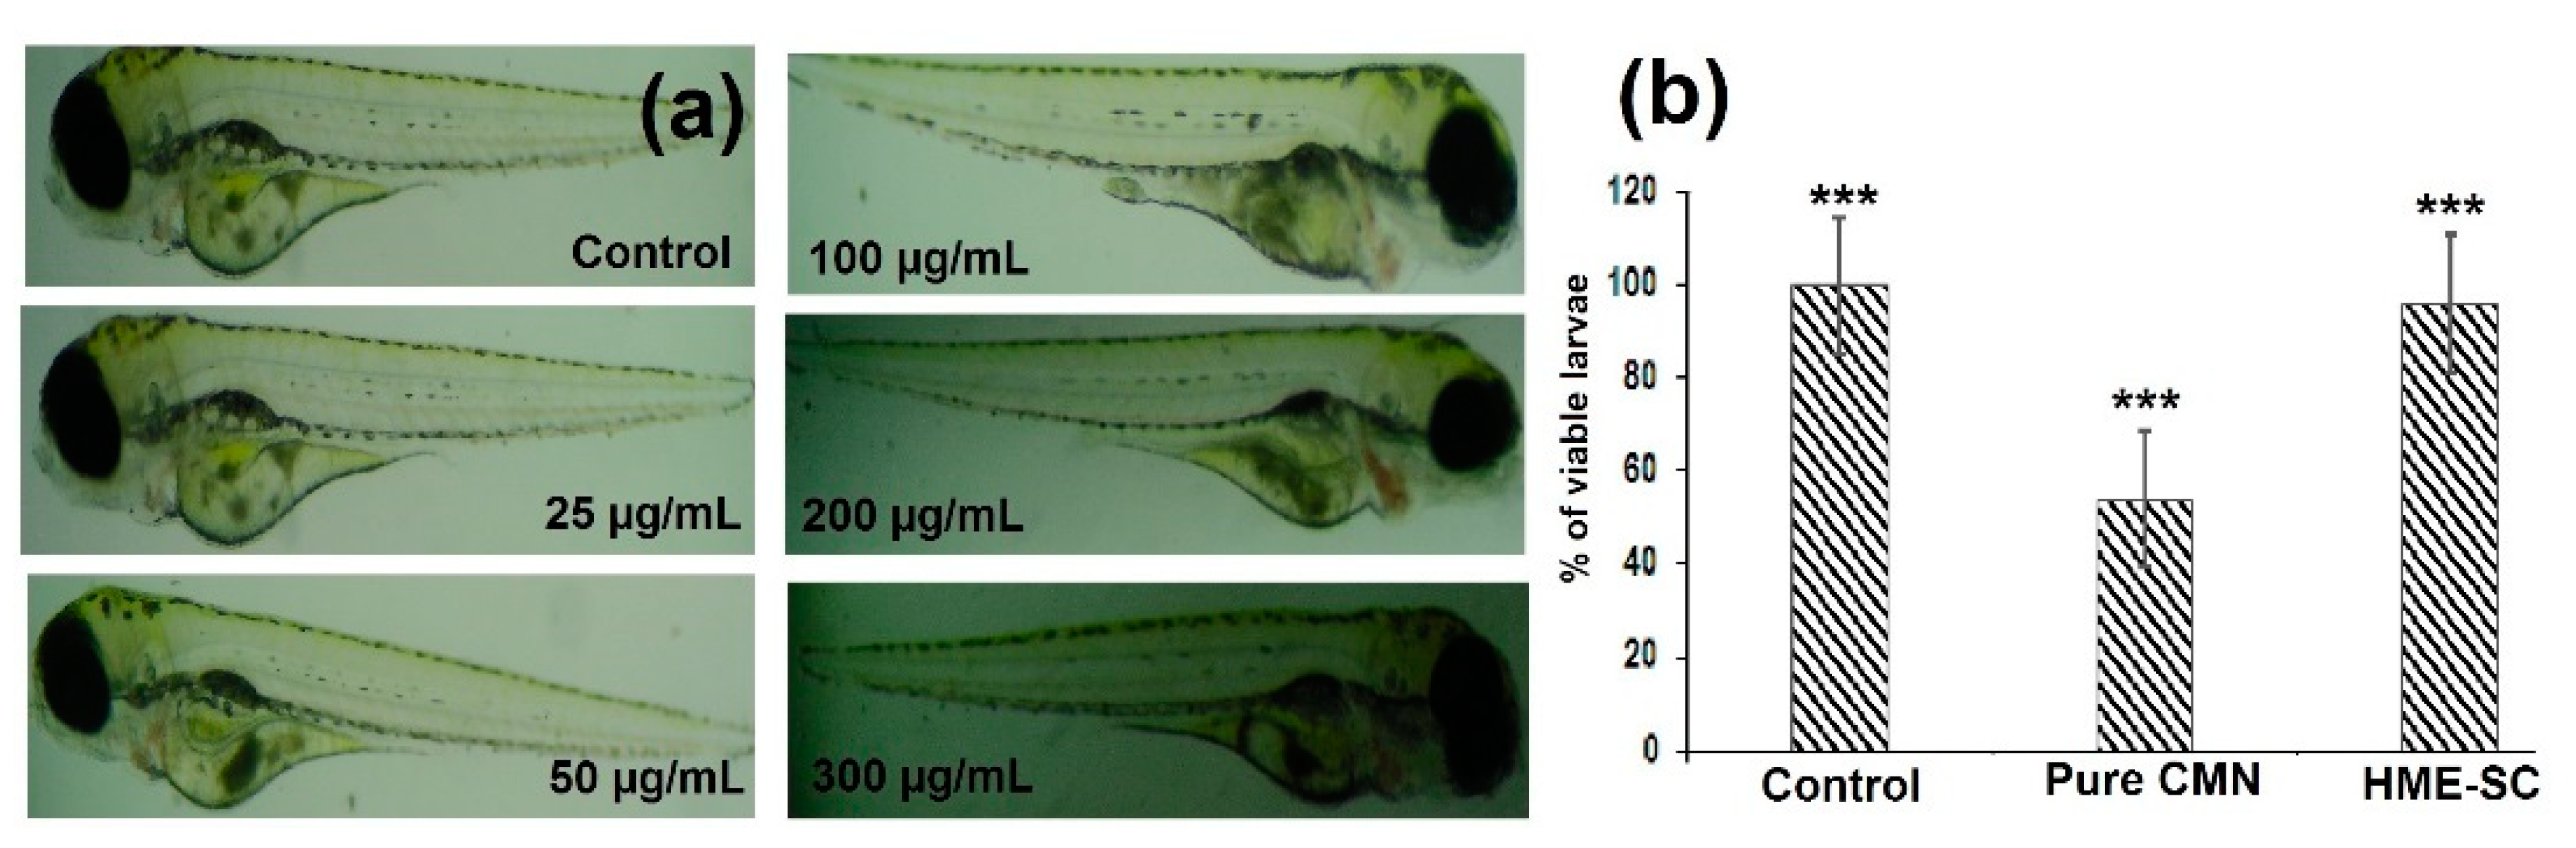
2.13. Toxicity of HME-SC in Zebra Fish Embryos
3. Materials and Methods
3.1. Materials, Cell Lines and Regents
3.2. Phase Solubility (PS) Studies
3.3. Molecular Modelling
3.4. Preparation of Physical Mixture (PM)
3.4.1. Preparation of Soluble Curcumin (SC) by Melt Casting (HM) Method
3.4.2. Preparation of Soluble Curcumin (SC) by Hot-Melt Extrusion (HM) Method
3.5. Aqueous Solubility (Solaq) Study
3.6. Dissolution Study
3.7. Solid State Characteristics
3.7.1. Fourier Transform Infrared Spectrophotometric Analysis (FT-IR)
3.7.2. Powder X-ray Diffraction Analysis (PXRD)
3.7.3. Thermogravimetric Analysis (TGA)
3.7.4. Differential Scanning Calorimetric (DSC) Analysis
3.8. Optimization of Ideal Soluble SC Complex
3.9. Particle Size (PS) Analysis
3.10. Morphology
3.11. Dyeing Experiment
3.12. MTT Assay
3.13. Apoptosis Study
3.13.1. Acridine Orange and Ethidium Bromide (AO/EB) Twin Staining
3.13.2. Hoechst Staining
3.14. In Vivo Zebrafish Toxicity Study
4. Conclusions
Author Contributions
Funding
Institutional Review Board Statement
Informed Consent Statement
Data Availability Statement
Acknowledgments
Conflicts of Interest
References
- Surveillance, Epidemiology, and End Results (SEER) Program. SEER*Stat Database: North American Association of Central Cancer Registries (NAACCR) Incidence–CiNA Analytic File, 1995–2016, for NHIAv2 Origin, Custom File With County, ACS Facts and Figures Projection Project; North American Association of Central Cancer Registries: Springfield, IL, USA, 2019. [Google Scholar]
- Siegel, R.L.; Miller, K.D.; Sauer, A.G.; Fedewa, S.A.; Butterly, L.F.; Anderson, J.C.; Cercek, A.; Smith, R.A.; Jemal, A. Colorectal cancer statistics. CA A Cancer J. Clin. 2020, 70, 145–164. [Google Scholar] [CrossRef] [Green Version]
- Binefa, G.; Rodriguez-Moranta, F.; Teule, A.; Ayas, M. Colorectal cancer: From prevention to personalized medicine. World J. Gastroenterol. WJG 2014, 20, 6786–6808. [Google Scholar] [CrossRef]
- Nathan, C.H.; Alexander, T.R. Colorectal Cancer: Imaging Conundrums. Surg. Oncol. Clin. 2018, 27, 289–302. [Google Scholar]
- Peterková, L.; Kmoníčková, E.; Ruml, T.; Rimpelová, S. Sarco/Endoplasmic Reticulum Calcium ATPase Inhibitors: Beyond Anticancer Perspective. J. Med. Chem. 2020, 63, 1937–1963. [Google Scholar] [CrossRef] [PubMed]
- Zhang, L.; Cheng, X.; Xu, S.; Bao, J.; Yu, H. Curcumin induces endoplasmic reticulum stress-associated apoptosis in human papillary thyroid carcinoma BCPAP cells via disruption of intracellular calcium homeostasis. Medicine 2018, 97, e11095. [Google Scholar] [CrossRef] [PubMed]
- John, M.K.; Xie, H.; Bell, E.C.; Liang, D. Development and pharmacokinetic evaluation of curcumin co-solvent formulation. Anticancer Res. 2013, 33, 4285–4292. [Google Scholar]
- Lopresti, A.L. The Problem of Curcumin and Its Bioavailability: Could Its Gastrointestinal Influence Contribute to Its Overall Health-Enhancing Effects? Adv. Nutr. 2018, 9, 41–50. [Google Scholar] [CrossRef] [PubMed] [Green Version]
- McFall, H.; Sarabu, S.; Shankar, V.; Bandari, S.; Murthy, S.N.; Kolter, K.; Langley, N.; Kim, D.W.; Repka, M.A. Formulation of aripiprazole loaded pH-modulated Solid dispersions via hot-melt extrusion technology: In vitro and In vivo studies. Int. J. Pharm. 2019, 554, 302–311. [Google Scholar] [CrossRef]
- Bansal, S.S.; Goel, M.; Aqil, F.; Vadhanam, M.V.; Gupta, R.C. Advanced drug delivery systems of curcumin for cancer chemoprevention. Cancer Prev. Res. 2011, 4, 1158–1171. [Google Scholar] [CrossRef] [PubMed] [Green Version]
- Beloqui, A.; Coco, R.; Memvanga, P.B.; Ucakar, B.; Rieux, A.; Preat, V. pH-sensitive nanoparticles for colonic delivery of curcumin in inflammatory bowel disease. Int. J. Pharm. 2014, 473, 203–212. [Google Scholar] [CrossRef]
- Andrews, G.P.; Abudiak, O.A.; Jones, D.S. Physicochemical characterization of hot melt extruded bicalutamide-polyvinylpyrrolidone solid dispersions. J. Pharm. Sci. 2010, 99, 1322–1335. [Google Scholar] [CrossRef]
- Fousteris, E.; Tarantili, P.A.; Karavas, E.; Bikiaris, D. Poly (vinyl pyrrolidone)-poloxamer-188 solid dispersions prepared by hot melt extrusion. J. Therm. Anal. Calorim. 2013, 113, 1037–1047. [Google Scholar] [CrossRef]
- Goldberg, A.H.; Gibaldi, M.; Kanig, J.L. Increasing dissolution rates and gastrointestinal absorption of drugs via solid solutions and eutectic mixtures I: Theoretical considerations and discussion of the literature. J. Pharm. Sci. 1965, 54, 1145–1148. [Google Scholar] [CrossRef] [PubMed]
- Repka, M.A.; Shah, S.; Lu, J.; Maddineni, S.; Morott, J.; Patwardhan, K.; Mohammed, N.N. Melt extrusion: Process to product. Expert Opin. Drug Deliv. 2012, 9, 105–125. [Google Scholar] [CrossRef] [PubMed]
- Hwang, I.; Kang, C.Y.; Park, J.B. Advances in hot-melt extrusion technology toward pharmaceutical objectives. J. Pharm. Investig. 2017, 47, 123–132. [Google Scholar] [CrossRef]
- Repka, M.A.; Bandari, S.; Kallakunta, V.R.; Vo, A.Q.; McFall, H.; Pimparade, M.B.; Bhagurkar, A.M. Melt extrusion with poorly soluble drugs—An integrated review. Int. J. Pharm. 2018, 535, 68–85. [Google Scholar] [CrossRef] [PubMed]
- D’souza, A.A.; Shegokar, R. Polyethylene glycol (PEG): A versatile polymer for pharmaceutical applications. Expert Opin. Drug Deliv. 2016, 13, 1257–1275. [Google Scholar] [CrossRef]
- Ali, W.; Williams, A.C.; Rawlinson, C.F. Stoichiometrically governed molecular interactions in drug: Poloxamer solid dispersions. Int. J. Pharm. 2010, 39, 162–168. [Google Scholar] [CrossRef] [PubMed]
- El-Badry, M. Physicochemical Characterization and Dissolution Properties of Meloxicam-Gelucire 50/13 Binary Systems. Sci. Pharm. 2011, 79, 375–386. [Google Scholar] [CrossRef] [Green Version]
- Gangurde, A.B.; Kundaikar, H.S.; Javeer, S.D.; Jaiswar, D.R.; Degani, M.S.; Amin, P.D. Enhanced solubility and dis-solution of curcumin by a hydrophilic polymer solid dispersion and its In-silico molecular modeling studies. J. Drug Deliv. Sci. Technol. 2015, 29, 226–237. [Google Scholar] [CrossRef]
- Palanisamy, M.; Khanam, J. Solid dispersion of prednisolone: Solid state characterization and improvement of dissolution profile. Drug Dev. Ind. Pharm. 2011, 37, 373–386. [Google Scholar] [CrossRef]
- Sadeghi, F.; Ashofteh, M.; Homayouni, A.; Abbaspour, M.; Nokhodchi, A.; Garekani, H.A. Antisolvent precipitation technique: A very romising approach to crystallize curcumin in presence of polyvinyl pyrrolidon for solubility and dissolution enhancement. Colloids Surf. B Biointerfaces 2016, 147, 258–264. [Google Scholar] [CrossRef]
- Li, J.; Lee, I.; Shin, G.H.; Chen, X.; Park, H.J. Curcumin-Eudragit® EPO solid dispersion: A simple and potent method to solve the problems of curcumin. Eur. J. Pharm. Biopharm. 2015, 94, 322–332. [Google Scholar] [CrossRef] [PubMed]
- Ahuja, N.; Katare, O.P.; Singh, B. Studies on dissolution enhancement and mathematical modeling of drug release of a poorly water-soluble drug using water-soluble carriers. Eur. J. Pharm. Biopharm. 2007, 65, 26–38. [Google Scholar] [CrossRef] [PubMed]
- Kurniawansyah, F.; Quachie, L.; Mammucari, R.; Foster, N.R. Improving the dissolution properties of curcumin using dense gas antisolvent technology. Int. J. Pharm. 2017, 521, 239–248. [Google Scholar] [CrossRef] [PubMed]
- Thorat, A.; Dalvi, S.V. Solid-State Phase Transformations and Storage Stability of Curcumin Polymorphs. Cryst. Growth Des. 2015, 15, 1757–1770. [Google Scholar] [CrossRef]
- Jayaramudu, T.; Raghavendra, G.M.; Varaprasad, K.; Reddy, G.V.S.; Reddy, B.; Sudhakar, K.; Sadiku, E.R. Preparation and characterization of poly(ethylene glycol) stabilized nano silver particles by a mechanochemical assisted ball mill process. J. Appl. Polym. Sci. 2016, 133, 43027. [Google Scholar] [CrossRef]
- Pramono, E.; Utomo, S.B.; Wulandari, V.; Clegg, F. The effect of polyethylene glycol Mw 400 and 600 on stability of Shellac Wax free. J. Phys. Conf. Ser. 2016, 776, 12054. [Google Scholar]
- Baig, M.S.; Ahad, A.; Aslam, M.; Imam, S.S.; Aqil, M.; Ali, A. Application of Box-Behnken design for preparation of levofloxacin-loaded stearic acid solid lipid nanoparticles for ocular delivery: Optimization, in vitro release, ocular tolerance and antibacterial activity. Int. J. Biol. Macromol. 2016, 85, 265–270. [Google Scholar] [CrossRef]
- Seelan, T.V.; Henry, L.J.K.; Narra, K.; Lalduhsanga, P.; Kandasamy, K. Design and development of Albizia stipulata gum based controlled-release matrix Tablets in cancer therapeutics. Int. J. Biol. Macromol. 2016, 92, 972–980. [Google Scholar]
- Chaudhary, H.; Kohli, K.; Amin, S.; Rathee, P.; Kumar, V. Optimization and formulation design of gels of diclofenac and curcumin for tranSCermal drug delivery by Box-Behnken statistical design. J. Pharm. Sci. 2011, 100, 580–593. [Google Scholar] [CrossRef] [PubMed]
- Kumar, C.S.; Raja, M.D.; Sundar, D.S.; Antoniraj, M.G.; Ruckmani, K. Hyaluronic acid co-functionalized gold nanoparticle complex for the targeted delivery of metformin in the treatment of liver cancer (HepG2 cells). Carbohydr. Polym. 2015, 128, 63–74. [Google Scholar] [CrossRef]
- Xu, S.; Chen, J.; Wang, B.; Yang, Y. Sustainable and hydrolysis-free dyeing process for polylactic acid using nonaqueous medium. ACS Sustain. Chem. Eng. 2015, 3, 1039–1046. [Google Scholar] [CrossRef] [Green Version]
- Sun, J.; Bi, C.; Chan, H.M.; Sun, S.; Zhang, Q.; Zheng, Y. Curcumin-loaded solid lipid nanoparticles have prolonged in vitro antitumour activity, cellular uptake and improved in vivo bioavailability. Colloids Surf. B Biointerfaces 2013, 111, 367–375. [Google Scholar] [CrossRef] [PubMed]
- Manju, S.; Sreenivasan, K. Gold nanoparticles generated and stabilized by water soluble curcumin–polymer con-jugate: Blood compatibility evaluation and targeted drug delivery onto cancer cells. J. Colloid Interface Sci. 2012, 368, 144–151. [Google Scholar] [CrossRef] [PubMed]
- Abel, S.D.; Baird, S.K. Honey is cytotoxic towards prostate cancer cells but interacts with the MTT reagent: Considerations for the choice of cell viability assay. Food Chem. 2018, 241, 70–78. [Google Scholar] [CrossRef]
- Dhivya, M.; Palaniandavar, M.; Jaividhya, P.; Mathan, G.; Akbarsha, M.A.; RiyaSCeen, A. In vitro antiproliferative and apoptosis-inducing properties of a mononuclear copper (II) complex with dppz ligand, in two genotypically different breast cancer cell lines. Biometals 2015, 28, 929–943. [Google Scholar] [CrossRef] [PubMed]
- Vignesh, G.; Senthilkumar, R.; Periasamy, V.S.; Arunachalam, S.; Paul, S.; Akbarsha, M.A. Protein binding and bi-ological evaluation of a polymer-anchored cobalt (III) complex containing a 2,2⁄ bipyridine ligand. RSC Adv. 2014, 4, 57483–57492. [Google Scholar] [CrossRef]
- Kim, K.T.; Zaikova, T.; Hutchison, J.E.; Tanguay, R.L. Gold nanoparticles disrupt zebra fish eye development and pigmentation. Toxicol. Sci. 2013, 133, 275–288. [Google Scholar] [CrossRef] [Green Version]
- Wu, J.; Lin, C.; Lin, T.; Ken, C.; Wen, Y. Curcumin affects development of zebrafish embryo. Biol. Pharm. Bull. 2007, 30, 1336–1339. [Google Scholar] [CrossRef] [PubMed] [Green Version]
- Higuchi, T.; Connors, K.A. Phase solubility techniques. Adv. Anal. Chem. Instrum. 1965, 4, 117–212. [Google Scholar]
- Moideen, M.M.J.; Alqahtani, A.; Venkatesan, K.; Ahmad, F.; Krisharaju, K.; Gayasuddin, M.; Shaik, R.A.; Ibraheem, K.M.M.; Salama, M.E.D.M.; Abed, S.Y. Application of the Box–Behnken design for the production of soluble curcumin: Skimmed milk powder inclusion complex for improving the treatment of colorectal cancer. Food Sci. Nutr. 2020, 8, 6643–6659. [Google Scholar] [CrossRef]
- Nicolescu, C.; Aramă, C.O.R.I.N.A.; Nedelcu, A.; Monciu, C.M. Phase solubility studies of the inclusion complexes of repaglinide with ß-cyclodextrin and ß-cyclodextrin derivatives. Farmacia 2010, 58, 620–628. [Google Scholar]
- Mohamed, J.M.M.; Alqahtani, A.; Ahmad, F.; Krishnaraju, V.; Kalpana, K. Stoichiometrically Governed Curcumin Solid Dispersion and Its Cytotoxic Evaluation on Colorectal Adenocarcinoma Cells. Drug Des. Dev. Ther. 2020, 14, 4639–4658. [Google Scholar] [CrossRef] [PubMed]
- Almeida, A.; Possemiers, S.; Boone, M.; DeBeer, T.; Quinten, T.; Van Hoorebeke, L.; Remon, J.P.; Vervaet, C. Ethylene vinyl acetate as a matrix for oral sustained release dosage forms produced via hot-melt extrusion. Eur. J. Pharm. Biopharm. 2011, 77, 297–305. [Google Scholar] [CrossRef] [PubMed]
- Mohamed, J.M.M.; Alqahtani, A.; Fatease, A.A.; Alqahtani, T.; Barkat Ali Khan, B.A.; Ashmitha, B.; Vijaya, R. Human hair Keratin composite scaffold: Characterization and biocompatibility study on NIH 3T3 fibroblast cells. Pharmaceuticals 2021, 14, 781. [Google Scholar] [CrossRef]
- Moideen, M.J.M.; Kavitha, K.; Ruckmani, K.; Shanmuganathan, S. Skimmed milk powder and pectin decorated solid lipid nanoparticle containing soluble curcumin used for the treatment of colorectal cancer. J. Food Process Eng. 2020, 43, e13246. [Google Scholar] [CrossRef]
- Mohamed, J.M.; Kavitha, K.; Chitra, K.S.; Nanthineeswari, S. Soluble curcumin prepared using four different carriers by solid dispersions: Phase solubility, molecular modelling and physicochemical characterization. Trop. J. Pharm. Res. 2019, 18, 1581–1588. [Google Scholar]
- Lanxiang, L.; Juan, X.; Hua, Z.; Kun, L.; Wenwen, Z.; Kai, L.; Hong, Z. Inclusion complexes of laccaic acid A with ß-cyclodextrin or its derivatives: Phase solubility, solubilization, inclusion mode and characterization. Dye. Pigment. 2017, 139, 737–746. [Google Scholar]
- Dey, D.; Kaur, G.; Ranjani, A.; Gayathri, L.; Chakraborty, P.; Adhikary, J.; Pasan, J.; Dhanasekaran, D.; Choudhury, A.R.; Akbarsha, M.A.; et al. Trinuclear Zinc-Schiff Base Complex: Biocatalytic Activity and Cytotoxicity. Eur. J. Inorg. Chem. 2014, 2014, 3350–3358. [Google Scholar] [CrossRef]
- Banerjee, S.; Roy, S.; Datta, A.; Mondal, P.; Mishra, M.; Perumalsamy, B.; Thirumurugan, R.; Dharumadurai, D.; Das, S.; Guin, S.P. Solubilization of sodium 3-amino-2-hydroxyanthraquinone-1-sulphonate in sodium dodecyl sulfate micelles explains its permeation in human lung cancer cell. J. Chin. Chem. Soc. 2021, 68, 250–262. [Google Scholar] [CrossRef]
- Mohamed, J.M.; Alqahtani, A.; Ahmad, F.; Krishnaraju, V.; Kalpana, K. Pectin co-functionalized dual layered solid lipid nanoparticle made by soluble curcumin for the targeted potential treatment of colorectal cancer. Carbohydr. Polym. 2021, 252, 117180. [Google Scholar] [CrossRef] [PubMed]


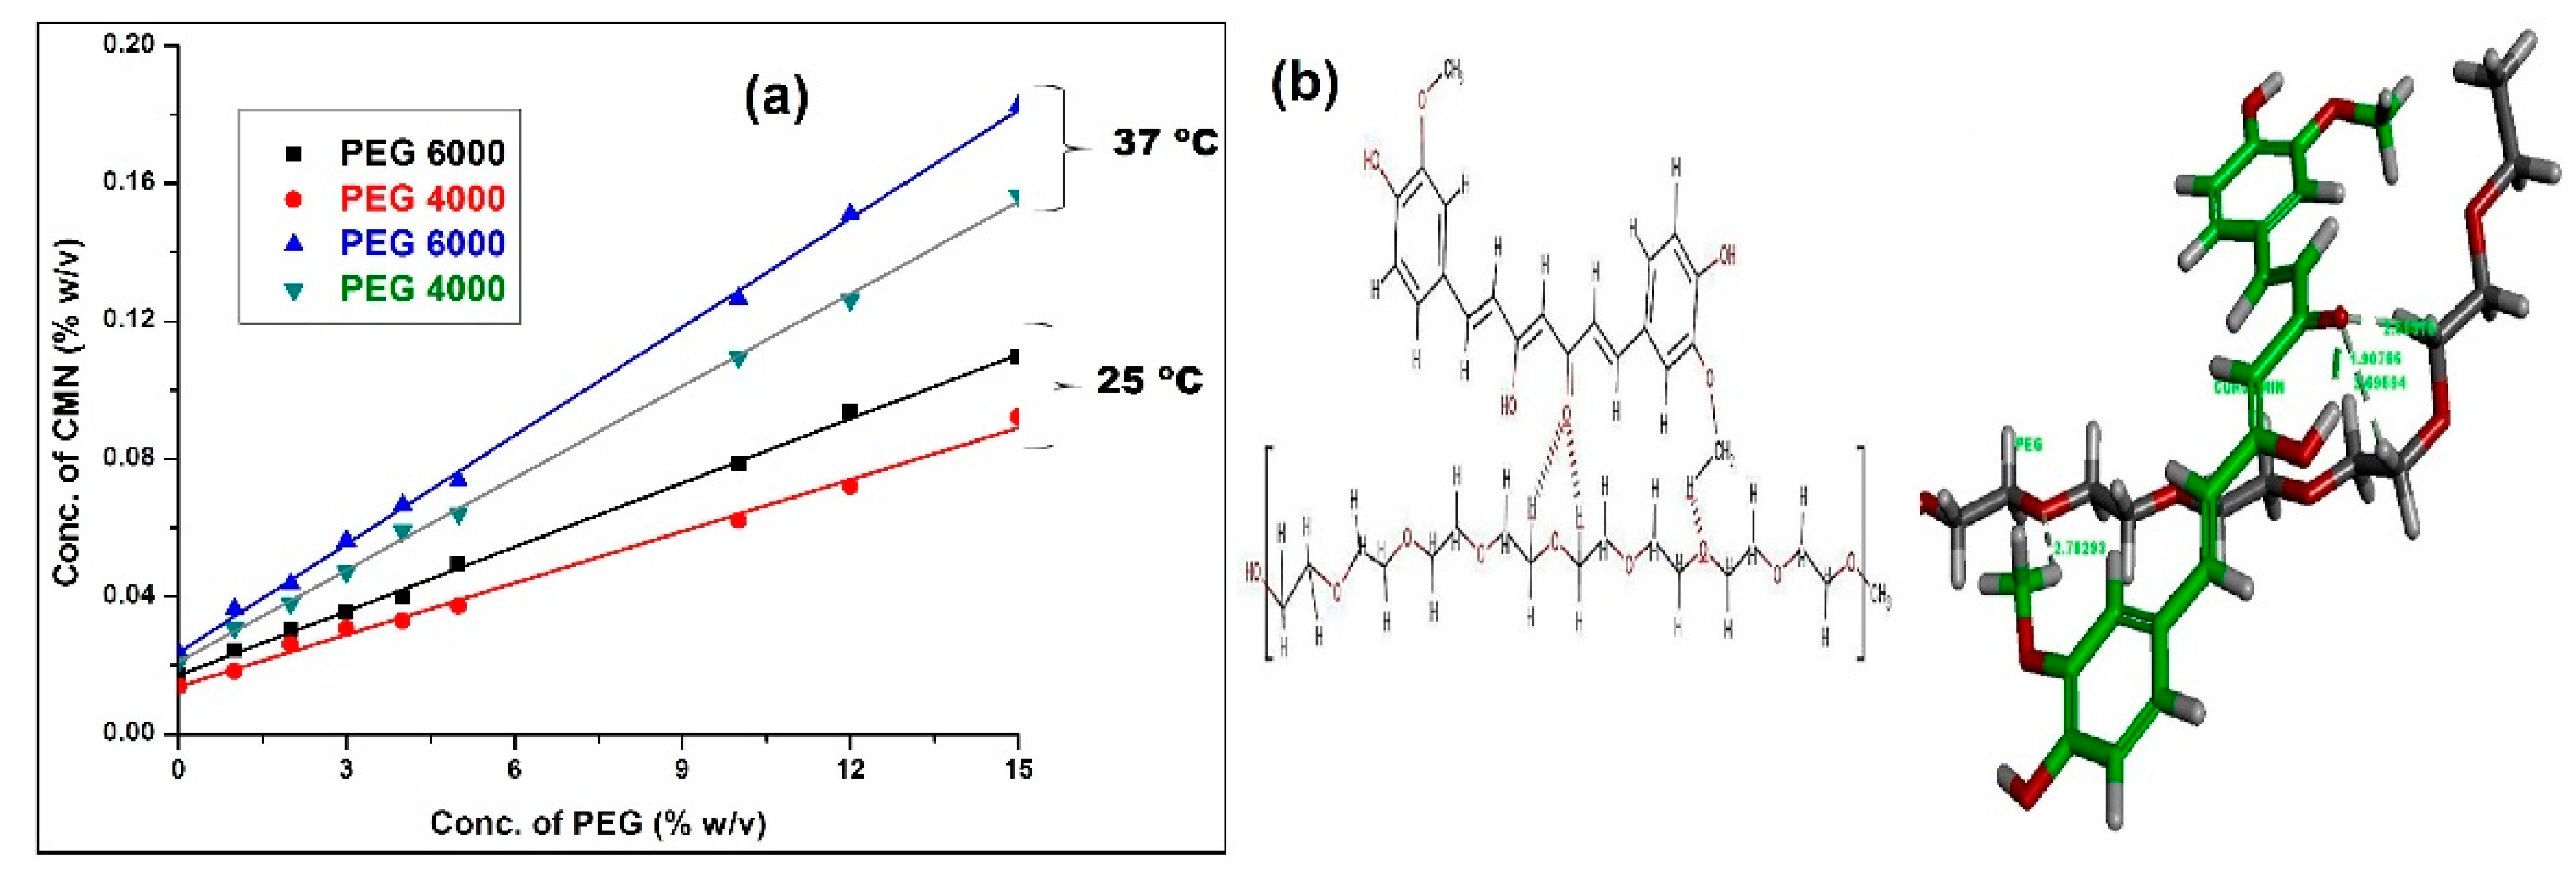
| Carrier | T (°C) | Intercept (Mm) | Ka (M−1) | ΔG (kJ.mol−1) | ΔH (kJ.mol−1) | ΔS (kJ.molK−1) |
|---|---|---|---|---|---|---|
| PEG 4000 | 25 | 3.74 × 10⁻⁴ | 141.38 ± 6.842 | −12.27 ±0.221 | 14.2 ± 0.762 | 0.08882 ± 0.002 |
| 37 | 6.27 × 10⁻⁴ | 176.38 ± 7.874 | −13.33 ± 0.234 | |||
| PEG 6000 | 25 | 4.61 × 10⁻⁴ | 309.79 ± 14.814 | −14.22 ± 0.087 | 12.7 ± 0.567 | 0.09093 ± 0.001 |
| 37 | 6.78 × 10⁻⁴ | 377.89 ± 15.846 | −15.30 ± 0.067 |
| Code | Coded Value | Solaq | Rel5min | |||
|---|---|---|---|---|---|---|
| Y1 | Y2 | |||||
| X1 | X2 | Actual | Predicted | Actual | Predicted | |
| P1 | 300 (−1.00) | 80 (-1.00) | 0.642 | 0.635 | 80.96 | 79.10 |
| P2 | 700 (1.00) | 80 (-1.00) | 0.924 | 0.915 | 91.47 | 88.02 |
| P3 | 300 (−1.00) | 120 (1.00) | 0.681 | 0.675 | 82.71 | 81.30 |
| P4 | 700 (1.00) | 120 (1.00) | 0.864 | 0.87 | 89.41 | 88.23 |
| P5 | 217.157 (−1.41) | 100 (0.00) | 0.614 | 0.626 | 78.35 | 71.35 |
| P6 | 782.843 (1.41) | 100 (1.00) | 0.985 | 0.974 | 82.93 | 83.85 |
| P7 | 500 (0.00) | 71.7157 (−1.41) | 0.722 | 0.732 | 76.49 | 78.48 |
| P8 | 500 (0.00) | 128.284 (+1.41) | 0.758 | 0.744 | 74.11 | 78.02 |
| P9 | 500 (0.00) | 100 (0.00) | 0.881 | 0.880 | 82.62 | 81.66 |
| P10 | 500 (0.00) | 100 (0.00) | 0.89 | 0.880 | 81.05 | 81.66 |
| P11 | 500 (0.00) | 100 (0.00) | 0.882 | 0.880 | 82.48 | 81.66 |
| P12 | 500 (0.00) | 100 (0.00) | 0.878 | 0.880 | 82.7 | 81.66 |
| P13 | 500 (0.00) | 100 (0.00) | 0.889 | 0.880 | 82.36 | 81.66 |
Publisher’s Note: MDPI stays neutral with regard to jurisdictional claims in published maps and institutional affiliations. |
© 2021 by the authors. Licensee MDPI, Basel, Switzerland. This article is an open access article distributed under the terms and conditions of the Creative Commons Attribution (CC BY) license (https://creativecommons.org/licenses/by/4.0/).
Share and Cite
Mohamed, J.M.M.; Alqahtani, A.; Khan, B.A.; Al Fatease, A.; Alqahtani, T.; Venkatesan, K.; Ahmad, F.; Alzghoul, B.I.; Alamri, A. Preparation of Soluble Complex of Curcumin for the Potential Antagonistic Effects on Human Colorectal Adenocarcinoma Cells. Pharmaceuticals 2021, 14, 939. https://doi.org/10.3390/ph14090939
Mohamed JMM, Alqahtani A, Khan BA, Al Fatease A, Alqahtani T, Venkatesan K, Ahmad F, Alzghoul BI, Alamri A. Preparation of Soluble Complex of Curcumin for the Potential Antagonistic Effects on Human Colorectal Adenocarcinoma Cells. Pharmaceuticals. 2021; 14(9):939. https://doi.org/10.3390/ph14090939
Chicago/Turabian StyleMohamed, Jamal Moideen Muthu, Ali Alqahtani, Barkat A. Khan, Adel Al Fatease, Taha Alqahtani, Krishnaraju Venkatesan, Fazil Ahmad, Bashar I. Alzghoul, and Ali Alamri. 2021. "Preparation of Soluble Complex of Curcumin for the Potential Antagonistic Effects on Human Colorectal Adenocarcinoma Cells" Pharmaceuticals 14, no. 9: 939. https://doi.org/10.3390/ph14090939
APA StyleMohamed, J. M. M., Alqahtani, A., Khan, B. A., Al Fatease, A., Alqahtani, T., Venkatesan, K., Ahmad, F., Alzghoul, B. I., & Alamri, A. (2021). Preparation of Soluble Complex of Curcumin for the Potential Antagonistic Effects on Human Colorectal Adenocarcinoma Cells. Pharmaceuticals, 14(9), 939. https://doi.org/10.3390/ph14090939