Article

Highly Efficient T2 Cobalt Ferrite Nanoparticles Vectorized for Internalization in Cancer Cells

by
Eva Mazarío
1,*,
Magdalena Cañete
2,
Fernando Herranz
3,
Jorge Sánchez-Marcos
1,
Jesús M. de la Fuente
4,5,
Pilar Herrasti
1 and
Nieves Menéndez
1
1
Departamento de Química Física Aplicada, Facultad de Ciencias, Universidad Autónoma de Madrid, Francisco Tomás y Valiente 7, Cantoblanco, 28049 Madrid, Spain
2
Departamento de Biología, Facultad de Ciencias, Universidad Autónoma de Madrid, C/Darwin 2, Cantoblanco, 28049 Madrid, Spain
3
Instituto de Química Médica (IQM-CSIC) and CIBER de Enfermedades Respiratorias (CIBERES), Juan de la Cierva 3, 28006 Madrid, Spain
4
Instituto de Nanociencia y Materiales de Aragón, CSIC, Universidad de Zaragoza, C/Pedro Cerbuna 12, 50009 Zaragoza, Spain
5
Networking Biomedical Research Centre of Bioengineering, Biomaterials and Nanomedicine (CIBER-BBN), 28029 Madrid, Spain
*
Author to whom correspondence should be addressed.
Pharmaceuticals 2021, 14(2), 124; https://doi.org/10.3390/ph14020124
Submission received: 4 January 2021 / Revised: 1 February 2021 / Accepted: 2 February 2021 / Published: 5 February 2021

Abstract

:
Uniform cobalt ferrite nanoparticles have been synthesized using an electrochemical synthesis method in aqueous media. Their colloidal, magnetic, and relaxometric properties have been analyzed. The novelty of this synthesis relies on the use of iron and cobalt foils as precursors, which assures the reproducibility of the iron and cobalt ratio in the structure. A stable and biocompatible targeting conjugate nanoparticle-folic acid (NP-FA) was developed that was capable of targeting FA receptor positivity in HeLa (human cervical cancer) cancer cells. The biocompatibility of NP-FA was assessed in vitro in HeLa cells using the MTT assay, and morphological analysis of the cytoskeleton was performed. A high level of NP-FA binding to HeLa cells was confirmed through qualitative in vitro targeting studies. A value of 479 Fe+Co mM−1s−1 of transverse relaxivity (r2) was obtained in colloidal suspension. In addition, in vitro analysis in HeLa cells also showed an important effect in negative T2 contrast. Therefore, the results show that NP-FA can be a potential biomaterial for use in bio medical trials, especially as a contrast agent in magnetic resonance imaging (MRI).

Graphical Abstract

1. Introduction

Magnetic nanoparticles (NPs) in general have received substantial attention for their theranostic potential activity (ability to combine therapeutic and diagnostic agents within the same device). Some of the most important characteristics in the nanometer regime that can be tunable to optimize the magnetic properties needed for an effective imaging and thermal activation are the saturation of magnetization, coercivity, and magnetocrystalline anisotropy [1]. Among others, ferrite nanoparticles have attracted special attention in the last decades because they are easily synthesizable. There is a great variety of synthesis methods, that are inexpensive and easy to perform, resulting in ferrites with excellent crystallinity and magnetic properties [2,3,4].
The superparamagnetic (SPM) character and large magnetic moments of ferrite magnetic nanoparticles convert them into good candidates to be used as magnetic resonance imaging (MRI) contrast agents, which results from the cooperativity of the individual spins when aligned in the presence of an external magnetic field. SPM nanoparticles perturb the external magnetic field, decreasing the relaxation times (T1 or T2) by defocusing the magnetization vector (M) ensemble in the precession axis, being T1 the relaxation time of My parallel to the precession axis and T2 the relaxation time of the magnetization vector (Mx,y) in the perpendicular plane to the precession axis. Therefore, these magnetic field perturbations are responsible for the changed relaxivities of the water molecules measured. This produces a darker intensity signal in the case of perpendicular or T2 relaxation and a brighter signal for T1 or parallel relaxation. The greater the relaxation of the material, the better its behavior as a contrast agent should be, without taking into consideration biological factors that can alter its behavior, such as due to issues pertaining to their stability, aggregation, low cell internalization dose, or incomplete clearance. To improve the efficiency of T2 contrast agents, it is necessary to control the magnetic properties of the NPs through the design of the physical chemical properties, such as composition, crystalline structure, shape, hydrodynamic size, surface charge, and the nature of the coating. These characteristics also affect the biodistribution, stability, opsonization, and metabolism. Among all these physicochemical parameters, only three magnetic characteristics directly determine the T2 relaxivity: (1) saturation of magnetization value, (2) magnetic material volume fraction, (3) the intra-aggregate volume fraction occupied by the magnetic materials relative to the whole (hydrodynamic) sphere [5].
Previous reports highlight the relationship between the size of the NPs, the saturation magnetization (Ms), and the r2 values. The larger the size and the Ms value, the higher the r2 relaxivity of the NPs [6]. Changes in the magnetic properties of the NPs are also observed depending on the synthesis method used [7,8]. These differences are mainly attributed to changes in the crystallographic order of the material or the presence of impurities. Another approach widely described in the literature is the modification of the contrast efficiency by tuning the composition and structure of the organic coating [9,10,11]. Although most commercial contrast agents are Gd-based, some other compounds based on iron oxides have come to be commercialized, such as Resovist, Lumirem etc., but their production was abandoned after a few years, due to toxicity and adverse effect problems [12]. Another strategy, based on the doping of iron oxide NPs with cations with atomic radii similar to Fe2+, such as Co, Ni, Mn, and Zn, has been carried out [13,14,15]. Taking into account an inversion degree of 100% in the spinel structure, AB2O4, this means that all the doped elements are placed in the B position, and the magnetic moment per formula unit corresponds to the μB of the doped cation. Considering the spin quantum numbers of Mn2+, Ni2+, and Co2+ cations, which correspond to S = 5/2, 3/2, and 1, respectively, the equivalent number of μB for paramagnetic transition metal cations can be estimated as follows: μ B = 2 · S · S + 1 . Those magnetic moments correspond to the maximum theoretical values of 5.9 μB, 3.9 μB, and 2.8 μB for MnFe2O4, NiFe2O4, and CoFe2O4 ferrite structures. However, in the nanometric scale, the saturation magnetization is always lower than the bulk magnetization due to magnetic disorder of the surface. In any case, these ferrites show good performance as T2 contrast agents. Some examples from the literature show r2 values of approximately 358 mM−1s−1 for manganese ferrites with an Ms value of 110 emug−1 (Mn+Fe). An r2 value of approximately 394 mM−1s−1 has already been published by our group for electrochemically synthetized Mn0.5Fe2.5O4, with an Ms value of 108 emug−1 (Fe + Mn) [16]. Values of r2 = 152 mM−1s−1 with Ms = 85 emug−1 (Fe + Ni) were found for nickel ferrite [17,18]. Finally, in the case of cobalt ferrite NPs, several works have been published concerning several factors. For example, the relationship between sizes, Ms, and transverse relaxivity (r2) values has been evaluated for cobalt ferrite nanocubes (NCs) in the range of 6–25 nm [15]. Albino et al. recently published the effect of the Zn inclusion in the cobalt ferrite structure, in the r2 relaxometric value. They established an optimal Zn substitution of 0.4 in the spinel unit formula to obtain an r2 value about 500 mM−1s−1 for 8 nm nanoparticles [19]. An improved modification of cobalt ferrite contrast agent has been carried out, doping with europium and encapsulated into mesoporous silica [20]. Novel T2 contrast agent materials recently published are focused on carbon-coated paramagnetic dysprosium oxide (DYO@C) nanoparticles [21].
Optimization of the magnetic properties is not the only point to be fulfilled. The stability and in vivo biocompatibility are also a forefront in the design of our nanoparticle MRI contrast agents. The long-term stability of these particles without agglomeration or precipitation is an important requirement for almost any application of magnetic nanoparticles. Moreover, certain types of coatings could favor targeting to specific organs and, therefore, an increase in the accumulation of the contrast agent in the desired area [22,23]. Among other small molecules, folic acid is well known as a target molecule that recognizes folate receptors overexpressed in certain tumor cell lines [24].
Under physiological conditions, most NPs penetrate the cells by endocytosis. Most endocytic pathways include lysosomes, where the degradation of nanoparticles takes place and reduces the diameter depending on the nature of the coating. This size reduction diminishes the in vitro signal and therefore reduces the final T2 contrast signal [25,26]. Finally, the cytotoxicity and cellular uptake of NPs also depend on morphological parameters of the particles, such as size, shape, coating, and surface charge, as well as biological parameters, such as cell line type, particle concentration, medium composition, and temperature.
Here, we propose the electrosynthesis of cobalt ferrite nanoparticles conjugated with folic acid for the specific recognition of the folate receptor expressed at the surface of cancer cells (HeLa). We characterized the nanocomposite (NP-FA) using Fourier transform infrared spectroscopy (FTIR), dynamic light scattering (DLS), and thermogravimetric analysis (TGA). The saturation magnetization values of cobalt ferrite nanostructures were measured by a superconducting quantum interference device (SQUID). Afterwards, the cytotoxicity and cytoskeleton morphology were evaluated after nanoparticle incubation. Finally, in vitro MRI relaxivity measurements of HeLa cells internalized with ferrite nanostructures were investigated for application in biomedicine.

2. Results and Discussion

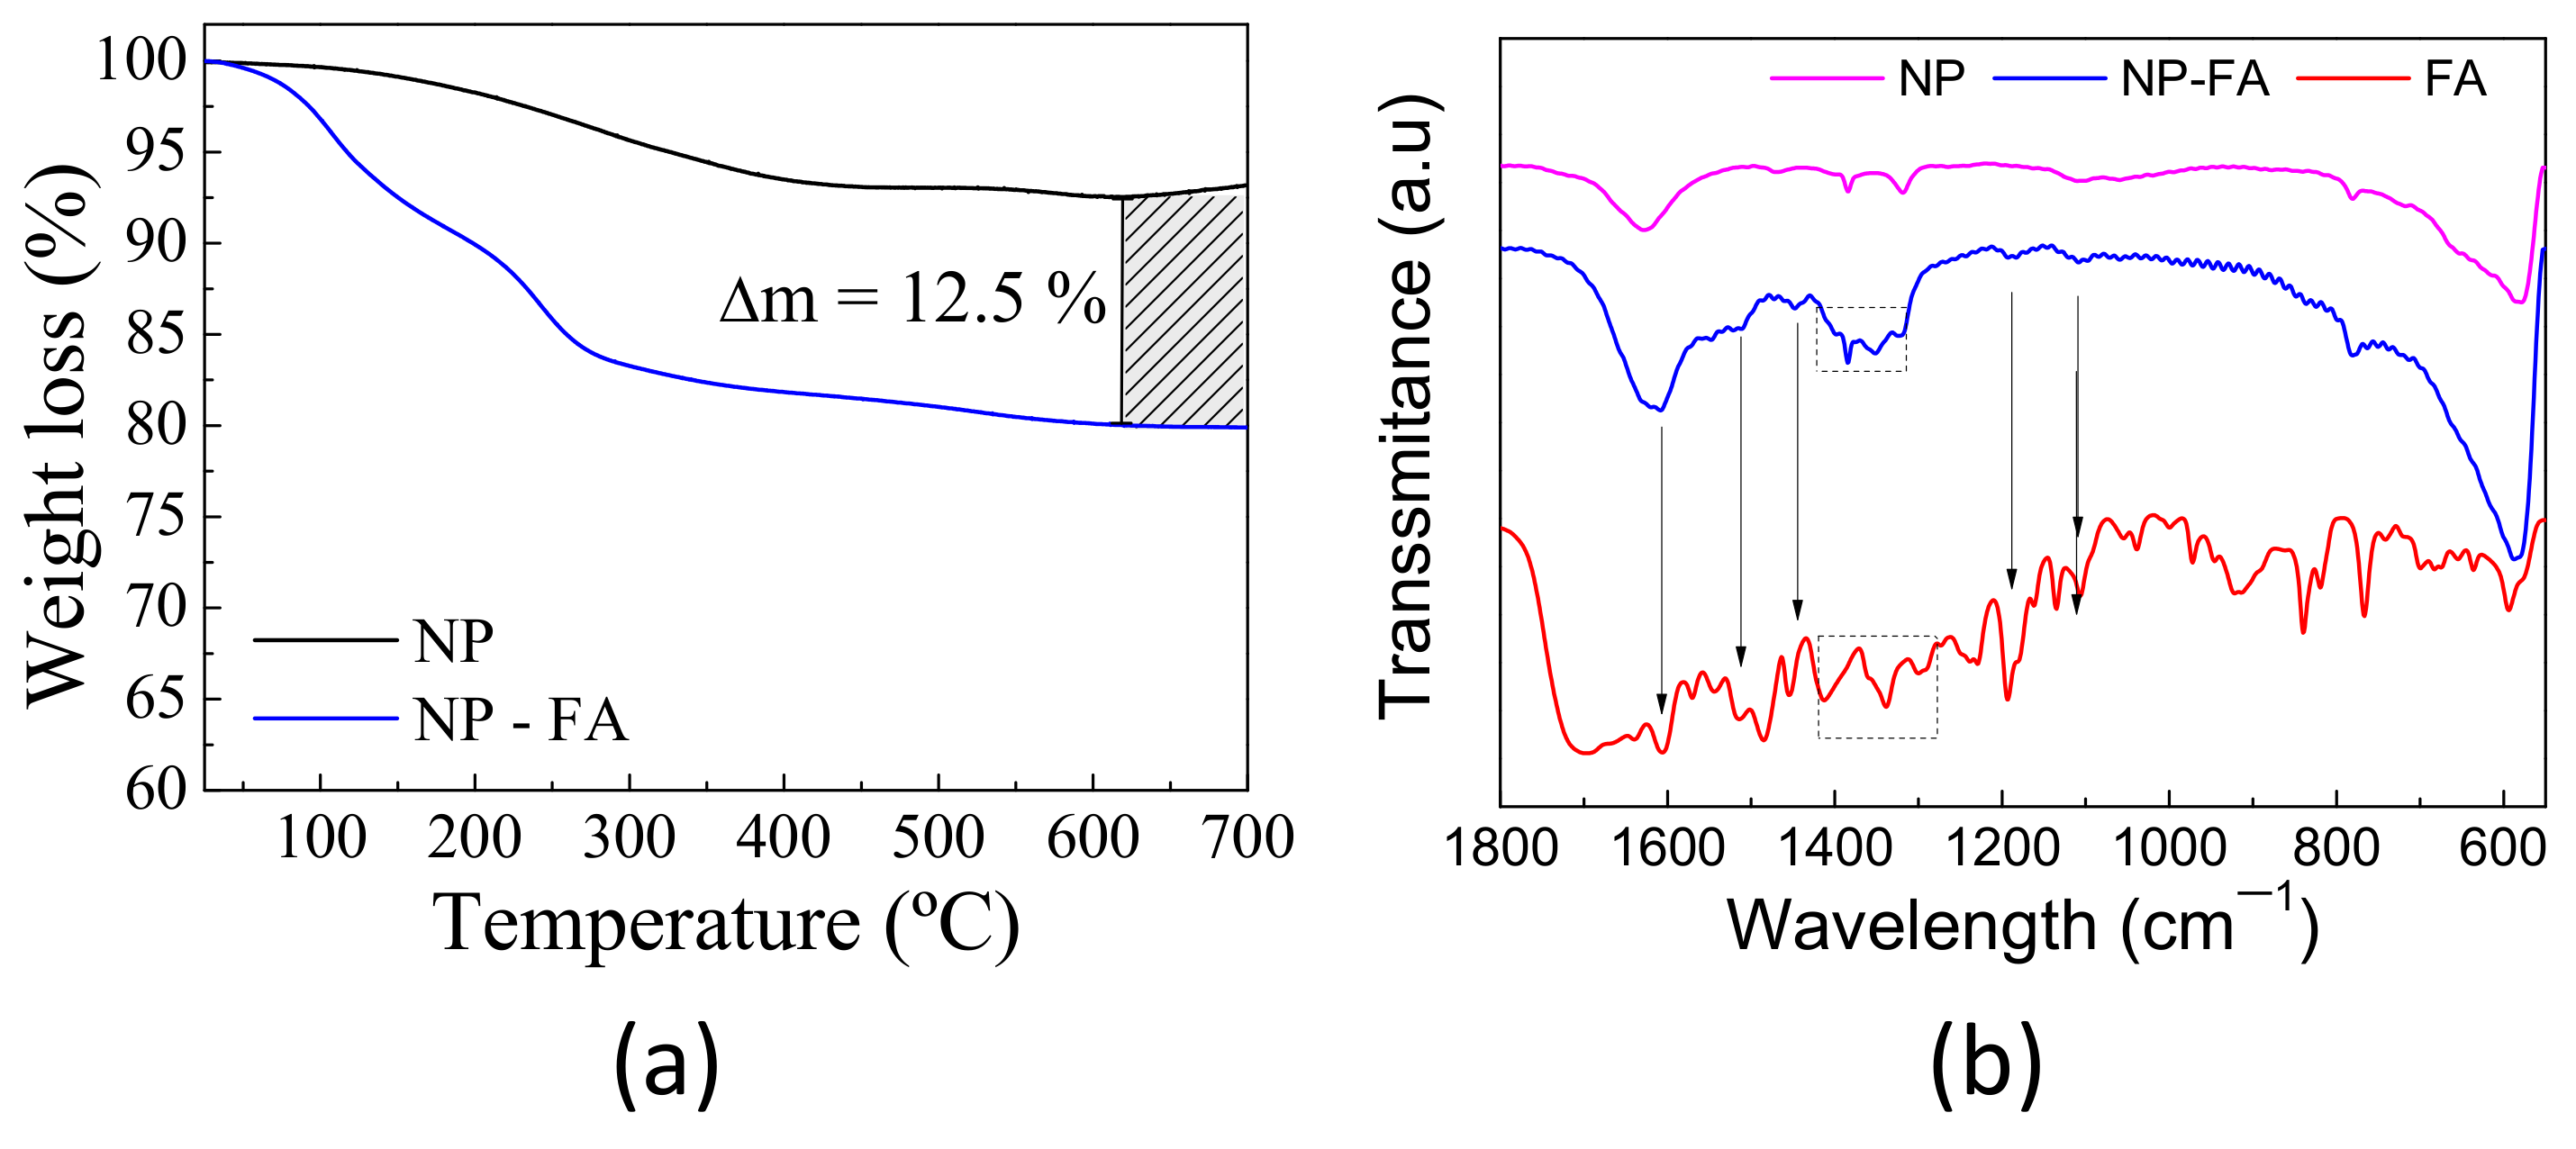
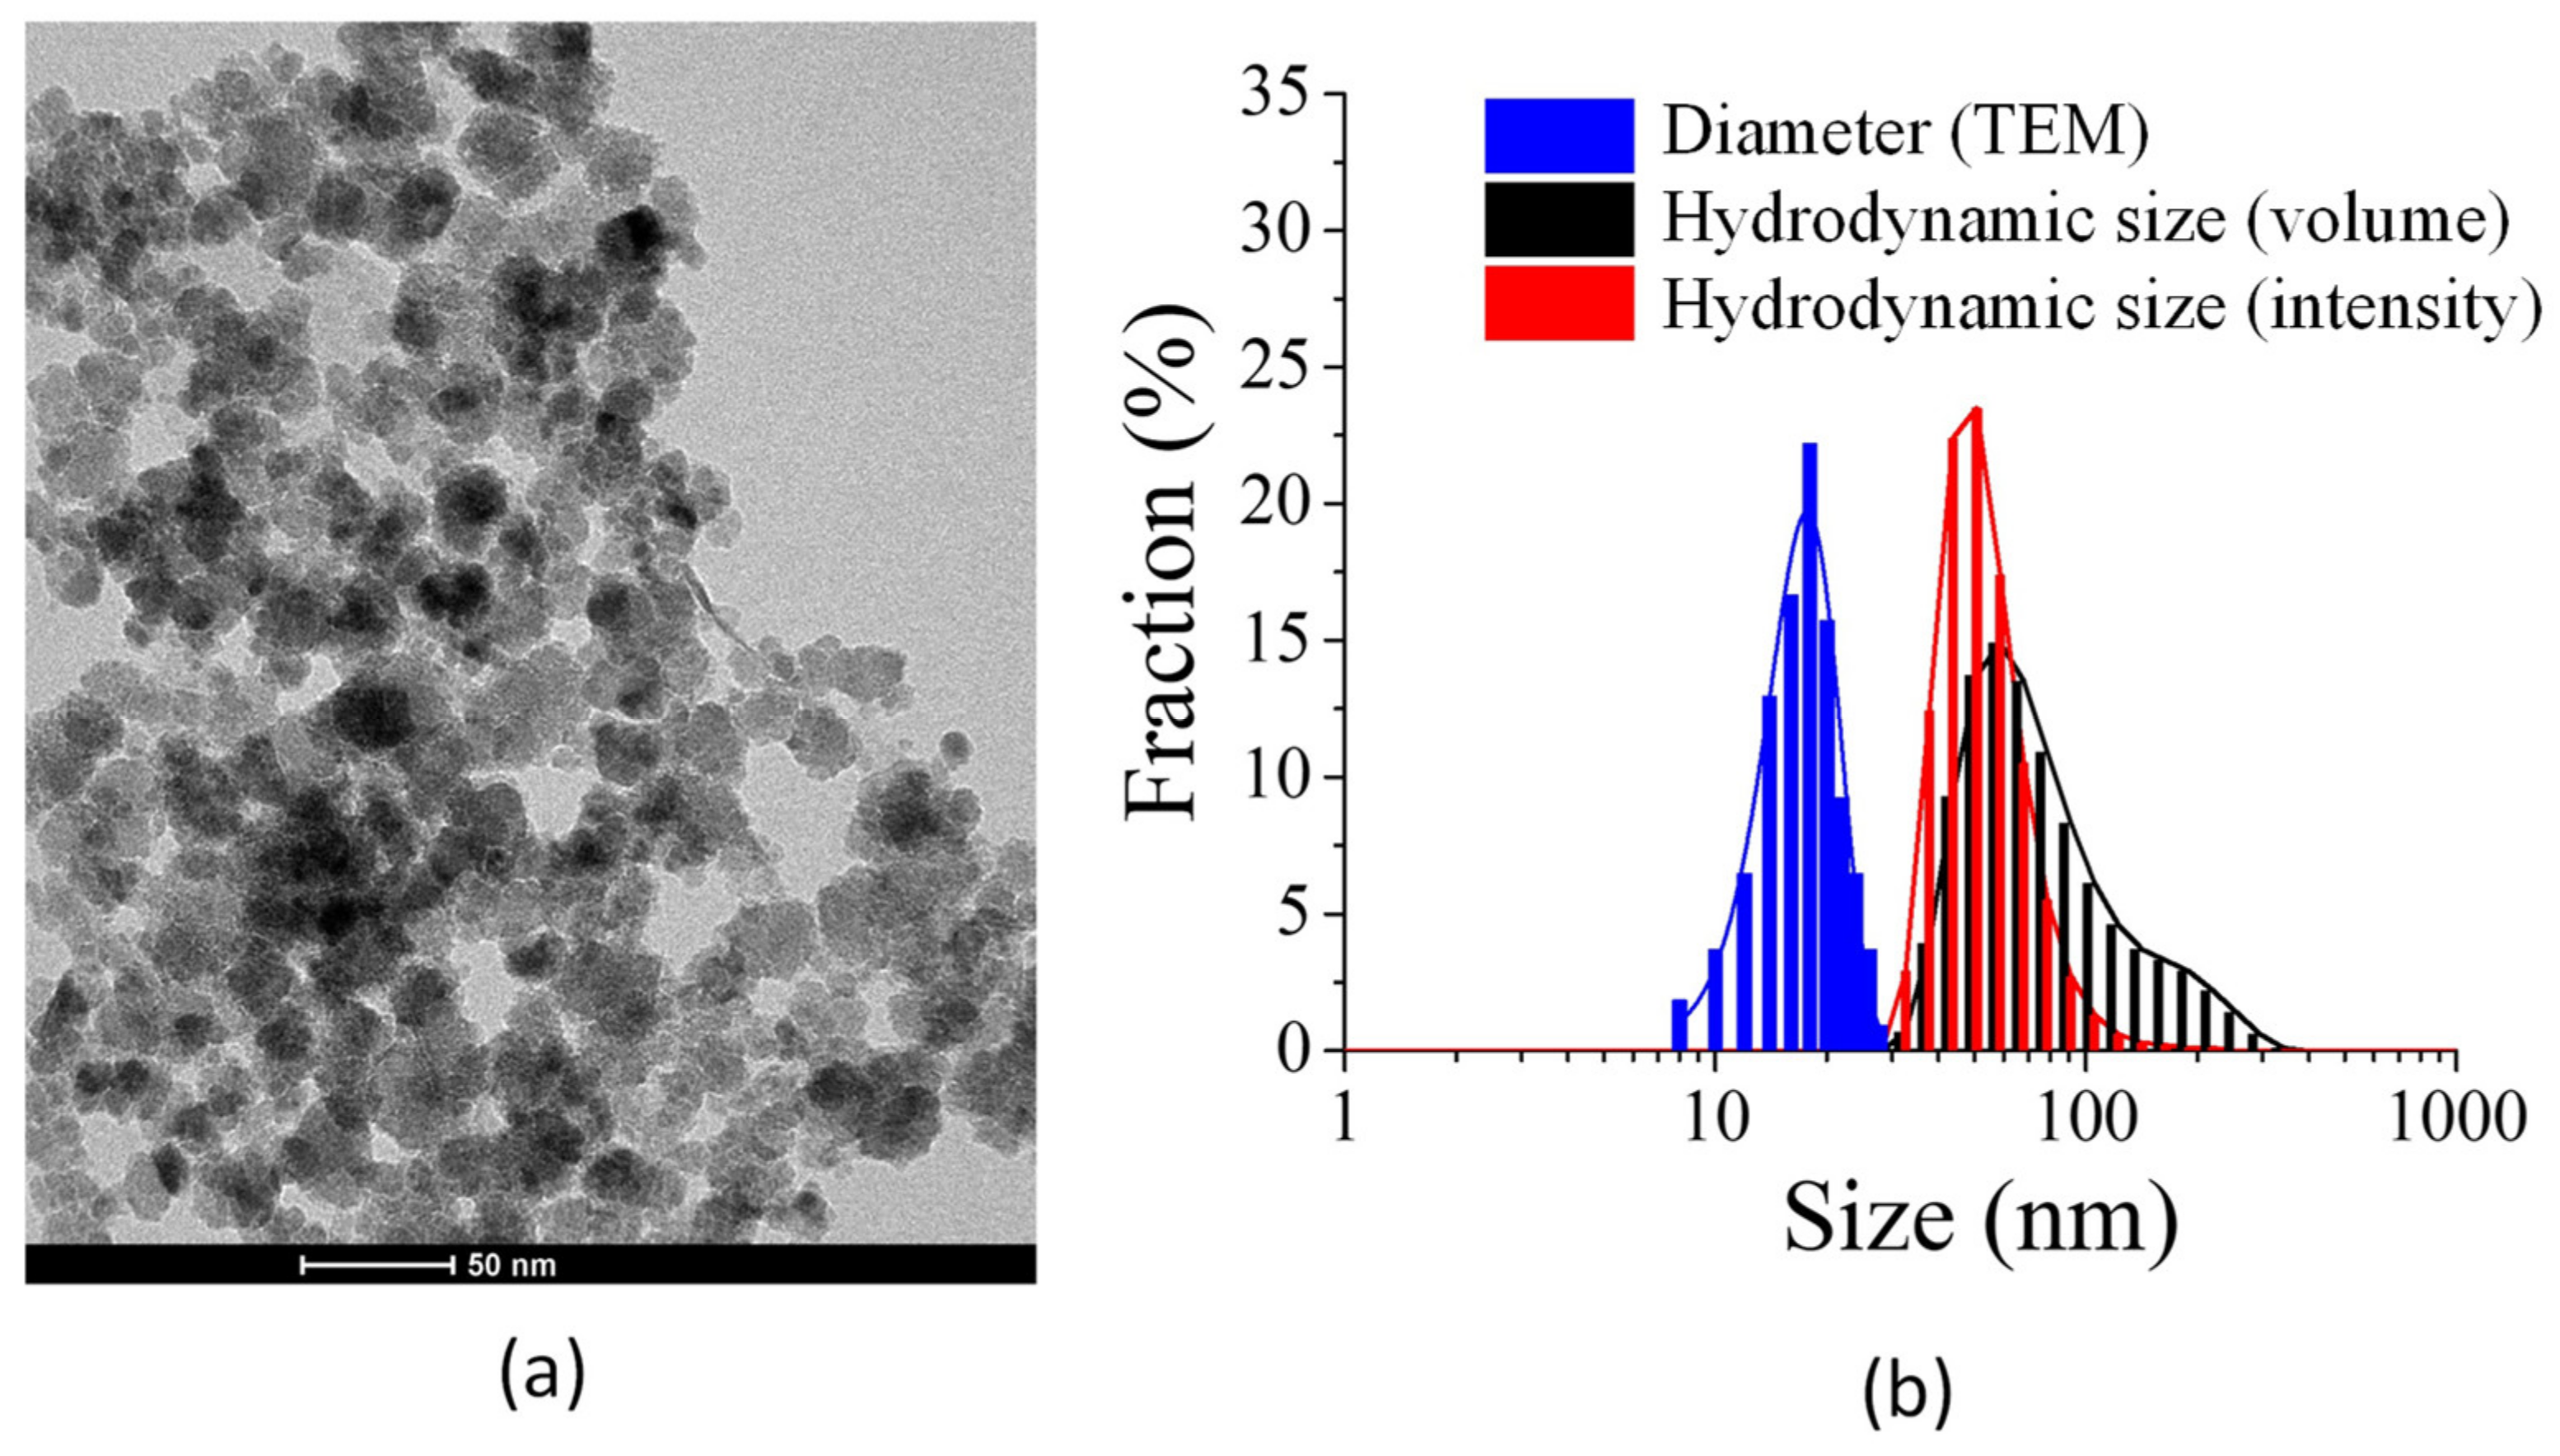
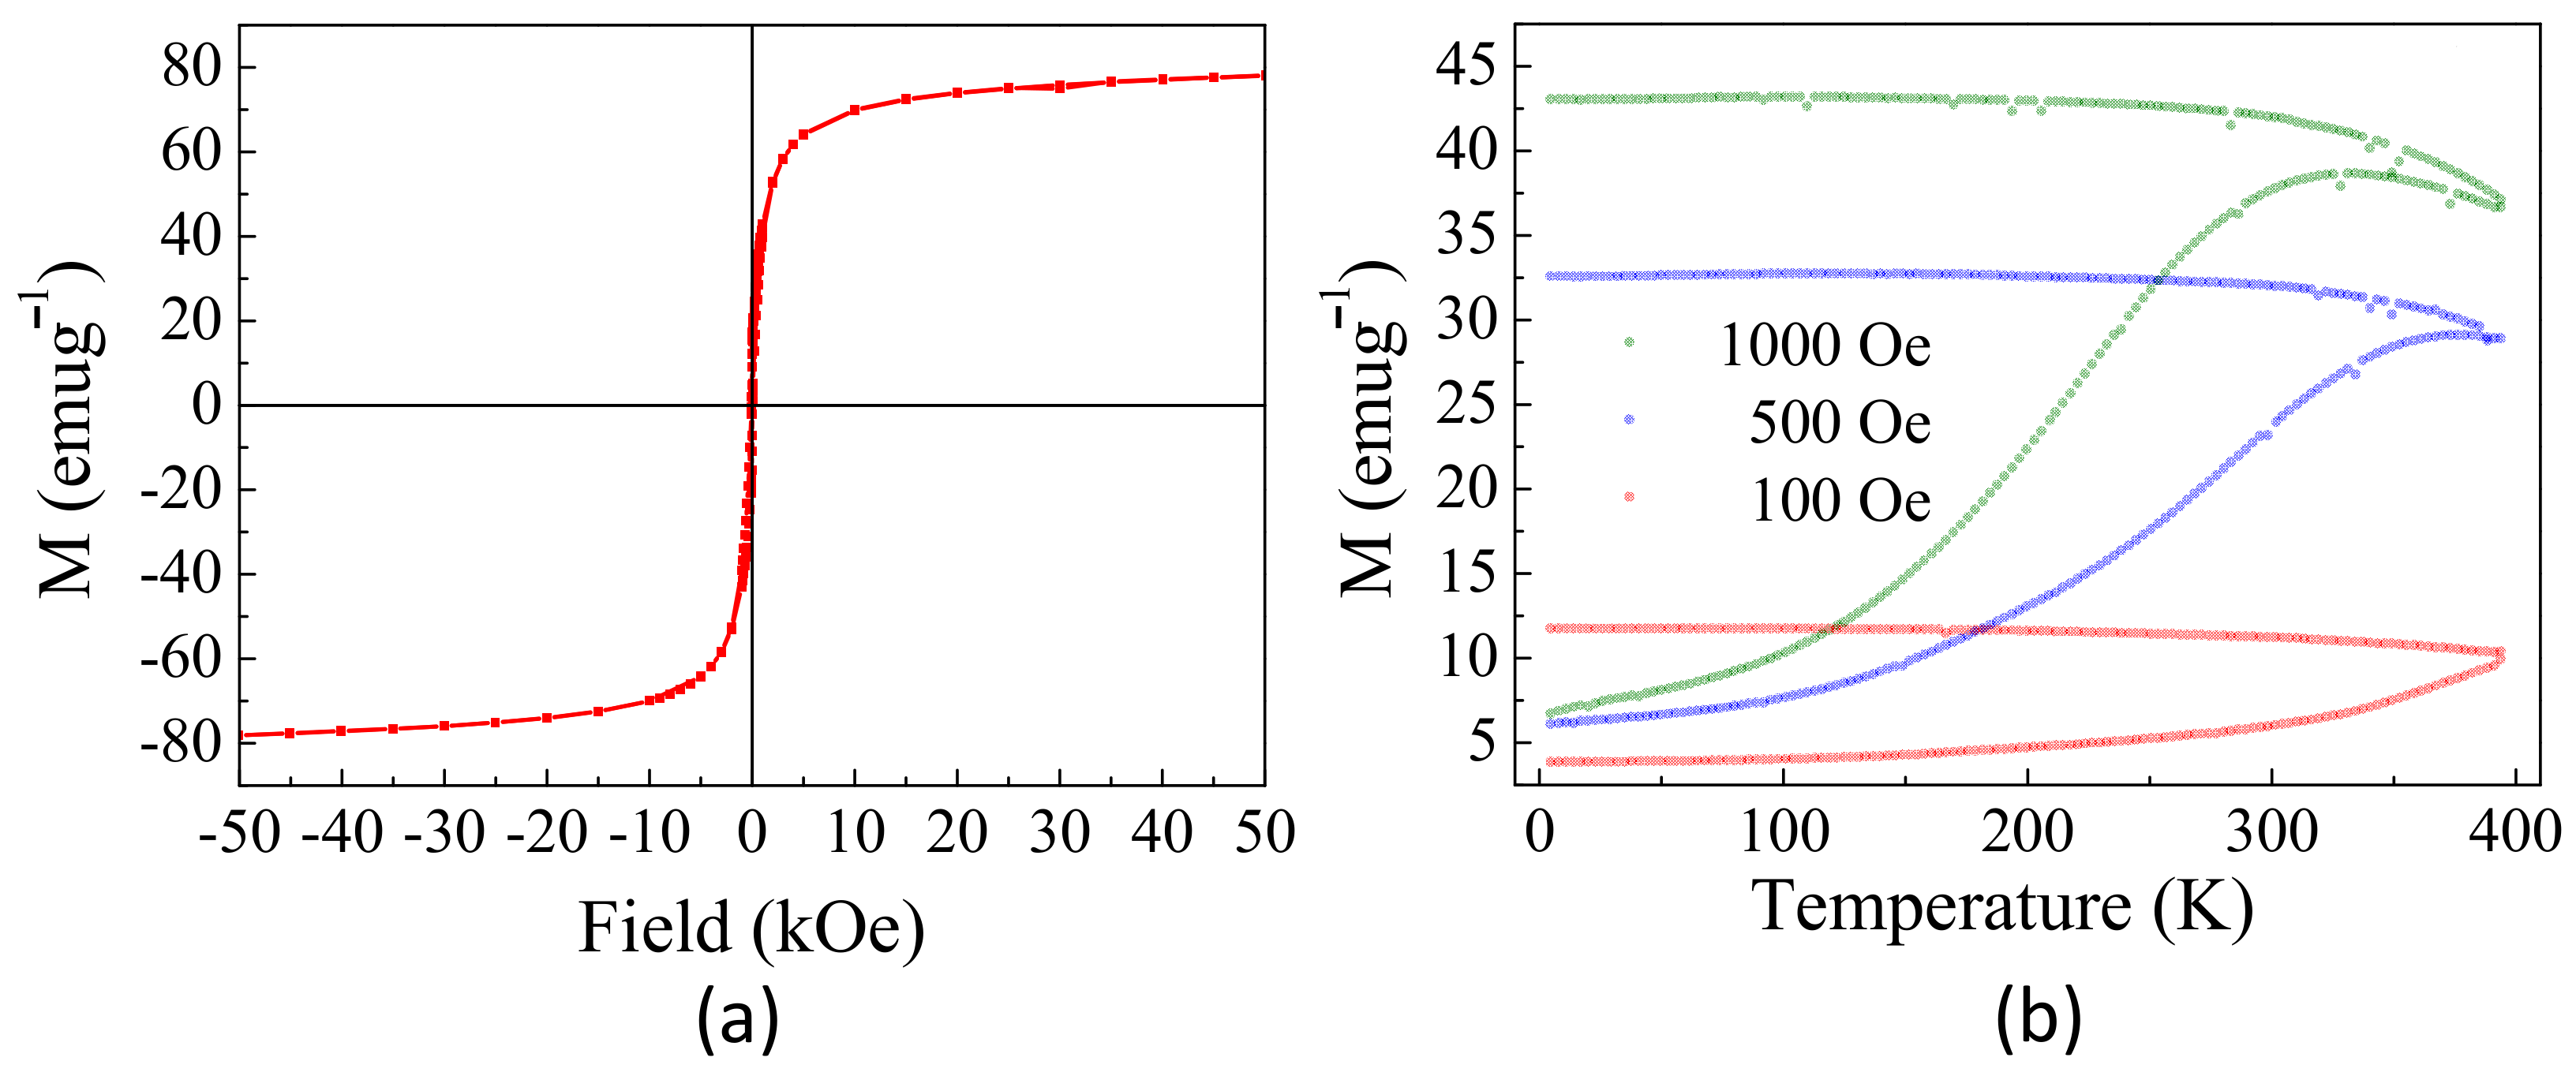
2.1. Nanoparticle Physicochemical Properties

Figure 1a shows the TGA data of bare NP and NP-FA. The non-functionalized sample exhibits a total weight loss of approximately 6.5% at 700 °C, and the weight decrease that appeared in the range of 100–400 °C was due to moisture removal and eventual tetrabutylammonium bromide evaporation. The NP-FA sample shows a total weight loss of 20% at 700 °C. Similar considerations as for bare NPs can be made; the steepest decrease between 200 and 500 °C could be due to the elimination of the covalently conjugated FA molecule. By considering the difference in moisture content between bare NP and NP-FA, we can estimate an experimental loss of folic acid of approximately 12%.
The surface groups of folic acid-modified CoFe2O4 nanoparticles were characterized by FTIR, as shown in Figure 1b. The absorption peak at 596 cm−1 is attributed to Fe-O bond absorption. Absorption at 1604 cm−1 corresponds to the carbonyl and aromatic ring stretching vibrations in the folic acid molecule, and absorption at 1396 cm−1 corresponds to the benzoic vibrations in the folic acid molecule. Therefore, infrared data proved that folic acid molecules successfully modified the surface of CoFe2O4 nanoparticles.
A selected TEM image for NP-FA is shown in Figure 2a. Processing of these TEM images by ImageJ software provided NP diameter values of 17(4) nm (N = 180). According to TEM, the functionalized nanoparticles present some aggregation.
The hydrodynamic diameter (HD) of dispersed NP-FA (the effective diameter of the NP-FA when diffusing in water, typically understood as the sum of the core diameter and twice the shell thickness) can be assessed with scattering techniques, e.g., dynamic light scattering (DLS). In Figure 2b, a comparison of the HD and the particle size is presented. The HD of the colloidal NP-FA sample was higher than the particle size, with a mean value of 78 nm (measured in intensity mode) and a polydispersity index (PDI) of 0.16. A PDI value < 0.2 reflects the size homogeneity of the sample [27].
One essential parameter concerning the behavior of magnetic nanoparticles to act as a T2 contrast agent is their saturation of magnetization (Ms). A high Ms of superparamagnetic NPs locally induces higher magnetic field gradients if dispersed in solutions and subjected to an external homogeneous magnetic field. Thus, the higher the Ms of NPs with everything else being equal, the more effective they are as contrast agents.
Figure 3a shows the hysteresis loops, M(H), measured up to 50 kOe at 300 K. At this temperature, an S-type curve with a hysteretic curve appears with Hc = 60 Oe, Mr = 11 emug−1, and an Ms value of 80.6(2) emug−1. This last value is close to the bulk value previously reported (80 emug−1) and higher than other values reported for cobalt ferrite nanoparticles with similar sizes and compositions [28,29].
The zero-field-cooling (ZFC) and field-cooling (FC) magnetization curves, from 5 to 395 K, at several external magnetic fields are depicted in Figure 3b. The FC curves show a nearly constant value of magnetization that decreases at high temperature and high magnetic fields, whereas the ZFC curves show a high irreversibility that decreases with the field. This behavior is related to ferro- or ferrimagnetic materials at the nanoscale with magnetic order temperatures above room temperature. All curves show similar behavior with a maximum in the ZFC curve at TB, the temperature related to the freezing or blocking process of the nanoparticle magnetic moment. As shown, the blocking temperature decreases with the external magnetic field, and a maximum is only present at approximately 335 K when working at 1000 Oe. The evolution of TB with the magnetic field is related to the strong exchange interaction between the particles that allows a low-temperature order [30].
This finding indicates that below this temperature, NP-FA exhibits ferromagnetic behavior with remanence and coercivity and that above 300 K, the hysteresis feature vanishes and is expected to exhibit superparamagnetic behavior.

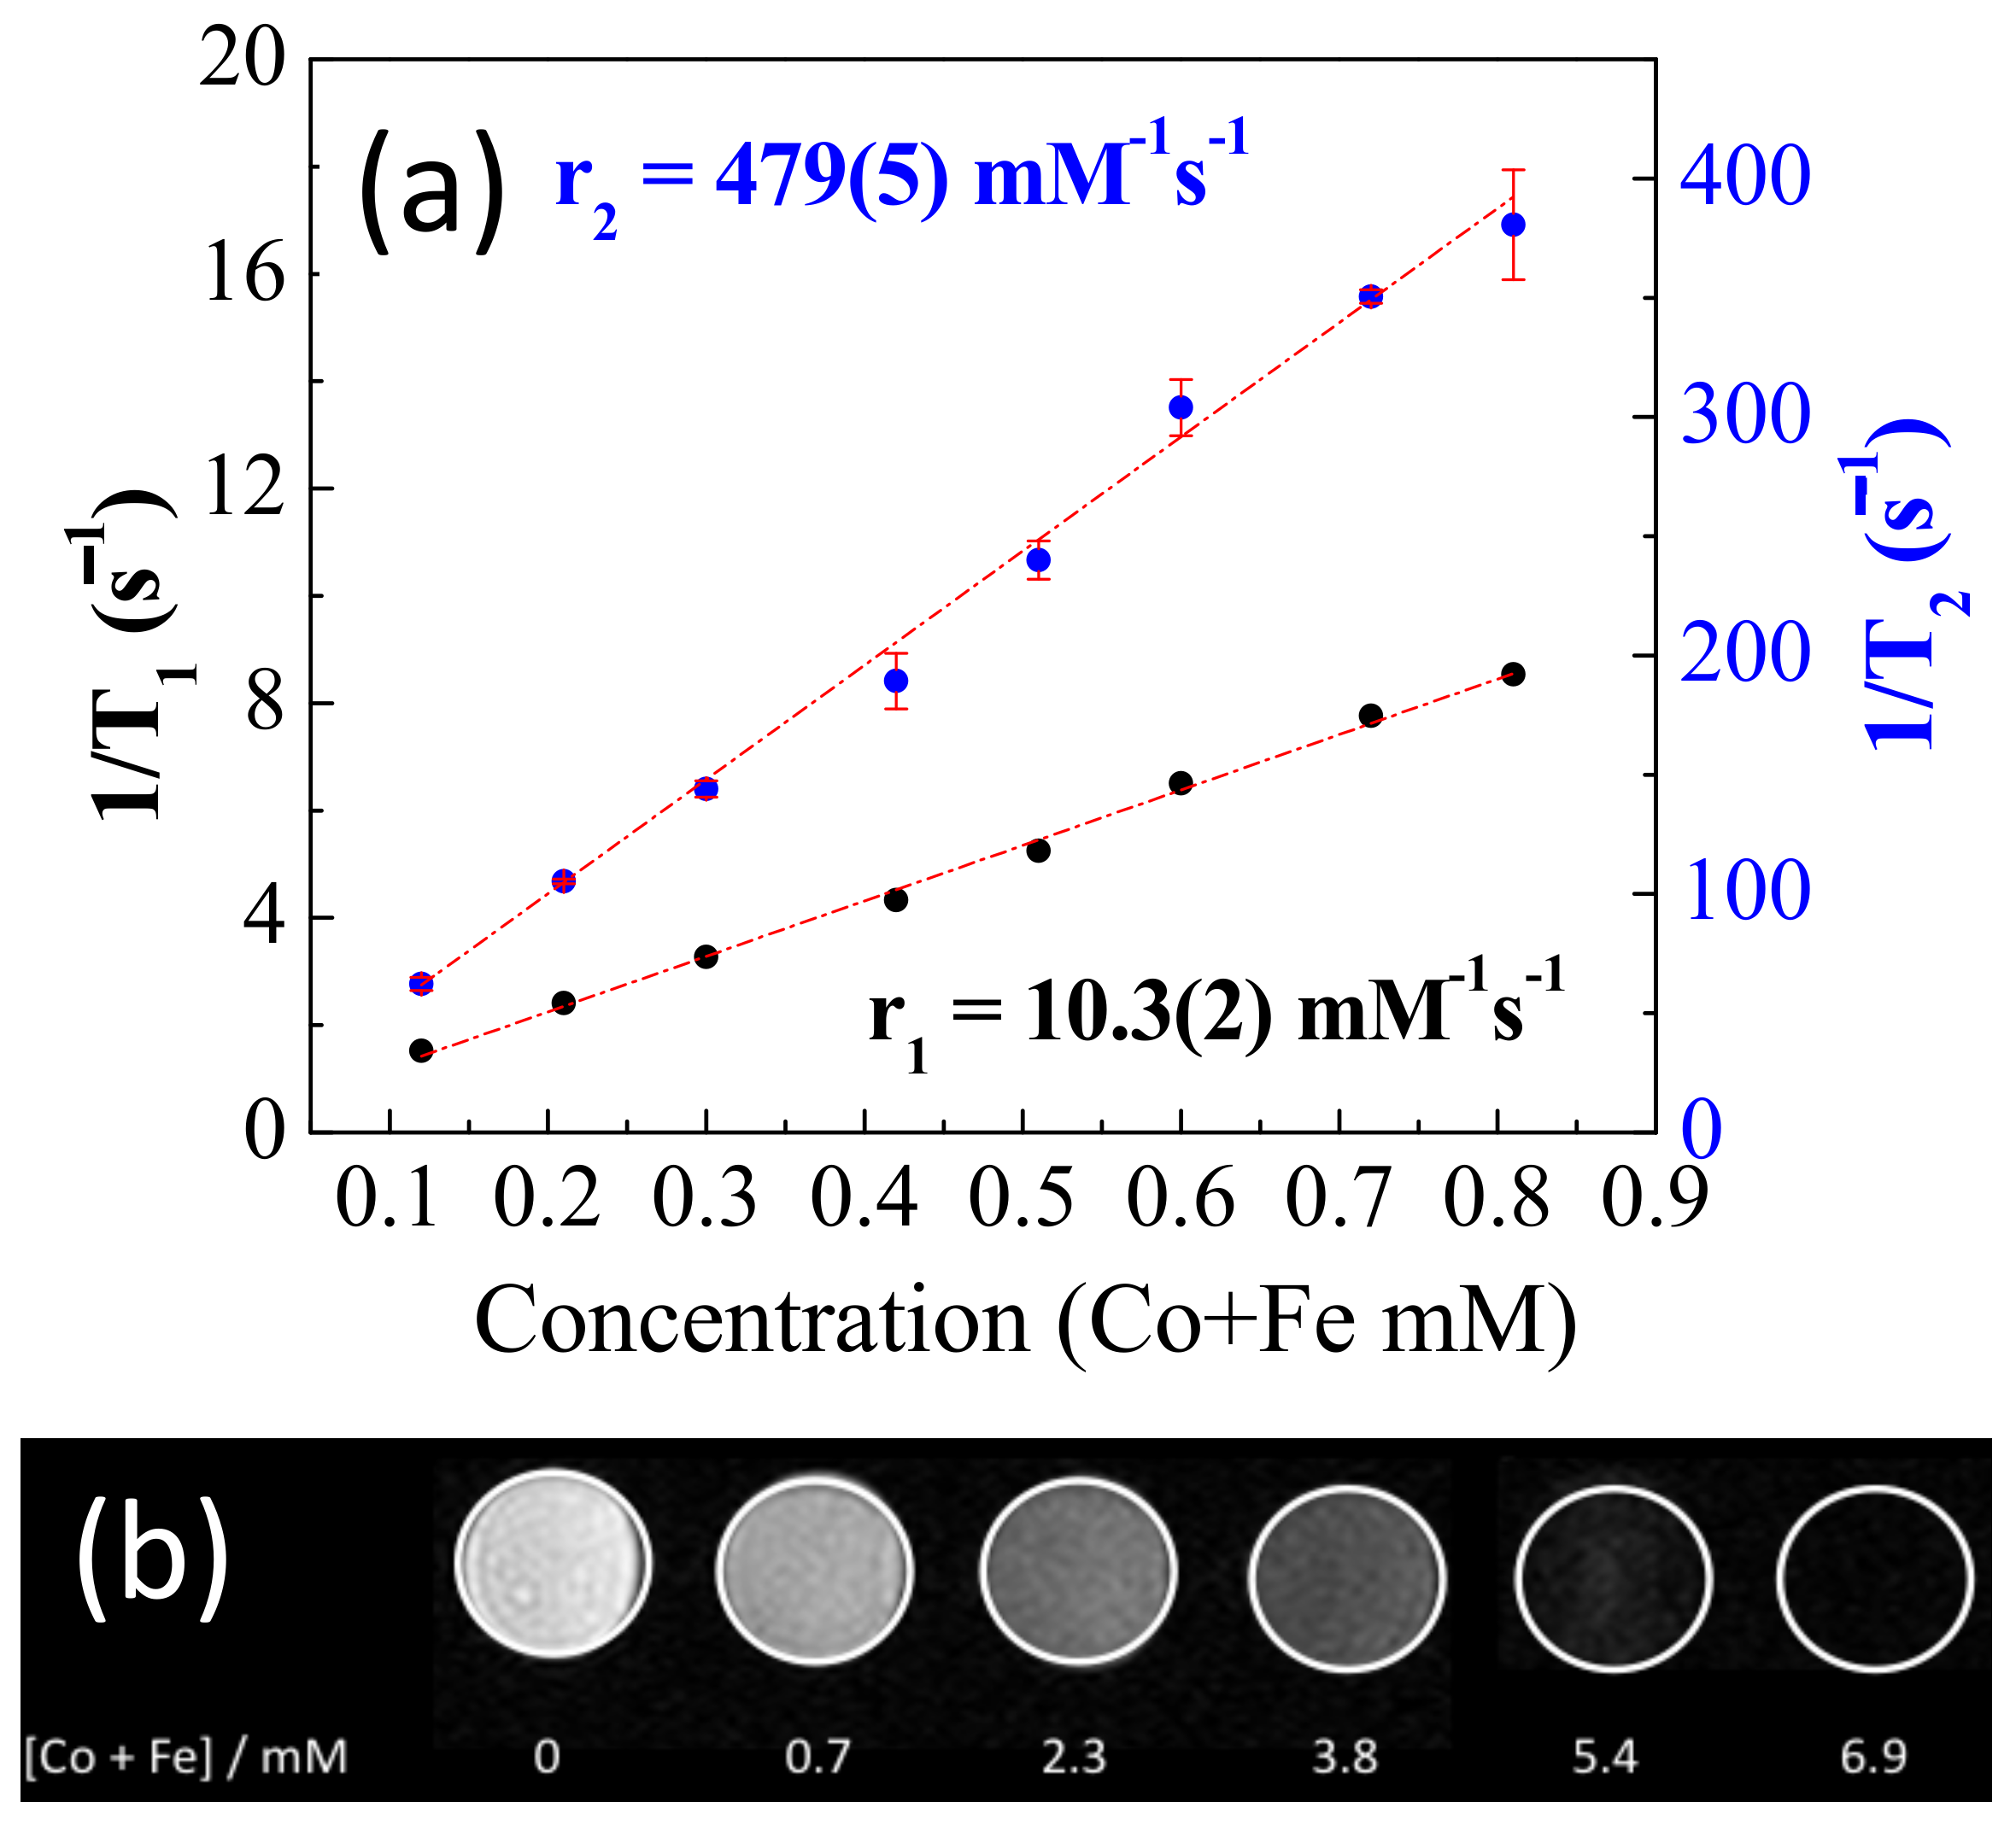
2.2. Relaxivity of NP-FA

We then measured the MRI relaxation times (T1 and T2) from 0 to 0.8 mM iron and cobalt to obtain the transverse relaxivity (r2) and longitudinal relaxivity values (r1) of NP-FA, as shown in Figure 4a. The r1 value of NP-FA was approximately 10.3 Fe+Co mM−1s−1(2), whereas the r2 value was approximately 479(5) Fe+Co mM−1 s−1, providing an r2/r1 ratio of 48.3. The large r2 and r2/r1 ratios indicate that these nanoparticles are promising candidates for high-efficiency T2 contrast agents. The relaxation rate for zero metal concentration were extracted from the linear fitting of the experimental data, resulting in values of 0.2(1) s−1 and 4(2) s−1 for (1/T1)0 and (1/T2)0, respectively. Such a significant improvement in the T2 MR signal arises from the high value of saturation of magnetization of these NPs, which is able to distort the local magnetic field in an effective way. r2 is related to the Ms, which, in turn, is affected by the size of the NP [11]. T2-weighted phantom images of a colloidal solution of NP-FA with different Fe and Co metal concentrations are shown in Figure 4b. With increasing concentration, the signal intensity of T2-weighted phantom images obviously decreases, as shown in Figure 4b, indicating that the T2 relaxation time decreases with increasing metal concentration. Therefore, the sample has the potential to generate MRI contrast enhancement on T2-weighted sequences.
Table 1 depicts the relaxivity values of most typical commercial agents based on iron oxide nanoparticles. For a simple comparison, several r2 values for cobalt ferrite nanoparticles found in the literature have also been summarized. The r2 value obtained in this work of cobalt ferrite nanoparticles functionalized with folic acid is the highest value found in the literature for nanoparticles with spherical shapes.

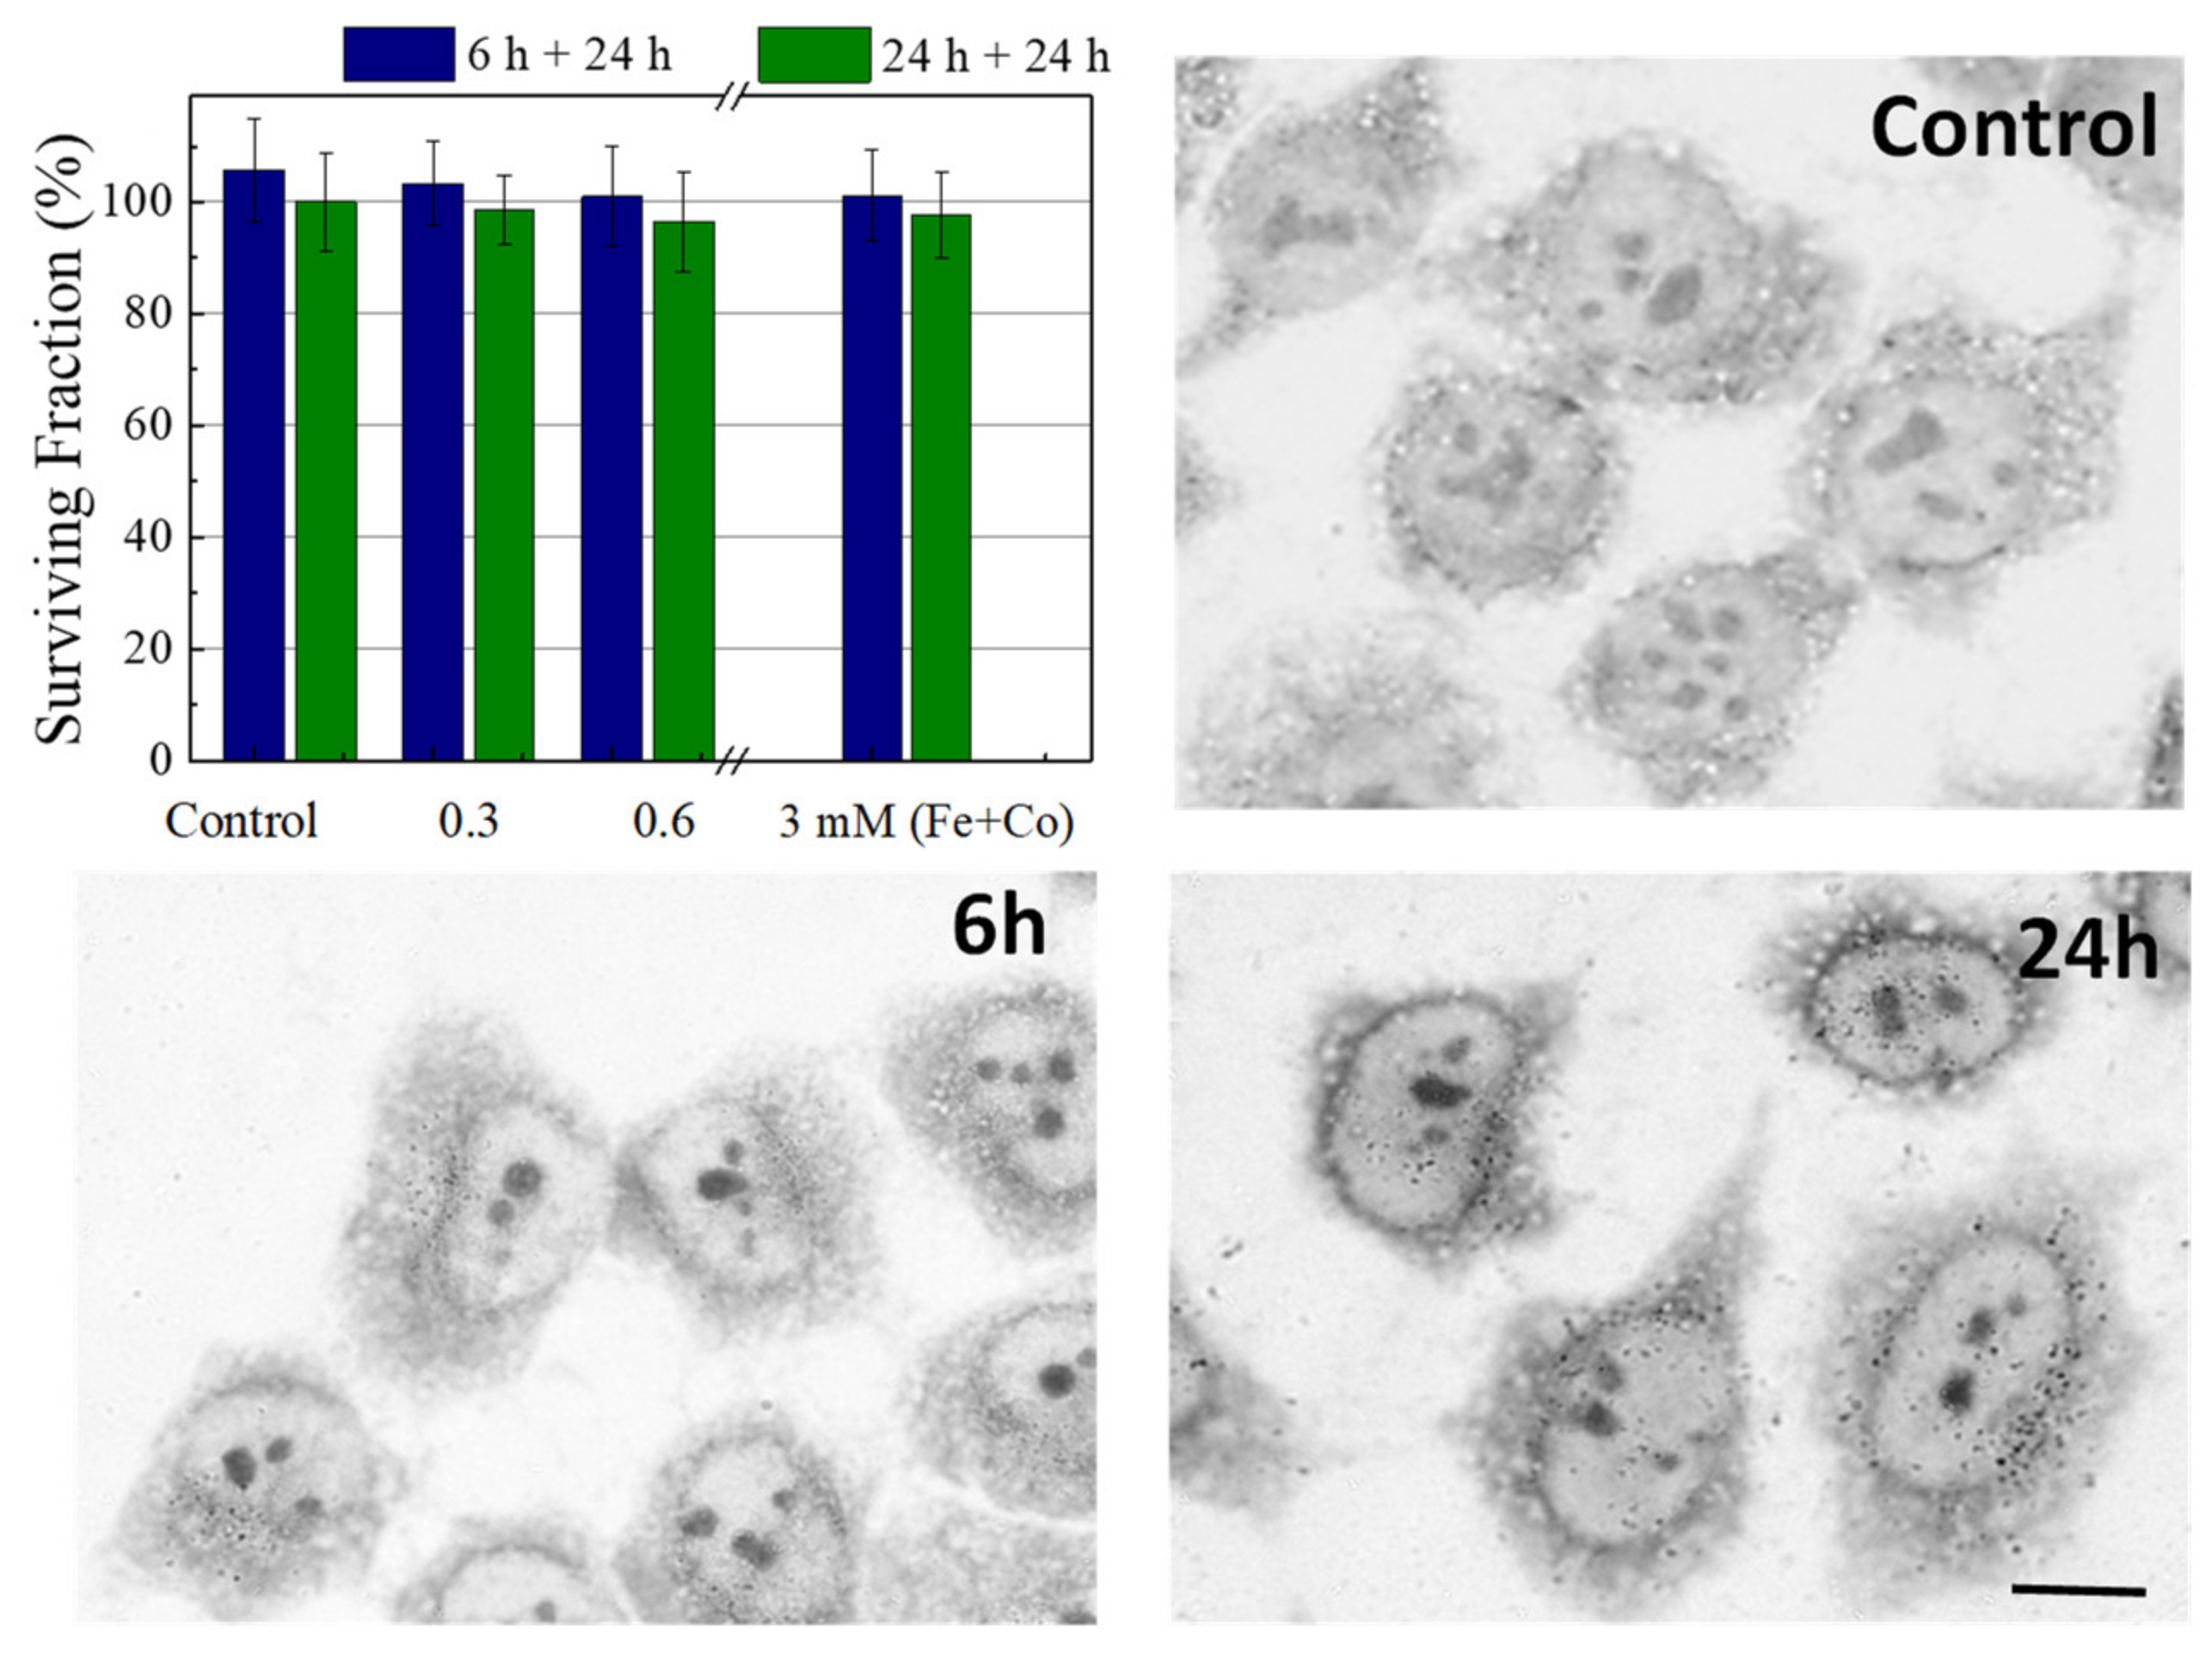
2.3. Cell Viability and Internalization

The results obtained with the MTT assay do not exhibit any toxic effect for the concentrations used in this study. All viability percentages were similar to the controls, i.e., near 100% after 6 or 24 h of incubation, as shown in Figure 5.
After both incubation times (6 or 24 h), the cells were fixed and stained with toluidine blue (TB) and observed by optical microscopy, as shown in Figure 5. After 6 h of incubation at 0.6 mM, the NPs were clearly localized inside the cells and were detected as small aggregates, a control cell micrograph was shown for comparison. Moreover, the quantity of NPs inside the cells was higher if the incubation time was increased to 24 h. In addition, the NPs were kept inside the cells 24 h after the incubation time (data not shown). Reported toxicity investigations have revealed that the CoFe2O4 nanoparticles with appropriate surface modification show relatively low cytotoxicity [35,36].

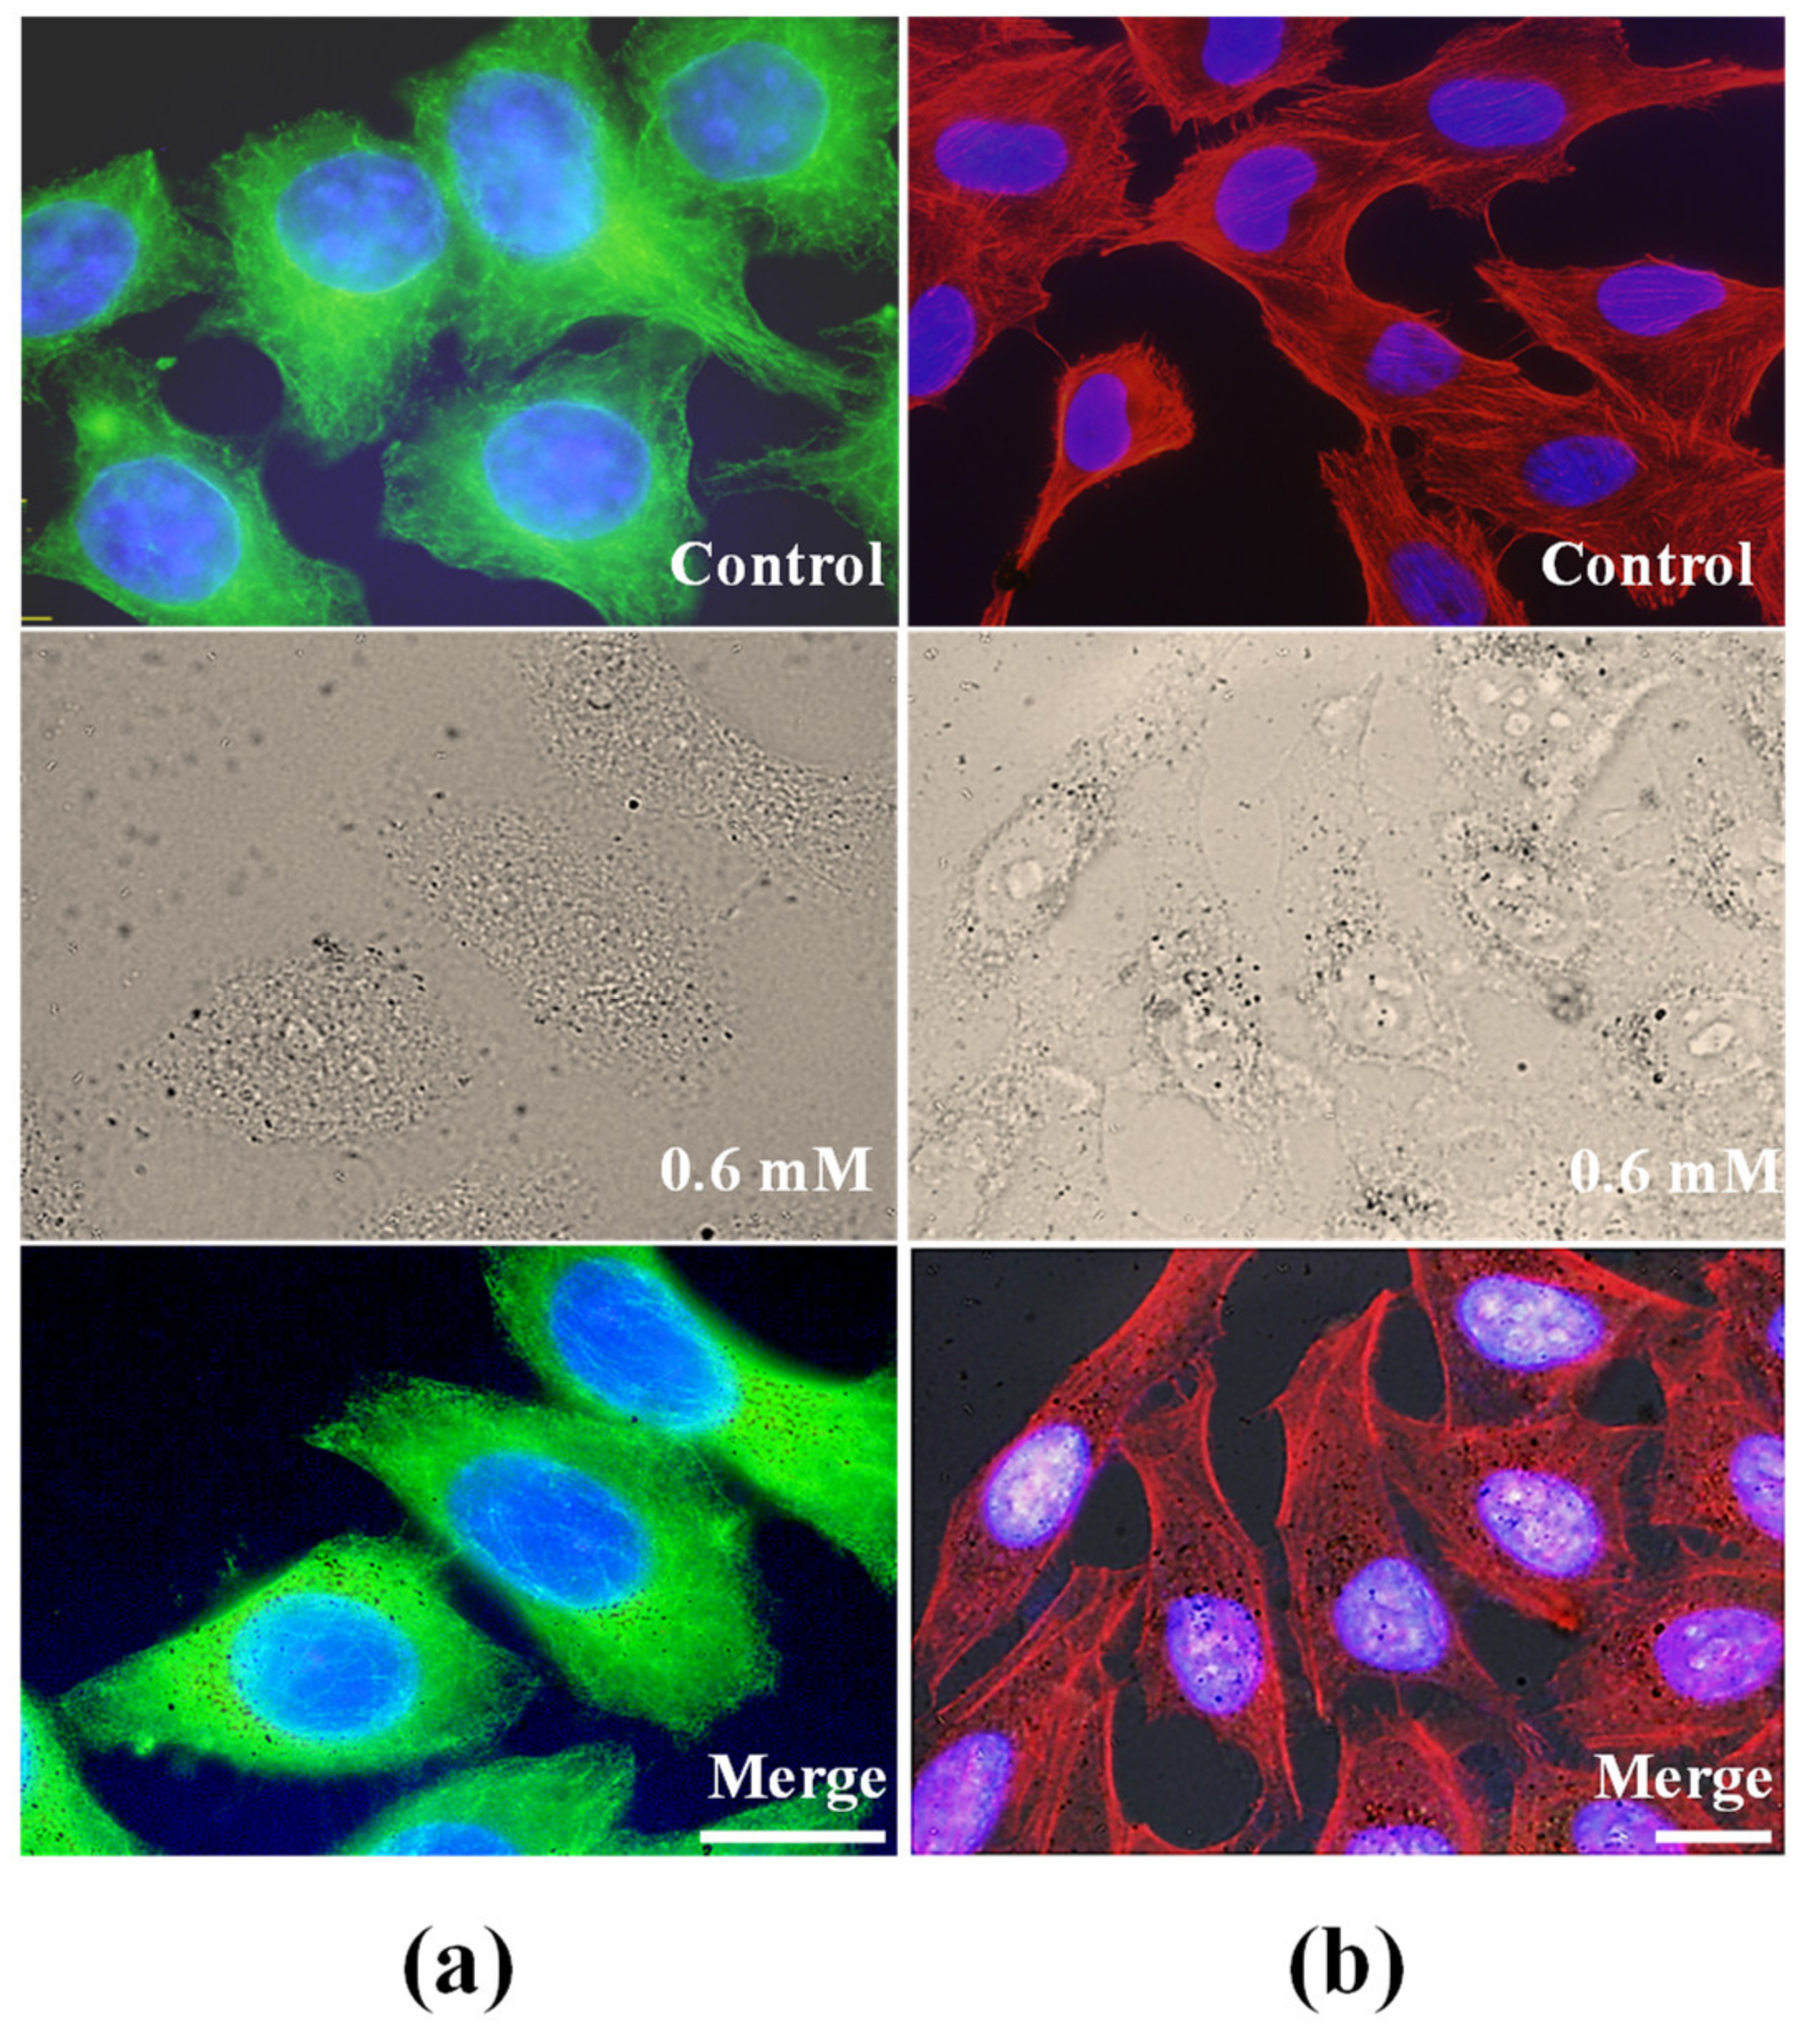
2.4. Analysis of Cytoskeleton Components

Two cytoskeletal components, microtubules (MTs) and actin microfilaments, have also been analyzed to study the cytotoxic effect of NPs. Microtubules are highly dynamic fibers of the cytoskeleton organized as a radial array around the centrosome with critical functions in eukaryotic cells (e.g., motility, division, vesicle transport). Instead, actin microfilaments are involved in a wide variety of cell functions, such as the establishment of cell morphology, transport of vesicles and organelles, positioning of cellular components, cytokinesis, cell locomotion, cell–cell and cell–substrate interactions, and signal transduction.
We analyzed the effect of nanoparticle internalization on MTs and actin by indirect immunofluorescence analysis of α-tubulin and TRITC-rhodamine, respectively, and DNA counterstaining with Hoechst 33258. The interphase microtubule network appeared well organized in cells incubated for 24 h at a metal concentration of 0.6 mM compared with HeLa control cells, as shown in Figure 6a. Figure 6a also shows that the amount of NPs inside the cells (merged image) did not alter the microtubule morphology and distribution. To obtain more insight into possible indirect cell damage by these NPs, we also investigated their effects on actin microfilaments. As shown in Figure 6b, control cells showed stress fibers (red) crossing the cytoplasm, and under the cell cortex, they were anchored to the plasma membrane at focal contacts. In comparison, morphologic analysis of actin microfilaments after incubation with NPs did not show any alteration of this component under our experimental conditions, as shown in the merged image in Figure 6b.
In conclusion, the behavior of NPs in HeLa cells demonstrated easy NP penetration into cells under our experimental conditions, as well as the absence of effects on cell survival. As shown in several figures of this work, the morphology of cells incubated with NPs did not differ from that of control cells. The results obtained in the morphological analysis of the cytoskeletal components confirm the biocompatibility of the NPs.

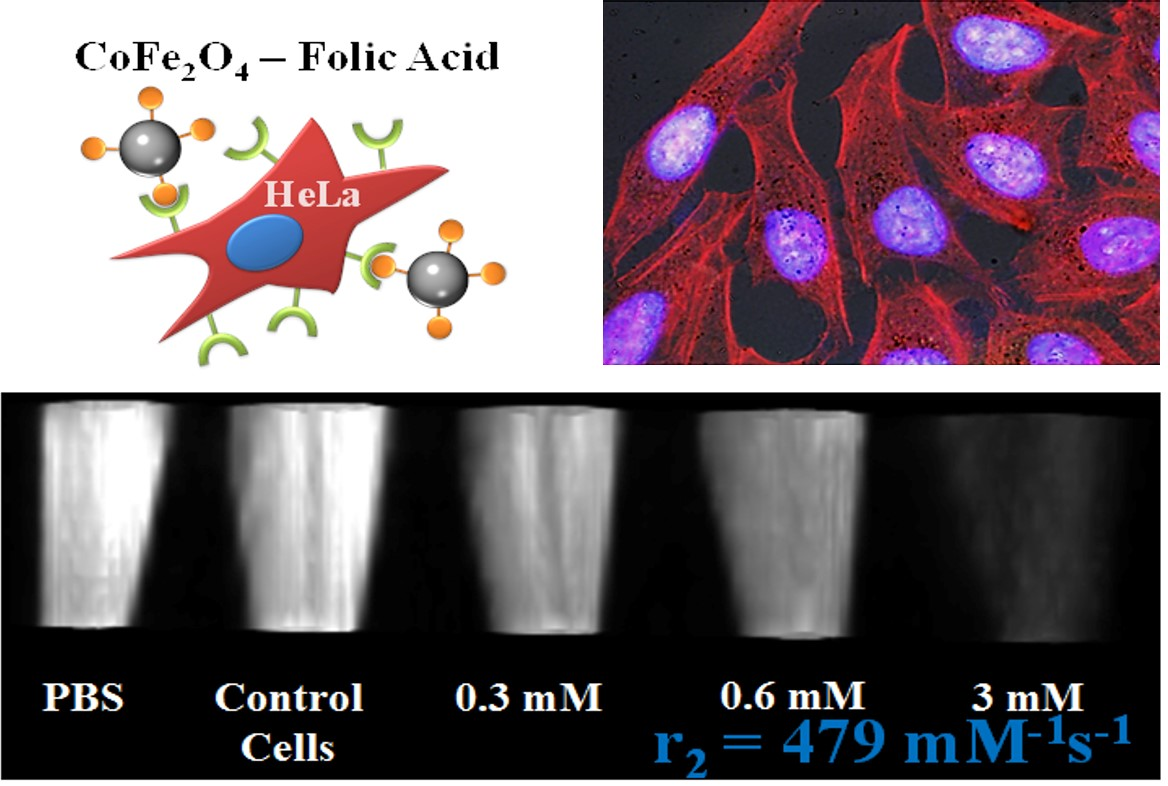
2.5. In Vitro Phantom Image Contrast

The MR images from in vitro phantoms of NP-FA with different metal concentrations are shown in Figure 7. T2-weighted phantom MRI images were obtained from a series of colloidal suspensions of cells incubated with NP-FA in the transverse and longitudinal positions, as shown in Figure 7a,b, respectively. With increasing concentrations of NP-FA, the signal intensity dropped, resulting in a significant increase in T2 relaxation compared with phosphate-buffered saline (PBS) and control cells [11]. This suggests that a minimal concentration of NP-FA of 0.6 mM would be sufficient to detect an appreciably intense signal on MRI. In conclusion, the T2-weighted phantom images exhibited negative dose-dependent contrast improvement, suggesting that cobalt ferrite functionalized with FA as a target molecule is very promising for imaging purposes.

3. Materials and Methods

3.1. Synthesis and Functionalization of Cobalt Ferrite Nanoparticles

Cobalt ferrite nanoparticles were prepared in one step by an electrochemical method [37,38]. The grafting of the NPs with folic acid (FA) was performed by adding the as-synthetized NPs in an aqueous solution of 0.02 gmL−1 FA. The pH of this solution was increased by means of KOH until pH 8.0, and this solution was heated and stirred for 1 h at 80 °C. The NPs were separated by means of a magnet of 0.6 T and washed several times with distilled water to remove the excess FA, after which the pH of the aqueous solution was decreased to 7.2 with HNO3, and colloidal suspensions of particles were directly obtained by simple ultrasonic treatment. Finally, the suspension was dialyzed for 24 h to remove the FA not physi-absorbed to the nanoparticle surface.

3.2. Characterization Techniques

Electron transmission microscopy images were obtained after placing a single drop (10 μL) of the aqueous solution of NP-FA onto a copper grid coated with a carbon film. The grid was left to dry in air for several hours at room temperature. TEM analysis was carried out using a Tecnai T20 (FEI, Netherlands) electron microscope working at 200 kV. Magnetic characterization was carried out using a SQUID magnetometer (Quantum Design MPMS XL-5). The magnetization curves were measured at room temperature after applying a maximum magnetic field of 50 kOe. From the magnetization curves, values of parameters such as coercivity (Hc) and saturation magnetization (Ms) were obtained. The saturation magnetization was calculated by infinite field extrapolation of the experimental data obtained in the high field range where the magnetization linearly decreases with 1/H. The magnetization versus temperature curves were measured in zero-field-cooling (ZFC) and field-cooling (FC) procedures under different external applied magnetic fields, H = 100, 200, and 1000 Oe and between 5 and 395 K.
Thermogravimetric analysis (TGA) was conducted using a Mettler Toledo Instrument (TG/SDTA851e model) under air and with a DSC/821e model with a heating rate of 10 °C min−1 from room temperature to 800 °C. The presence of organic molecules attached to the nanoparticle surface was studied by infrared spectroscopy in a Nicolet 20 SXC FTIR. CoFe2O4–FA NPs were dispersed in KBr at 2 wt % and pressed in a pellet. The IR spectra were registered between 4000 and 300 cm1.
Dynamic light scattering (DLS) measurements were carried out at 25 °C with a Nano ZS (Malvern Instruments) equipped with a solid-state He-Ne laser (λ = 633 nm) to determine the hydrodynamic diameter of the water dispersible NPs. The refraction index was 2.42 and the absorption 0.8. Finally, Fe and Co metal concentrations were measured with a Perkin-Elmer Optima 2100 DV inductively coupled plasma optical emission spectrometer (ICP-OES). For this purpose, samples were digested with nitric acid to oxidize the organic coating and then with hydrochloric acid to dissolve the particles.

3.3. Biological Characterization

3.3.1. Cell Culture

Human carcinoma HeLa cells were grown in Dulbecco’s modified Eagle’s medium (DMEM) with 50 units mL−1 penicillin and 50 µg mL−1 streptomycin and supplemented with fetal bovine serum (FBS) at a concentration of 10% (whole medium). All media, serum, and antibiotics were provided by Invitrogen (Paisley, Scotland, UK). Cell cultures were performed in an incubator with a 5% CO2 atmosphere at 37 °C. The cells were seeded on 24-well multiwell dishes (Falcon, St. Louis, MO, USA) with or without coverslips. Experiments were performed with cells at 60–70% confluence.

3.3.2. Nanoparticles

In vitro studies were performed using a 28 mM metal (Co + Fe) concentration stock solution of sonicated NP-FA, filtered under sterile conditions through a Millipore filter, aliquoted, and stored at 4 °C. Before use, the aliquots were sonicated again. Working solutions were adjusted to the desired concentrations in the whole medium.

3.3.3. Biocompatibility Assay

A series of 24-well plates containing an identical number of cells were incubated for 6 or 24 h with solutions of 0.3, 0.6, and 3 mM metal, washed three times with sterile phosphate-buffered saline (PBS), and changed to whole medium. After 24 h, the medium was removed, and the cells were incubated with 3-(4,5-dimetil-tiazol-2-il)-2,5-difeniltetrazolio (MTT). Stock MTT solution (1 mgmL−1) was prepared in PBS and further diluted in complete medium to a final concentration of 0.05 mgmL−1. This solution was added to each well for 3 h at 37 °C. MTT (yellow and water soluble) is a compound transformed by cellular metabolism into formazan (blue and water insoluble). The amount of formazan produced is proportional to the number of living cells present in the culture. After 3 h of incubation, the medium was removed, and formazan was dissolved in dimethylsulfoxide (DMSO) and added to each well. The optical density was evaluated in a Tecan Spectra Fluor spectrophotometer (Männedorf, Switzerland) microplate reader at 540 nm. Considering that the NPs could affect the results, the DMSO solution was removed, and the absorbance of the plates was remeasured. The absorption value of formazan was obtained by subtracting the NP absorbance from the absorbance obtained in the first measurement (formazan + NPs). Cell survival was expressed as the percentage of absorption of treated cells relative to control cells. The mean value and standard deviation from at least six experiments were obtained.

3.3.4. Internalization

To visualize the uptake of NPs, after the different experimental procedures, HeLa cells grown on coverslips were incubated in the presence of NP-FA (0.6 mM), washed with PBS (×5), fixed in cold methanol (5 min), stained with toluidine blue (TB Merck, Darmstadt, Germany) 0.05 mgmL−1 in distilled water for 30 s, washed with distilled water, and air dried. Preparations were mounted in DePeX (Serva, Heidelberg, Germany) and observed under brightfield microscopy.

3.3.5. Cytoskeleton Analysis

Immunofluorescence was carried out in cells grown on coverslips to detect α-tubulin. HeLa cells were fixed in cold methanol for 5 min, washed 3 times for 5 min with PBS, permeabilized for 5 min with 0.5% Triton X-100 (v/v), and later incubated with the primary monoclonal mouse anti-α-tubulin antibody (1:100 in PBS/Bovine serum albumin(BSA), (Sigma, Darmstadt, Germany) for 1 h at 37 °C in a humidified chamber. After washing with PBS three times for 5 min, cells were incubated with the secondary goat anti-mouse antibody fluorescein isothiocyanate (FITC, from Sigma) at a dilution of 1:100 for 1 h at 37 °C. Finally, the cells were washed 3 times for 5 min with PBS, counterstained with the fluorochrome for DNA Hoechst-33258 (H-33258, Sigma) at a concentration of 0.6 mM in distilled water, washed with distilled water, and mounted in ProLong Gold antifade reagent (Molecular Probes). The fluorescence of FITC (green) and H-33258 (blue) was observed with a fluorescence microscope using the appropriate excitation filters.
For F-actin visualization, cells grown on coverslips were fixed in 3% paraformaldehyde for 10 min, washed in PBS for 15 min, and permeabilized with 0.5% (v/v) Triton X-100 in PBS for 20 min at room temperature. Cells were incubated with TRITC-phalloidin (Sigma) for 30 min at 37 °C, washed in PBS and counterstained with 5 µgmL−1 H-33258 in distilled water, washed with distilled water, and mounted in ProLong Gold. Samples were observed by fluorescence microscopy using the corresponding excitation filters.

3.3.6. Confocal Microscopy

Microscopic observations were made, and photographs were taken with an Olympus BX61 fluorescence microscope equipped with ultraviolet (365 nm), blue (420 nm), and green (545 nm) filter sets for fluorescence microscopy and an Olympus DP50 Micromax digital camera from Princeton. Photographs were processed using Adobe Photoshop 8.0 (Adobe Systems, Adobe Systems, San Jose, CA, USA).

3.4. Relaxometric Characterization

3.4.1. Magnetic Relaxivity Measurements

The 1H NMR relaxation times T1 and T2 were measured at 1.41 T in a Relaxometer Minispec mq-one analyzer from Bruker. The samples were prepared in distilled water and incubated at 37 °C for measurement. The concentrations used were less than 1 mM [Co + Fe]. T1 and T2 values were determined by the inversion−recovery method and by the Carr−Purcell−Meiboom−Gill sequence, respectively. Relaxivities (r1, r2) were obtained from the slopes of the curves 1/T1 (s−1) or 1/T2 (s−1) vs. the concentration of Co+Fe expressed in mM.

3.4.2. Magnetic Resonance Imaging

MRI in phantoms and cells was performed with an Agilent/Varian scanner (Agilent, Santa Clara, CA, USA) equipped with a DD2 console and an active-shielded 205/120 gradient insert coil with 130 mTm−1 maximum gradient strength and a combination of volume coil/two-channel phased-array (Rapid Biomedical GmbH, Rimpar, Germany). Images were acquired using a gradient echo sequence with 4 ms/40 ms echo/repetition times, a Band Width (BW) of 100 kHz, and an Field of view (FOV) of 6 cm × 6 cm for a total acquisition time of approximately 80 s; the flip angle was fixed at 20 degrees.

4. Conclusions

We have demonstrated that the electrochemical method gives rise to stoichiometric cobalt ferrite nanoparticles with good magnetic properties and high relaxativity r2 values. The NPs were vectorized with folic acid to render a high uptake dose in the HeLa cancer cell line without a decrease in cell survival. The cytoskeleton retains its structure and morphology when nanoparticles are internalized at high doses. Finally, phantom T2-weighted images present a significant negative enhancement at low metal concentration doses.
We have demonstrated that the electrochemical method gives rise to stoichiometric cobalt ferrite nanoparticles in an easy and reproducible way, with good magnetic properties and some aggregation degree. The NPs were vectorized with folic acid to render a high uptake dose in the HeLa cancer cell line without a decrease in cell survival. MTT analysis reveals an almost null toxicity up to 3 mM of Co + Fe concentration. In addition, this low toxicity results in the cytoskeleton retaining its structure and morphology when nanoparticles are internalized at high doses. Relaxivity measurements of the NP-FA colloidal solution up to concentrations of 1 mM result in a high r2 value of 479 mM−1s−1. Finally, in vitro analysis with the HeLa cell line of phantom T2-weighted images present a progressive negative enhancement with the increase of concentration dose, in accordance with the high r2 value obtained.

Author Contributions

Conceptualization, N.M., P.H. and E.M.; methodology, E.M., J.M.d.l.F., M.C. and F.H.; validation, E.M., M.C., J.M.d.l.F., P.H. and N.M.; investigation, E.M. and J.S.-M.; Resources, P.H. and N.M.; data curation, E.M., M.C., F.H. and J.M.d.l.F.; writing—original draft preparation, E.M.; writing—review and editing, E.M., F.H., M.C., J.M.d.l.F., P.H. and N.M.; supervision, P.H. and N.M.; project administration, P.H. and N.M.; funding acquisition, P.H. and N.M. All authors have read and agreed to the published version of the manuscript.

Funding

We are grateful for the financial support provided by the Spanish Ministry of Economy and Competitiveness who funded this research under project PGC2018-095642-B-I00 and to the Fondo Social Europeo-Gobierno de Aragón, Ministerio de la Economía y Competitividad del Gobierno de España for the public funding of Proyectos I+D+I—Programa Estatal de Investigación, Desarrollo e Innovación Orientada a los Retos de la Sociedad (project n. BIO2017-84246-C2-1-R).

Institutional Review Board Statement

Not applicable.

Informed Consent Statement

Not applicable.

Data Availability Statement

The data presented in this study are available on request from the corresponding author.

Conflicts of Interest

The authors declare no conflict of interest.

References

  1. Liu, C.; Zou, B.; Rondinone, A.J.; Zhang, Z.J. Chemical control of superparamagnetic properties of magnesium and cobalt spinel ferrite nanoparticles through atomic level magnetic couplings. J. Am. Chem. Soc. 2000, 122, 6263–6267. [Google Scholar] [CrossRef]
  2. Gallo-Cordova, Á.; Espinosa, A.; Serrano, A.; Gutiérrez, L.; Menéndez, N.; Del Puerto Morales, M.; Mazario, E. New insights into the structural analysis of maghemite and (MFe2O4, M = Co, Zn) ferrite nanoparticles synthesized by a microwave-assisted polyol process. Mater. Chem. Front. 2020, 4, 3063–3073. [Google Scholar] [CrossRef]
  3. Stein, C.R.; Bezerra, M.T.S.; Holanda, G.H.A.; André-Filho, J.; Morais, P.C. Structural and magnetic properties of cobalt ferrite nanoparticles synthesized by co-precipitation at increasing temperatures. AIP Adv. 2017, 8, 056303. [Google Scholar] [CrossRef]
  4. Lasheras, X.; Insausti, M.; Gil de Muro, I.; Garaio, E.; Plazaola, F.; Moros, M.; De Matteis, L.; de la Fuente, J.M.; Lezama, L. Chemical Synthesis and Magnetic Properties of Monodisperse Nickel Ferrite Nanoparticles for Biomedical Applications. J. Phys. Chem. C 2016, 120, 3492–3500. [Google Scholar] [CrossRef] [Green Version]
  5. Vuong, Q.L.; Berret, J.-F.; Fresnais, J.; Gossuin, Y.; Sandre, O. A Universal Scaling Law to Predict the Efficiency of Magnetic Nanoparticles as MRI T2-Contrast Agents. Adv. Healthc. Mater. 2012, 1, 502–512. [Google Scholar] [CrossRef] [PubMed] [Green Version]
  6. Jun, Y.; Huh, Y.-M.; Choi, J.; Lee, J.-H.; Song, H.-T.; Kim, S.; Yoon, S.; Kim, K.-S.; Shin, J.-S.; Suh, J.-S.; et al. Nanoscale Size Effect of Magnetic Nanocrystals and Their Utilization for Cancer Diagnosis via Magnetic Resonance Imaging. J. Am. Chem. Soc. 2005, 127, 5732–5733. [Google Scholar] [CrossRef]
  7. Lavorato, G.; Alzamora, M.; Contreras, C.; Burlandy, G.; Litterst, F.J.; Baggio-Saitovitch, E. Internal Structure and Magnetic Properties in Cobalt Ferrite Nanoparticles: Influence of the Synthesis Method. Part. Part. Syst. Charact. 2019, 36, 1900061. [Google Scholar] [CrossRef]
  8. Ali, A.; Zafar, H.; Zia, M.; Ul Haq, I.; Phull, A.R.; Ali, J.S.; Hussain, A. Synthesis, characterization, applications, and challenges of iron oxide nanoparticles. Nanotechnol. Sci. Appl. 2016, 9, 49–67. [Google Scholar] [CrossRef] [PubMed] [Green Version]
  9. Tong, S.; Hou, S.; Zheng, Z.; Zhou, J.; Bao, G. Coating Optimization of Superparamagnetic Iron Oxide Nanoparticles for High T2 Relaxivity. Nano Lett. 2010, 10, 4607–4613. [Google Scholar] [CrossRef] [Green Version]
  10. Pellico, J.; Ruiz-Cabello, J.; Fernández-Barahona, I.; Gutiérrez, L.; Lechuga-Vieco, A.V.; Enríquez, J.A.; Morales, M.P.; Herranz, F. One-Step Fast Synthesis of Nanoparticles for MRI: Coating Chemistry as the Key Variable Determining Positive or Negative Contrast. Langmuir 2017, 33, 10239–10247. [Google Scholar] [CrossRef] [Green Version]
  11. Alazmi, A.; Singaravelu, V.; Batra, N.M.; Smajic, J.; Alyami, M.; Khashab, N.M.; Costa, P.M.F.J. Cobalt ferrite supported on reduced graphene oxide as a T2 contrast agent for magnetic resonance imaging. RSC Adv. 2019, 9, 6299–6309. [Google Scholar] [CrossRef] [Green Version]
  12. Geraldes, C.F.G.C.; Laurent, S. Classification and basic properties of contrast agents for magnetic resonance imaging. Contrast Media Mol. Imaging 2009, 4, 1–23. [Google Scholar] [CrossRef]
  13. Shultz, M.D.; Calvin, S.; Fatouros, P.P.; Morrison, S.A.; Carpenter, E.E. Enhanced ferrite nanoparticles as MRI contrast agents. J. Magn. Magn. Mater. 2007, 311, 464–468. [Google Scholar] [CrossRef]
  14. Tromsdorf, U.I.; Bigall, N.C.; Kaul, M.G.; Bruns, O.T.; Nikolic, M.S.; Mollwitz, B.; Sperling, R.A.; Reimer, R.; Hohenberg, H.; Parak, W.J.; et al. Size and Surface Effects on the MRI Relaxivity of Manganese Ferrite Nanoparticle Contrast Agents. Nano Lett. 2007, 7, 2422–2427. [Google Scholar] [CrossRef] [PubMed]
  15. Joshi, H.M.; Lin, Y.P.; Aslam, M.; Prasad, P.V.; Schultz-Sikma, E.A.; Edelman, R.; Meade, T.; Dravid, V.P. Effects of Shape and Size of Cobalt Ferrite Nanostructures on Their MRI Contrast and Thermal Activation. J. Phys. Chem. C 2009, 113, 17761–17767. [Google Scholar] [CrossRef] [Green Version]
  16. Mazarío, E.; Sánchez-Marcos, J.; Menéndez, N.; Cañete, M.; Mayoral, A.; Rivera-Fernández, S.; De La Fuente, J.M.; Herrasti, P. High specific absorption rate and transverse relaxivity effects in manganese ferrite nanoparticles obtained by an electrochemical route. J. Phys. Chem. C 2015, 119, 6828–6834. [Google Scholar] [CrossRef]
  17. Lee, J.-H.; Huh, Y.-M.; Jun, Y.; Seo, J.; Jang, J.; Song, H.-T.; Kim, S.; Cho, E.-J.; Yoon, H.-G.; Suh, J.-S.; et al. Artificially engineered magnetic nanoparticles for ultra-sensitive molecular imaging. Nat. Med. 2007, 13, 95–99. [Google Scholar] [CrossRef]
  18. Kim, D.-H.; Zeng, H.; Ng, T.C.; Brazel, C.S. T1 and T2 relaxivities of succimer-coated MFe23+O4 (M=Mn2+, Fe2+ and Co2+) inverse spinel ferrites for potential use as phase-contrast agents in medical MRI. J. Magn. Magn. Mater. 2009, 321, 3899–3904. [Google Scholar] [CrossRef]
  19. Albino, M.; Fantechi, E.; Innocenti, C.; López-Ortega, A.; Bonanni, V.; Campo, G.; Pineider, F.; Gurioli, M.; Arosio, P.; Orlando, T.; et al. Role of Zn2+ Substitution on the Magnetic, Hyperthermic, and Relaxometric Properties of Cobalt Ferrite Nanoparticles. J. Phys. Chem. C 2019, 123, 6148–6157. [Google Scholar] [CrossRef] [Green Version]
  20. Kevadiya, B.D.; Bade, A.N.; Woldstad, C.; Edagwa, B.J.; McMillan, J.M.; Sajja, B.R.; Boska, M.D.; Gendelman, H.E. Development of europium doped core-shell silica cobalt ferrite functionalized nanoparticles for magnetic resonance imaging. Acta Biomater. 2017, 49, 507–520. [Google Scholar] [CrossRef] [PubMed] [Green Version]
  21. Yue, H.; Park, J.A.; Ho, S.L.; Ahmad, M.Y.; Cha, H.; Liu, S.; Tegafaw, T.; Marasini, S.; Ghazanfari, A.; Kim, S.; et al. New Class of Efficient T2 Magnetic Resonance Imaging Contrast Agent: Carbon-Coated Paramagnetic Dysprosium Oxide Nanoparticles. Pharmaceuticals 2020, 13, 312. [Google Scholar] [CrossRef] [PubMed]
  22. Weissleder, R.; Bogdanov, A.; Papisov, M. Drug targeting in magnetic resonance imaging. Magn. Reson. Q. 1992, 8, 55–63. [Google Scholar] [PubMed]
  23. Bulte, J.W.M.; Kraitchman, D.L. Iron oxide MR contrast agents for molecular and cellular imaging. NMR Biomed. 2004, 17, 484–499. [Google Scholar] [CrossRef] [PubMed]
  24. Dixit, V.; Van den Bossche, J.; Sherman, D.M.; Thompson, D.H.; Andres, R.P. Synthesis and Grafting of Thioctic Acid—PEG—Folate Conjugates onto Au Nanoparticles for Selective Targeting of Folate Receptor-Positive Tumor Cells. Bioconj. Chem. 2006, 17, 603–609. [Google Scholar] [CrossRef]
  25. Arbab, A.S.; Wilson, L.B.; Ashari, P.; Jordan, E.K.; Lewis, B.K.; Frank, J.A. A model of lysosomal metabolism of dextran coated superparamagnetic iron oxide (SPIO) nanoparticles: Implications for cellular magnetic resonance imaging. NMR Biomed. 2005, 18, 383–389. [Google Scholar] [CrossRef] [PubMed]
  26. Laskar, A.; Ghosh, M.; Khattak, S.I.; Li, W.; Yuan, X.-M. Degradation of superparamagnetic iron oxide nanoparticle-induced ferritin by lysosomal cathepsins and related immune response. Nanomedicine 2012, 7, 705–717. [Google Scholar] [CrossRef]
  27. Falke, S.; Betzel, C. Chapter 6: Dynamic Light Scattering (DLS). In Radiation in Bioanalysis: Spectroscopic Techniques and Theoretical Methods; Pereira, A.S., Tavares, P., Limão-Vieira, P., Eds.; Springer: Cham, Switzerland, 2019; pp. 173–193. ISBN 978-3-030-28247-9. [Google Scholar]
  28. Kombaiah, K.; Vijaya, J.J.; Kennedy, L.J.; Bououdina, M.; Al Najar, B. Self heating efficiency of CoFe2O4 nanoparticles: A comparative investigation on the conventional and microwave combustion method. J. Alloys Compd. 2018, 735, 1536–1545. [Google Scholar] [CrossRef]
  29. Phong, P.T.; Phuc, N.X.; Nam, P.H.; Chien, N.V.; Dung, D.D.; Linh, P.H. Size-controlled heating ability of CoFe2O4 nanoparticles for hyperthermia applications. Phys. B Condens. Matter 2018, 531, 30–34. [Google Scholar] [CrossRef]
  30. Chantrell, R.W.; Walmsley, N.S.; Gore, J.; Maylin, M. Theoretical studies of the field-cooled and zero-field cooled magnetization of interacting fine particles. J. Appl. Phys. 1999, 85, 4340–4342. [Google Scholar] [CrossRef]
  31. Corot, C.; Robert, P.; Idée, J.-M.; Port, M. Recent advances in iron oxide nanocrystal technology for medical imaging. Adv. Drug Deliv. Rev. 2006, 58, 1471–1504. [Google Scholar] [CrossRef]
  32. Schultz-Sikma, E.A.; Joshi, H.M.; Ma, Q.; MacRenaris, K.W.; Eckermann, A.L.; Dravid, V.P.; Meade, T.J. Probing the Chemical Stability of Mixed Ferrites: Implications for Magnetic Resonance Contrast Agent Design. Chem. Mater. 2011, 23, 2657–2664. [Google Scholar] [CrossRef] [Green Version]
  33. Venkatesha, N.; Srivastava, C.; Hegde, V. Synergetic effect of size and morphology of cobalt ferrite nanoparticles on proton relaxivity. IET Nanobiotechnol. 2014, 8, 184–189. [Google Scholar]
  34. Liu, F.; Laurent, S.; Roch, A.; Vander Elst, L.; Muller, R.N. Size-Controlled Synthesis of CoFe2O4 Nanoparticles Potential Contrast Agent for MRI and Investigation on Their Size-Dependent Magnetic Properties. J. Nanomater. 2013, 2013, 462540. [Google Scholar] [CrossRef] [Green Version]
  35. Cannas, C.; Musinu, A.; Ardu, A.; Orrù, F.; Peddis, D.; Casu, M.; Sanna, R.; Angius, F.; Diaz, G.; Piccaluga, G. CoFe2O4 and CoFe2O4/SiO2 core/shell nanoparticles: Magnetic and spectroscopic study. Chem. Mater. 2010, 22, 3353–3361. [Google Scholar] [CrossRef]
  36. Kim, D.-H.; Lee, S.-H.; Kim, K.-N.; Kim, K.-M.; Shim, I.-B.; Lee, Y.-K. Cytotoxicity of ferrite particles by MTT and agar diffusion methods for hyperthermic application. J. Magn. Magn. Mater. 2005, 293, 287–292. [Google Scholar] [CrossRef]
  37. Mazarío, E.; Herrasti, P.; Morales, M.P.; Menéndez, N. Synthesis and characterization of CoFe2O4 ferrite nanoparticles obtained by an electrochemical method. Nanotechnology 2012, 23, 355708. [Google Scholar] [CrossRef] [PubMed]
  38. Mazario, E.; Morales, M.P.; Galindo, R.; Herrasti, P.; Menendez, N. Influence of the temperature in the electrochemical synthesis of cobalt ferrites nanoparticles. J. Alloys Compd. 2012, 536, S222–S225. [Google Scholar] [CrossRef]
Figure 1. (a) Thermogravimetric analysis of bare nanoparticles (NP) (black line) and nanoparticle-folic acid (NP-FA) (blue line) under air conditions. The striped square is a guide for eyes to highlight the difference in weight loss between samples. (b) FTIR spectrum of bare NPs, NPs functionalized with folic acid, and the FA molecule.
Pharmaceuticals 14 00124 g001
Figure 2. (a) Transmission electron microscopy (TEM) images of nanoparticles functionalized with folic acid. (b) Comparison of the nanoparticle size and hydrodynamic size distribution.
Pharmaceuticals 14 00124 g002
Figure 3. (a) Magnetic hysteresis loop at 300 K, (b) zero-field-cooling/field-cooling (ZFC/FC) curves, both of them for the sample NP-FA. Magnetization (M) was reflected as emu per gram of nanoparticle.
Pharmaceuticals 14 00124 g003
Figure 4. (a) T1 and T2 inverse measurements vs. cobalt and iron millimolar concentration. The slope of these curves corresponds to r1 and r2 relaxivities. (b) T2-weigthed magnetic resonance (MR) images of NP-FA in aqueous solution at various metal concentrations using a Varian 7T micro magnetic resonance imaging (MRI) scanner.
Pharmaceuticals 14 00124 g004
Figure 5. Bars diagram of biocompatibility of NPs functionalized with folic acid in HeLa cells measured by MTT assay. Blue columns, cells incubated 6 h with different concentrations of NPs and their viability measured 24 h later. Green columns, cells incubated for 24 h and their viability measured 24 h later. The results represent the average of 6 independent experiments. Optical micrographies of control cells, NP-FA 0.6 mM internalization in HeLa cells incubated for 6 and 24 h. Scale bar 10 µm.
Pharmaceuticals 14 00124 g005
Figure 6. Analysis of cytoskeleton in HeLa cells incubated 24 h with 0.6 mM metal concentration and observed under fluorescence and bright-field microscopy immediately after incubations. (a) Immunofluorescence staining of α-tubulin observed under blue light excitation. (b) TRITC-phalloidin visualization of actin microfilaments observed under green light excitation.
Pharmaceuticals 14 00124 g006
Figure 7. MRI of phantoms were performed to measure the T2 relaxivity of the SPION complex-labeled cells. (a,b) Transversal and longitudinal T2-weighted images of HeLa cells incubated with varied concentration of NP-FA.
Pharmaceuticals 14 00124 g007
Table 1. Relaxivity collection values found in the literature as a function of nanoparticle diameter and coating.
Contrast Agents [31]MaterialCoatingD(TEM) nmr1r2r2/r1
This workCoFe2O4Folic acid17(4)10.347946
Lee et al. [17]2,3-Dimercaptosuccinic acid 172
Schultz-Sikma et al. [32]Silica7 142
Joshi et al. [15]11-aminoundecanoic acid15 301
Kim et al. [18]DMSA8639262
Venkatesha et al. [33]Chitosan6 32
Liu et al. [34]Citrate37.8927.875.12.7
Sinerem®γ-Fe2O3Dextran4–159.9657
Resovist®Carboxydextran4–159.718919
VSOP_C184®Citric acid51433.42
Endorem®Dextran4–1510.112012
Publisher’s Note: MDPI stays neutral with regard to jurisdictional claims in published maps and institutional affiliations.

