
Network Pharmacology of Red Ginseng (Part I): Effects of Ginsenoside Rg5 at Physiological and Sub-Physiological Concentrations


Abstract
:1. Introduction
2. Results
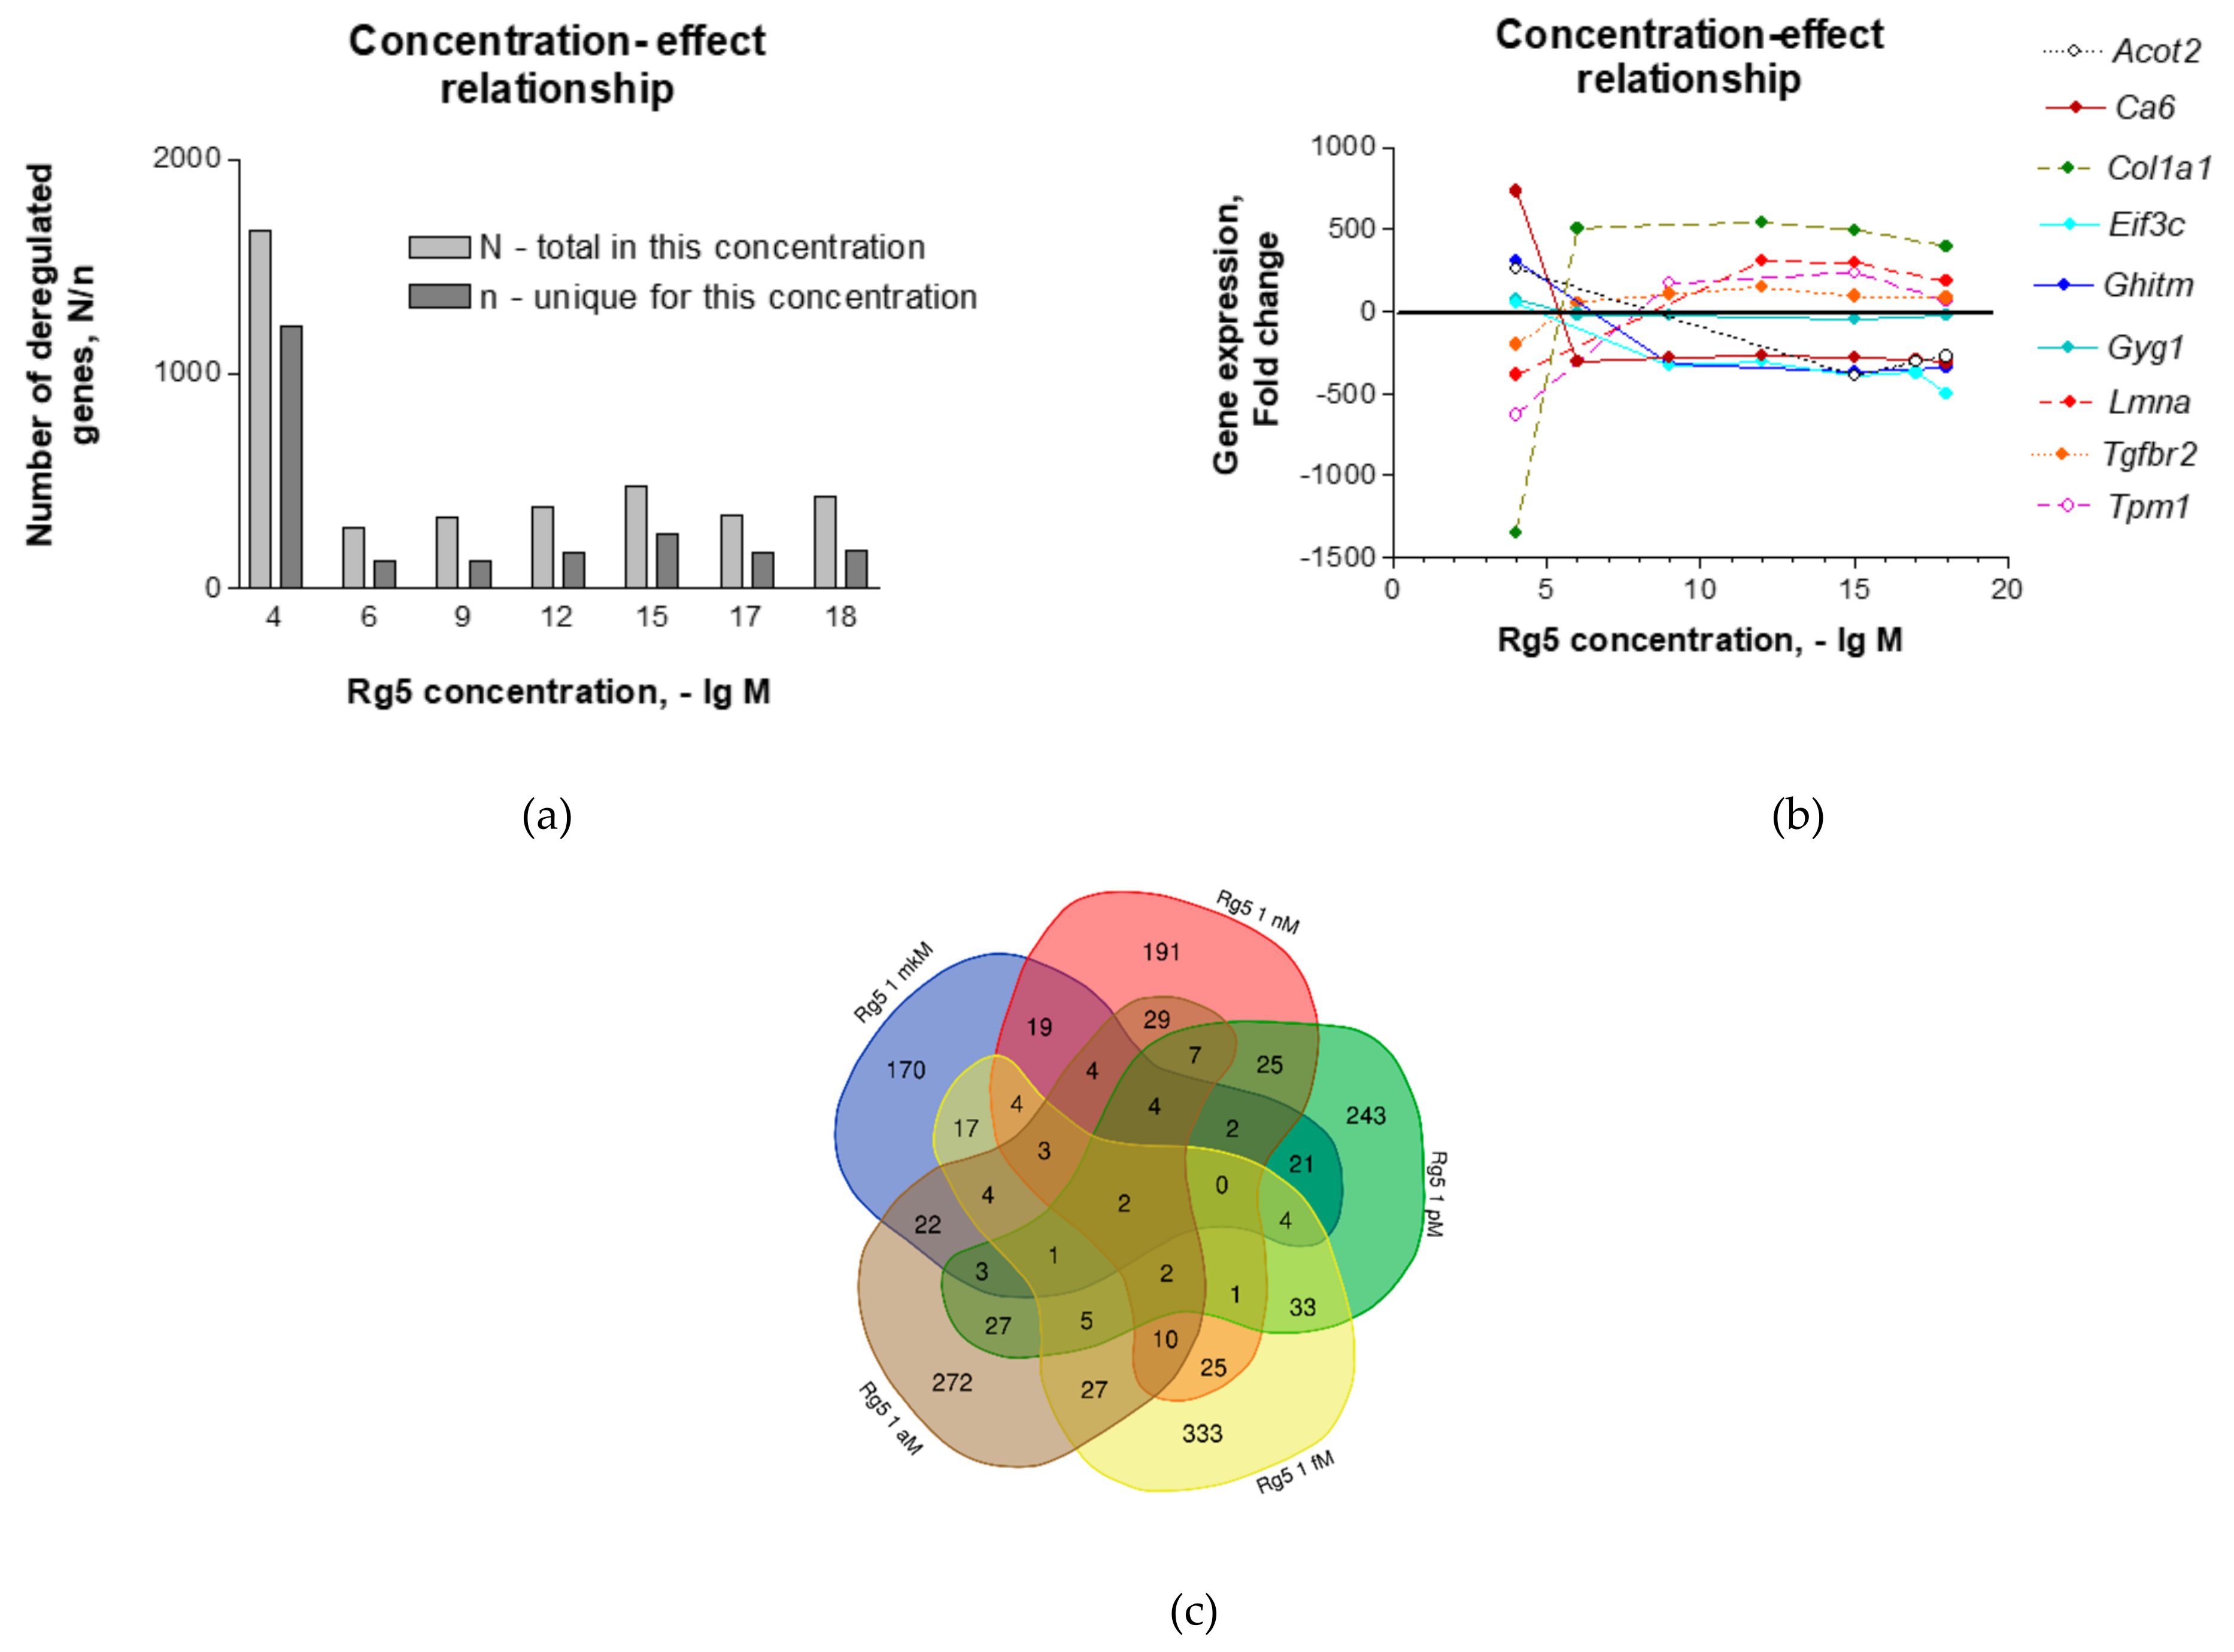
2.1. Effect of Ginsenoside Rg5 on Gene Expression Profiles in the Murine Hippocampal Neuronal Cell Line HT22
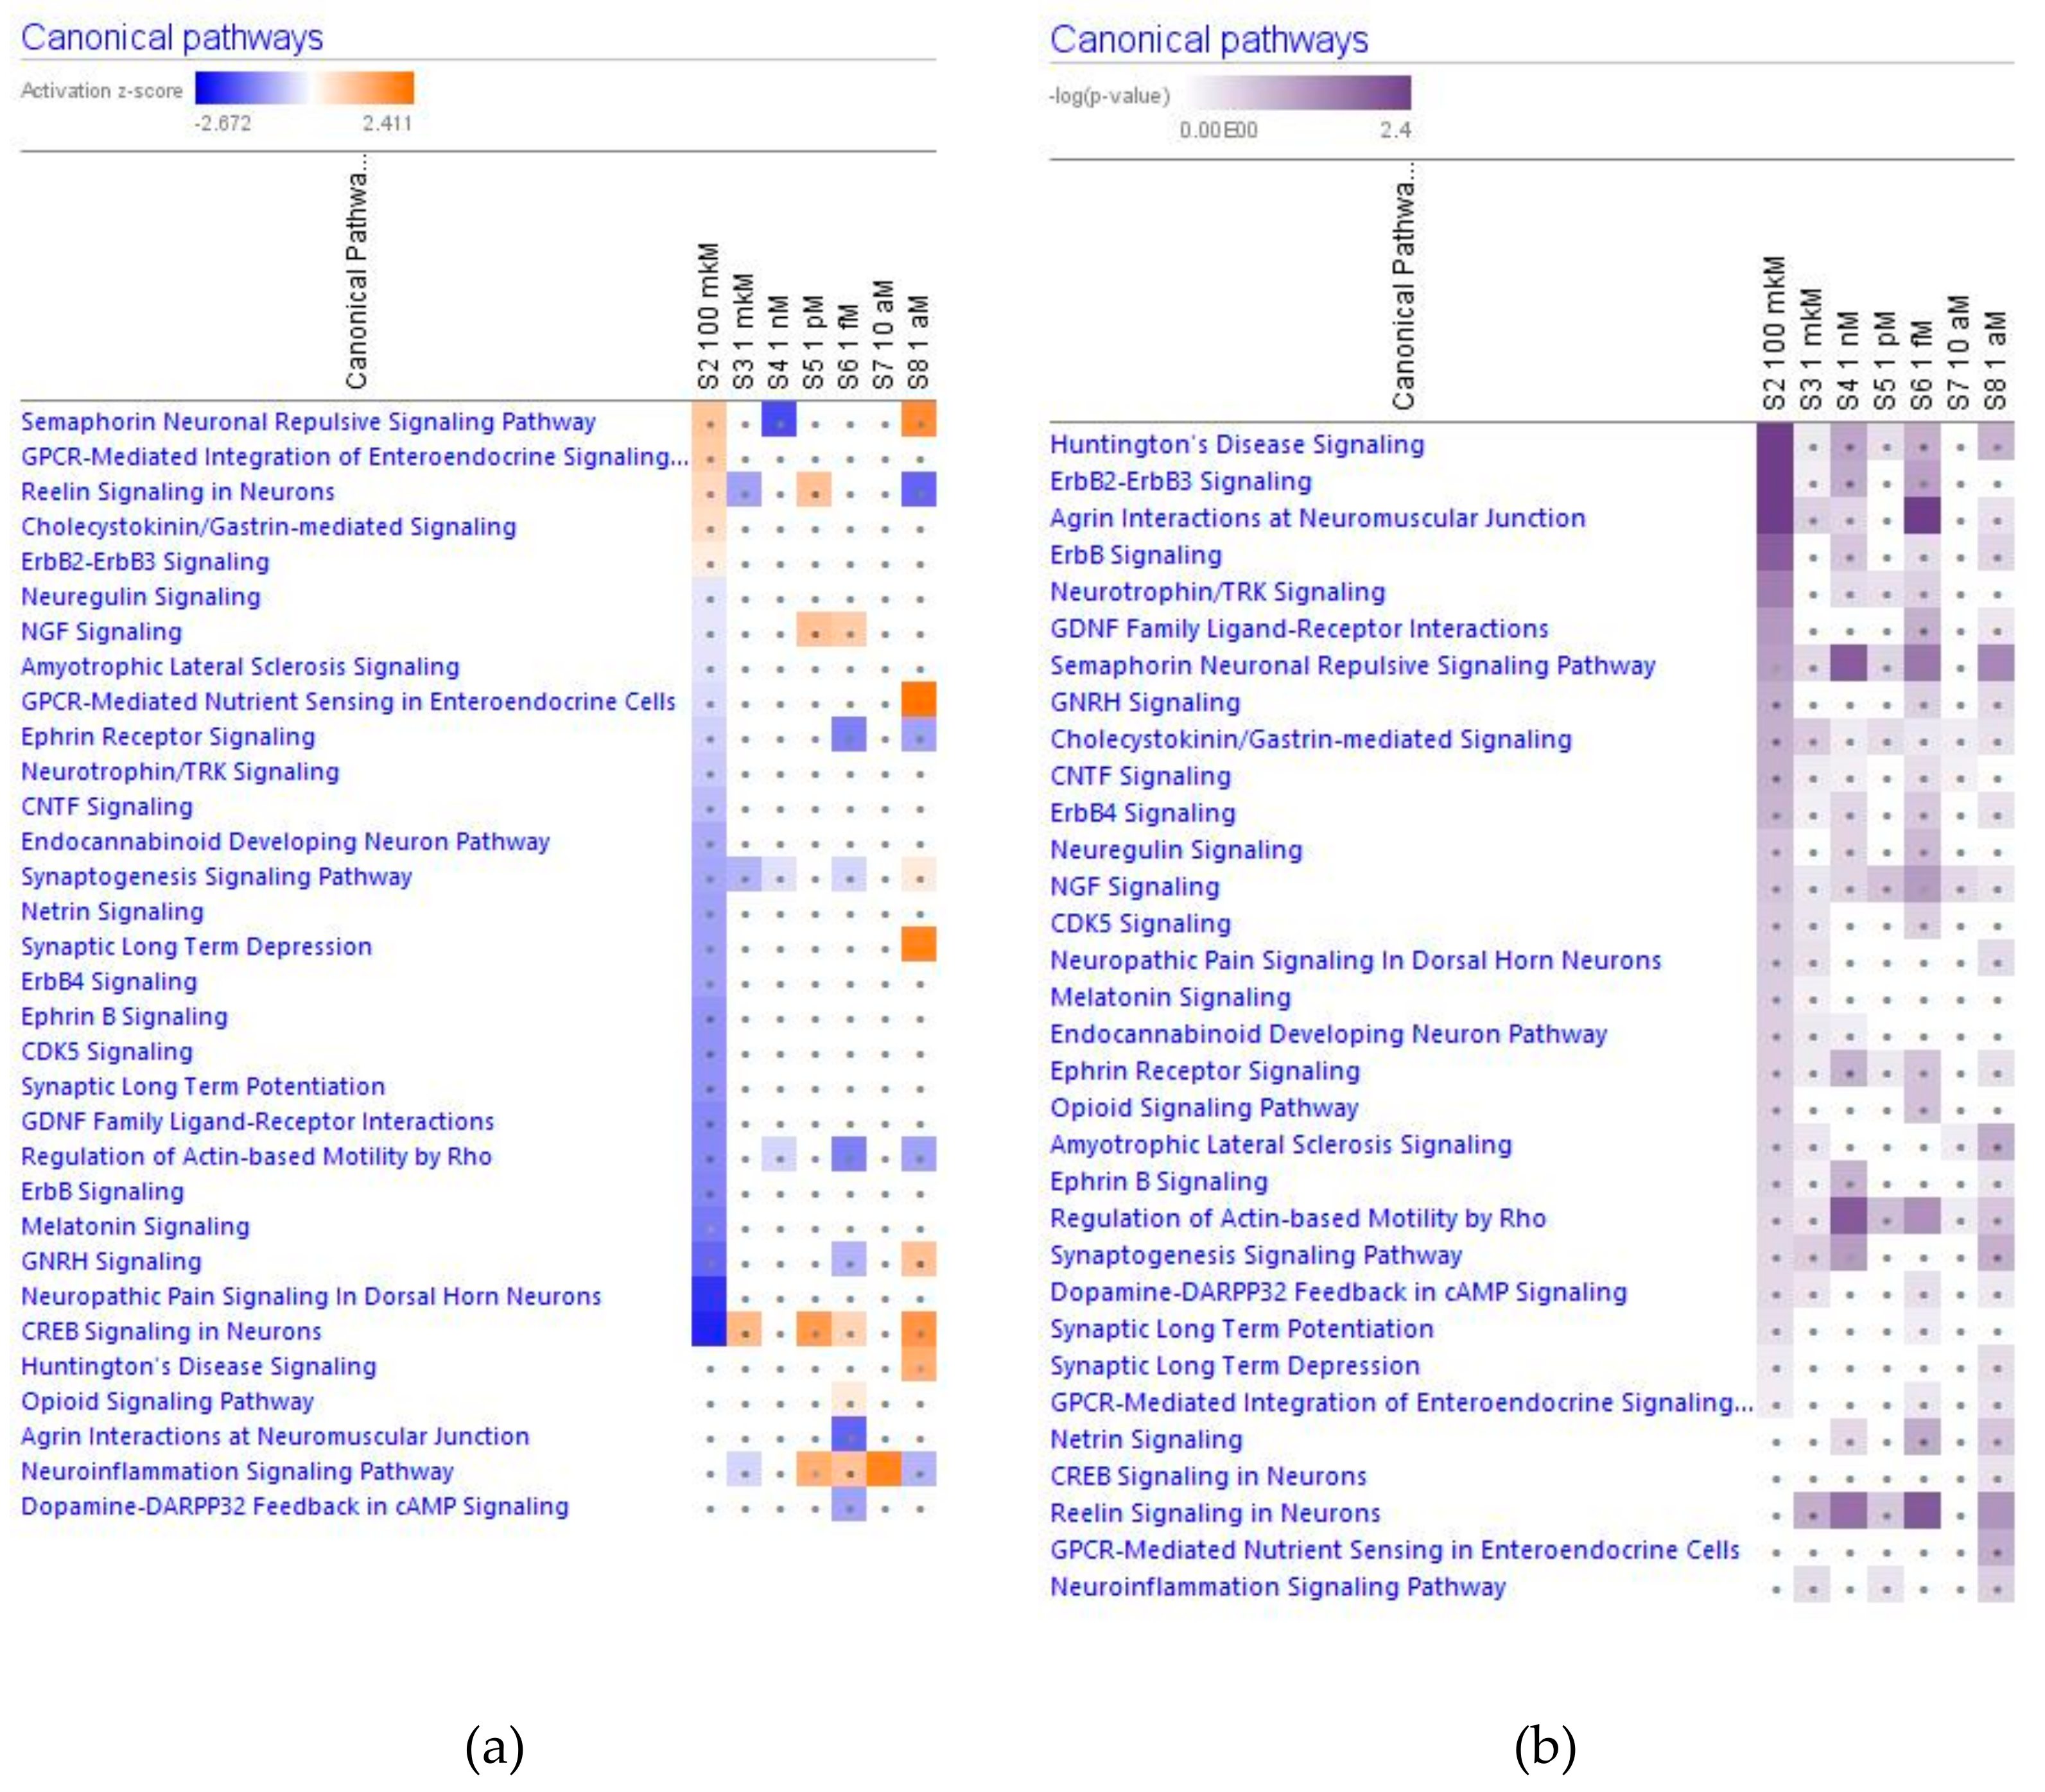
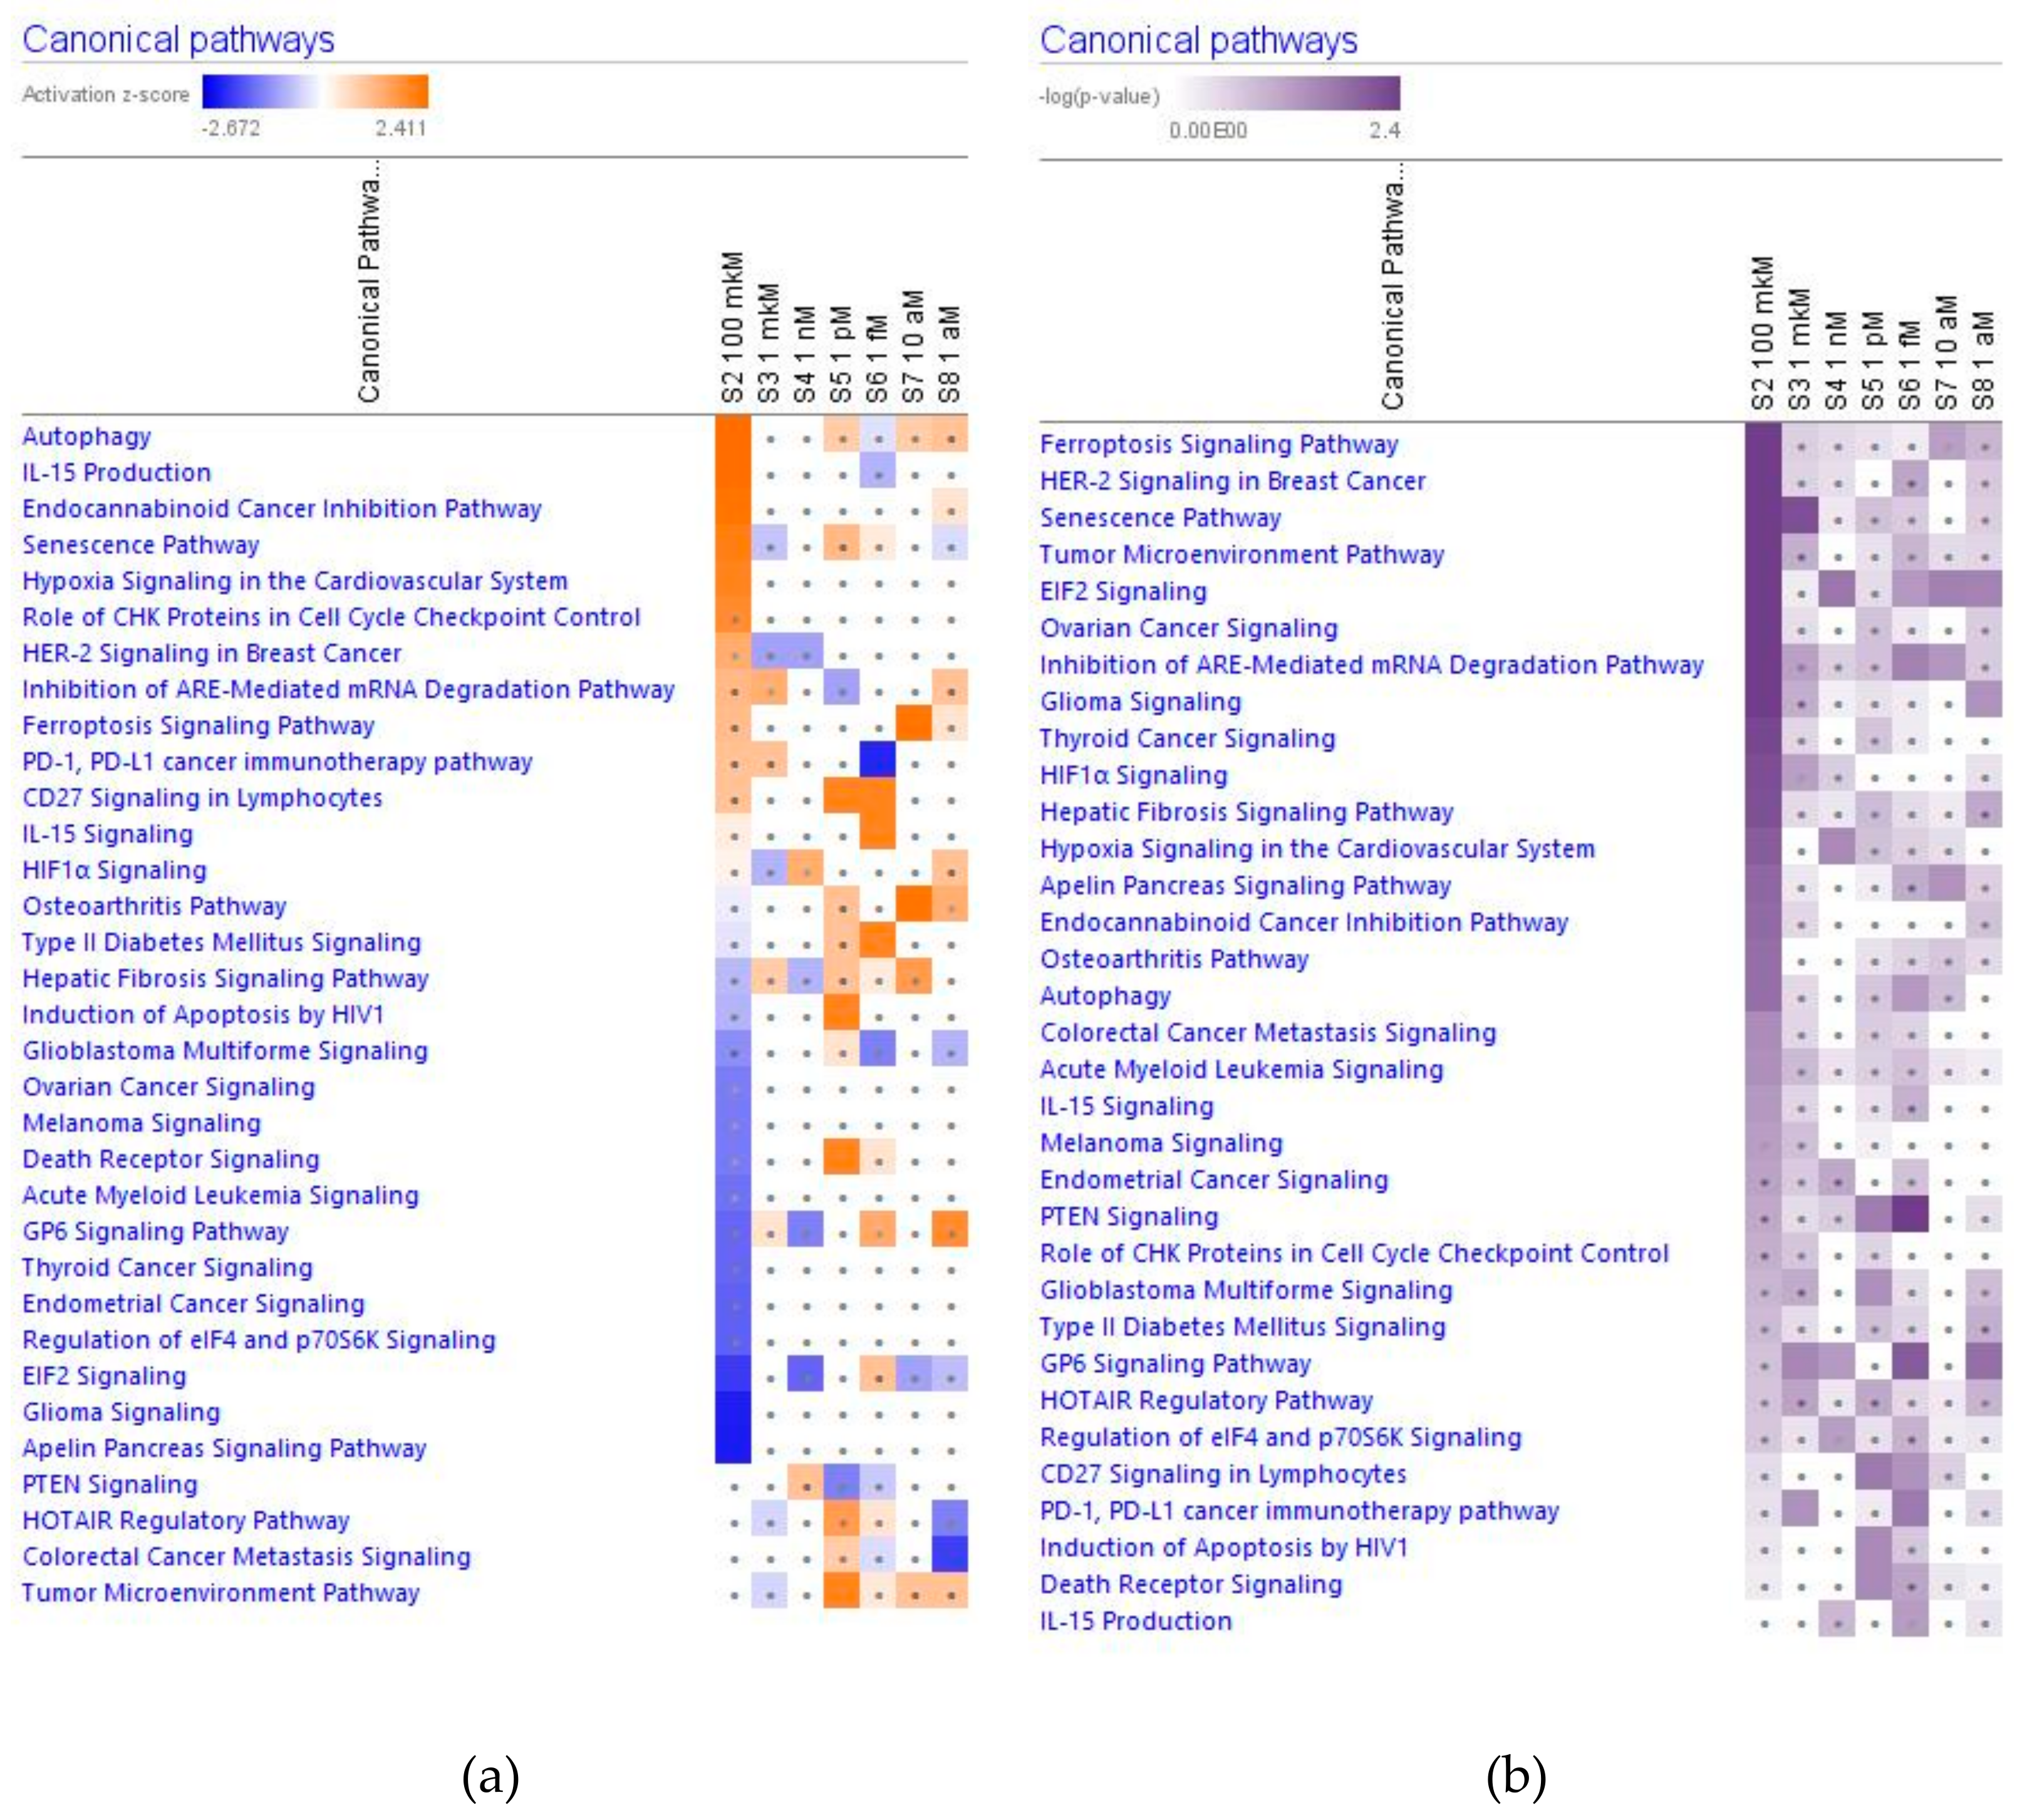
2.2. Effect of Ginsenoside Rg5 on Signaling Canonical Pathways
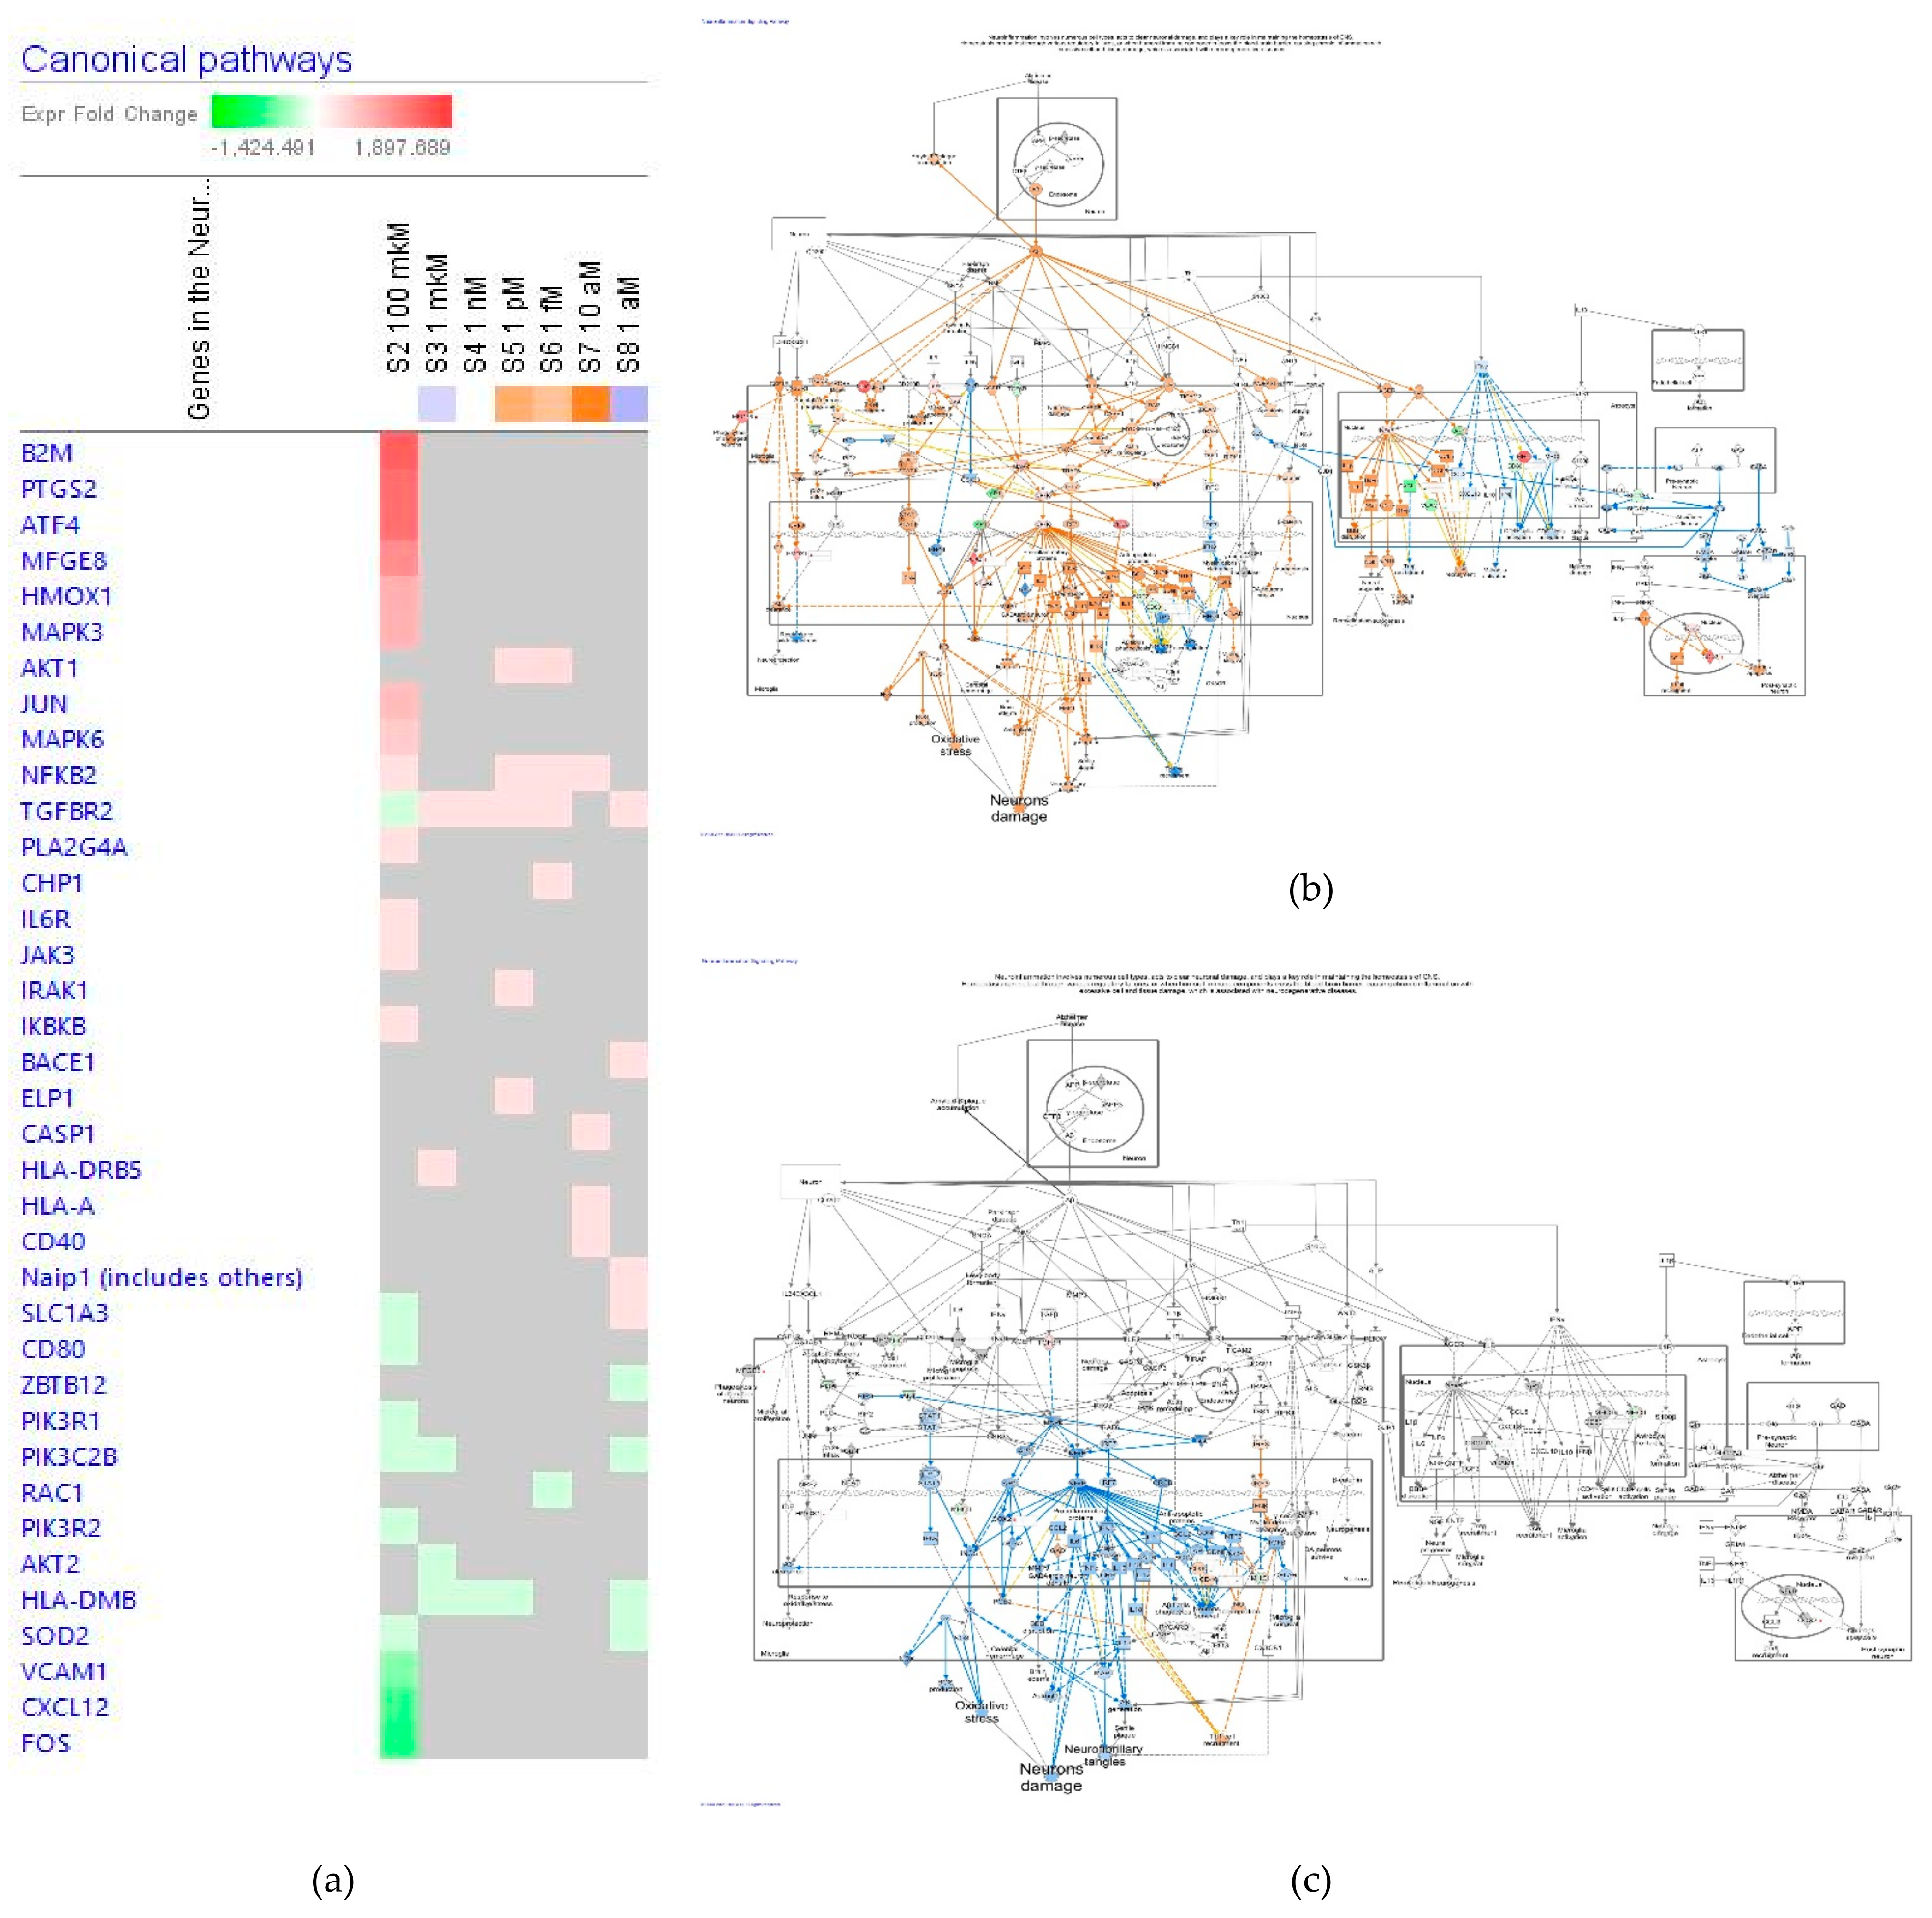
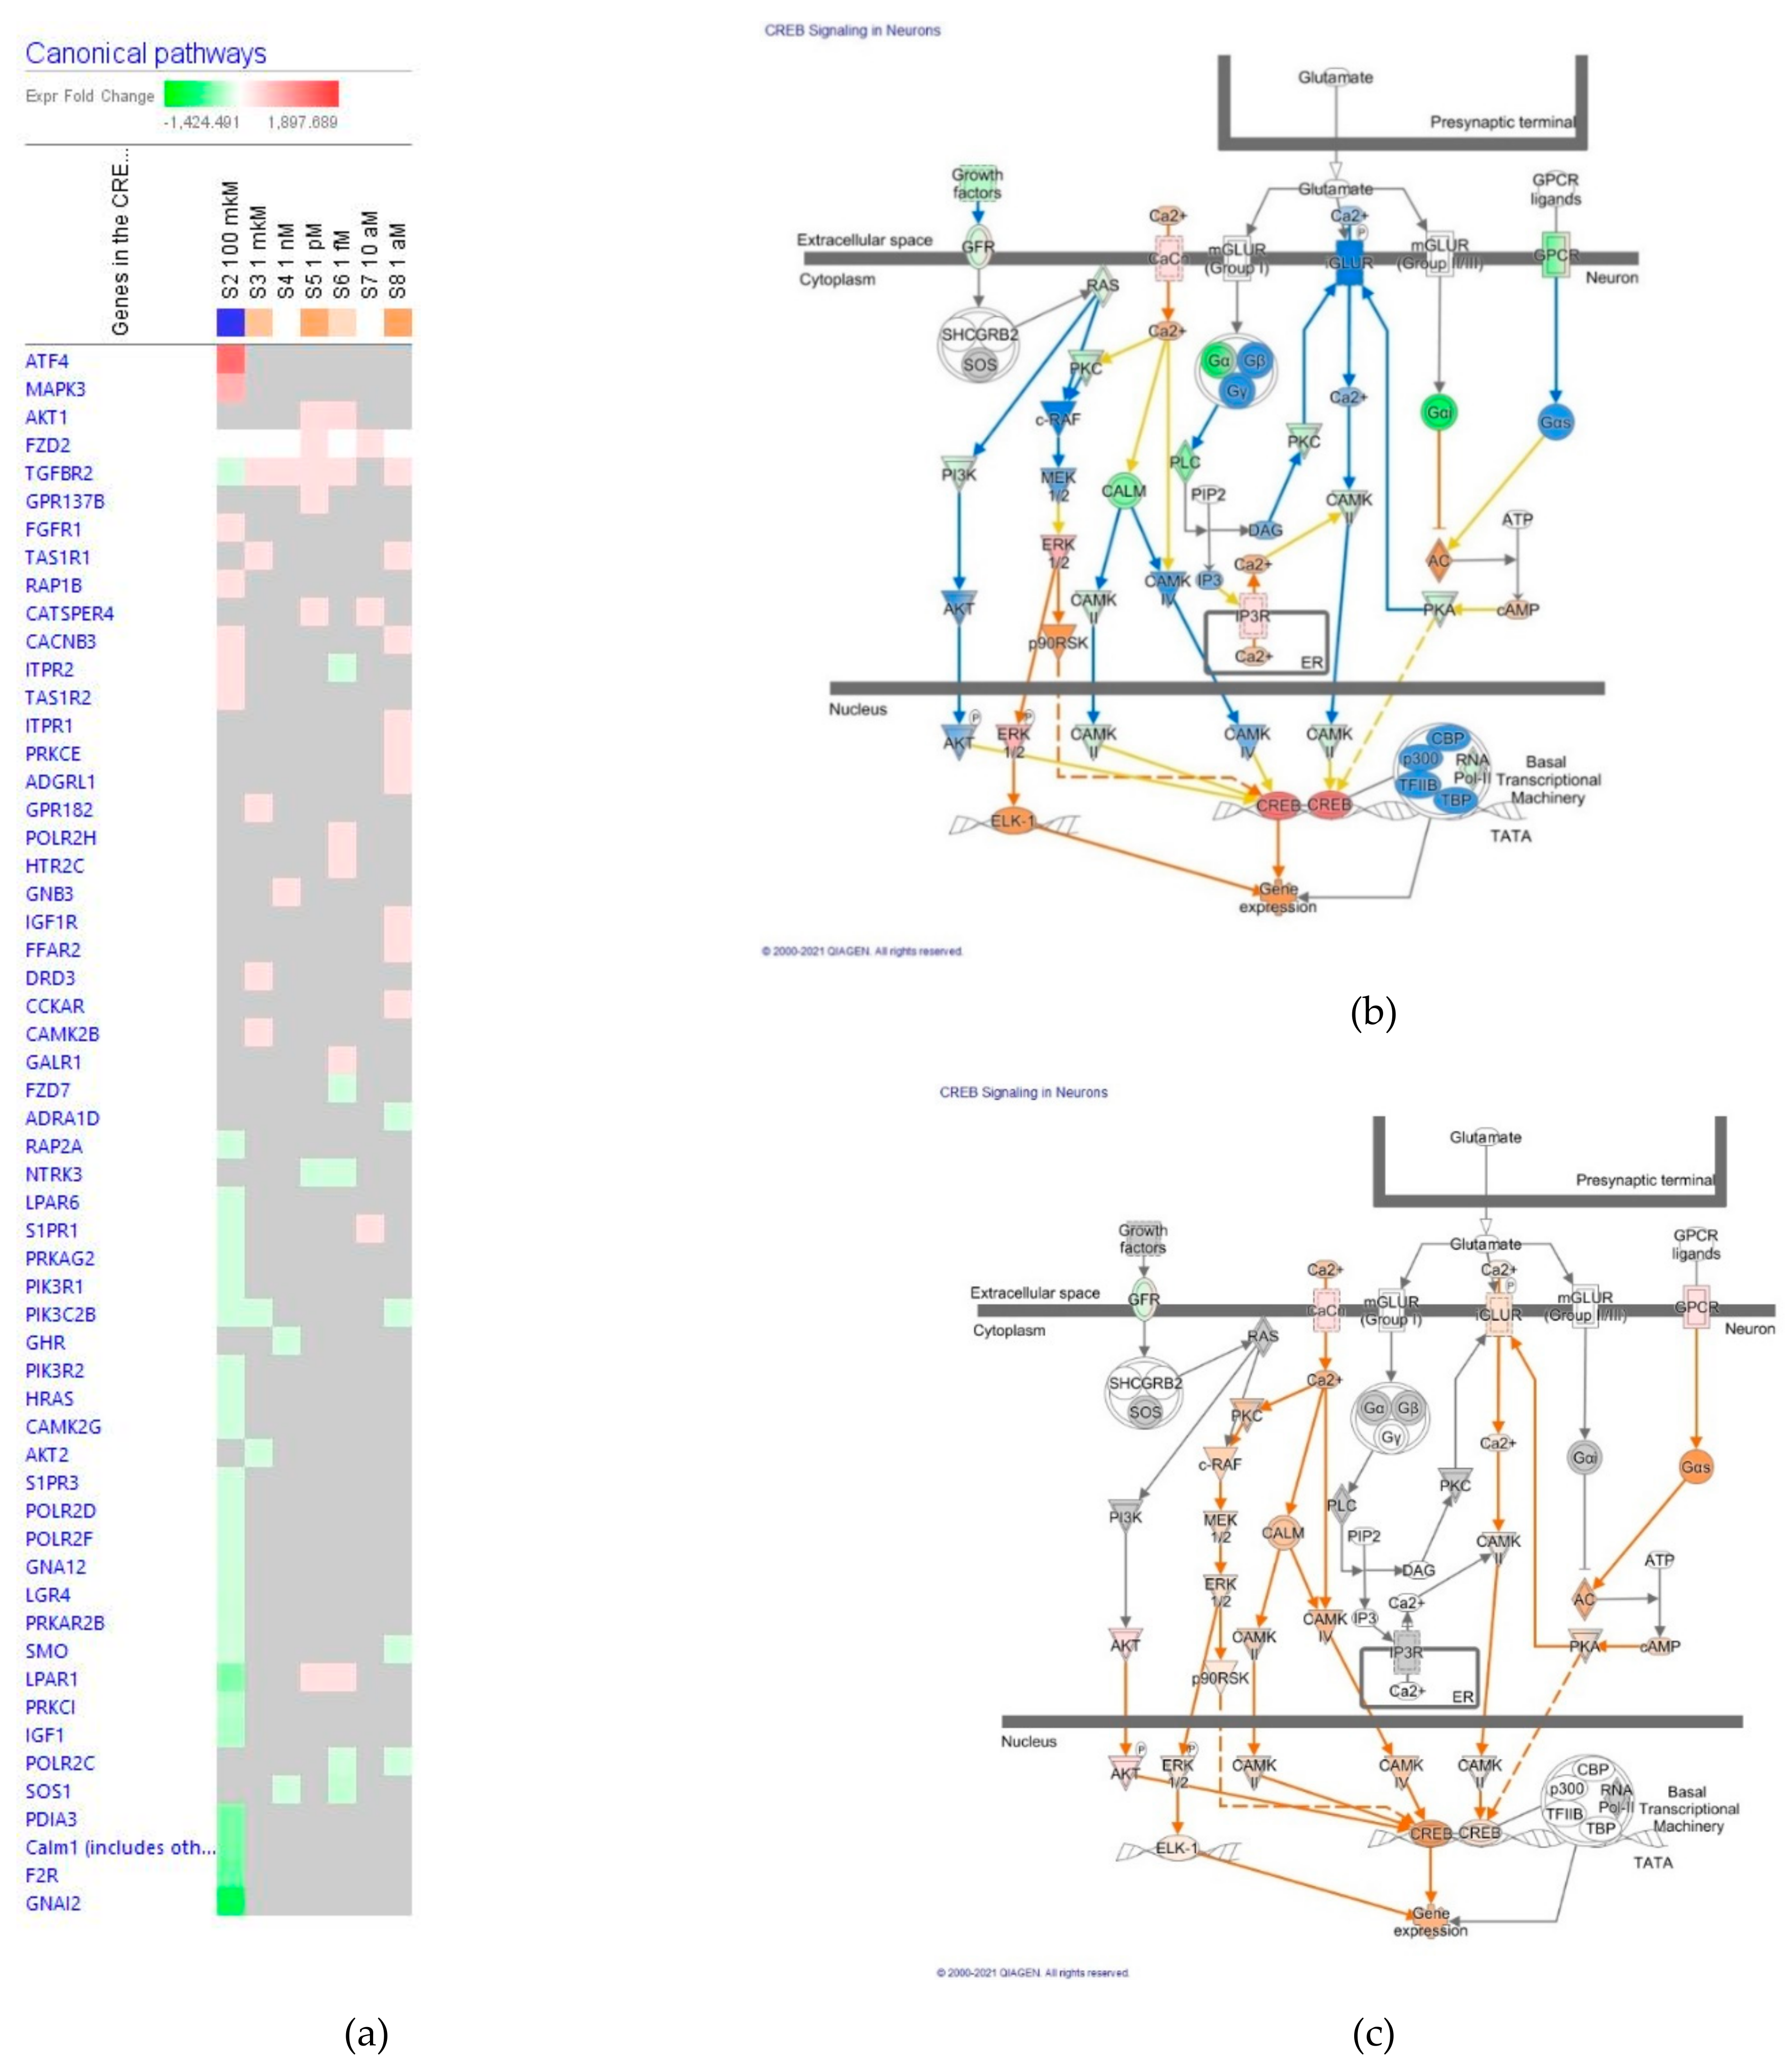
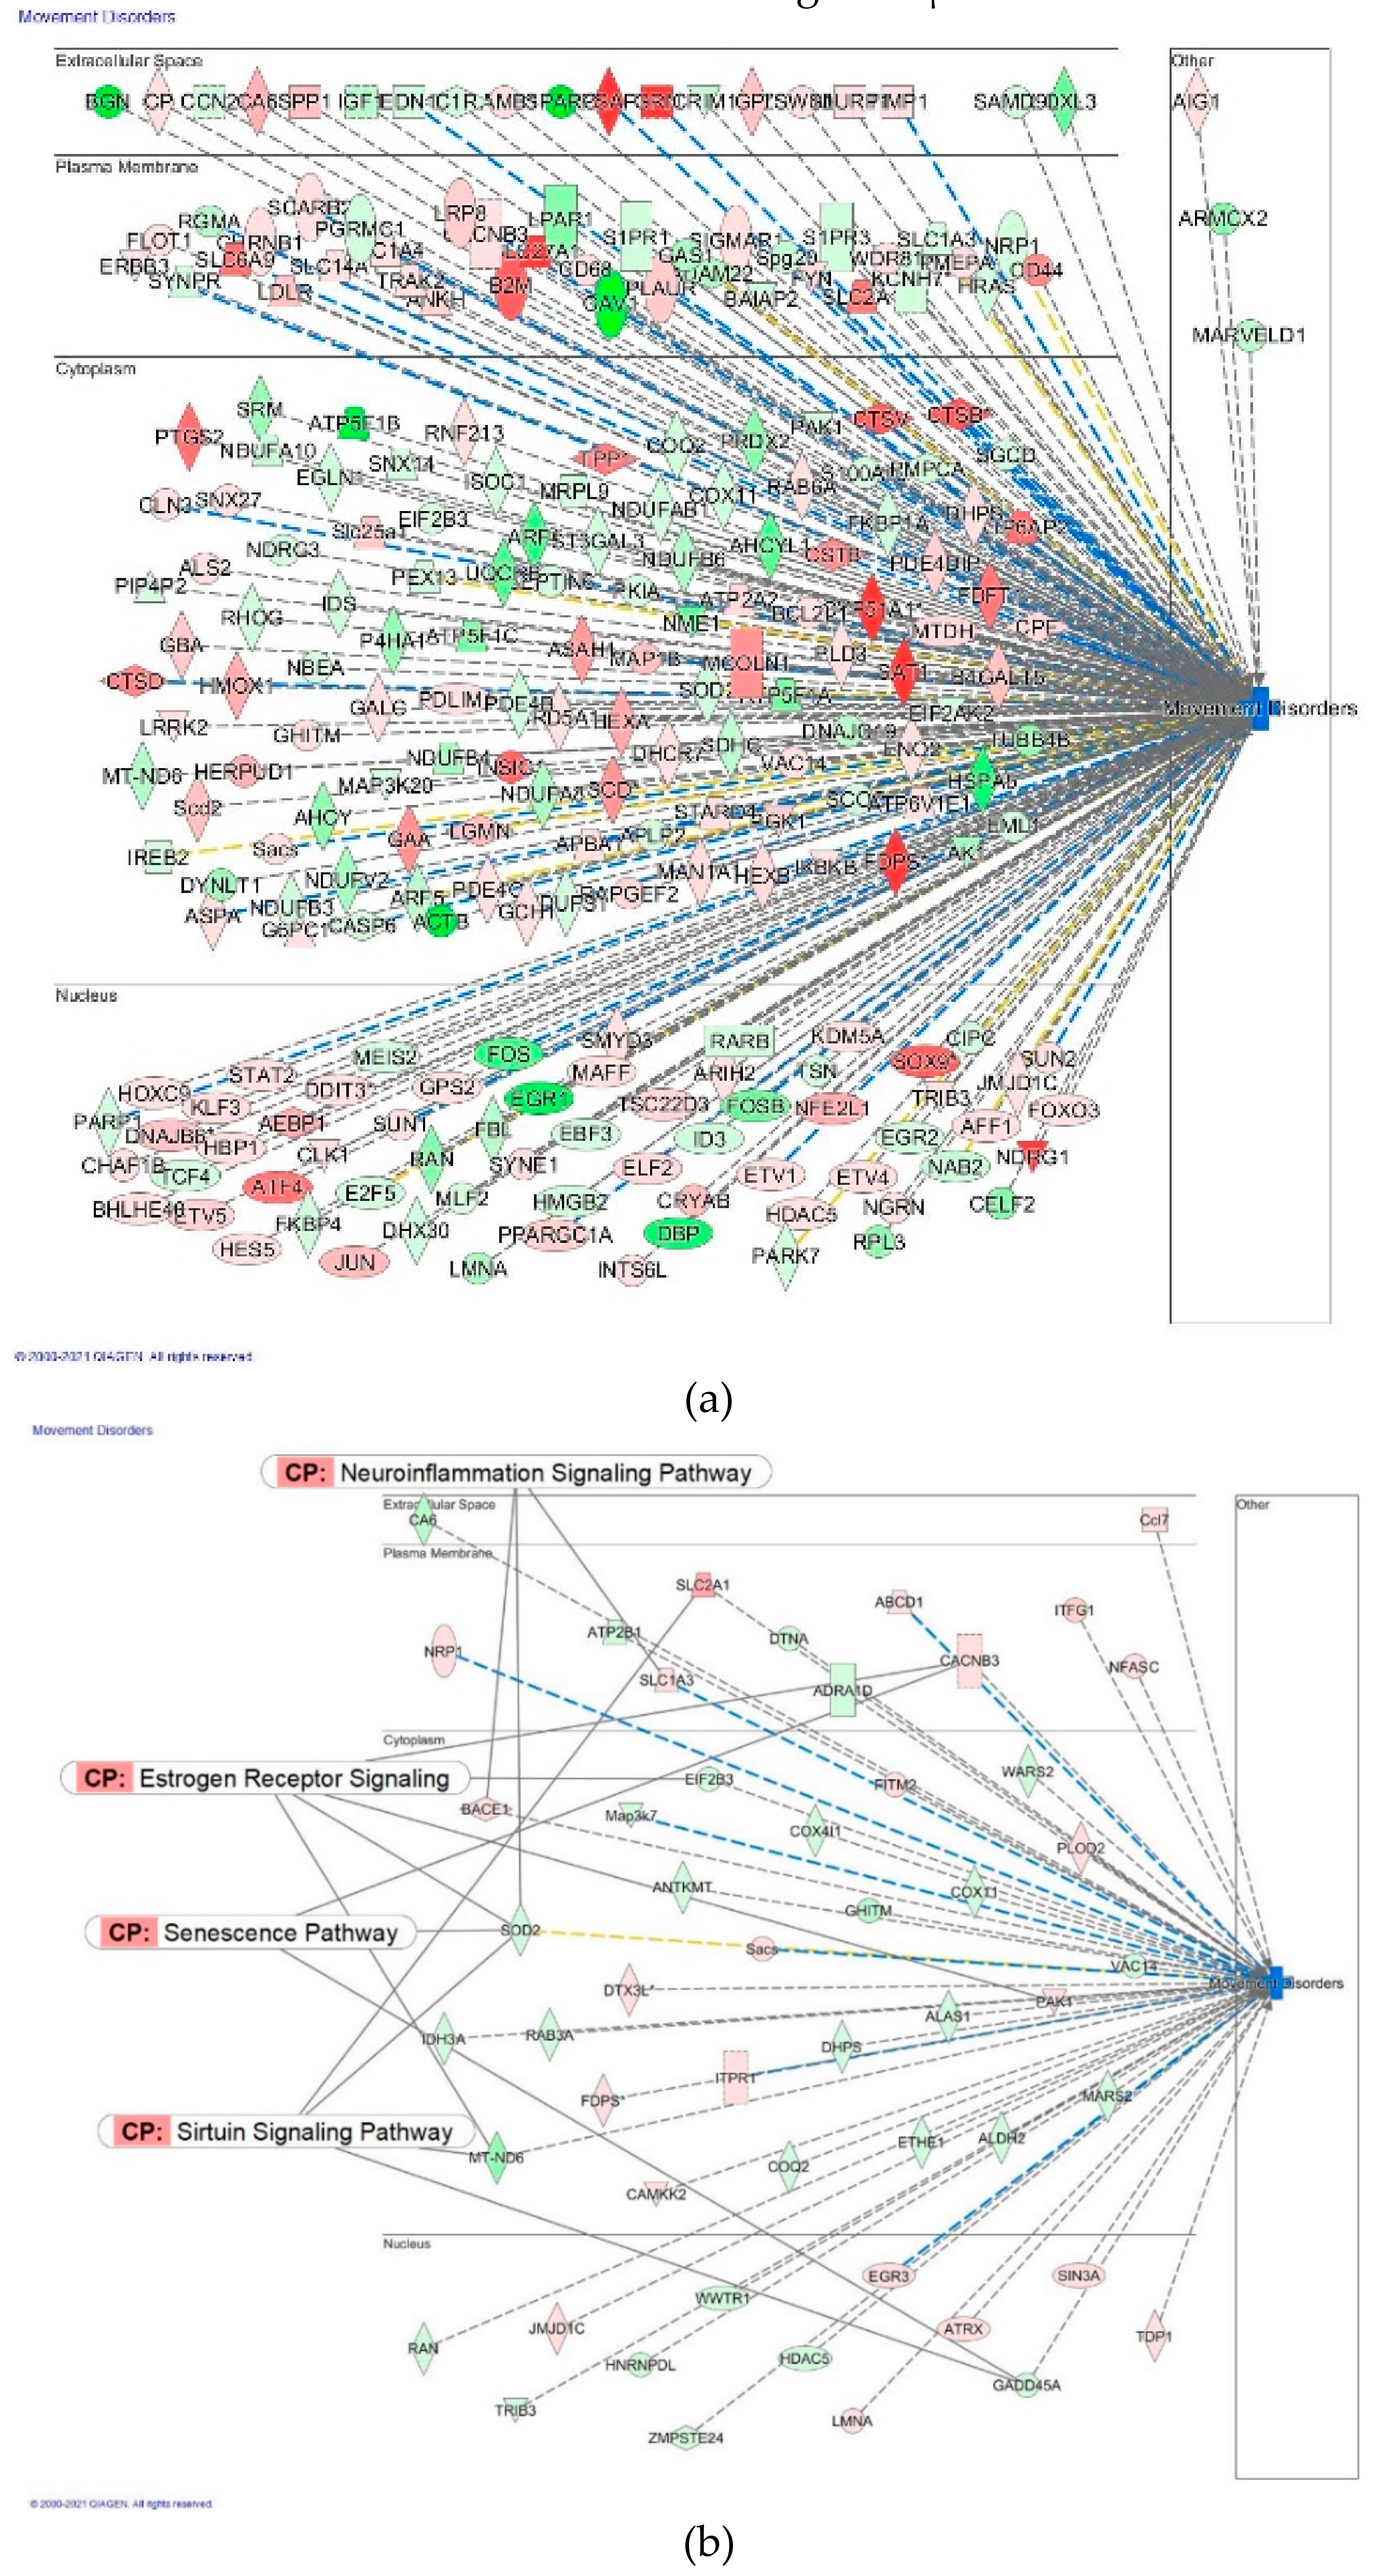
2.2.1. Neurotransmitters and Nervous System Signaling
The Neuroinflammation Signaling Pathway
The cAMP/CREB Signaling Pathway in Neurons
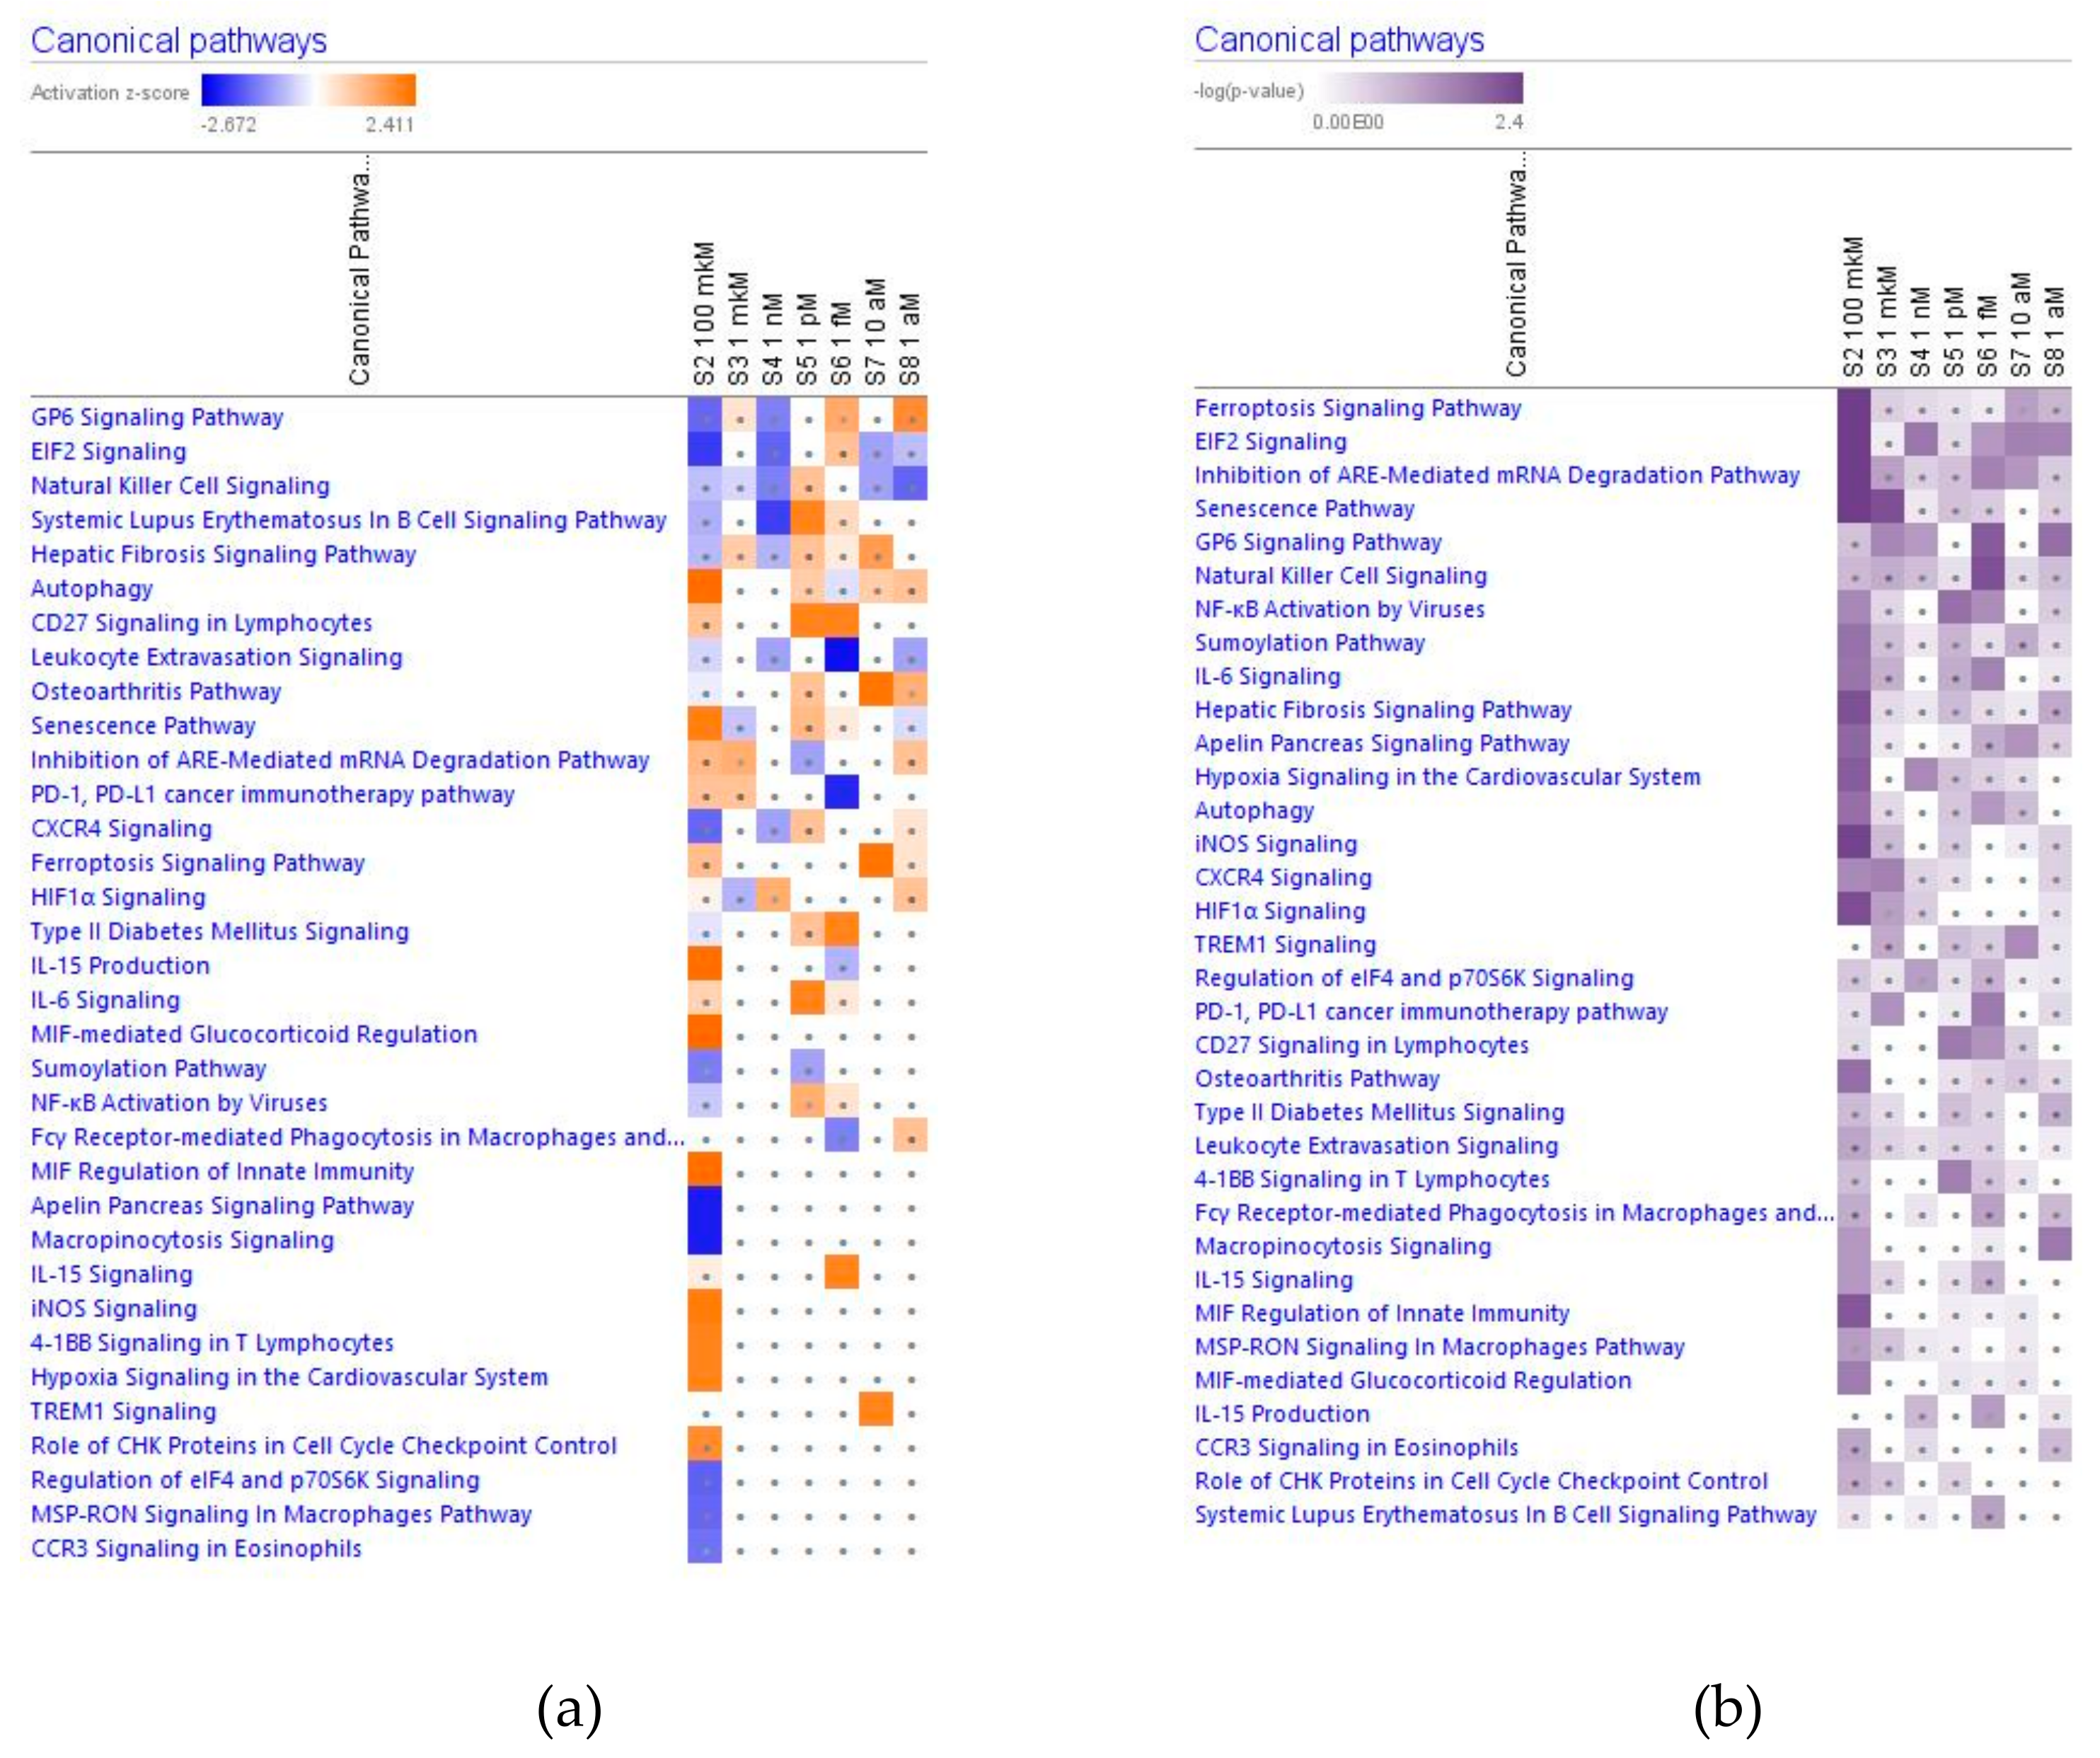
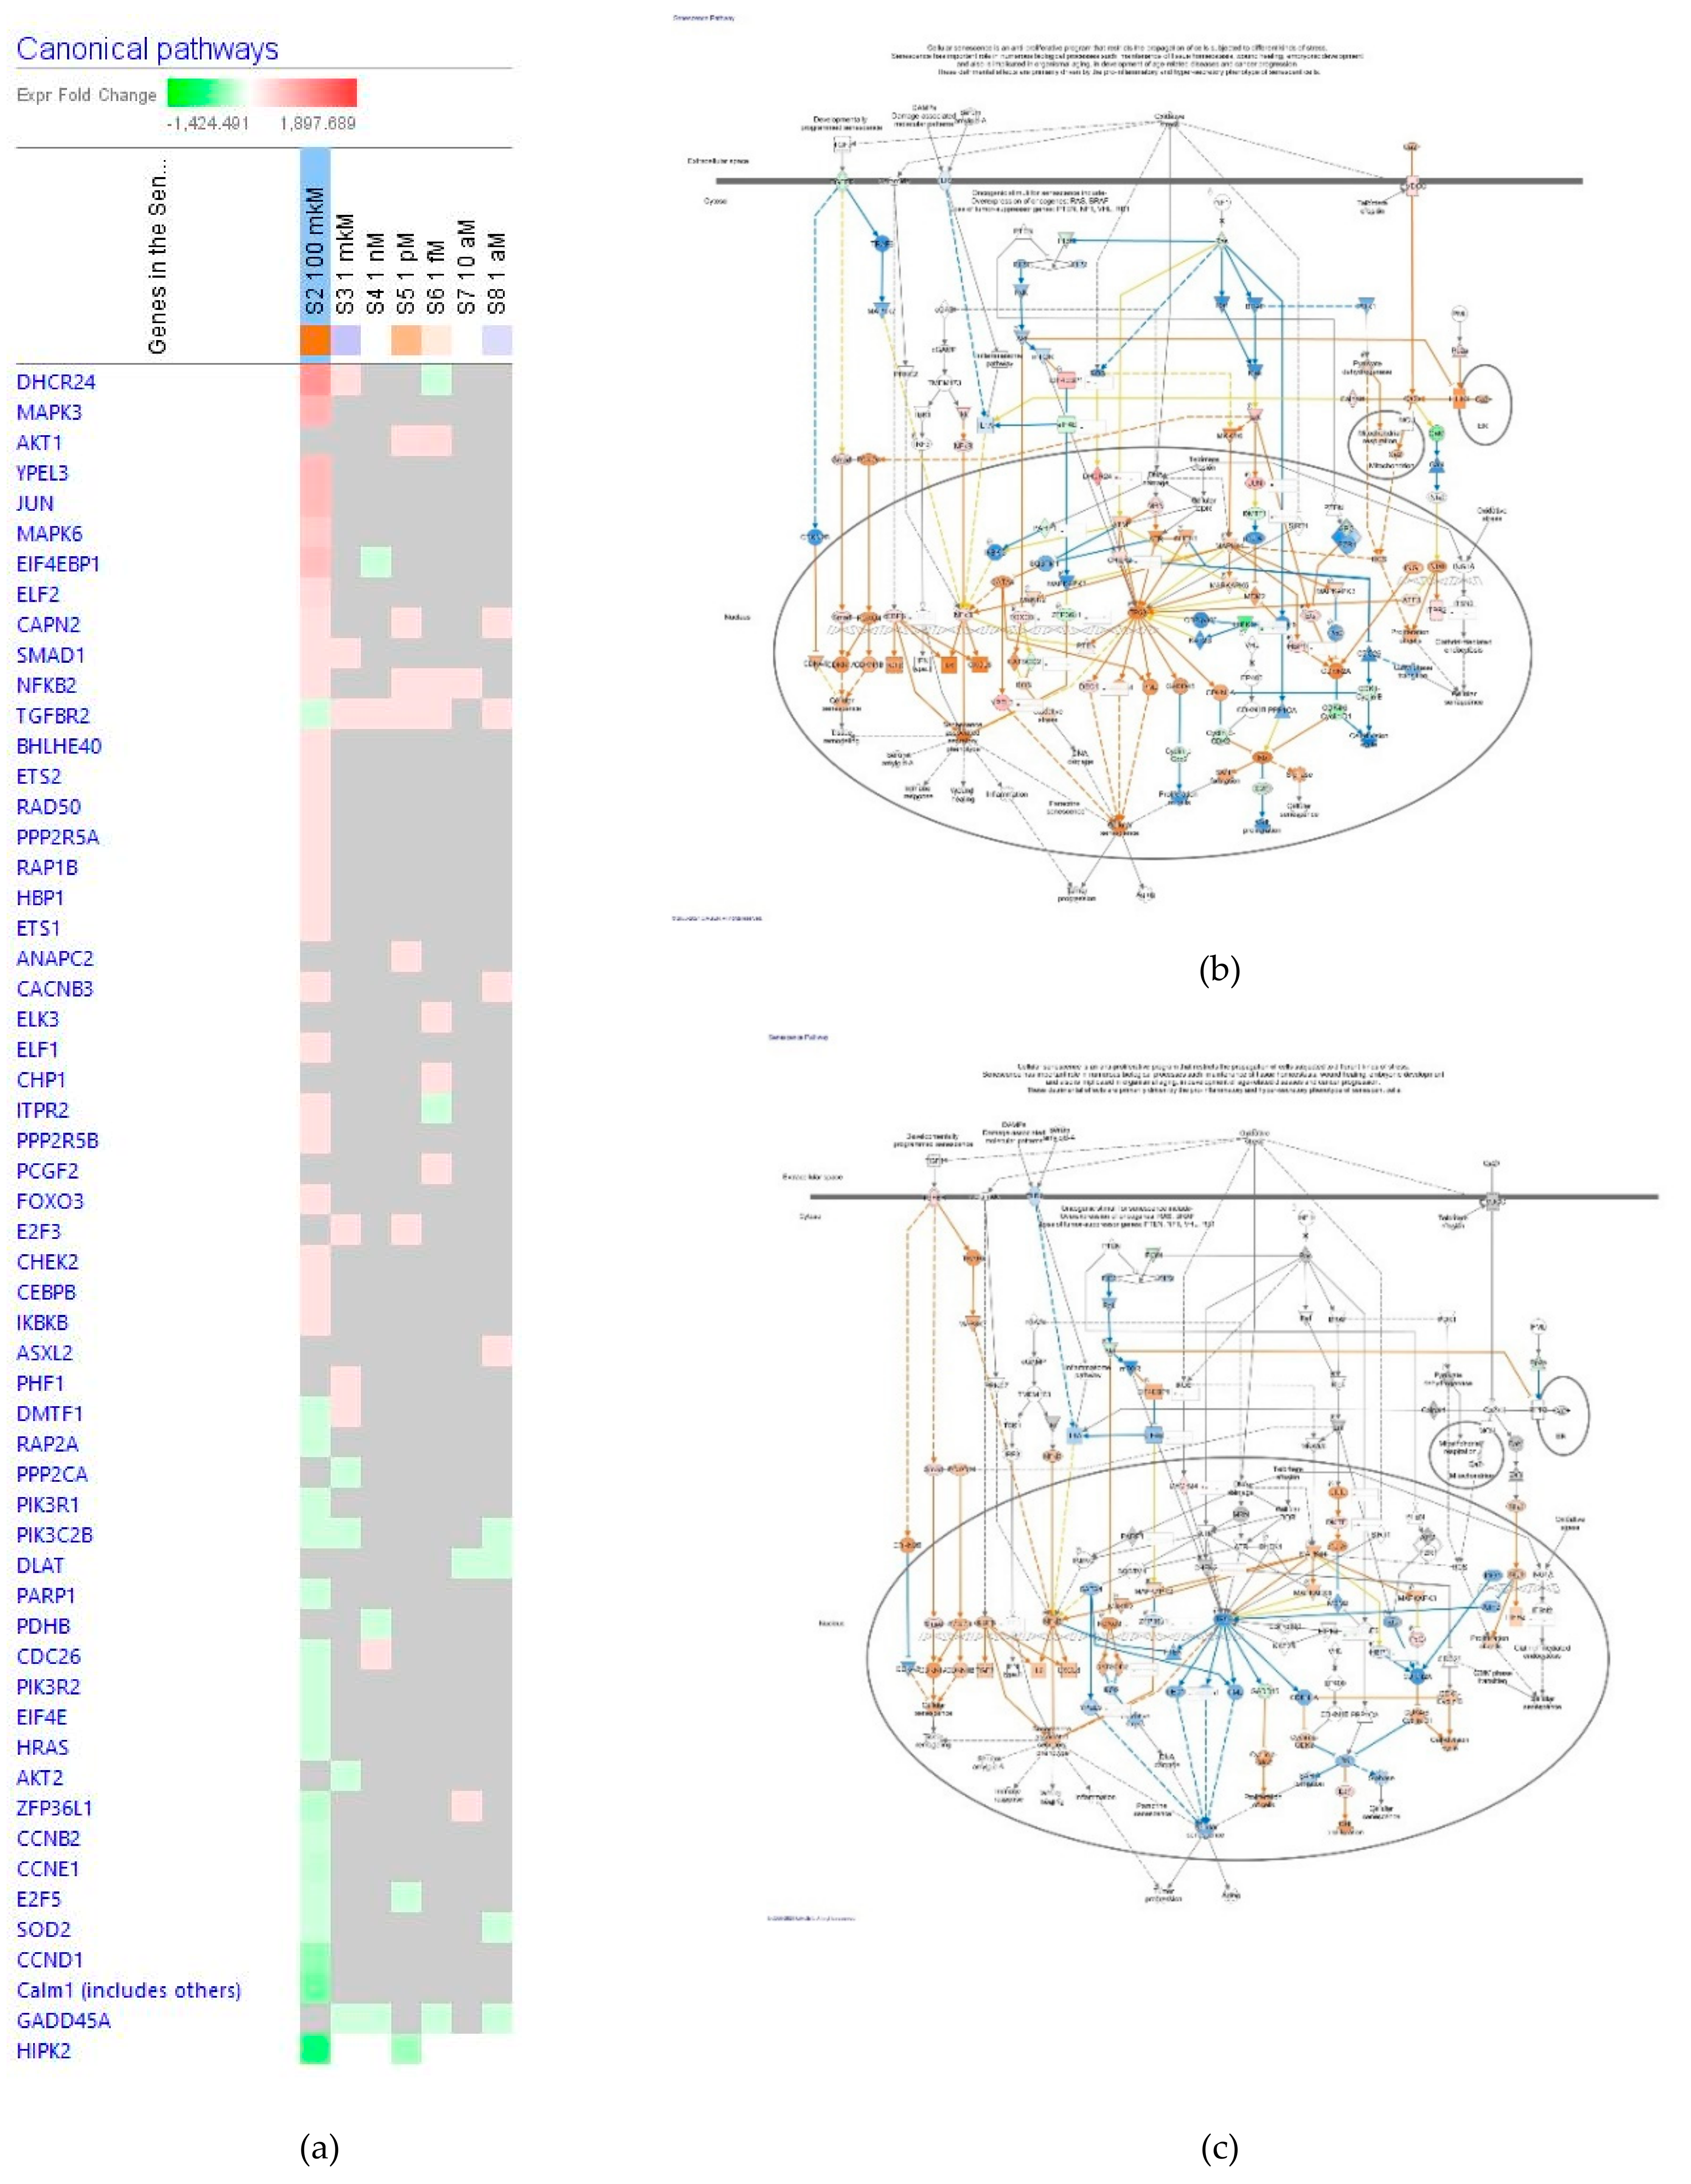
2.2.2. Cellular Immune Response, Cellular stress and Injury Signaling
Senescence
Eukaryotic Translation Initiation Factor EIF2 Signaling
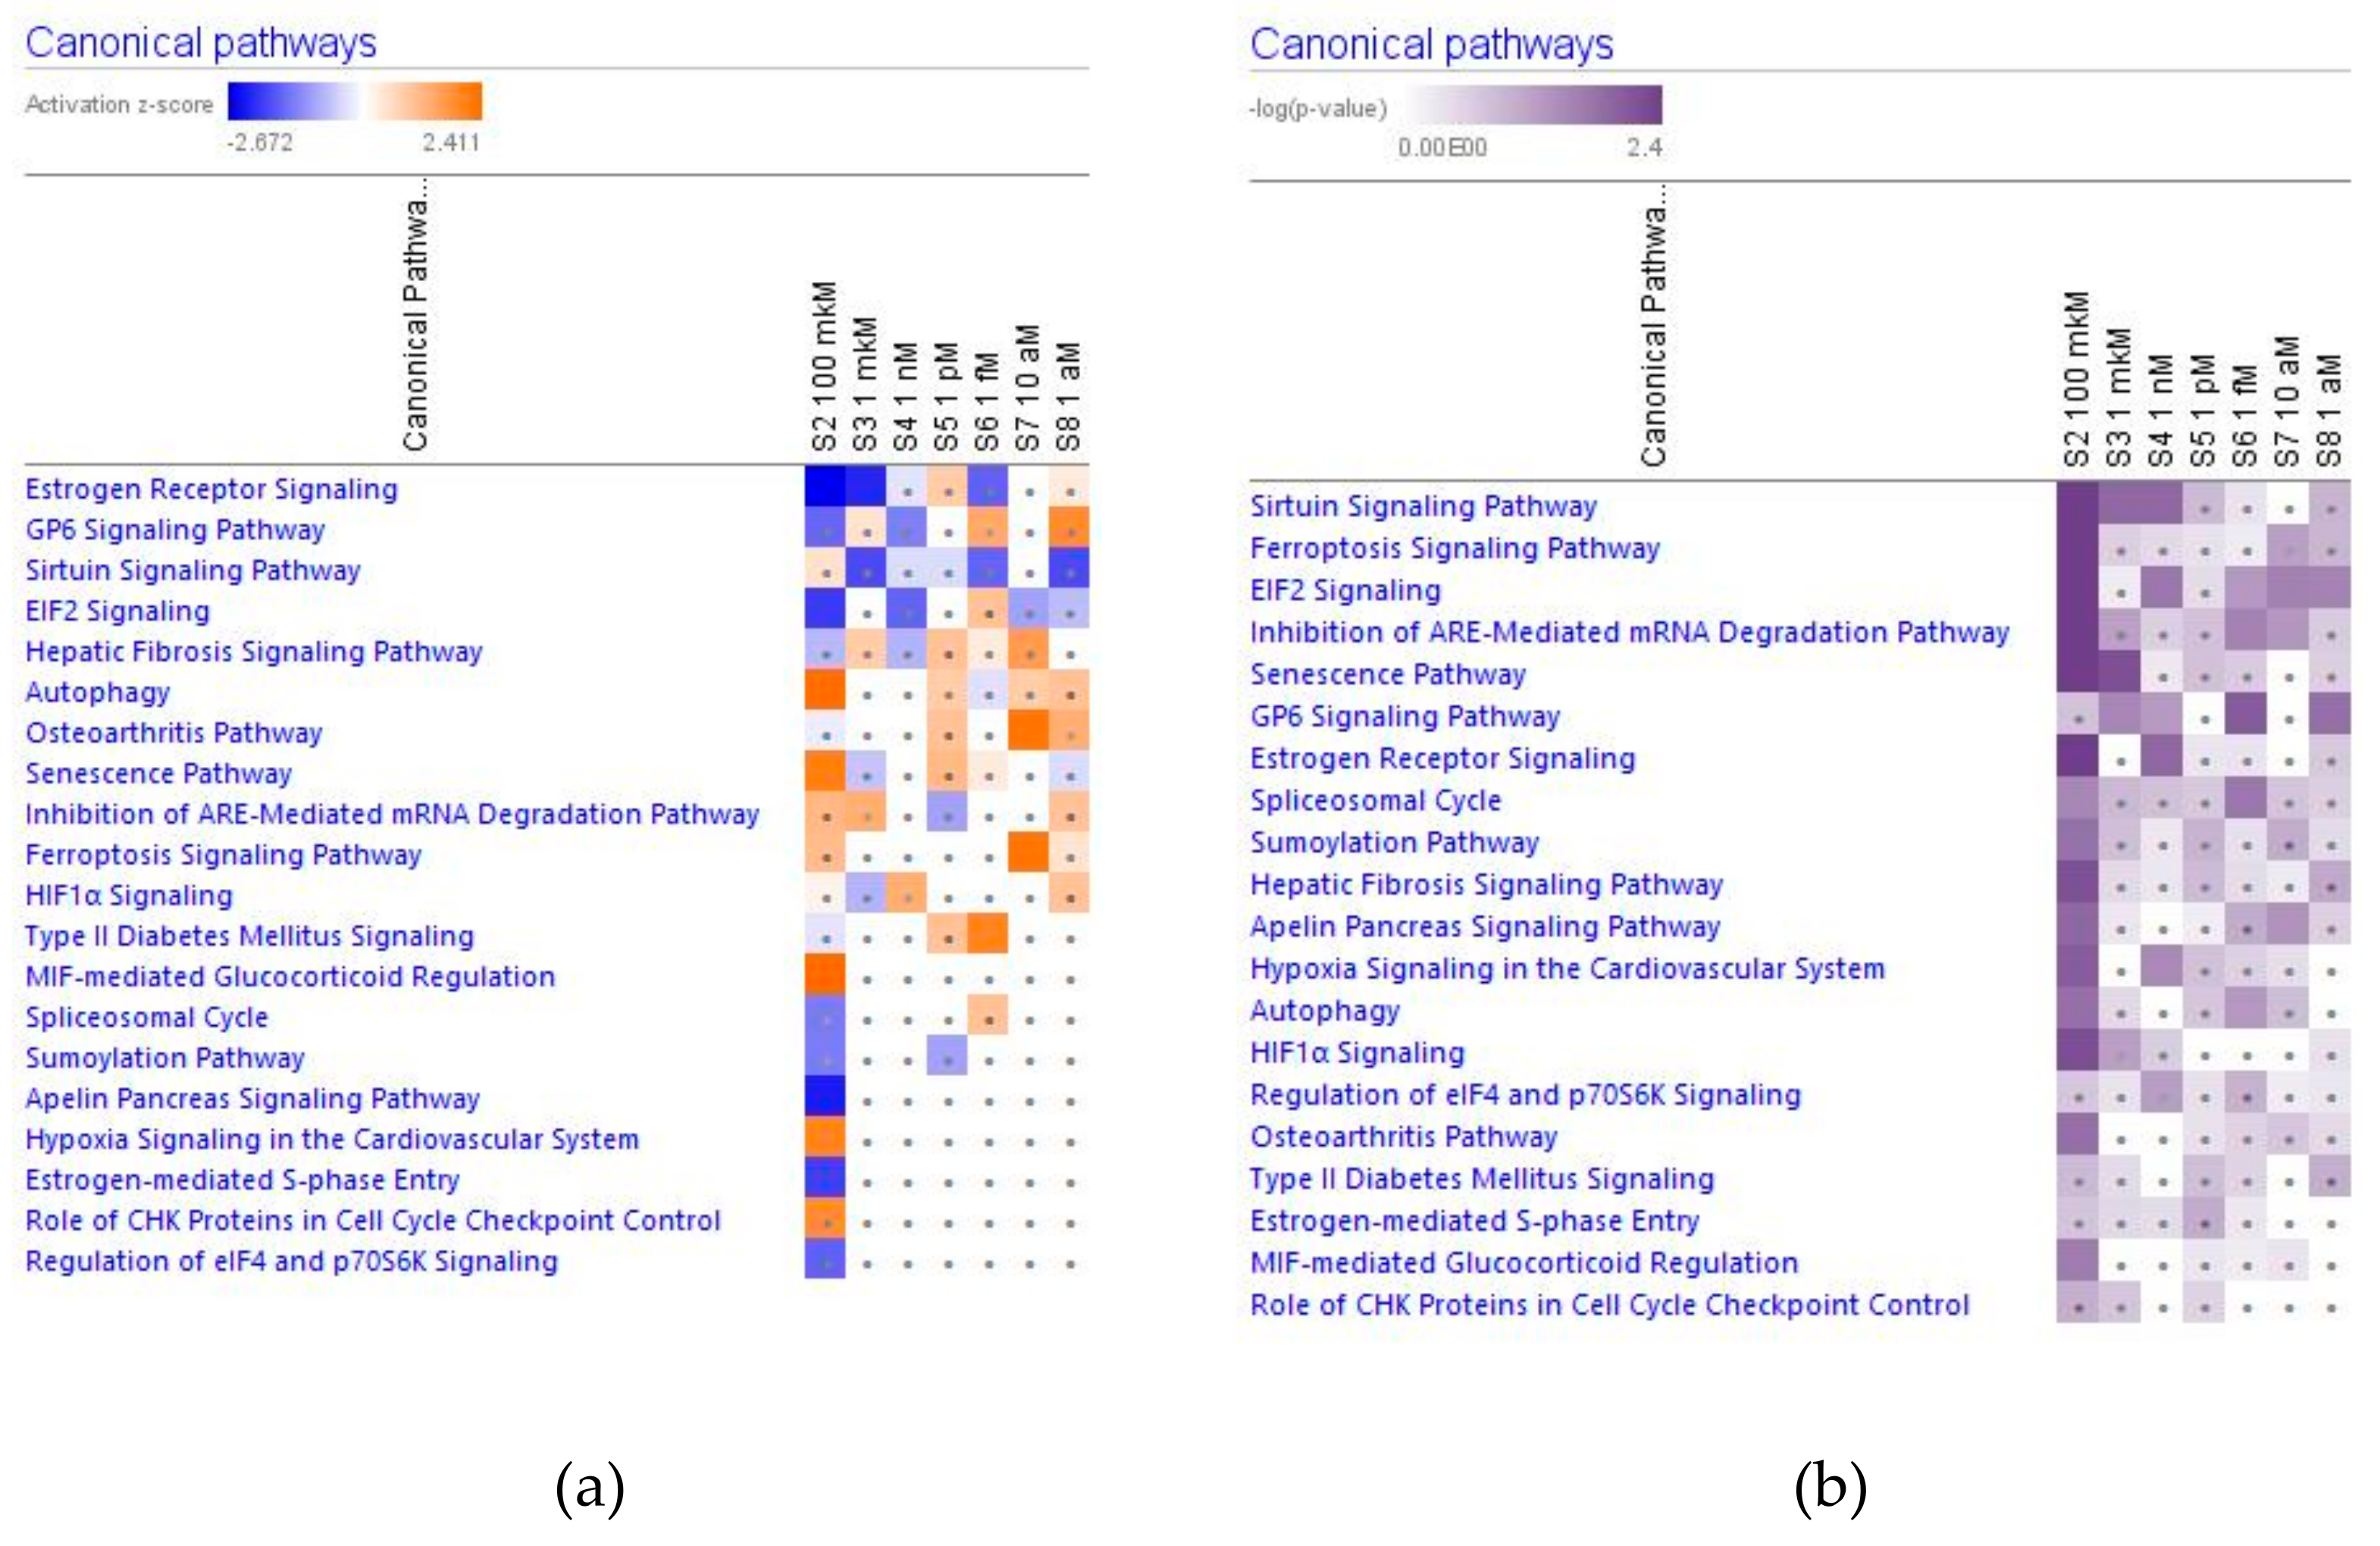
2.2.3. Nuclear Receptors Signaling and Transcriptional Regulators Signaling
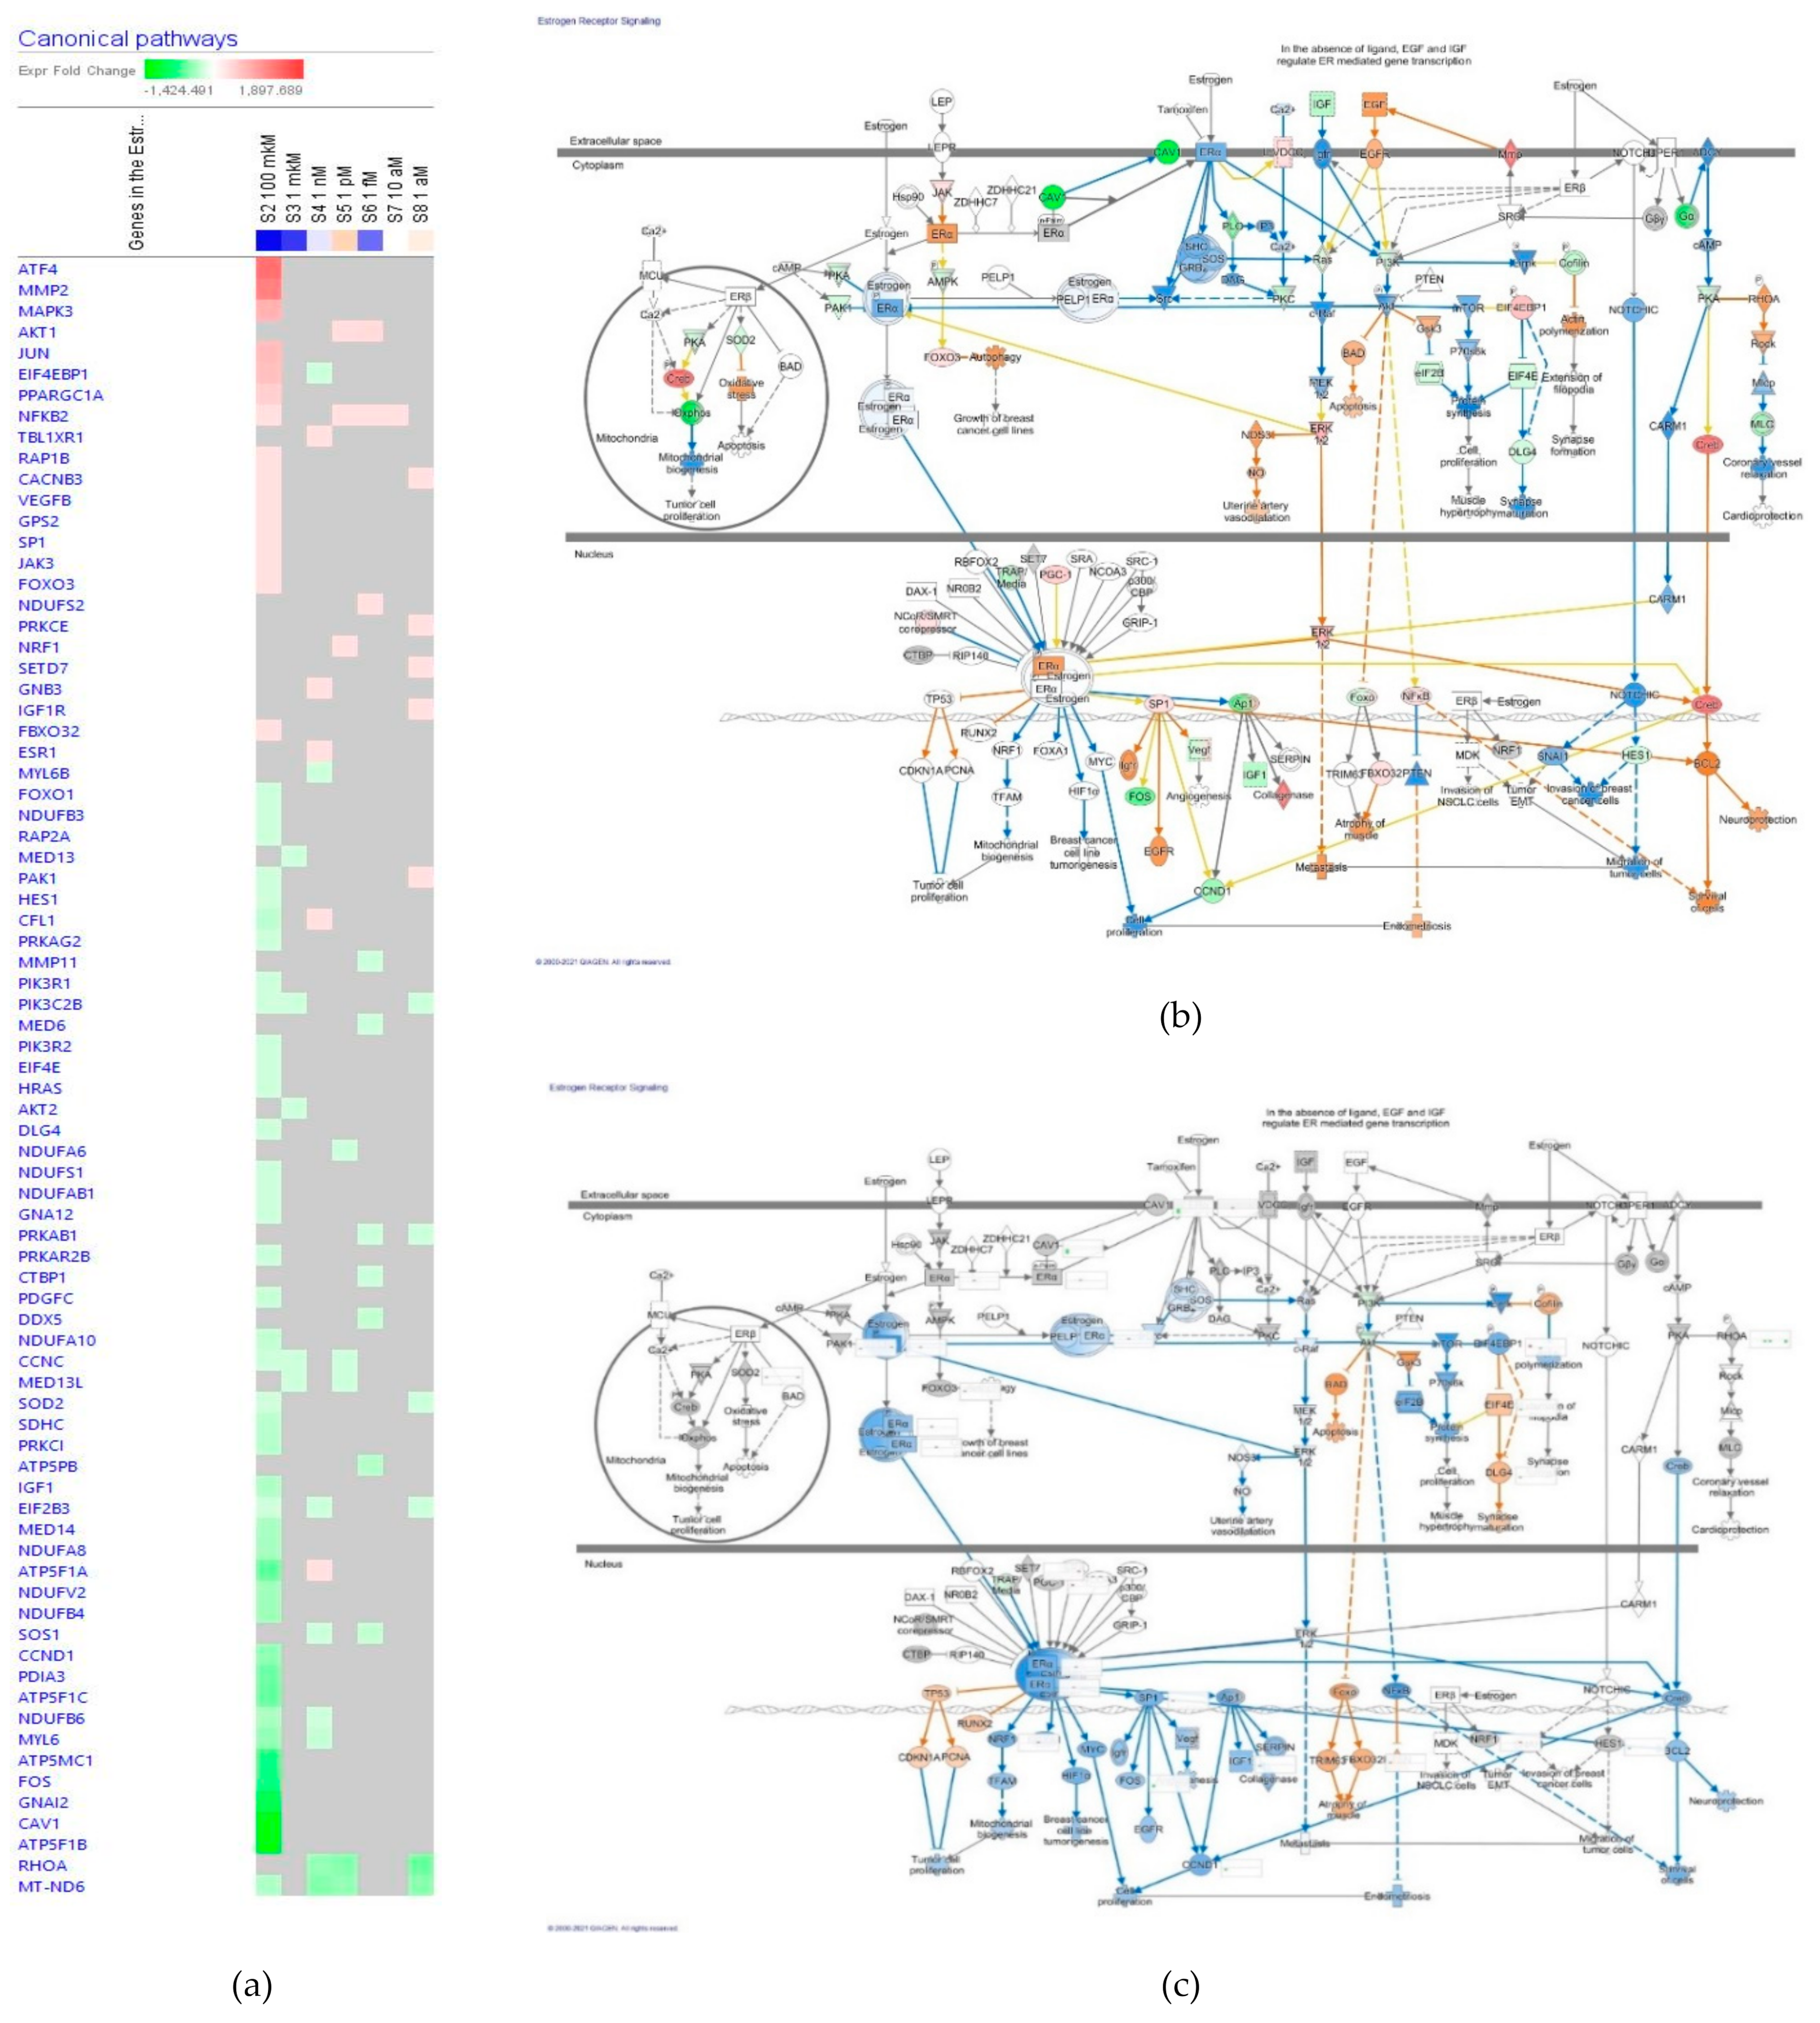
Estrogen Receptors Signaling
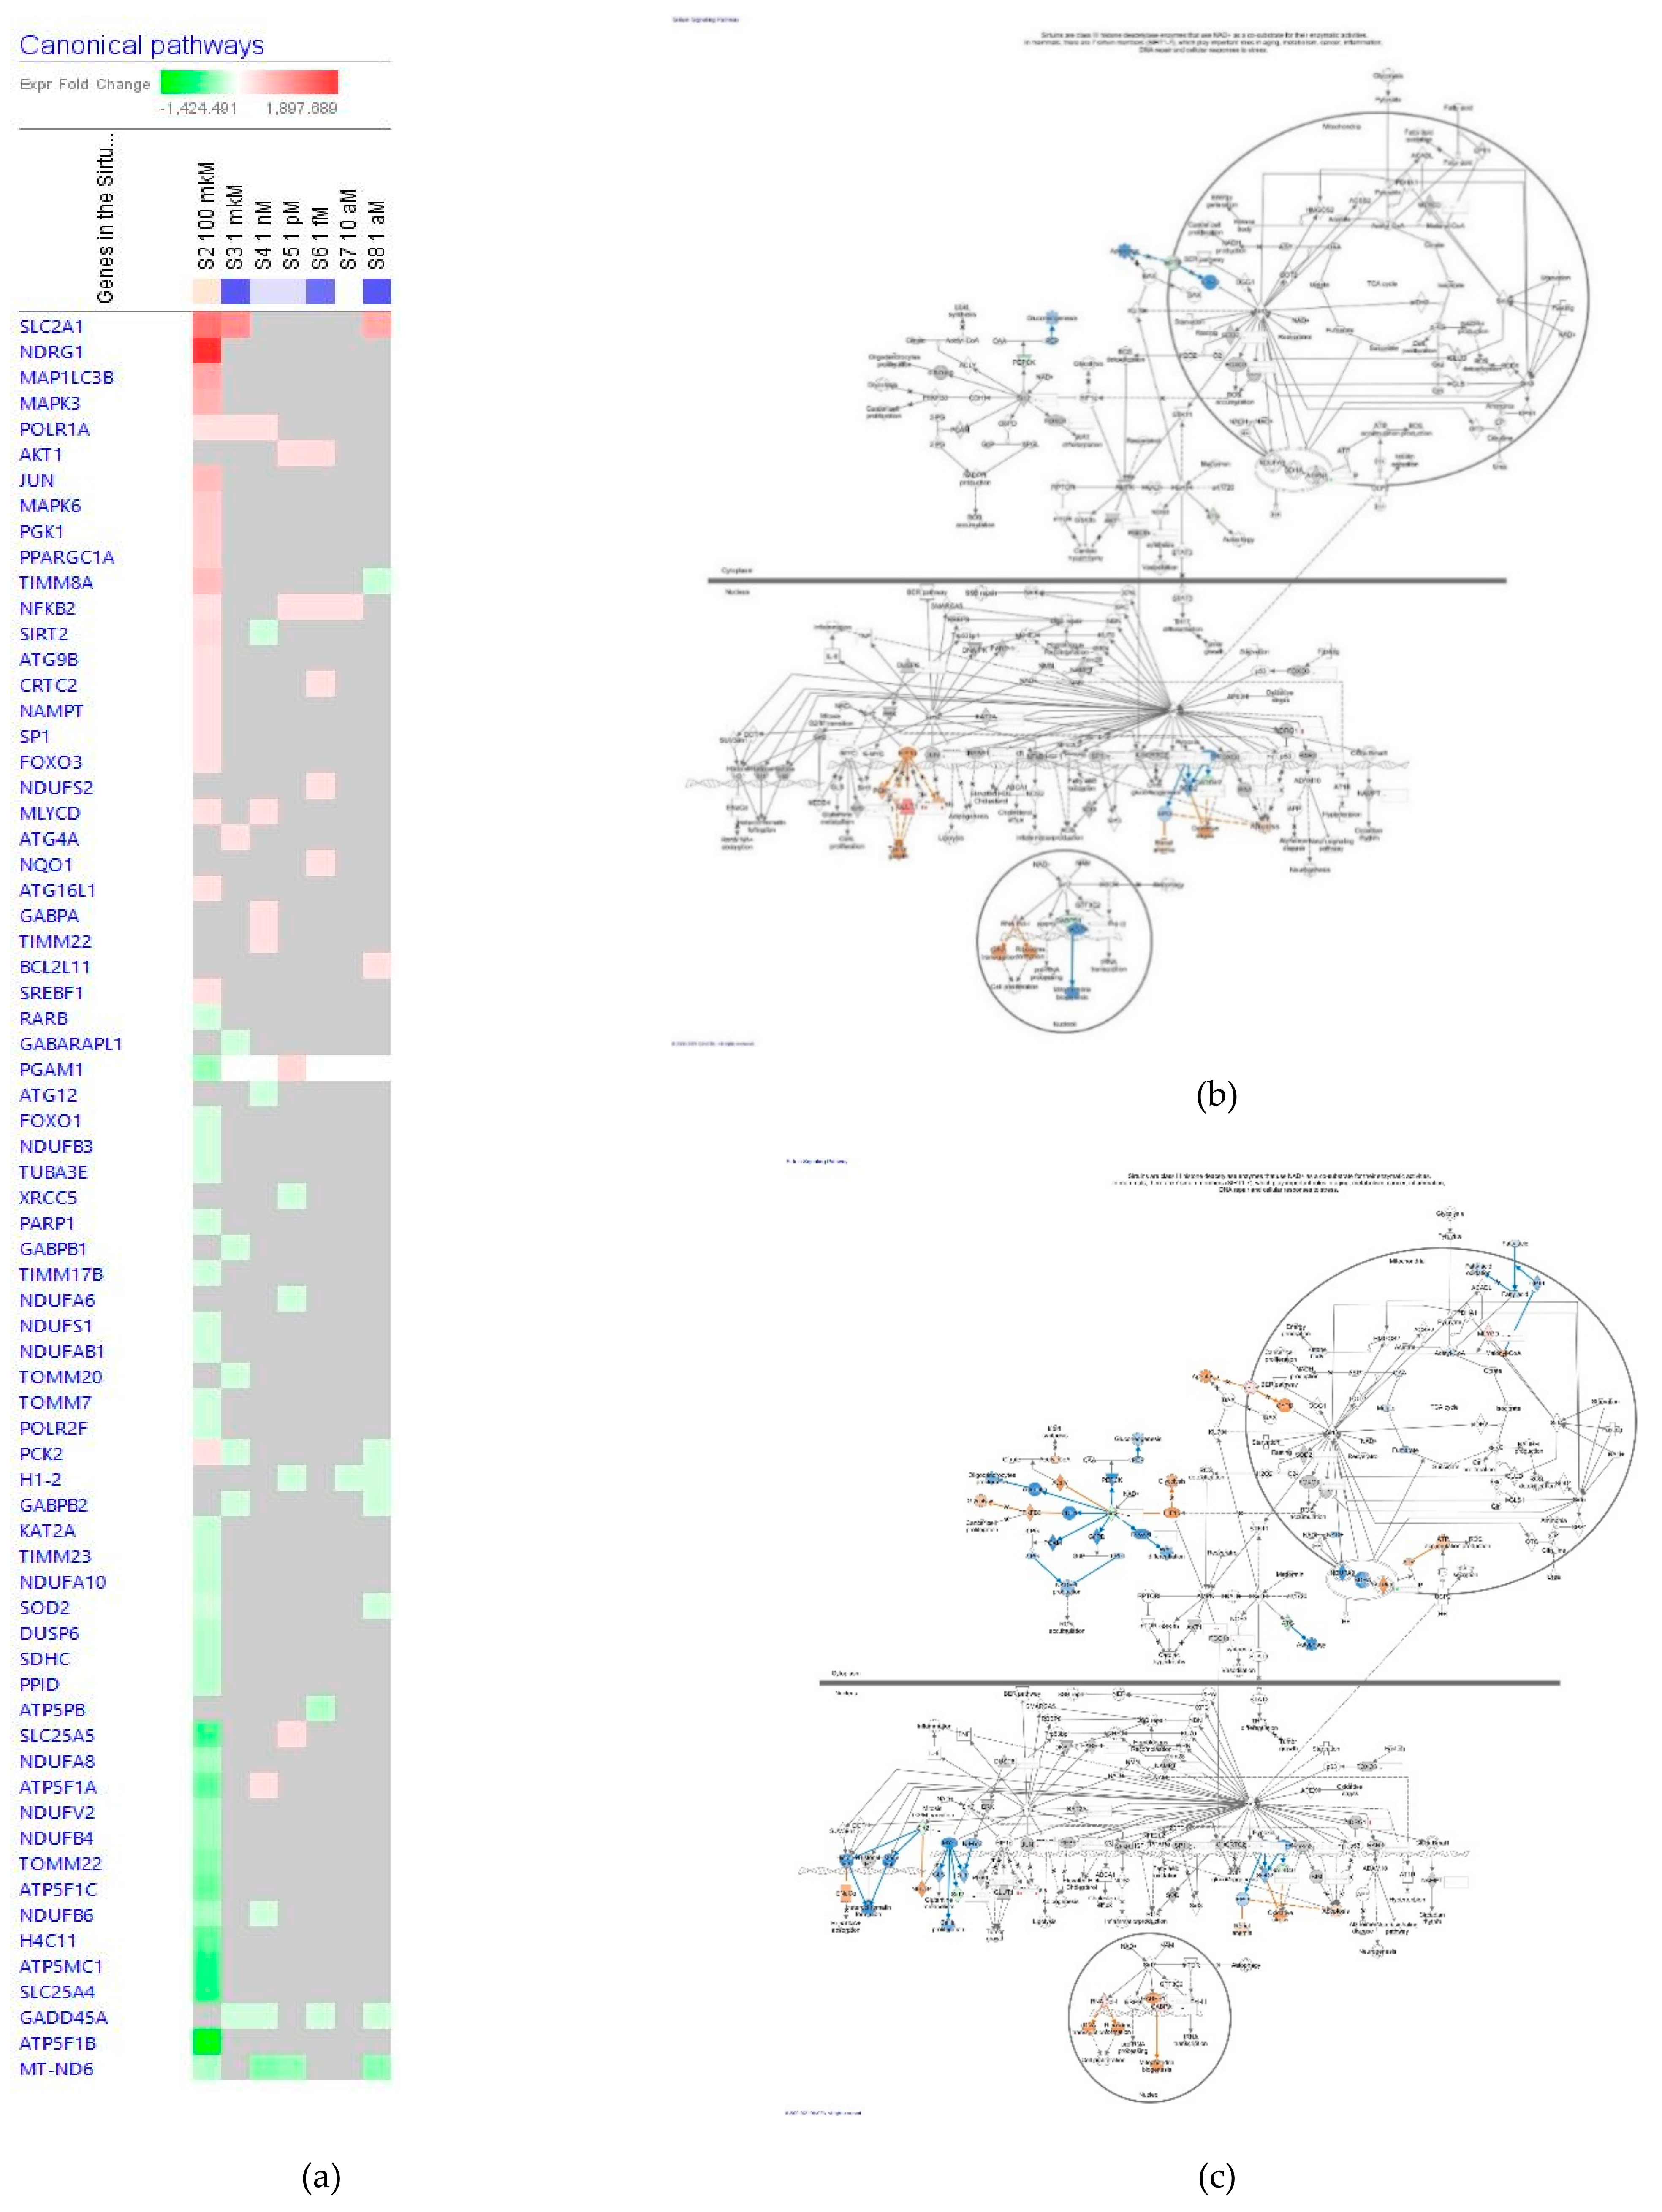
Sirtuin Signaling Pathway
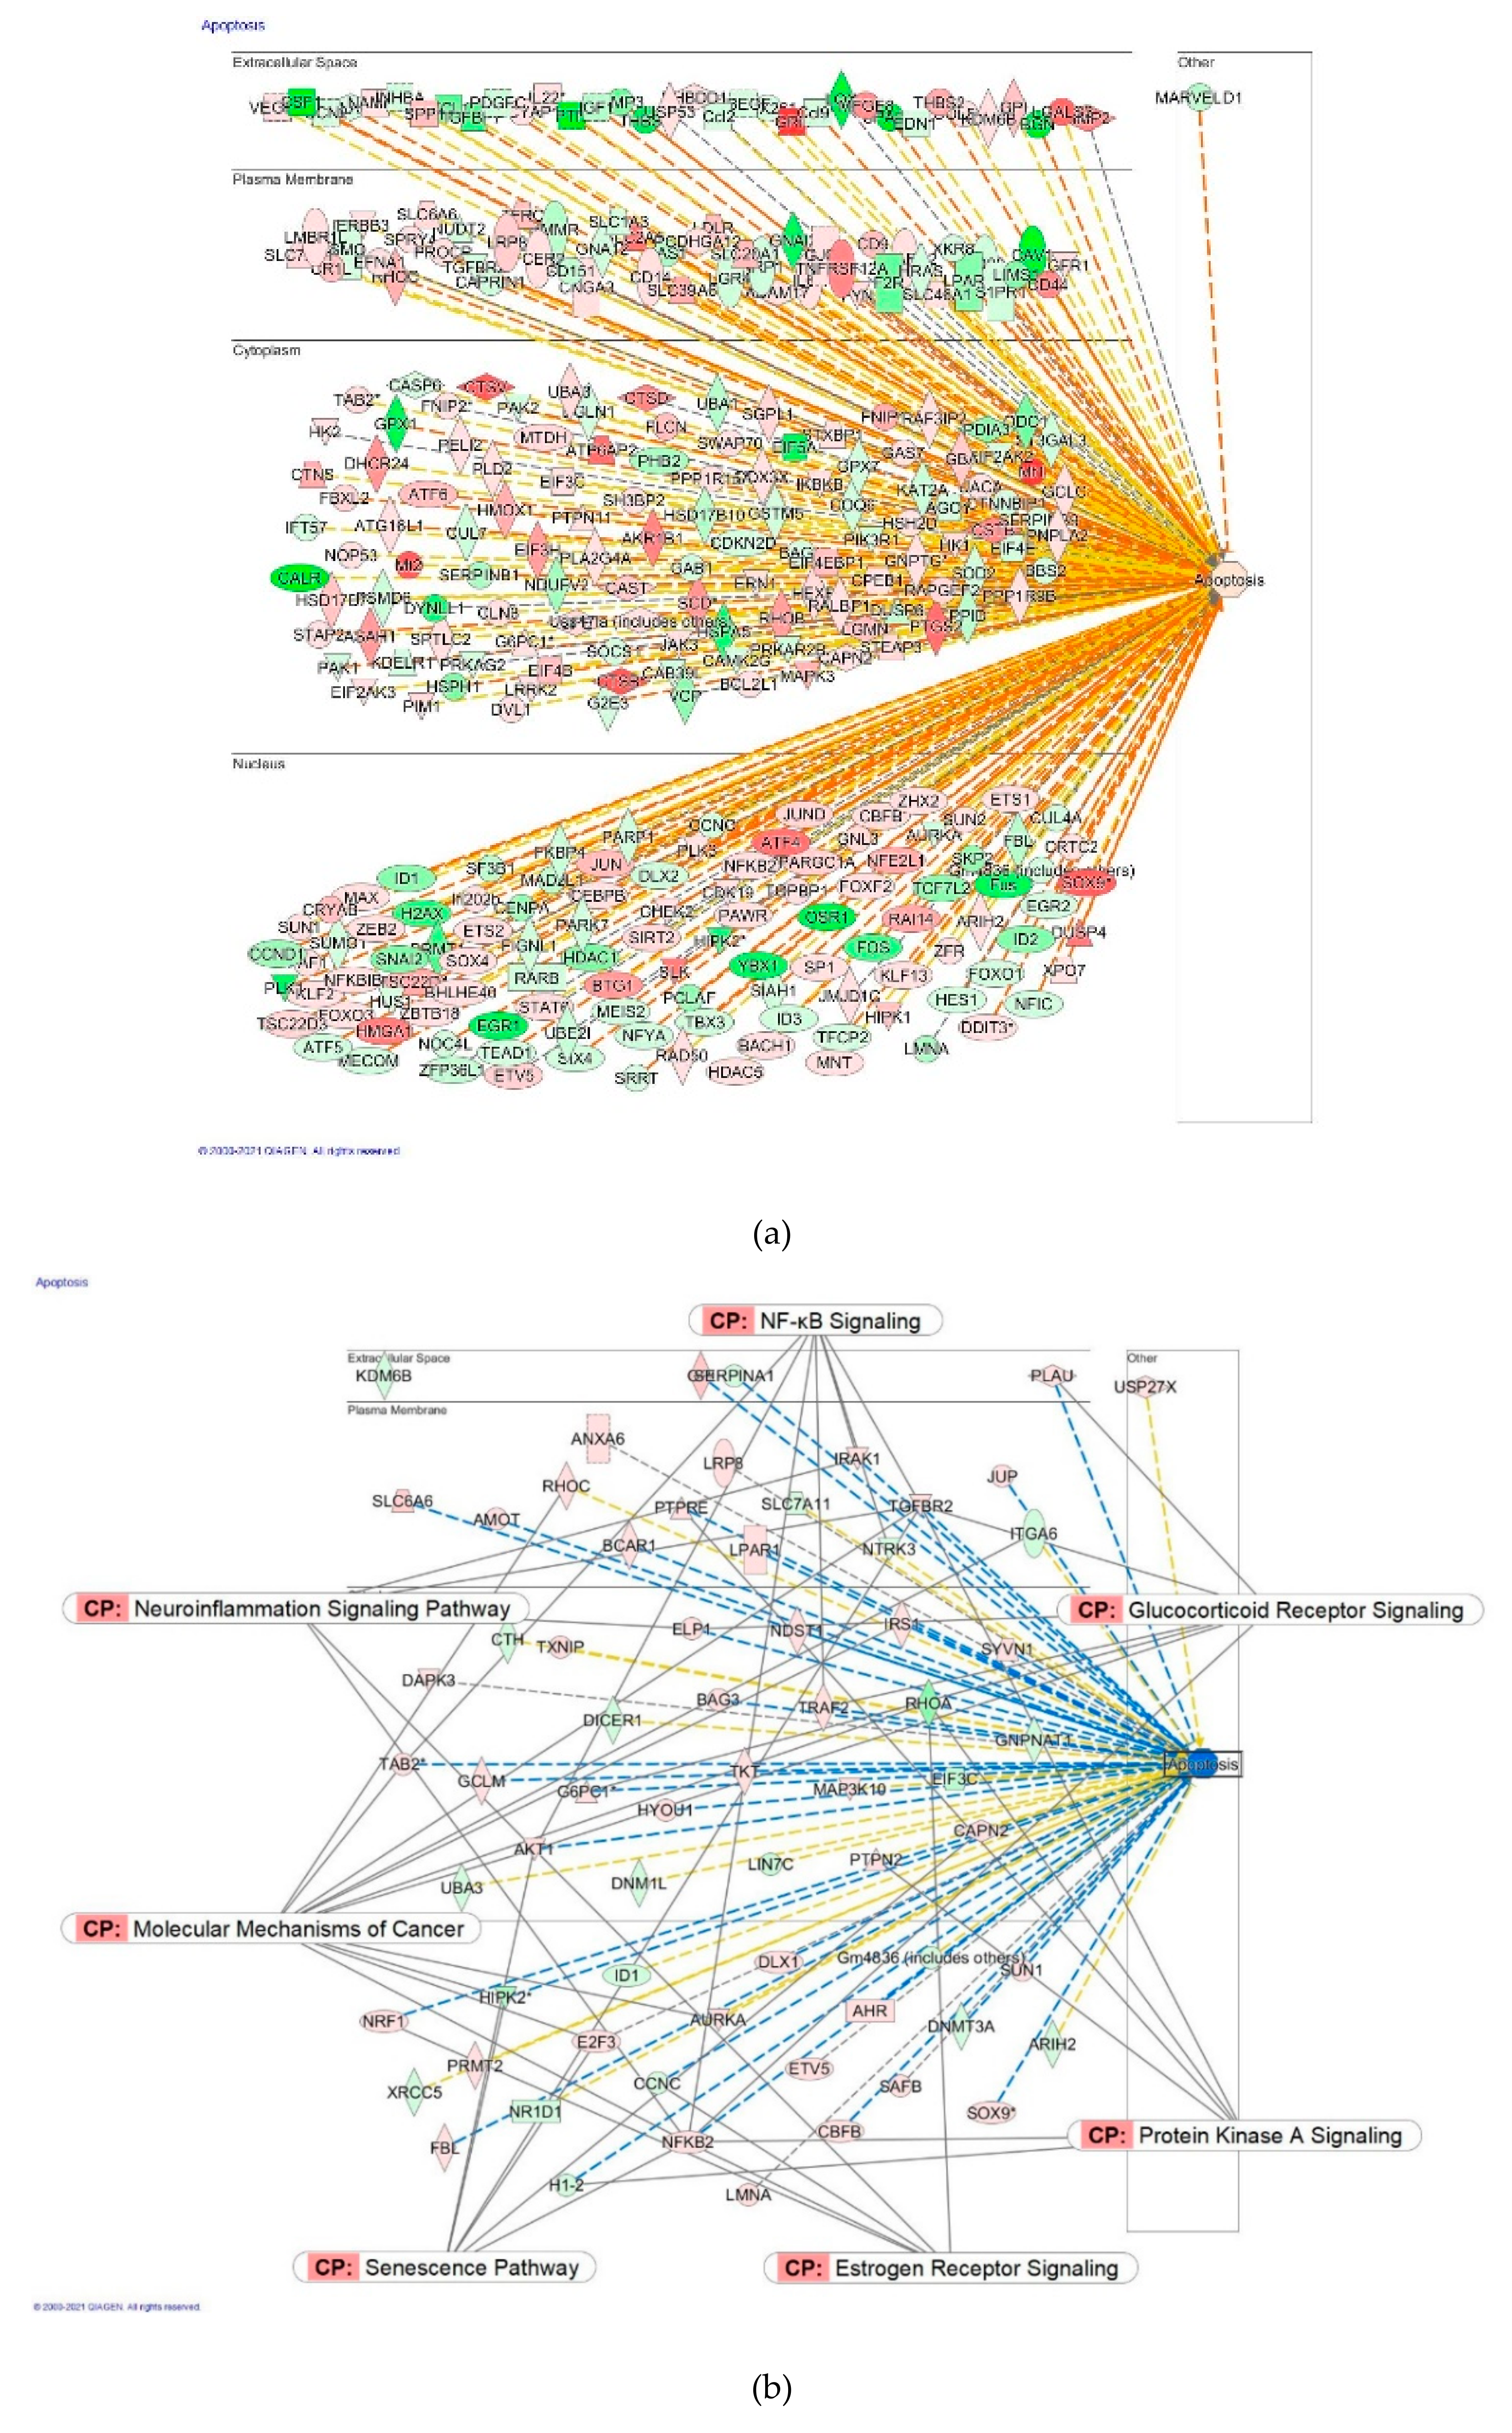
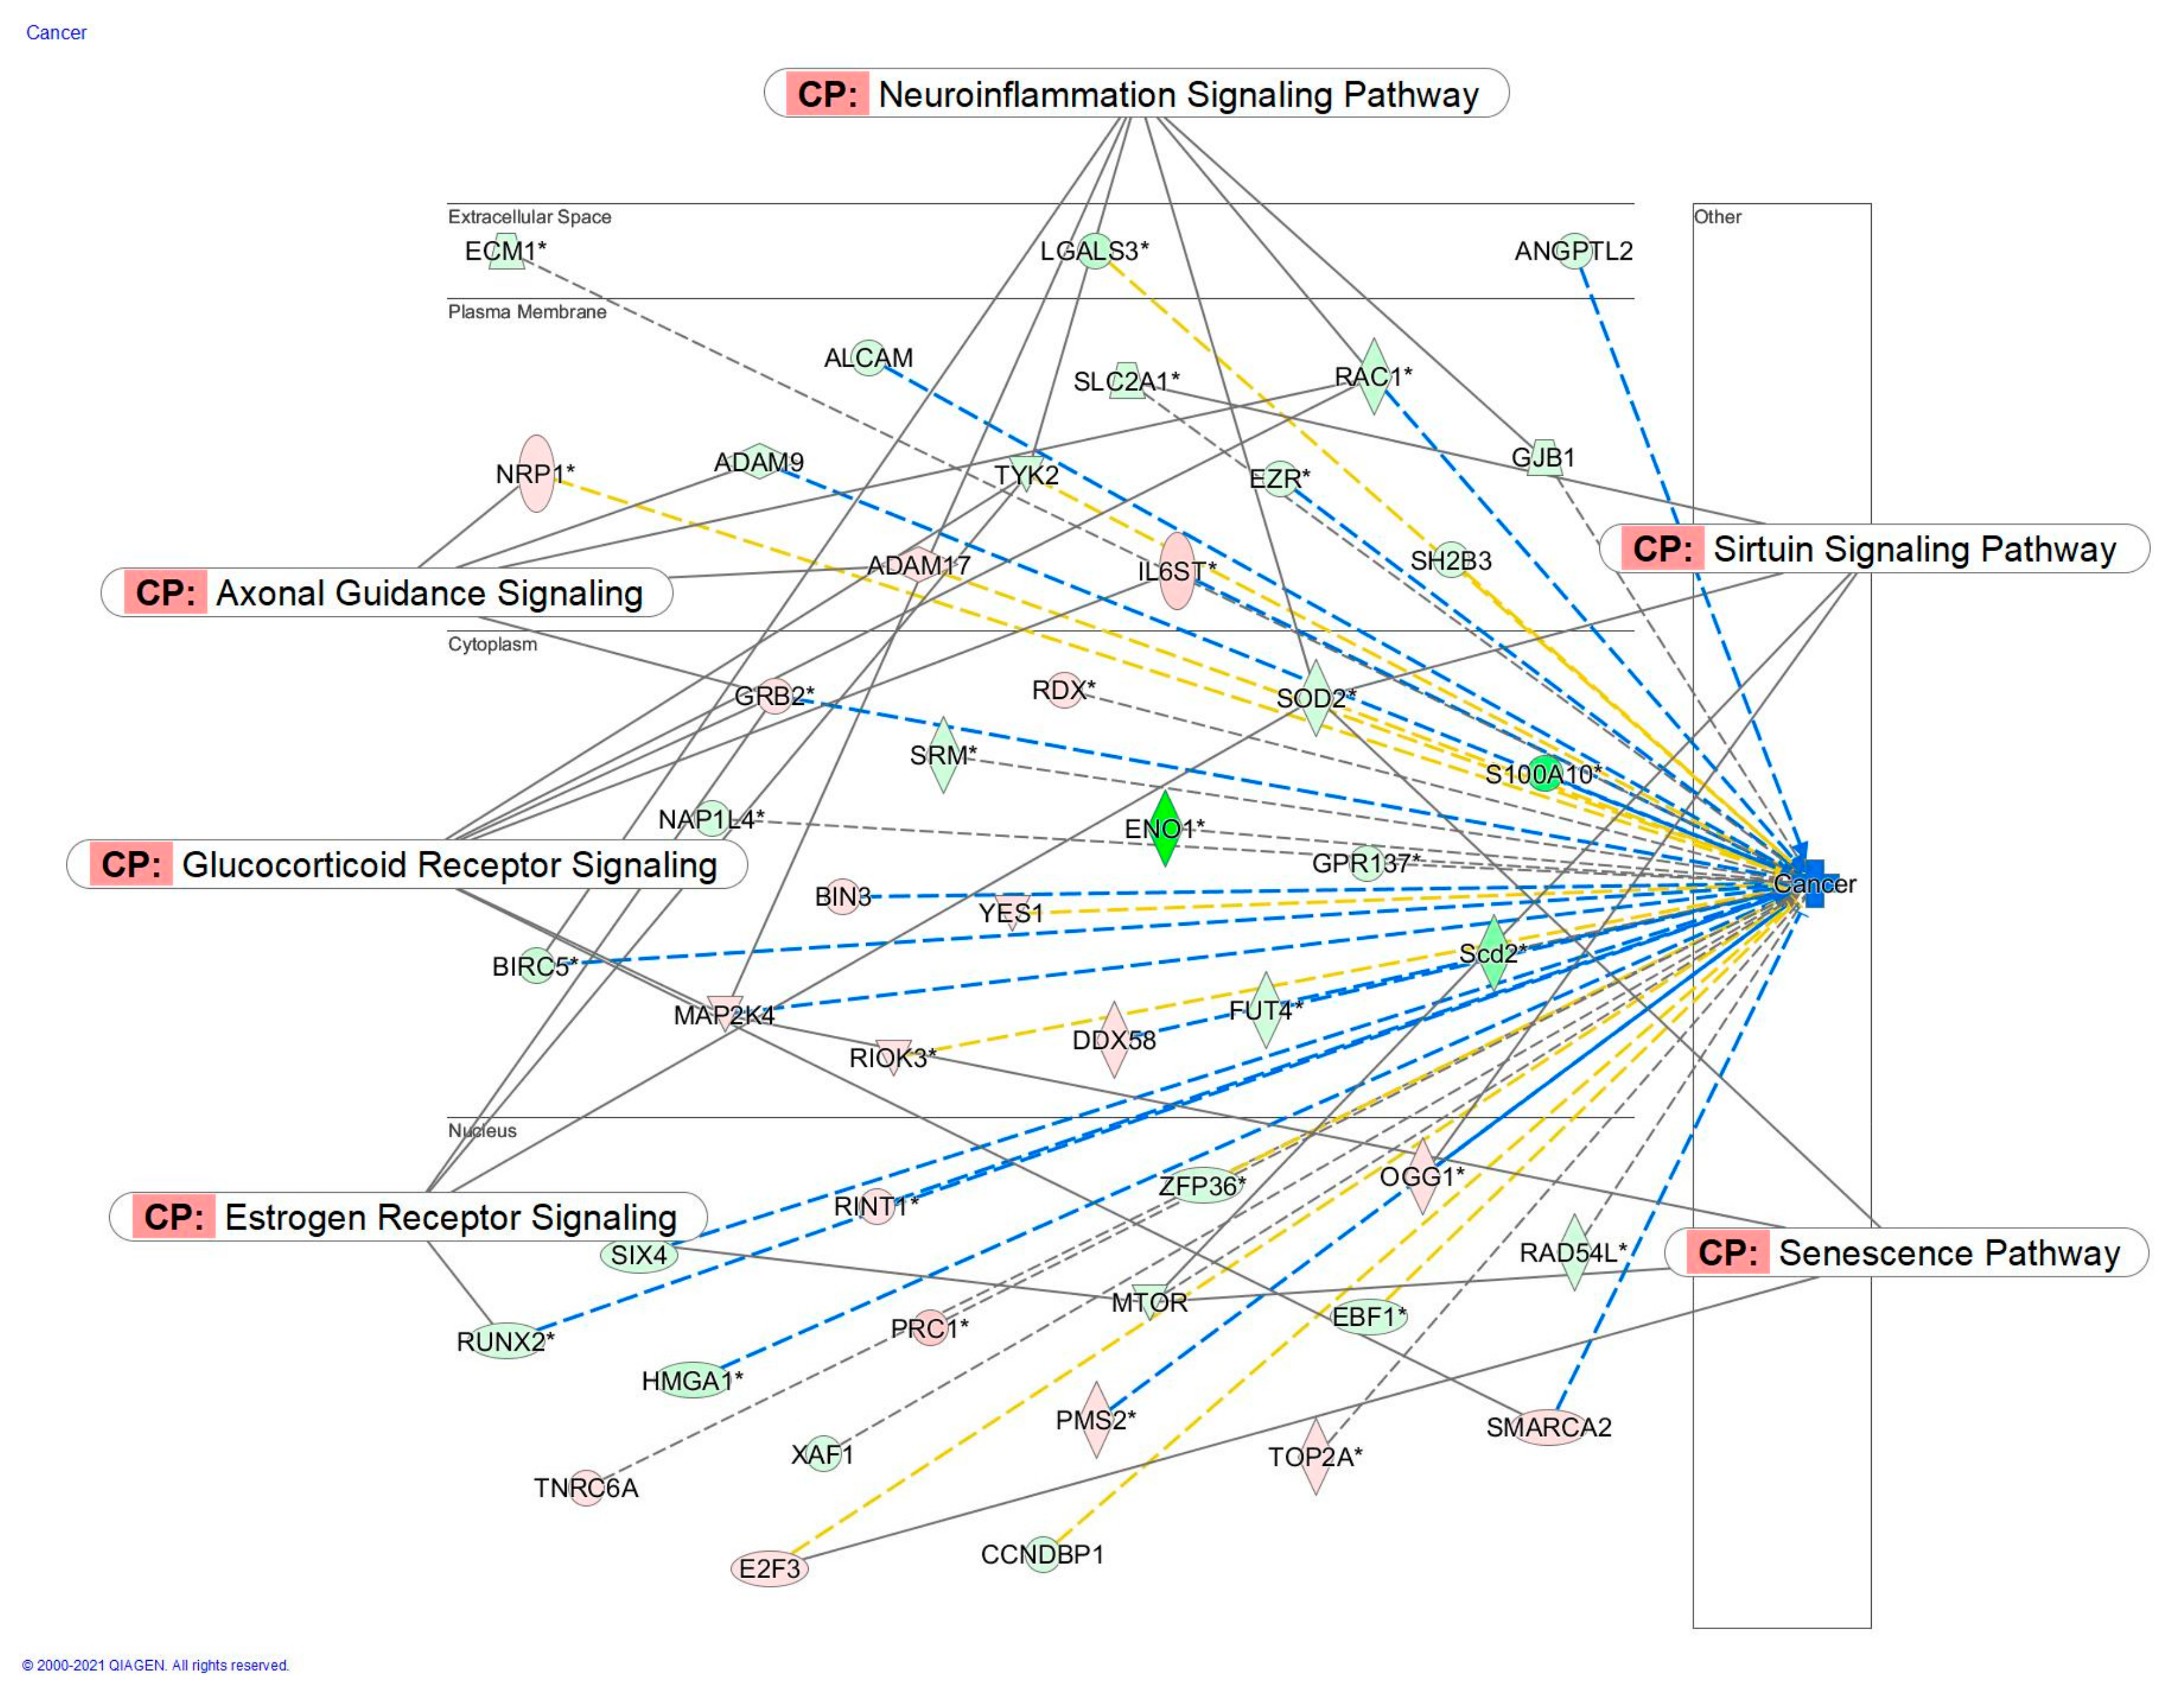
2.2.4. Apoptosis and Cancer Signaling
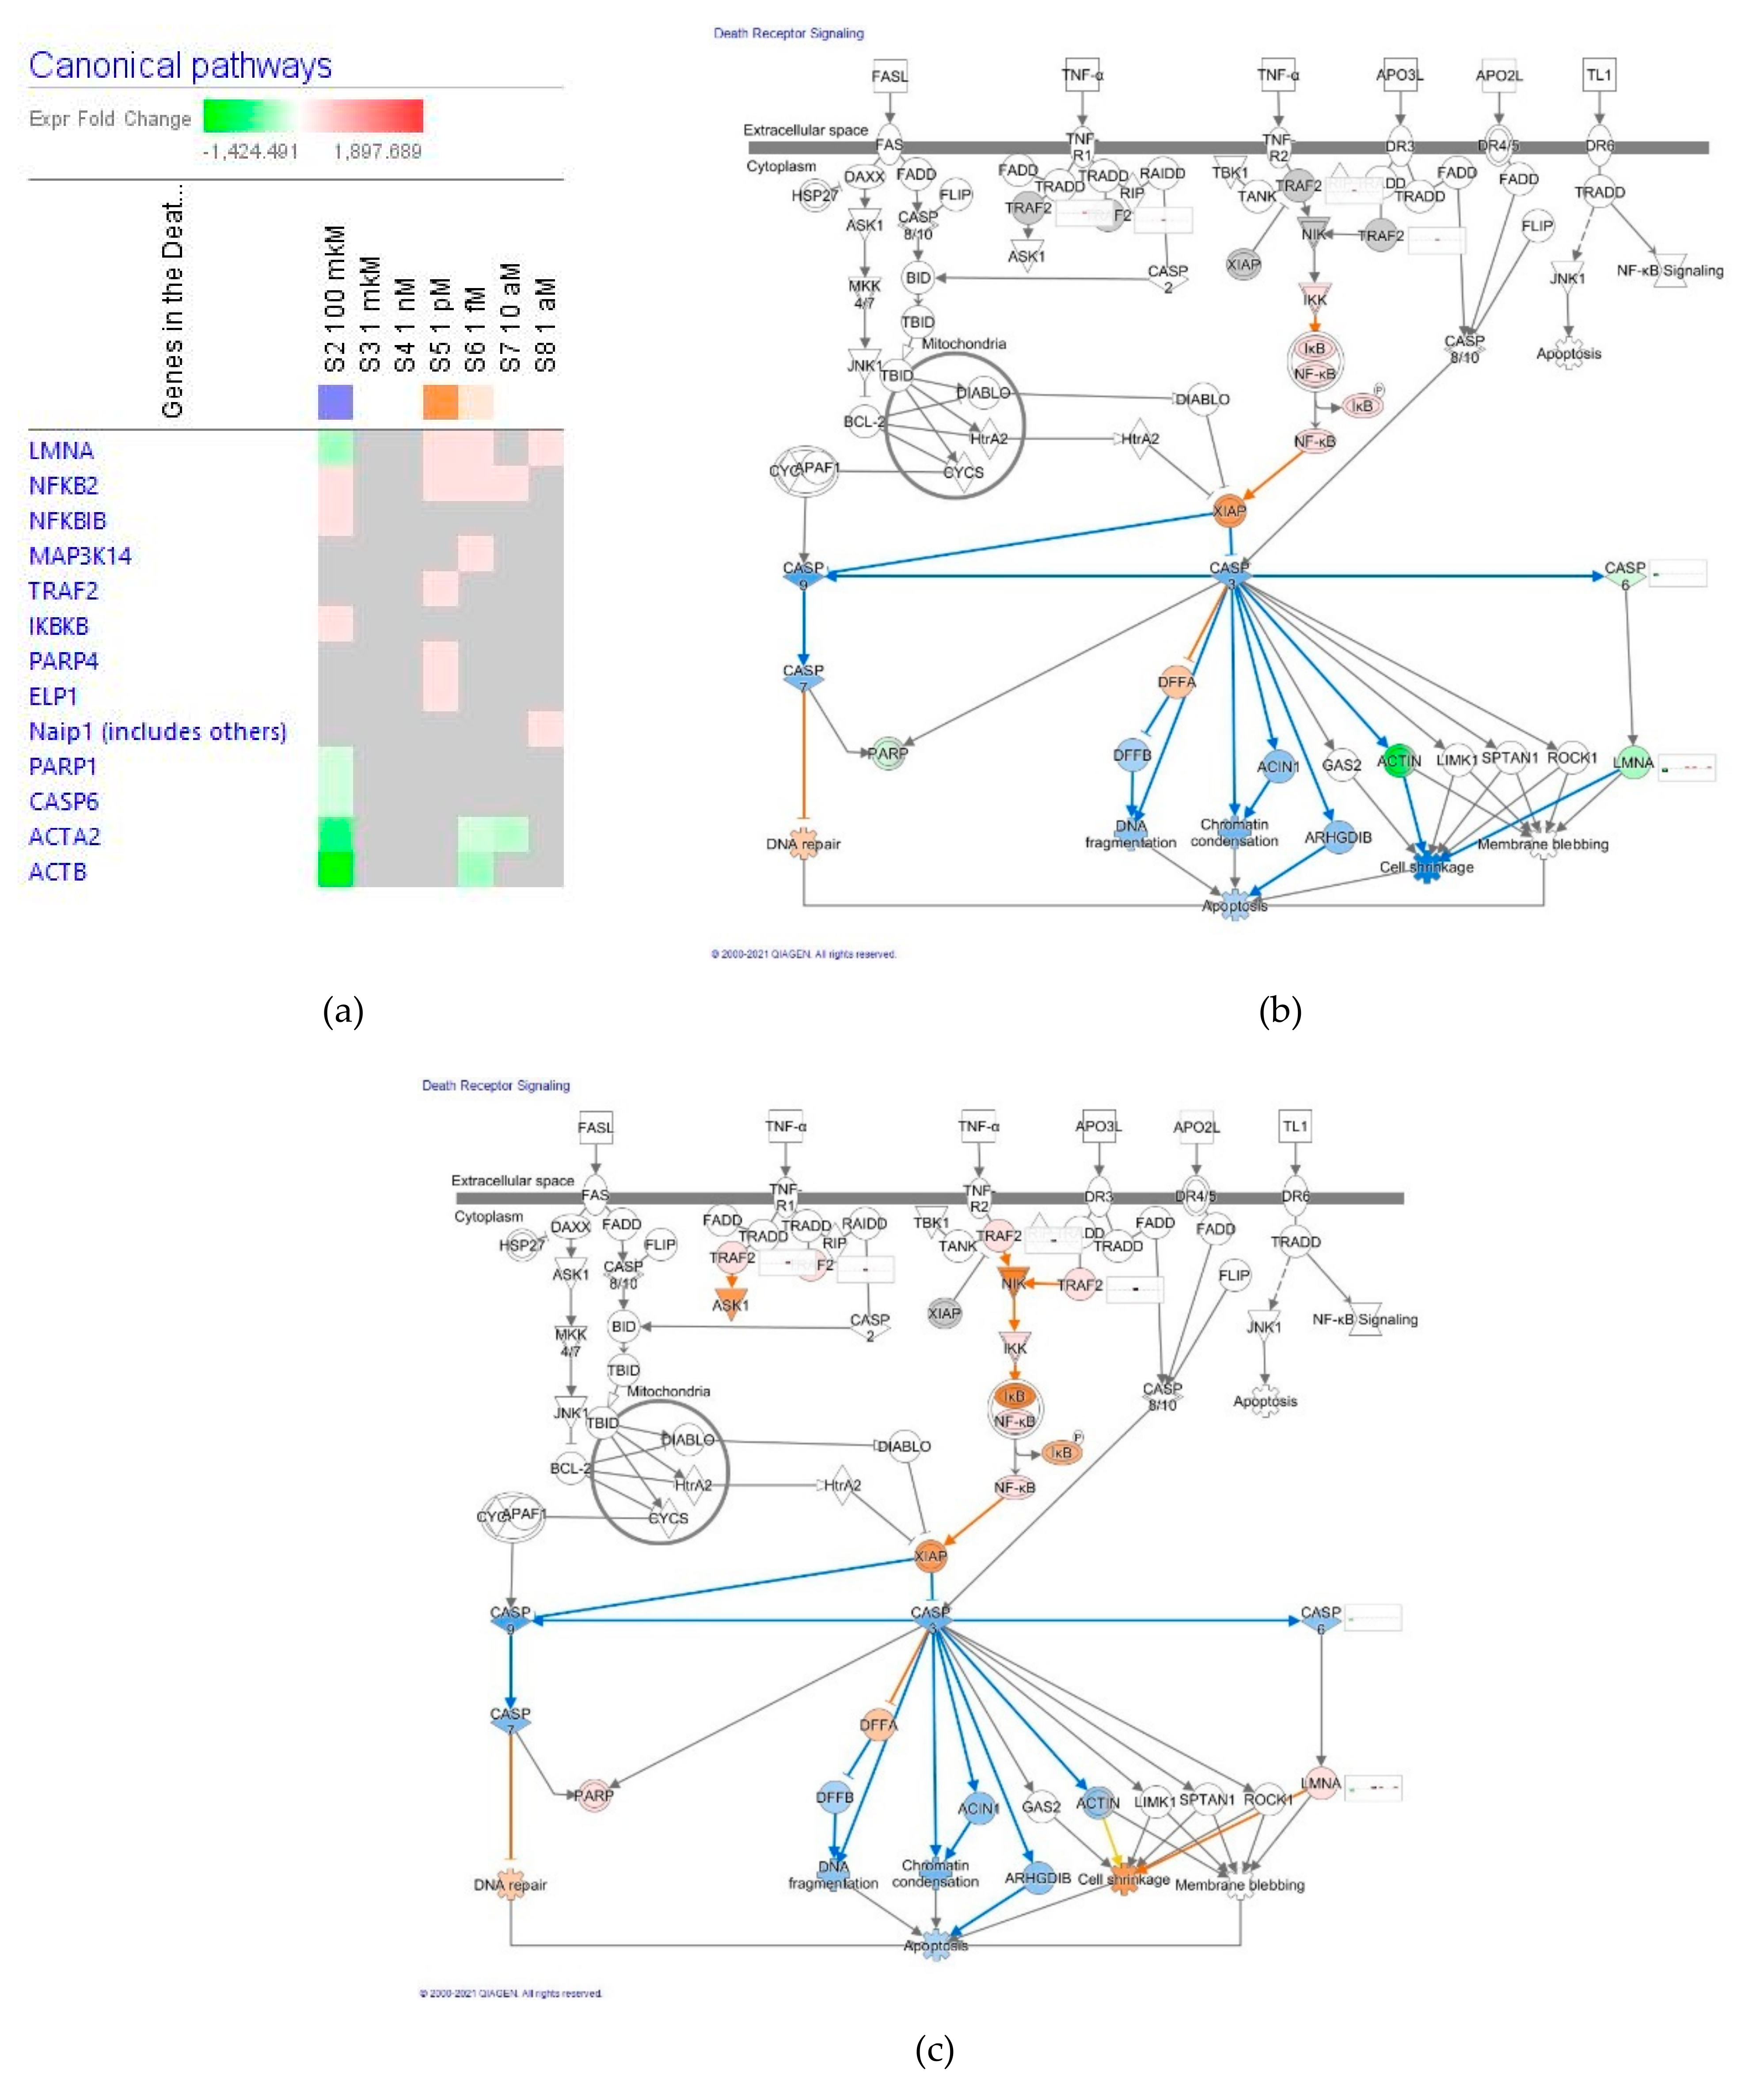
Death Receptor Signaling
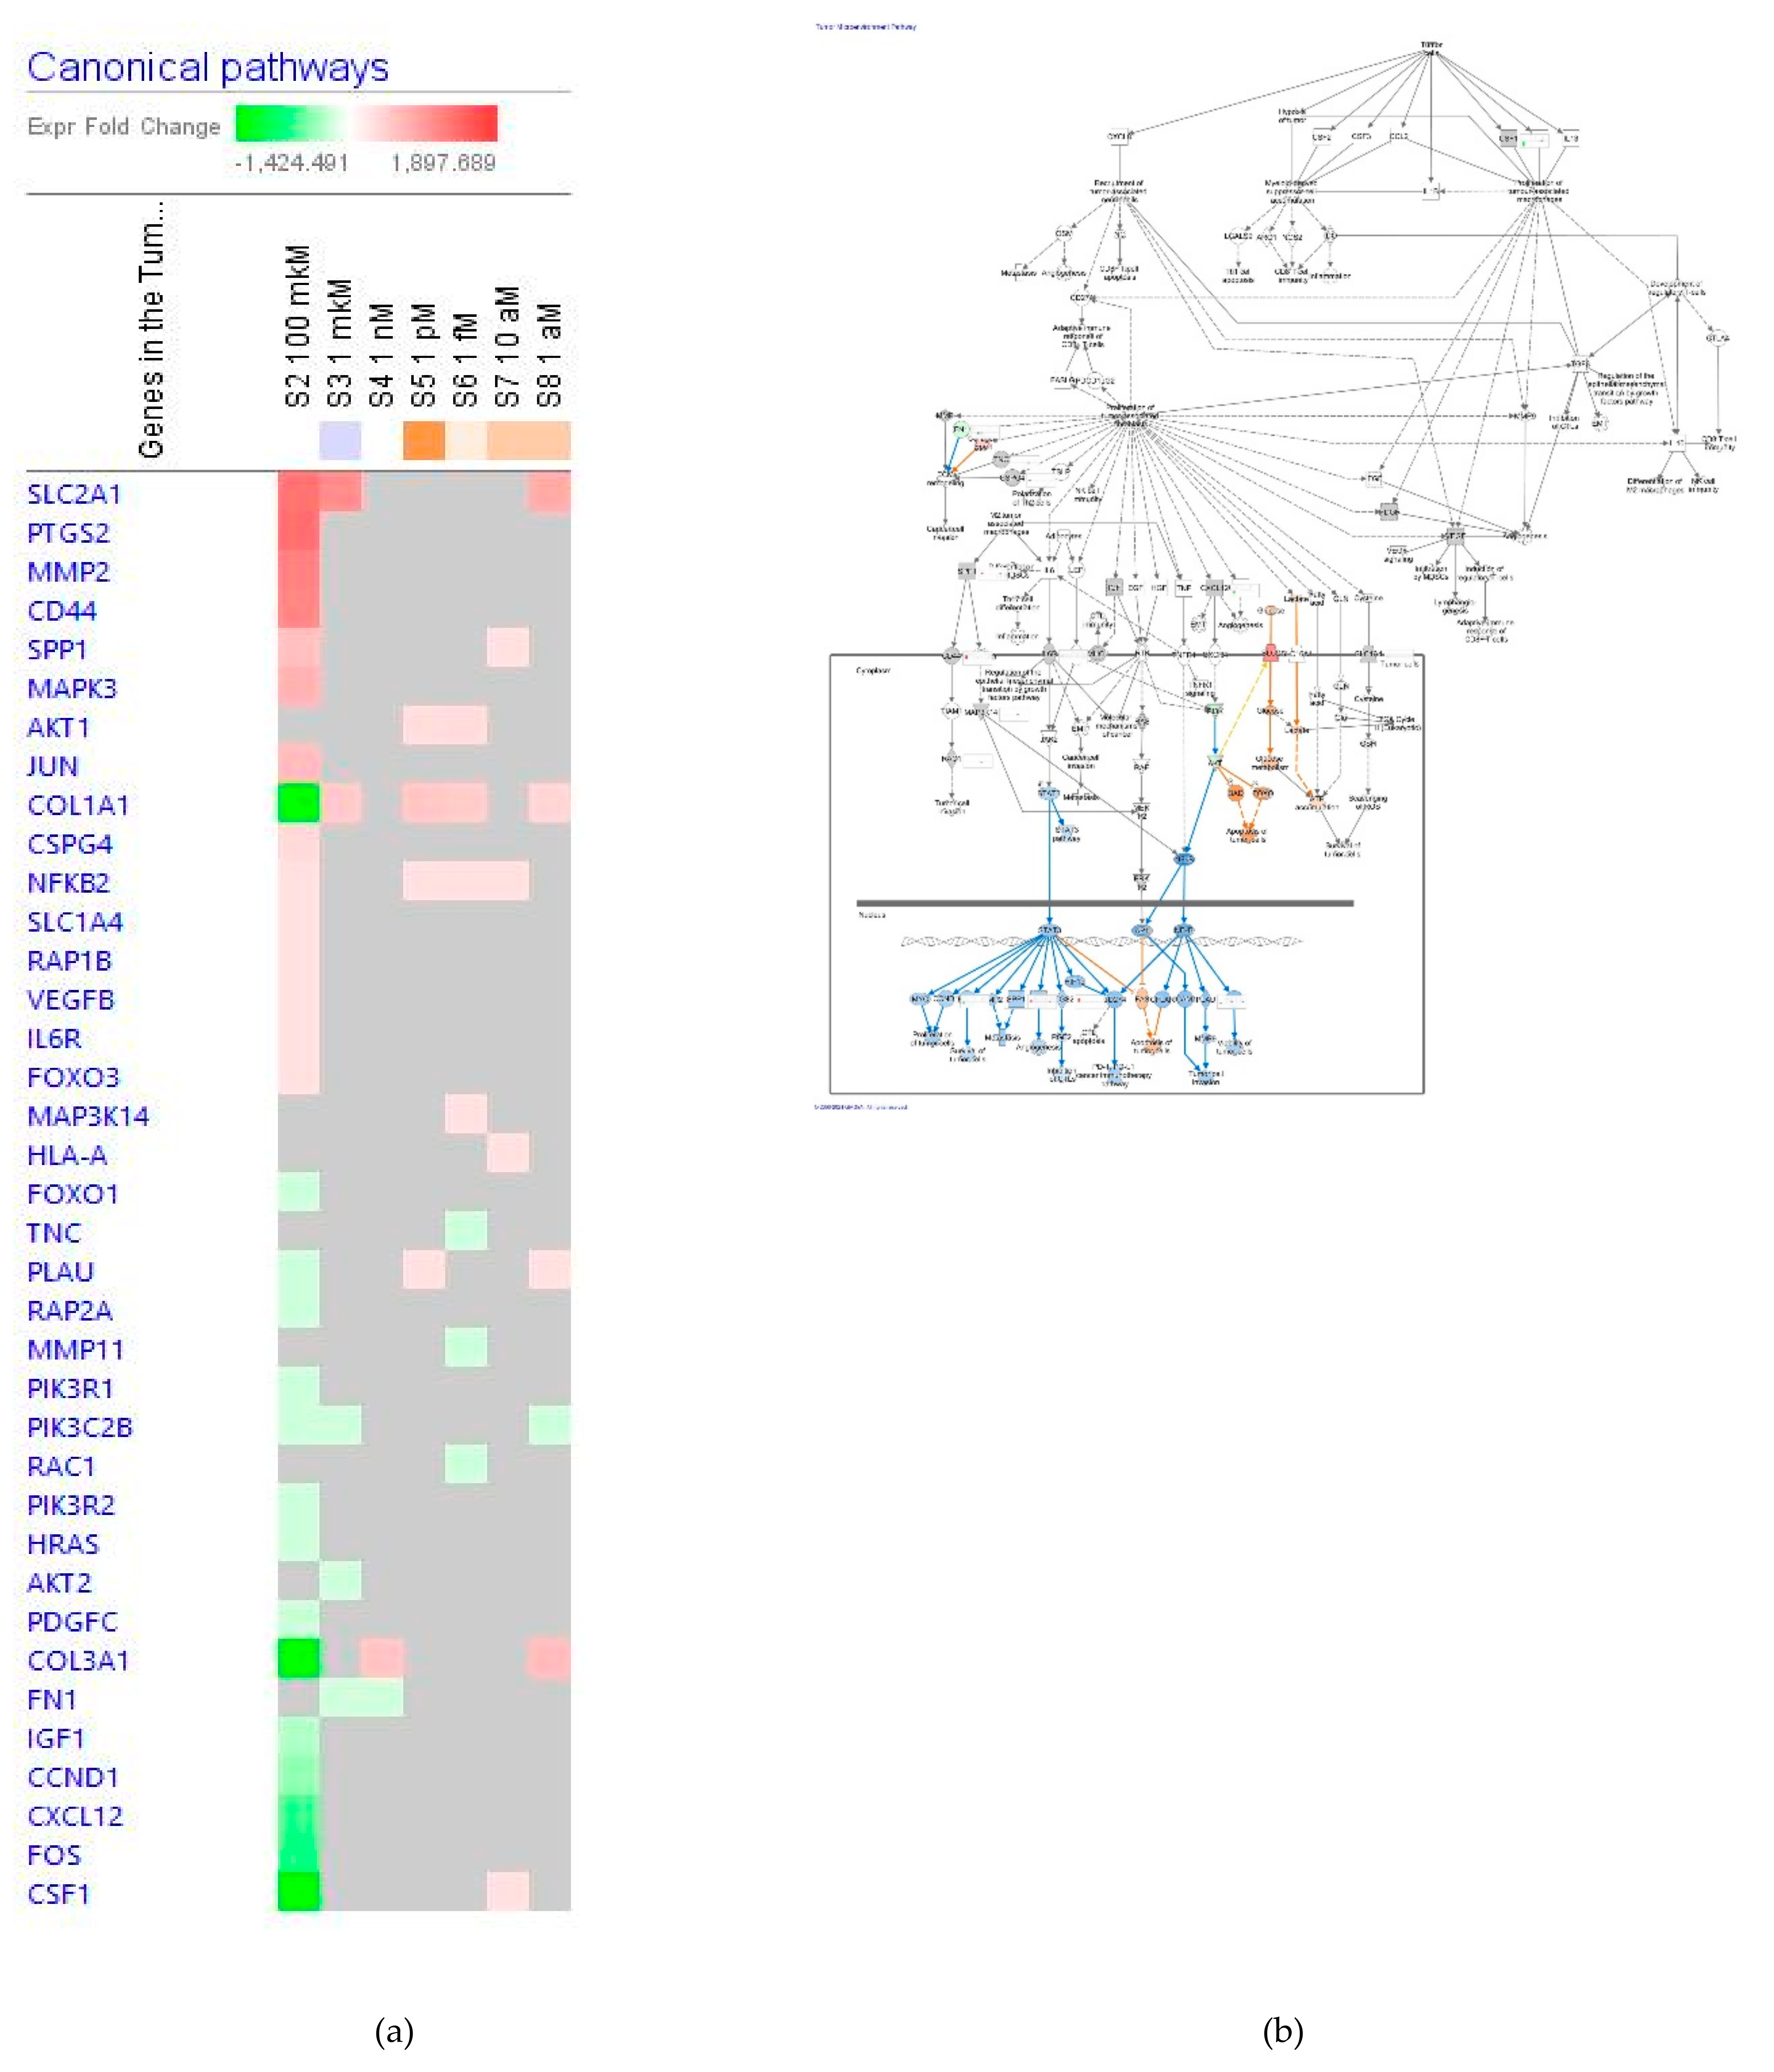
Tumor Microenvironment Pathway
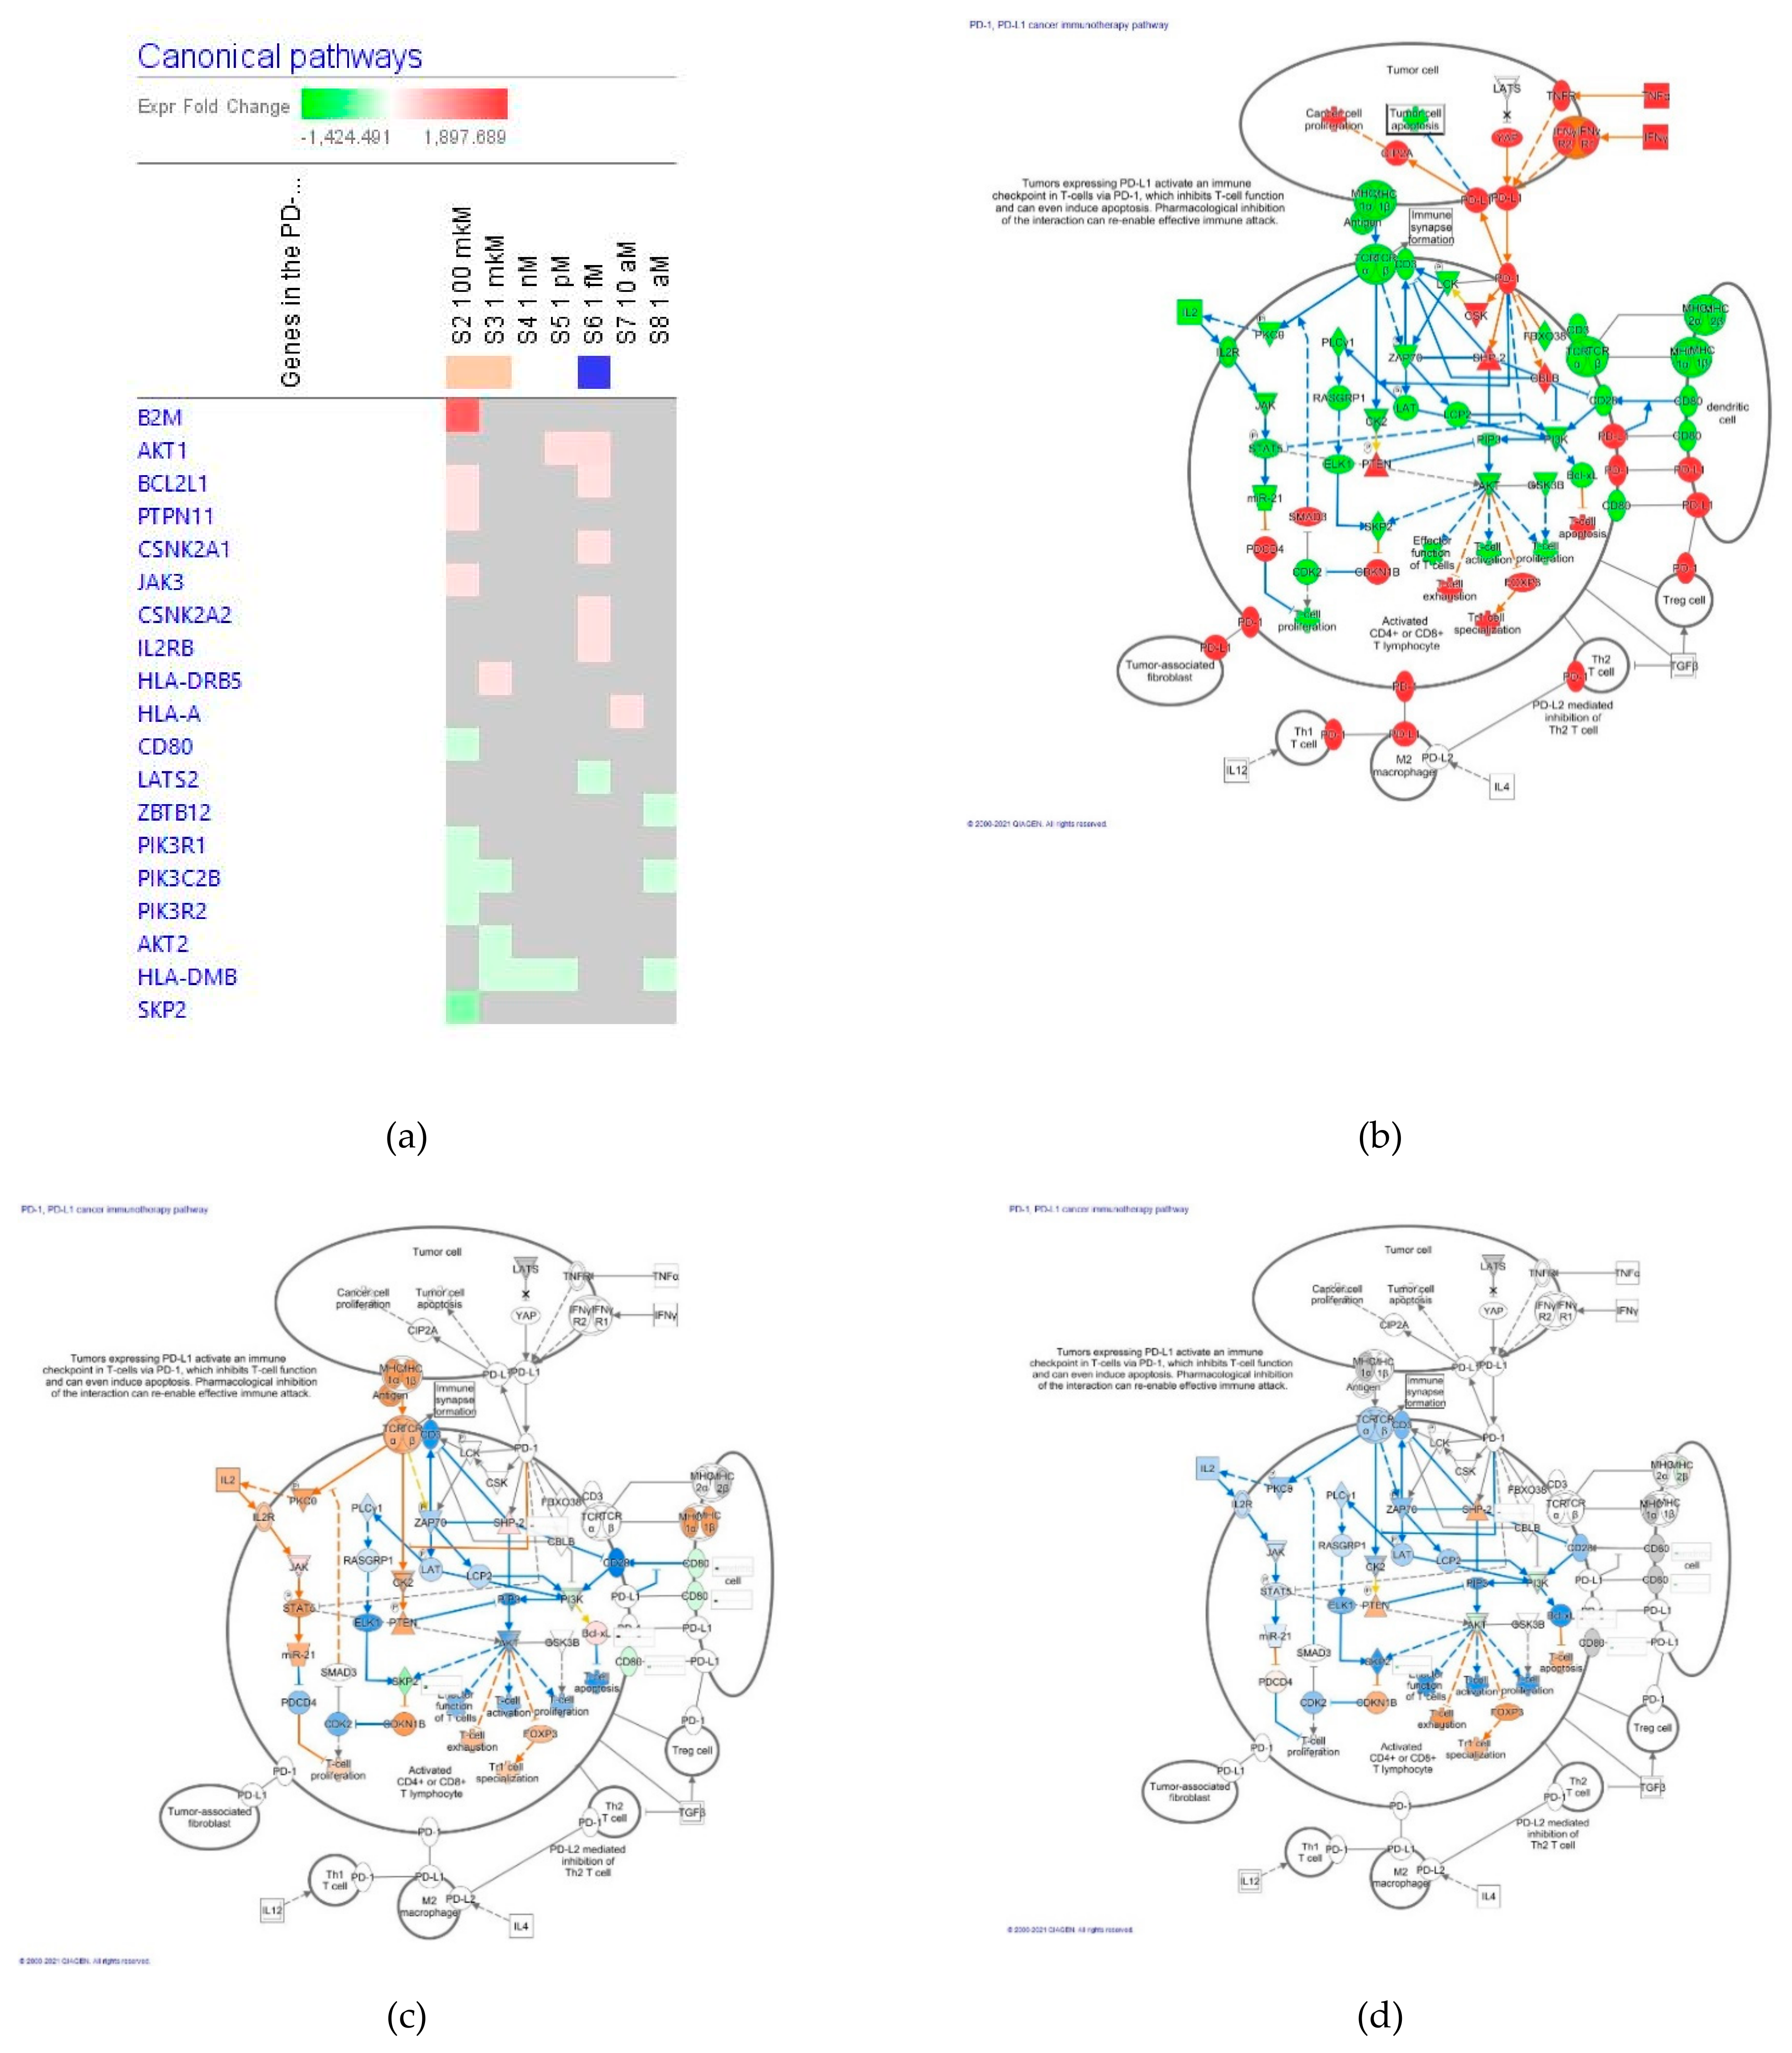
The Programmed Cell Death Receptor PD-1 Cancer Immunotherapy Pathway
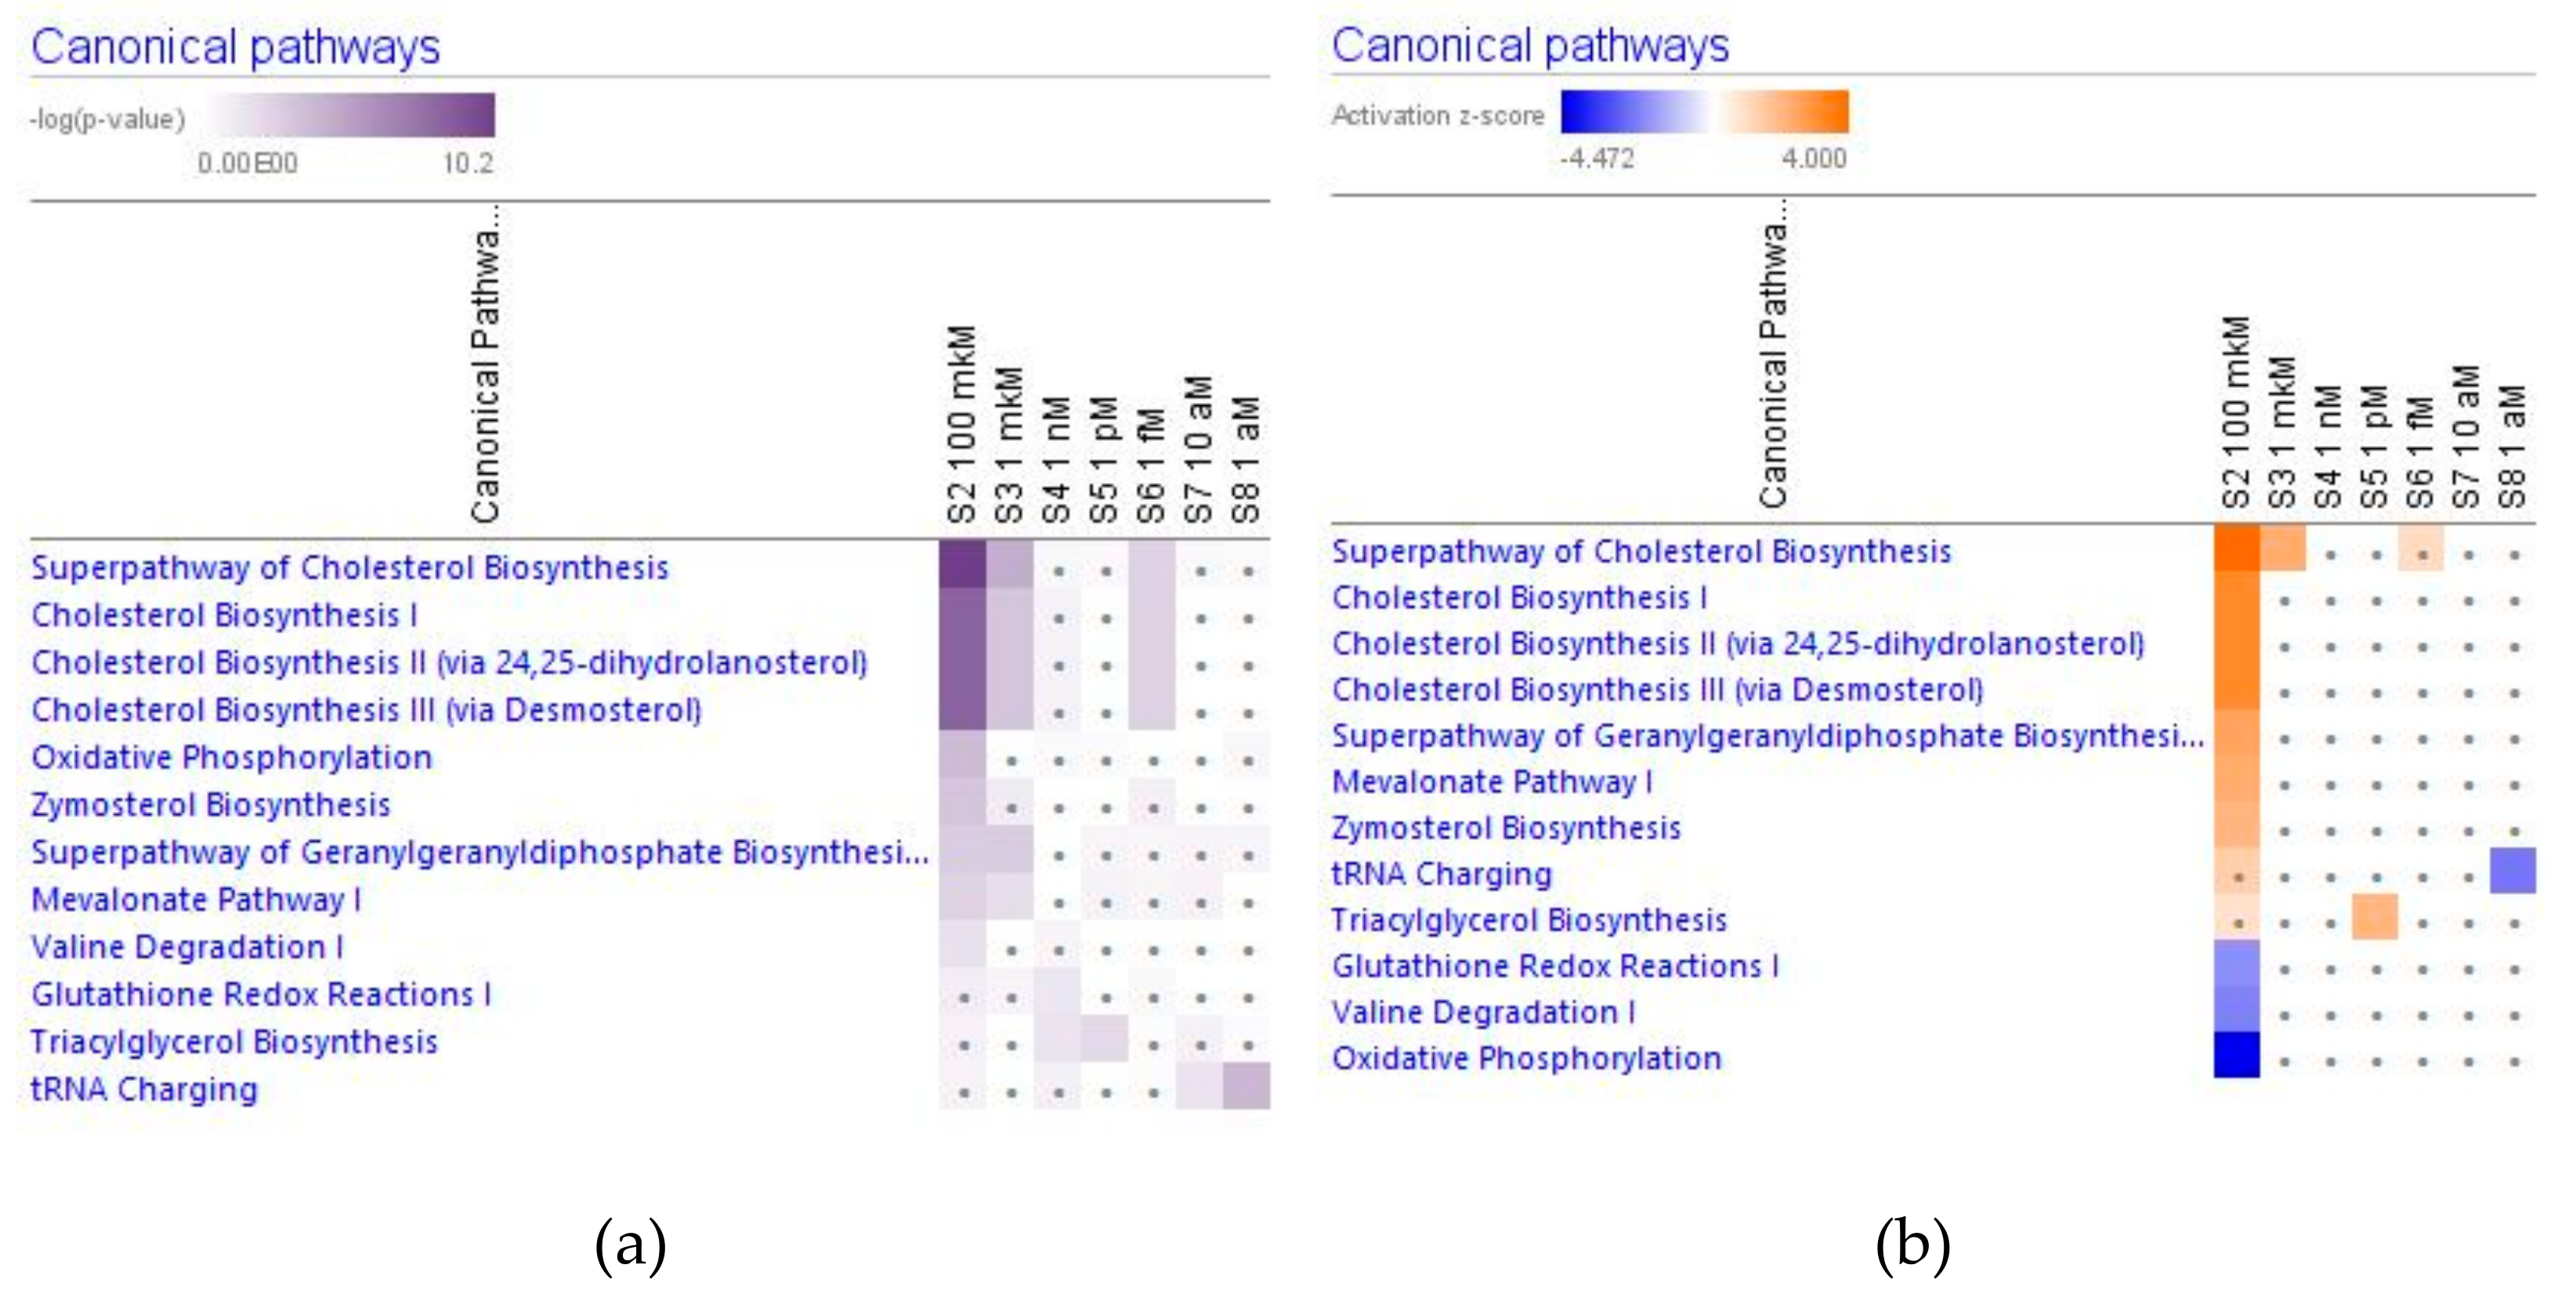
2.3. Effect of Ginsenoside Rg5 on Metabolic Pathways
2.4. Predicted Effects of Ginsenoside Rg5
2.4.1. Molecular and Cellular Functions
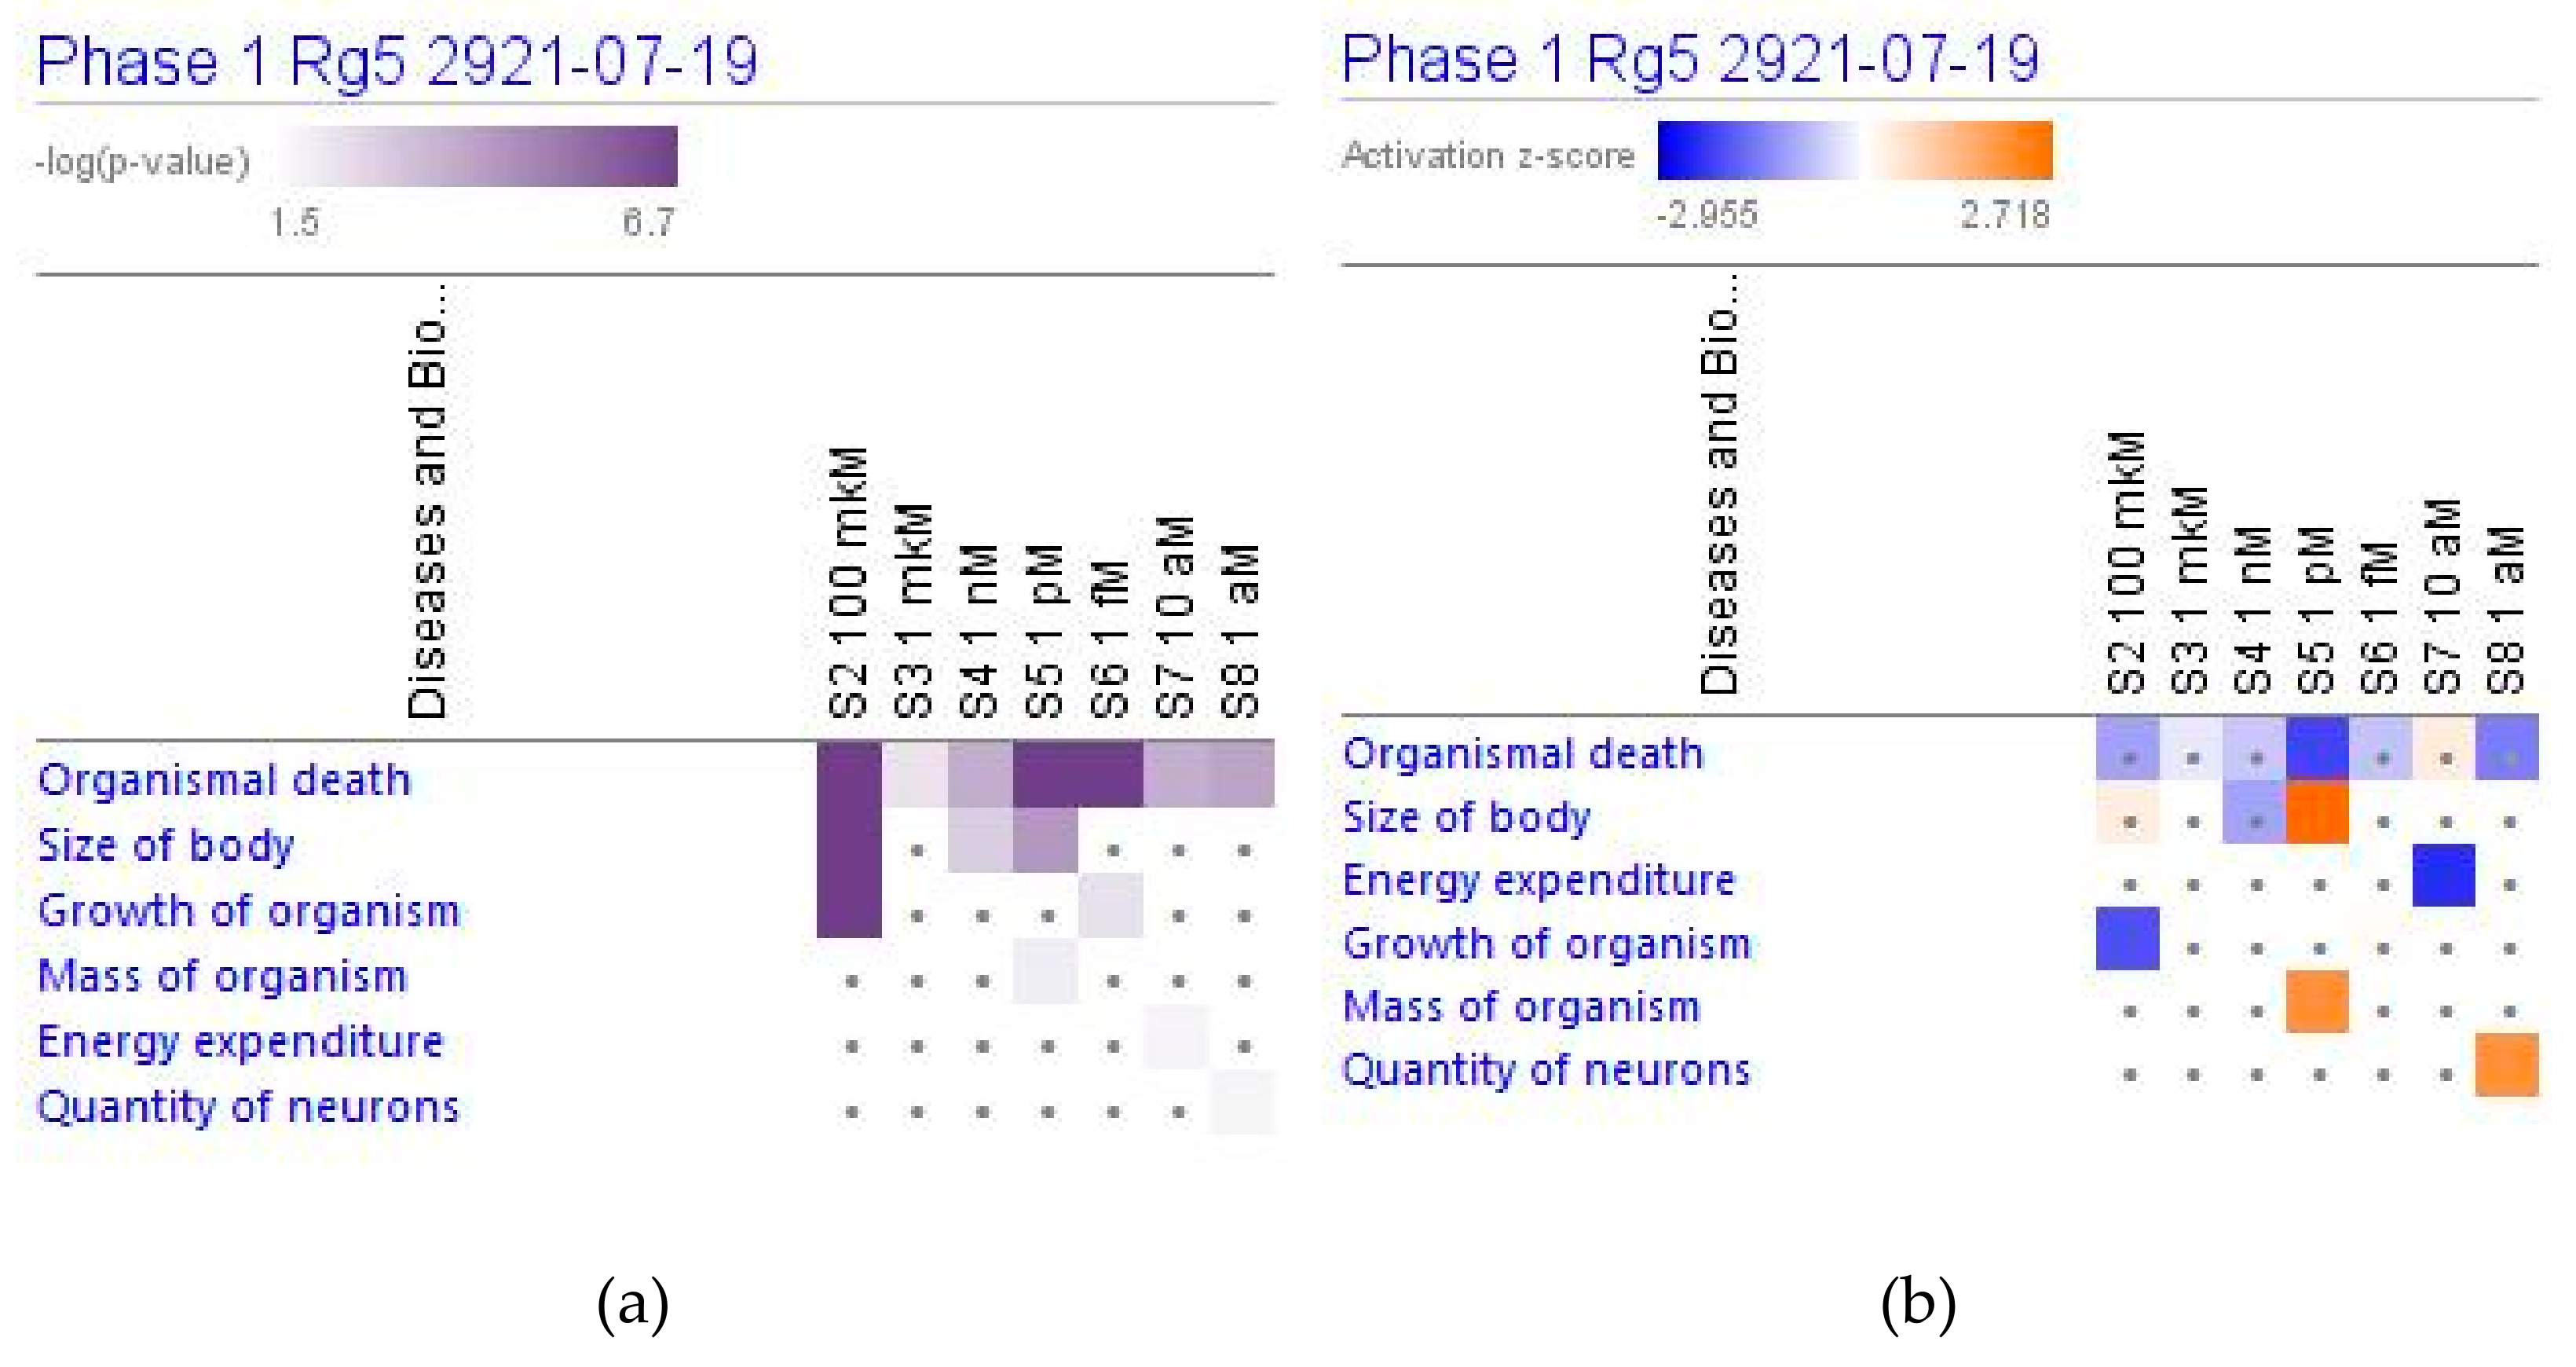
2.4.2. Physiological Functions
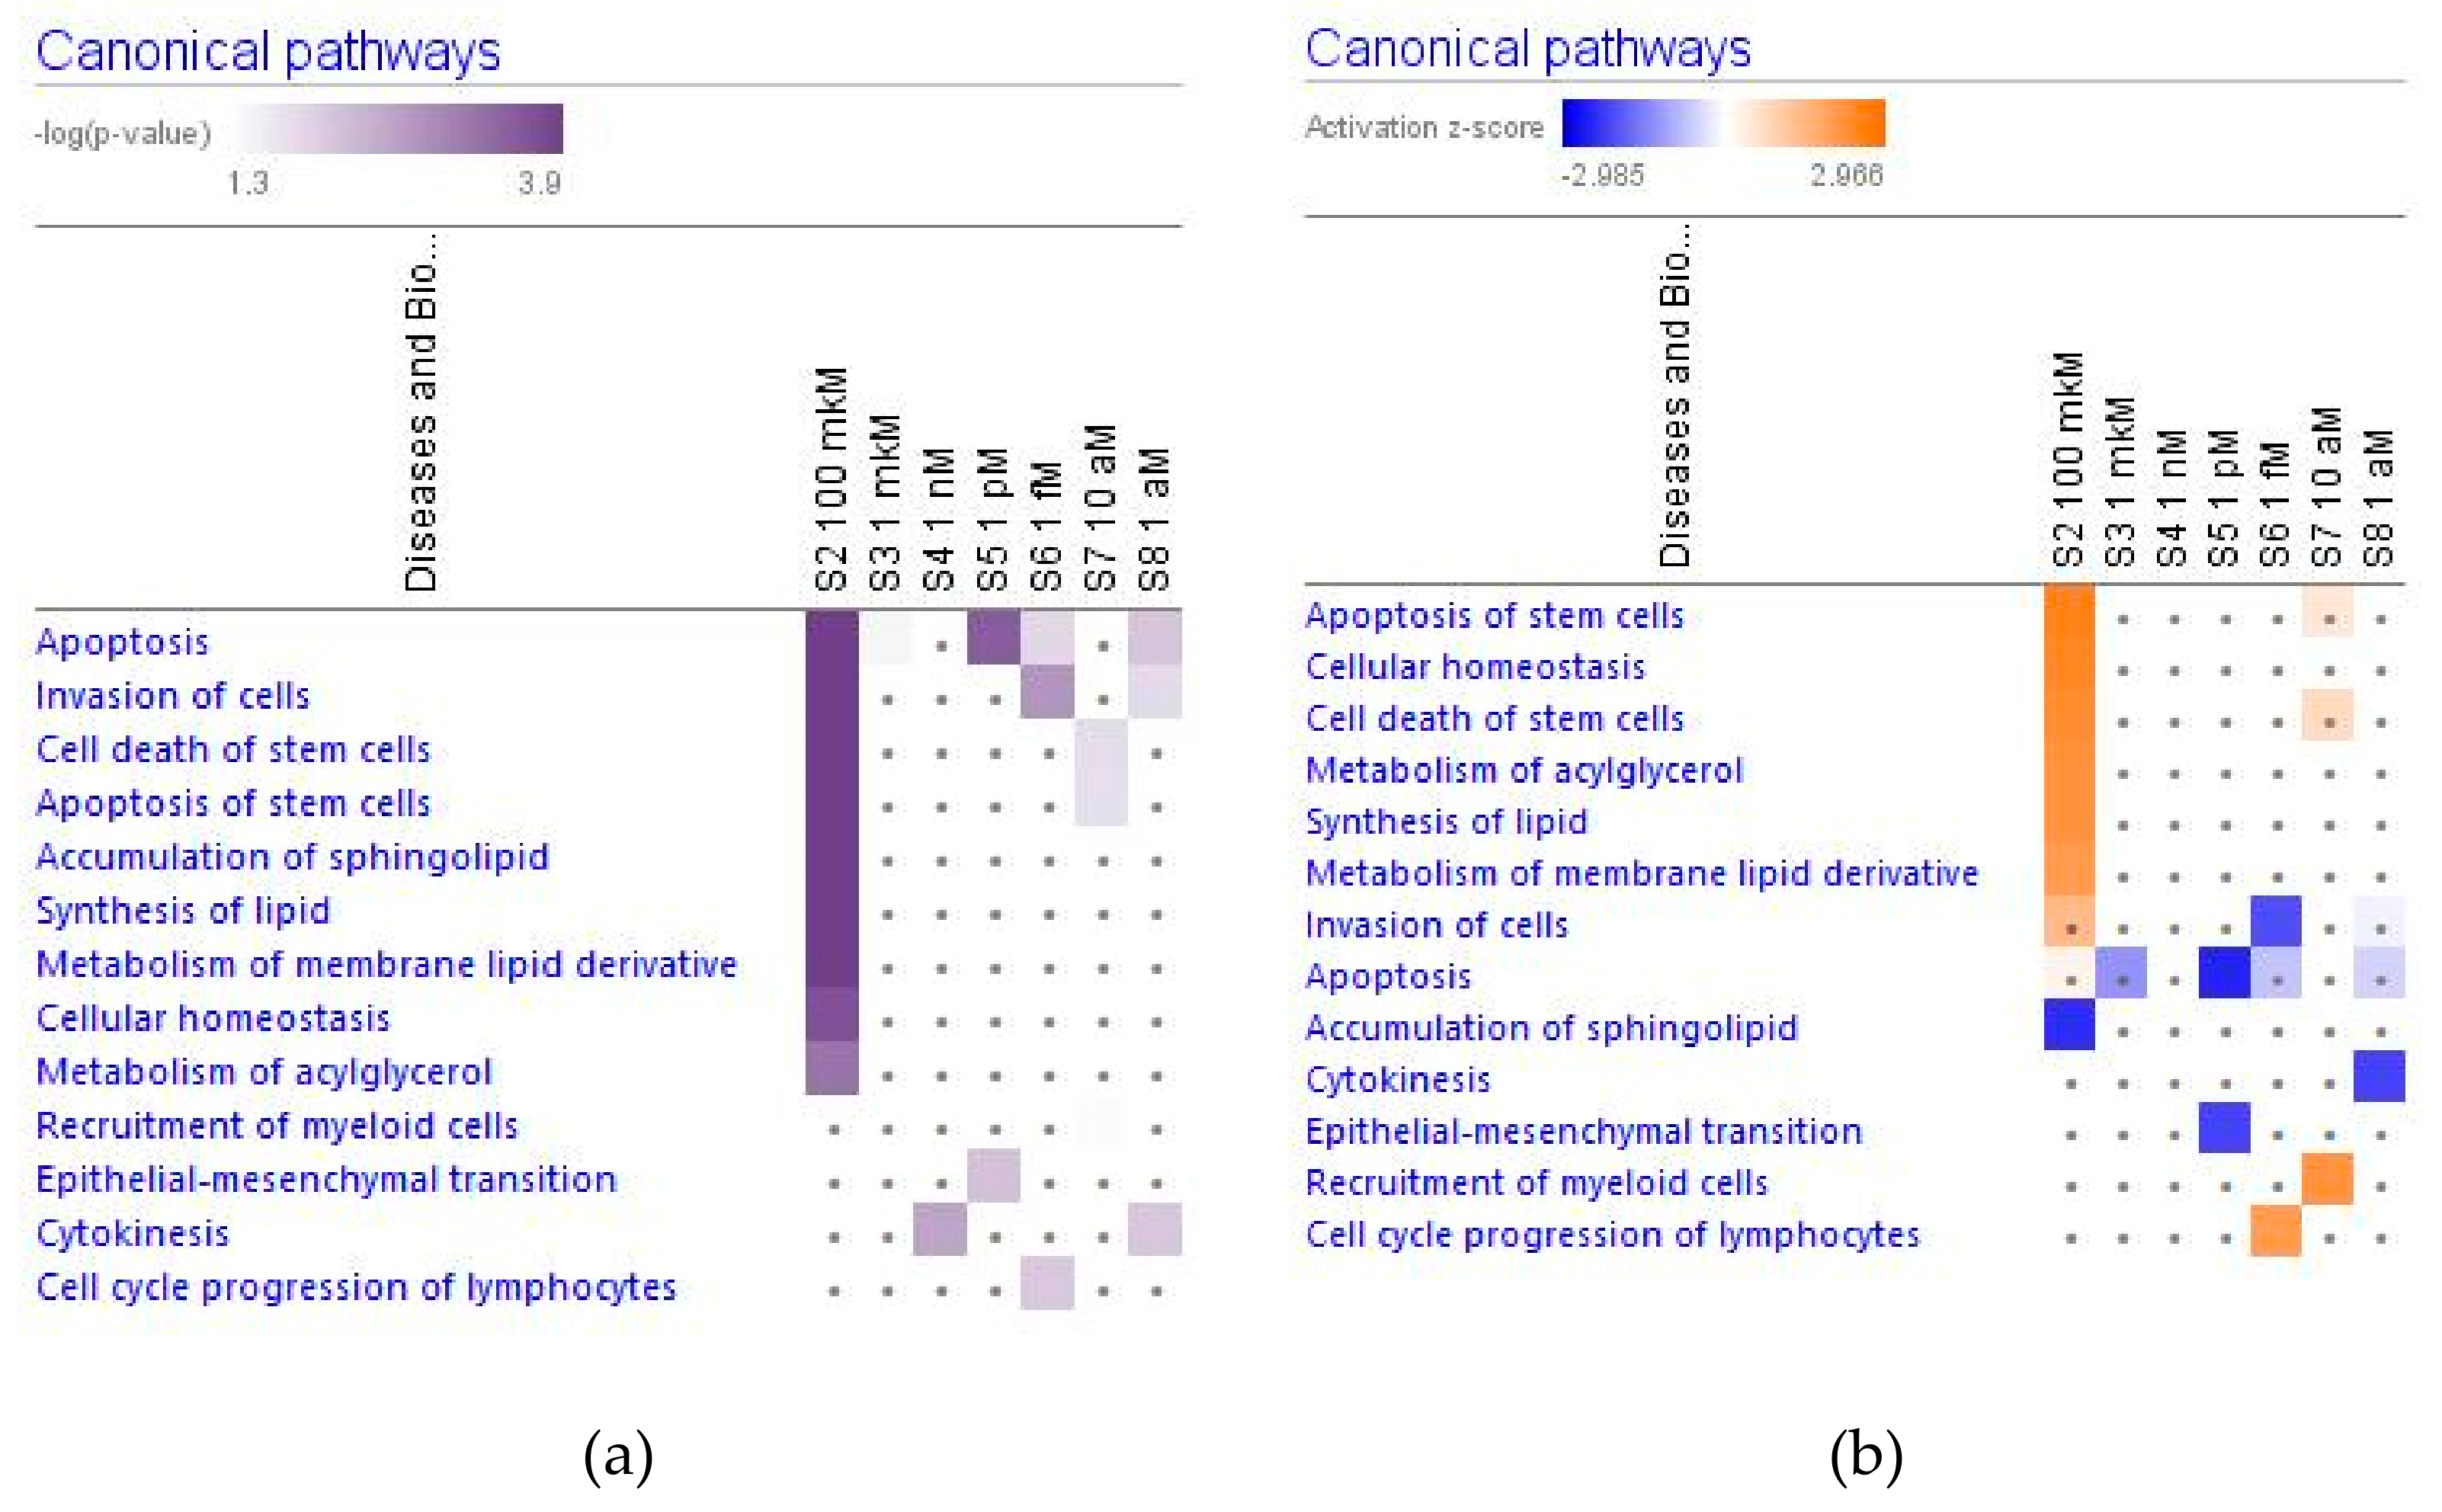
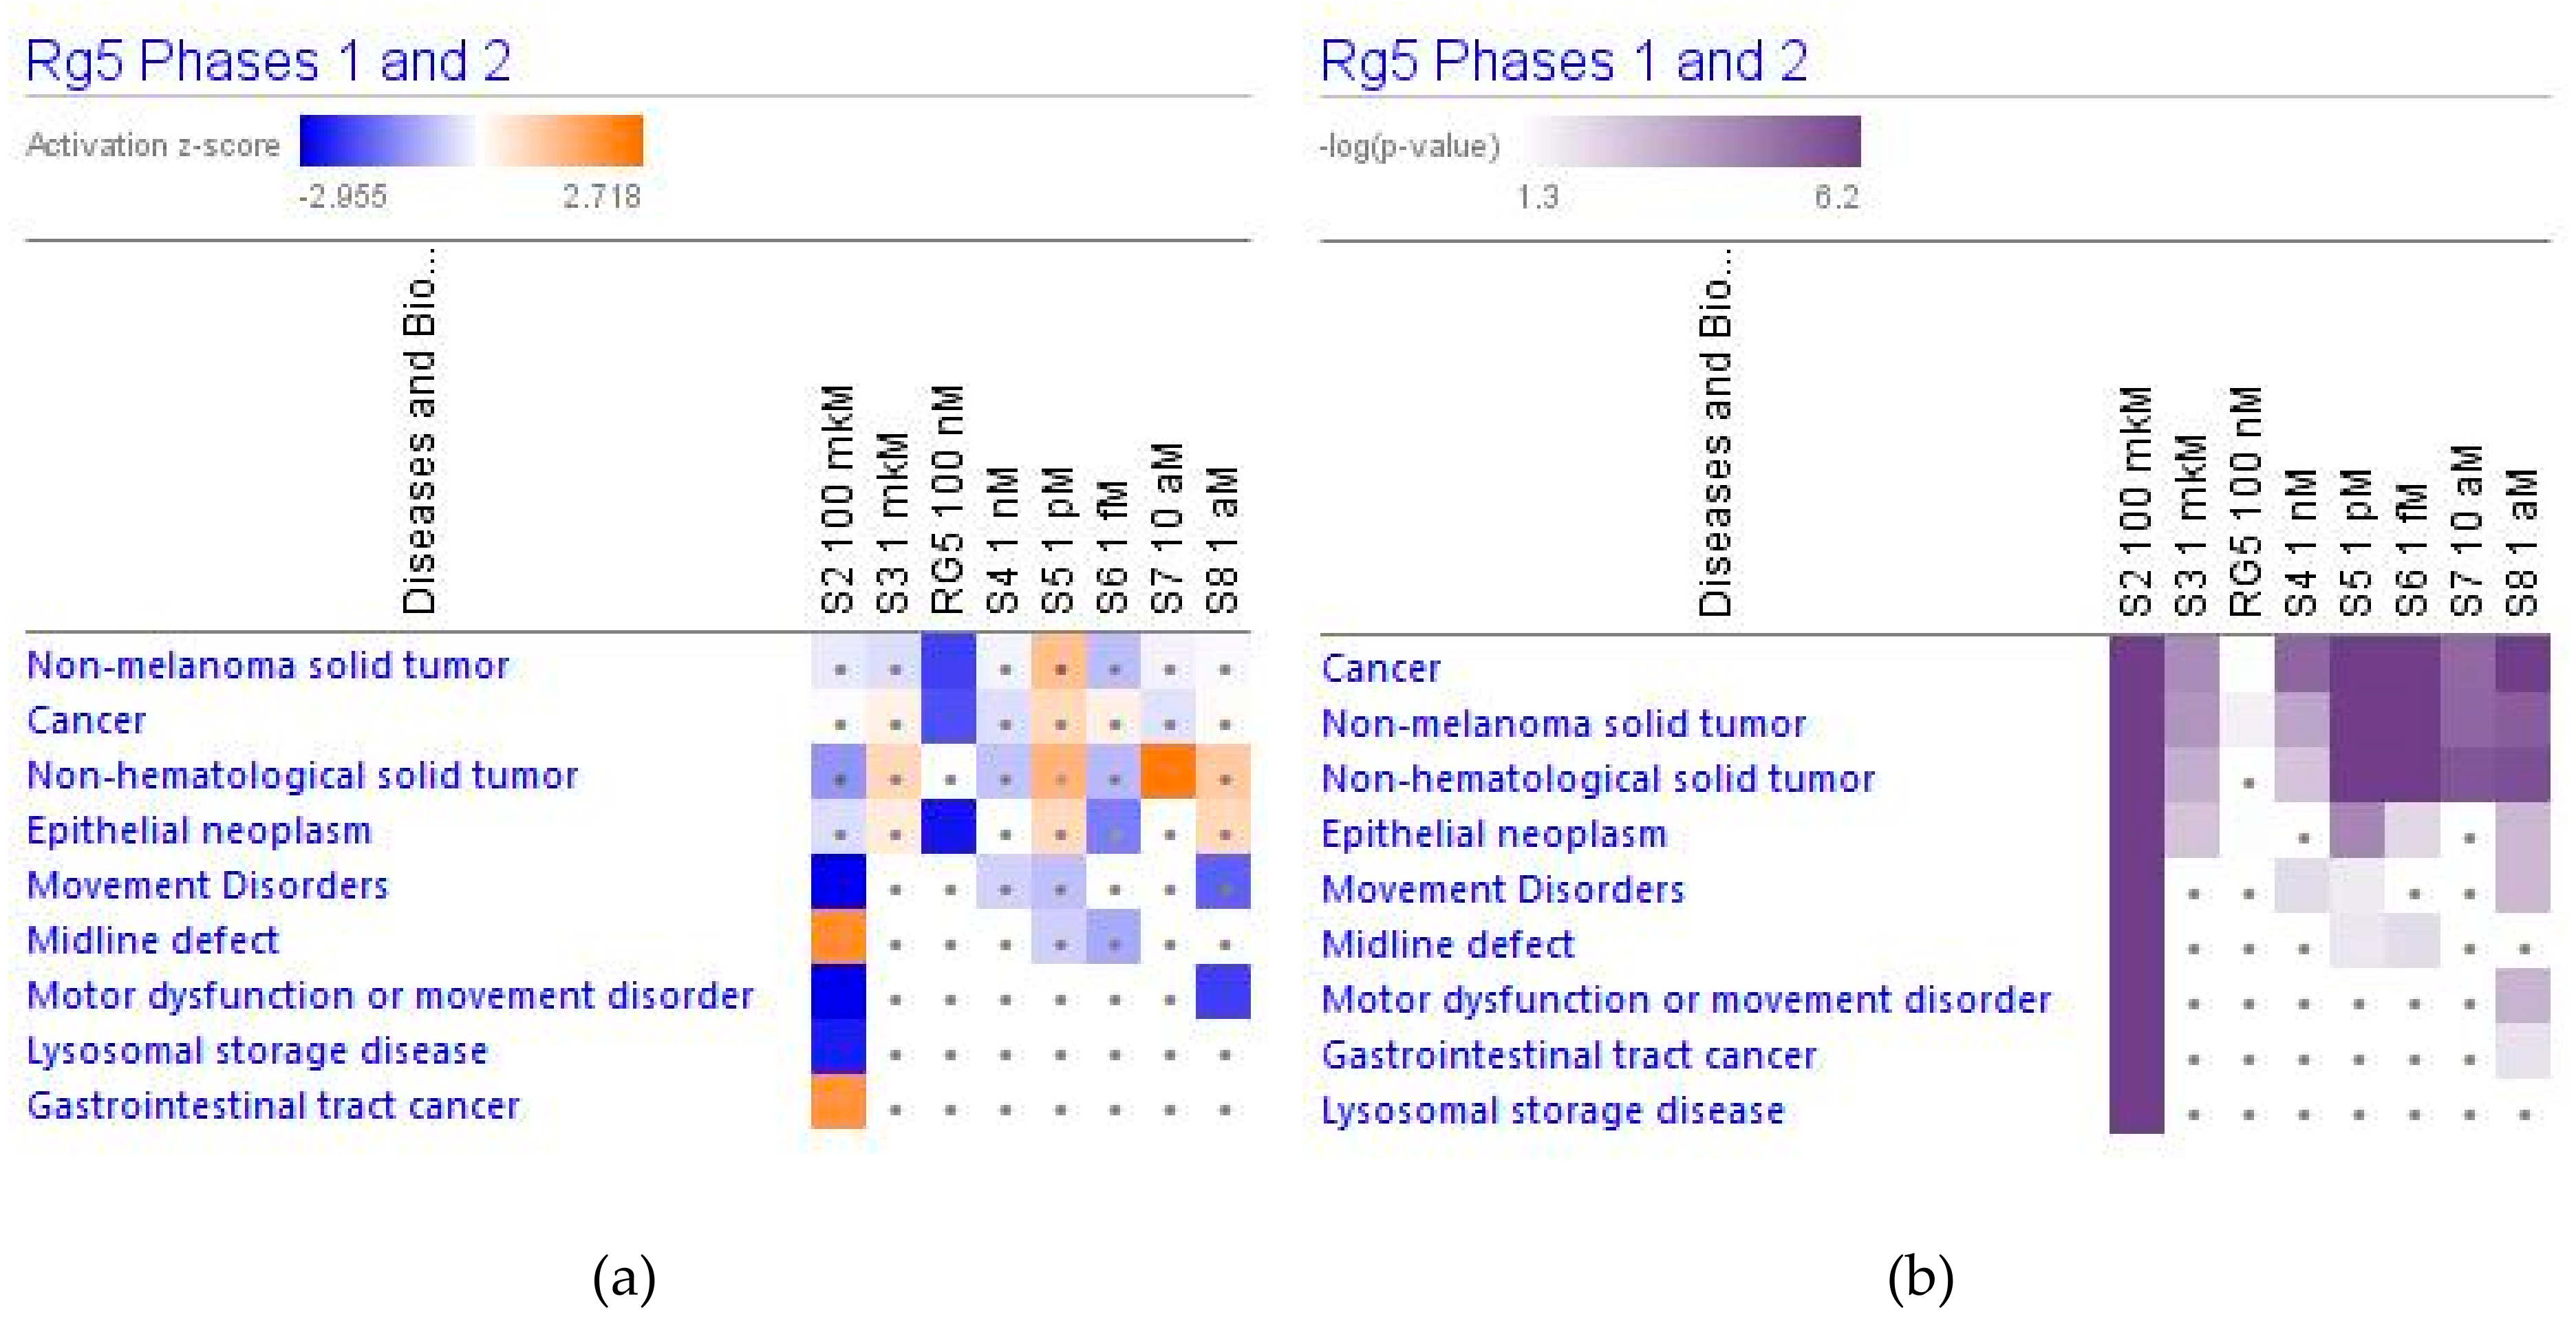
2.4.3. Diseases and Disorders
3. Discussion
4. Materials and Methods
4.1. mRNA Microarray Hybridization
4.2. Ingenuity Pathway Analysis (IPA)
4.3. Statistical Analysis
5. Conclusions
Supplementary Materials
Author Contributions
Funding
Institutional Review Board Statement
Informed Consent Statement
Data Availability Statement
Acknowledgments
Conflicts of Interest
References
- National Pharmacopoeia Committee. Pharmacopoeia of the People’s Republic of China, English ed.; National Pharmacopoeia Committee: Beijing, China, 2010. [Google Scholar]
- World Health Organization. Radix Ginseng. In WHO Monographs on Selected Medicinal Plants; World Health Organization: Geneva, Switzerland, 1999; Volume 1, pp. 168–182. [Google Scholar]
- EMA/HMPC/321232/Assessment Report on Panax ginseng C.A. Meyer, Radix; Based on Article 16d (1), Article 16f and Article 16h of Directive 2001/83/EC as Amended (Traditional Use); European Medicines Agency: Amsterdam, The Netherlands, 2014.
- EMA/HMPC/321232/Community Herbal Monograph on Panax Ginseng C.A. Meyer, Radix; European Medicines Agency: Amsterdam, The Netherlands, 2014.
- Lee, S.M.; Bae, B.-S.; Park, H.-W.; Ahn, N.-G.; Cho, B.-G.; Cho, Y.-L.; Kwak, Y.-S. Characterization of Korean Red Ginseng (Panax ginseng Meyer): History, preparation method, and chemical composition. J. Ginseng Res. 2015, 39, 384–391. [Google Scholar] [CrossRef] [Green Version]
- Bilia, A.R.; Bergonzi, M.C. The G115 standardized ginseng extract: An example for safety, efficacy, and quality of an herbal medicine. J. Ginseng Res. 2019, 44, 179–193. [Google Scholar] [CrossRef]
- Hou, W.; Wang, Y.; Zheng, P.; Cui, R. Effects of Ginseng on Neurological Disorders. Front. Cell. Neurosci. 2020, 14, 55. [Google Scholar] [CrossRef] [Green Version]
- Radad, K.; Gille, G.; Liu, L.; Rausch, W.-D. Use of Ginseng in Medicine with Emphasis on Neurodegenerative Disorders. J. Pharmacol. Sci. 2006, 100, 175–186. [Google Scholar] [CrossRef] [Green Version]
- Leung, K.W.; Wong, A.S. Pharmacology of ginsenosides: A literature review. Chin. Med. 2010, 5, 20–27. [Google Scholar] [CrossRef] [Green Version]
- Lee, S.; Rhee, D.K. Effects of ginseng on stress-related depression, anxiety, and the hypothalamic-pituitary-adrenal axis. J. Ginseng Res. 2017, 41, 589–594. [Google Scholar] [CrossRef]
- Geng, J.; Dong, J.; Ni, H.; Lee, M.S.; Wu, T.; Jiang, K.; Wang, G.; Zhou, A.L.; Malouf, R. Ginseng for cognition. Cochrane Database Syst. Rev. 2010, 12, CD007769. [Google Scholar] [CrossRef]
- Lee, M.S.; Yang, E.J.; Kim, J.I.; Ernst, E. Ginseng for cognitive function in Alzheimer’s disease: A systematic review. J. Alzheimer Dis. 2009, 18, 339–344. [Google Scholar] [CrossRef] [Green Version]
- Choi, J.; Kim, T.-H.; Choi, T.-Y.; Lee, M.S. Ginseng for Health Care: A Systematic Review of Randomized Controlled Trials in Korean Literature. PLoS ONE 2013, 8, e59978. [Google Scholar] [CrossRef] [Green Version]
- Ong, W.-Y.; Farooqui, T.; Koh, H.-L.; Farooqui, A.A.; Ling, E.-A. Protective effects of ginseng on neurological disorders. Front. Aging Neurosci. 2015, 7, 129. [Google Scholar] [CrossRef] [Green Version]
- Hallstrom, C.; Fulder, S.; Carruthers, M. Effects of Ginseng on the Performance of Nurses on Night Duty. Am. J. Chin. Med. 1978, 6, 277–282. [Google Scholar] [CrossRef]
- Kim, H.-G.; Cho, J.-H.; Yoo, S.-R.; Lee, J.-S.; Han, J.-M.; Lee, N.-H.; Ahn, Y.-C.; Son, C.-G. Antifatigue Effects of Panax ginseng C.A. Meyer: A Randomised, Double-Blind, Placebo-Controlled Trial. PLoS ONE 2013, 8, e61271. [Google Scholar] [CrossRef] [Green Version]
- Arring, N.M.; Millstine, D.; Marks, L.A.; Nail, L.M. Ginseng as a treatment for fatigue: A systematic review. J. Altern. Comple-mentary Med. 2018, 24, 624–633. [Google Scholar] [CrossRef]
- Kaneko, H.; Nakanishi, K. Proof of the mysterious efficacy of Ginseng: Basic and clinical trials: Clinical effects of medical gin-seng, Korean Red Ginseng: Specifically, its anti-stress action for prevention of disease. J. Pharmacol. Sci. 2004, 95, 158–162. [Google Scholar] [CrossRef] [Green Version]
- Mariage, P.-A.; Hovhannisyan, A.; Panossian, A.G. Efficacy of Panax ginseng Meyer Herbal Preparation HRG80 in Preventing and Mitigating Stress-Induced Failure of Cognitive Functions in Healthy Subjects: A Pilot, Randomized, Double-Blind, Placebo-Controlled Crossover Trial. Pharmaceuticals 2020, 13, 57. [Google Scholar] [CrossRef] [Green Version]
- Reay, J.L.; Kennedy, D.O.; Scholey, A.B. Effects of Panax ginseng, consumed with and without glucose, on blood glucose levels and cognitive performance during sustained ‘mentally demanding’ tasks. J. Psychopharmacol. 2006, 20, 771–781. [Google Scholar] [CrossRef]
- Kennedy, D.O.; Scholey, A.B.; Wesnes, K.A. Dose dependent changes in cognitive performance and mood following acute administration of ginseng to healthy young volunteers. Nutr. Neurosci. 2001, 4, 295–310. [Google Scholar] [CrossRef]
- Kennedy, D.O.; Reay, J.L.; Scholey, A.B. Effects of 8 weeks administration of Korean Panax ginseng extract on the mood and cognitive performance of healthy individuals. J. Ginseng Res. 2007, 31, 34–43. [Google Scholar]
- Kennedy, D.; Scholey, A. Ginseng: Potential for the enhancement of cognitive performance and mood. Pharmacol. Biochem. Behav. 2003, 75, 687–700. [Google Scholar] [CrossRef]
- Yeo, H.-B.; Yoon, H.-K.; Lee, H.-J.; Kang, S.-G.; Jung, K.-Y.; Kim, L. Effects of Korean Red Ginseng on Cognitive and Motor Function: A Double-blind, Randomized, Placebo-controlled Trial. J. Ginseng Res. 2012, 36, 190–197. [Google Scholar] [CrossRef] [PubMed] [Green Version]
- Park, K.; Jin, H.; Rhee, H.Y.; Kim, S.; Lee, S.E.; Kim, Y.O.; Kim, G.S.; Kim, S.Y.; Yim, S.V.; Choi, Y.C. A randomized, dou-ble-blind, placebo-controlled clinical trial of Korean Ginseng as a functional food in mild cognitive impairment. Alzheimer Dement. 2013, 9, P804. [Google Scholar] [CrossRef]
- Lee, S.-T.; Chu, K.; Sim, J.-Y.; Heo, J.-H.; Kim, M. Panax Ginseng Enhances Cognitive Performance in Alzheimer Disease. Alzheimer Dis. Assoc. Disord. 2008, 22, 222–226. [Google Scholar] [CrossRef] [PubMed]
- Heo, J.H.; Lee, S.T.; Chu, K.; Oh, M.J.; Park, H.J.; Shim, J.Y.; Kim, M. An open-label trial of Korean red ginseng as an adjuvant treatment for cognitive impairment in patients with Alzheimer’s disease. Eur. J. Neurol. 2008, 15, 865–868. [Google Scholar] [CrossRef]
- Heo, J.H.; Lee, S.T.; Oh, M.J.; Park, H.J.; Shim, J.Y.; Chu, K.; Kim, M. Improvement of cognitive deficit in Alzheimer’s disease patients by long term treatment with Korean red ginseng. J. Ginseng Res. 2011, 35, 457–461. [Google Scholar] [CrossRef] [PubMed] [Green Version]
- Lemerond, T.; Panossian, A.G. Panax ginseng Meyer herbal pPreparation HRG80 for preventing and mitigating stress-induced failure of cognitive functions in healthy subjects. J. Altern. Complement. Integr. Med. 2020, 6, 100. [Google Scholar]
- Dimpfel, W.; Mariage, P.-A.; Panossian, A. Effects of Red and White Ginseng Preparations on Electrical Activity of the Brain in Elderly Subjects: A Randomized, Double-Blind, Placebo-Controlled, Three-Armed Cross-Over Study. Pharmaceuticals 2021, 14, 182. [Google Scholar] [CrossRef]
- Dimpfel, W.; Schombert, L.; Panossian, A.G. Panax ginseng preparations enhance long term potentiation in rat hippocampal slices by glutamatergic NMDA and kainate receptor mediated transmission. J. Altern. Complement. Integr. Med. 2020, 6, 106. [Google Scholar] [CrossRef]
- Wu, J.; Jeong, H.K.; Bulin, S.E.; Kwon, S.W.; Park, J.H.; Bezprozvanny, I. Ginsenosides protect striatal neurons in a cellular model of Huntington’s disease. J. Neurosci. Res. 2009, 87, 1904–1912. [Google Scholar] [CrossRef] [Green Version]
- Choi, S.-Y.; Kim, K.-J.; Song, J.-H.; Lee, B.-Y. Ginsenoside Rg5 prevents apoptosis by modulating heme-oxygenase-1/nuclear factor E2-related factor 2 signaling and alters the expression of cognitive impairment-associated genes in thermal stress-exposed HT22 cells. J. Ginseng Res. 2017, 42, 225–228. [Google Scholar] [CrossRef]
- Cho, Y.-L.; Hur, S.-M.; Kim, J.-Y.; Lee, D.-K.; Choe, J.; Won, M.-H.; Ha, K.-S.; Jeoung, D.; Han, S.; Ryoo, S.; et al. Specific Activation of Insulin-like Growth Factor-1 Receptor by Ginsenoside Rg5 Promotes Angiogenesis and Vasorelaxation. J. Biol. Chem. 2015, 290, 467–477. [Google Scholar] [CrossRef] [Green Version]
- Yang, Y.-L.; Li, J.; Liu, K.; Zhang, L.; Liu, Q.; Liu, B.; Qi, L.-W. Ginsenoside Rg5 increases cardiomyocyte resistance to ischemic injury through regulation of mitochondrial hexokinase-II and dynamin-related protein. Cell Death Dis. 2017, 8, e2625. [Google Scholar] [CrossRef] [Green Version]
- Kim, S.-J.; Kim, A.K. Anti-breast cancer activity of Fine Black ginseng (Panax ginseng Meyer) and ginsenoside Rg5. J. Ginseng Res. 2014, 39, 125–134. [Google Scholar] [CrossRef] [Green Version]
- Liu, Y.; Fan, D. Ginsenoside Rg5 induces G2/M phase arrest, apoptosis and autophagy via regulating ROS-mediated MAPK pathways against human gastric cancer. Biochem. Pharmacol. 2019, 168, 285–304. [Google Scholar] [CrossRef]
- Song, L.; Yang, F.; Wang, Z.; Yang, L.; Zhou, Y. Ginsenoside Rg5 inhibits cancer cell migration by inhibiting the nuclear fac-tor-κB and erythropoietin-producing hepatocellular receptor A2 signaling pathways. Oncol. Lett. 2021, 21, 452. [Google Scholar] [CrossRef]
- Kim, J.-E.; Lee, W.; Yang, S.; Cho, S.-H.; Baek, M.-C.; Song, G.-Y.; Bae, J.-S. Suppressive effects of rare ginsenosides, Rk1 and Rg5, on HMGB1-mediated septic responses. Food Chem. Toxicol. 2018, 124, 45–53. [Google Scholar] [CrossRef]
- Ahn, S.; Siddiqi, M.H.; Aceituno, V.C.; Simu, S.Y.; Zhang, J.; Jimenez Pere, Z.E.; Kim, Y.J.; Yang, D.C. Ginsenoside Rg5:Rk1 attenuates TNF-α/IFN-γ-induced production of thymus- and activation-regulated chemokine (TARC/CCL17) and LPS-induced NO production via downregulation of NF-κB/p38 MAPK/STAT1 signaling in human keratinocytes and mac-rophages. Vitro Cell Dev Biol Anim. 2016, 52, 287–295. [Google Scholar] [CrossRef]
- Park, J.Y.; Choi, P.; Kim, T.; Ko, H.; Kim, H.K.; Kang, K.S.; Ham, J. Protective effects of processed ginseng and its active gin-senosides on cisplatin-induced nephrotoxicity: In vitro and in vivo studies. J. Agric. Food Chem. 2015, 63, 5964–5969. [Google Scholar] [CrossRef] [PubMed]
- Liang, L.-D.; He, T.; Du, T.-W.; Fan, Y.-G.; Chen, D.-S.; Wang, Y. Ginsenoside-Rg5 induces apoptosis and DNA damage in human cervical cancer cells. Mol. Med. Rep. 2014, 11, 940–946. [Google Scholar] [CrossRef] [Green Version]
- Cheng, Z.; Zhang, M.; Ling, C.; Zhu, Y.; Ren, H.; Hong, C.; Qin, J.; Liu, T.; Wang, J. Neuroprotective Effects of Ginsenosides against Cerebral Ischemia. Molecules 2019, 24, 1102. [Google Scholar] [CrossRef] [PubMed] [Green Version]
- Yoo, S.; Park, B.-I.; Kim, D.-H.; Lee, S.; Lee, S.-H.; Shim, W.-S.; Seo, Y.; Kang, K.; Lee, K.-T.; Yim, S.-V.; et al. Ginsenoside Absorption Rate and Extent Enhancement of Black Ginseng (CJ EnerG) over Red Ginseng in Healthy Adults. Pharmaceutics 2021, 13, 487. [Google Scholar] [CrossRef] [PubMed]
- Kim, H.K. Pharmacokinetics of ginsenoside Rb1 and its metabolite compound K after oral administration of Korean Red Gin-seng extract. J. Ginseng Res. 2013, 37, 451–456. [Google Scholar] [CrossRef] [Green Version]
- Xu, Q.F.; Fang, X.L.; Chen, D.F. Pharmacokinetics and bioavailability of ginsenoside Rb1 and Rg1 from Panax notoginseng in rats. J. Ethnopharmacol. 2003, 84, 187–192. [Google Scholar] [CrossRef]
- Chen, S.; Xu, H.-Q.; Zhang, J.; Wang, C.-X.; Liu, J.-Q.; Peng, L.-H.; Cheng, J.-L.; Liu, A. A systematic study of the dissolution and relative bioavailability of four ginsenosides in the form of ultrafine granular powder, common powder and traditional pieces of Panax quinquefolius L, in vitro and in beagles. J. Ethnopharmacol. 2016, 185, 9–16. [Google Scholar] [CrossRef] [PubMed]
- Zhou, Q.-L.; Zhu, D.-N.; Yang, Y.-F.; Xu, W.; Yang, X.-W. Simultaneous quantification of twenty-one ginsenosides and their three aglycones in rat plasma by a developed UFLC–MS/MS assay: Application to a pharmacokinetic study of red ginseng. J. Pharm. Biomed. Anal. 2017, 137, 1–12. [Google Scholar] [CrossRef]
- Ma, C.; Lin, Q.; Xue, Y.; Ju, Z.; Deng, G.; Liu, W.; Sun, Y.; Guan, H.; Cheng, X.; Wang, C. Pharmacokinetic studies of gin-senosides Rk1 and Rg5 in rats by UFLC-MS/MS. Biomed. Chromatogr. 2021, 3, e5108. [Google Scholar]
- Kim, H.; Lee, J.H.; Kim, J.E.; Kim, Y.S.; Ryu, C.H.; Lee, H.J.; Kim, H.M.; Jeon, H.; Won, H.J.; Lee, J.Y.; et al. Micro-/nano-sized delivery systems of ginsenosides for improved systemic bioavailability. J. Ginseng Res. 2018, 42, 361–369. [Google Scholar] [CrossRef]
- Won, H.-J.; Kim, H.I.; Park, T.; Kim, H.; Jo, K.; Jeon, H.; Ha, S.J.; Hyun, J.M.; Jeong, A.; Kim, J.S.; et al. Non-clinical pharmacokinetic behavior of ginsenosides. J. Ginseng Res. 2018, 43, 354–360. [Google Scholar] [CrossRef]
- Rosario, E.R.; Chang, L.; Head, E.H.; Stanczyk, F.Z.; Pike, C.J. Brain levels of sex steroid hormones in men and women during normal aging and in Alzheimer’s disease. Neurobiol. Aging. 2011, 32, 604–613. [Google Scholar] [CrossRef] [Green Version]
- Calabrese, E.J. Hormesis and ginseng: Ginseng mixtures and individual constituents commonly display hormesis dose re-sponses, especially for nNeuroprotective effects. Molecules 2020, 25, 2719. [Google Scholar] [CrossRef]
- Liu, M.-Y.; Liu, F.; Gao, Y.-L.; Yin, J.-N.; Yan, W.-Q.; Liu, J.-G.; Li, H.-J. Pharmacological activities of ginsenoside Rg5 (Review). Exp. Ther. Med. 2021, 22, 1–9. [Google Scholar] [CrossRef]
- Zhu, Y.; Zhu, C.; Yang, H.; Deng, J.; Fan, D. Protective effect of ginsenoside Rg5 against kidney injury via inhibition of NLRP3 inflammasome activation and the MAPK signaling pathway in high-fat diet/streptozotocin-induced diabetic mice. Pharmacol. Res. 2020, 155, 104746. [Google Scholar] [CrossRef]
- Kim, E.-J.; Jung, I.-H.; Van Le, T.K.; Jeong, J.-J.; Kim, N.-J.; Kim, D.-H. Ginsenosides Rg5 and Rh3 protect scopolamine-induced memory deficits in mice. J. Ethnopharmacol. 2013, 146, 294–299. [Google Scholar] [CrossRef] [PubMed]
- Chu, S.; Gu, J.; Feng, L.; Liu, J.; Zhang, M.; Jia, X.; Liu, M.; Yao, D. Ginsenoside Rg5 improves cognitive dysfunction and be-ta-amyloid deposition in STZ-induced memory impaired rats via attenuating neuroinflammatory responses. Int. Immunopharmacol. 2014, 19, 317–326. [Google Scholar] [CrossRef] [PubMed]
- Xiao, N.; Yang, L.-L.; Yang, Y.-L.; Liu, L.-W.; Li, J.; Liu, B.; Liu, K.; Qi, L.-W.; Li, P. Ginsenoside Rg5 Inhibits Succinate-Associated Lipolysis in Adipose Tissue and Prevents Muscle Insulin Resistance. Front. Pharmacol. 2017, 8, 43. [Google Scholar] [CrossRef] [Green Version]
- Farzam, K.; Abdullah, M. Acetazolamide. In StatPearls; StatPearls Publishing: Treasure Island, FL, USA, 2021. [Google Scholar]
- Kountz, D.S.; Goldman, A.; Mikhail, J.; Ezer, M. Chlorthalidone: The Forgotten Diuretic. Postgrad. Med. 2012, 124, 60–66. [Google Scholar] [CrossRef] [PubMed]
- Mattson, M.P.; Meffert, M.K. Roles for NF-kappaB in nerve cell survival, plasticity, and disease. Cell Death Differ. 2006, 13, 852–860. [Google Scholar] [CrossRef] [Green Version]
- Stranahan, A.M.; Mattson, M.P. Recruiting adaptive cellular stress responses for successful brain ageing. Nat. Rev. Neurosci. 2012, 13, 209–216. [Google Scholar] [CrossRef] [Green Version]
- Jha, N.K.; Jha, S.K.; Kar, R.; Nand, P.; Swati, K.; Goswami, V.K. Nuclear factor-kappa β as a therapeutic target for Alzheimer’s disease. J. Neurochem. 2019, 150, 113–137. [Google Scholar] [CrossRef] [Green Version]
- Mattson, M.P.; Cheng, A. Neurohormetic phytochemicals: Low-dose toxins that induce adaptive neuronal stress responses. Trends Neurosci. 2006, 29, 632–639. [Google Scholar] [CrossRef]
- Mattson, M.P.; Son, T.G.; Camandola, S. Viewpoint: Mechanisms of action and therapeutic potential of neurohormetic phy-tochemicals. Dose Response 2007, 5, 174–186. [Google Scholar] [CrossRef]
- Mattson, M.P. Hormesis and disease resistance: Activation of cellular stress response pathways. Hum. Exp. Toxicol. 2008, 27, 155–162. [Google Scholar] [CrossRef] [PubMed]
- Panossian, A.G.; Efferth, T.; Shikov, A.N.; Pozharitskaya, O.N.; Kuchta, K.; Mukherjee, P.K.; Banerjee, S.; Heinrich, M.; Wu, W.; Guo, D.; et al. Evolution of the adaptogenic concept from traditional use to medical systems: Pharmacology of stress- and aging-related diseases. Med. Res. Rev. 2020, 41, 630–703. [Google Scholar] [CrossRef]
- Seo, E.J.; Klauck, S.M.; Efferth, T.; Panossian, A. Adaptogens in chemobrain (Part I): Plant extracts attenuate cancer chemo-therapy-induced cognitive impairment—Transcriptome-wide microarray profiles of neuroglia cells. Phytomedicine 2019, 55, 80–91. [Google Scholar] [CrossRef]
- Panossian, A.; Seo, E.-J.; Klauck, S.M.; Efferth, T. Adaptogens in chemobrain (part IV): Adaptogenic plants prevent the chemotherapeutics-induced imbalance of redox homeostasis by modulation of expression of genes encoding Nrf2-mediated signaling proteins and antioxidant, metabolizing, detoxifying enzymes in neuroglia cells. Longhua Chin. Med. 2020, 3, 4. [Google Scholar] [CrossRef]
- Krämer, A.; Green, J.; Pollard, J., Jr.; Tugendreich, S. Causal analysis approaches in Ingenuity Pathway Analysis. Bioinformatics 2014, 30, 523–530. [Google Scholar] [CrossRef] [PubMed]
- Abatangelo, L.; Maglietta, R.; Distaso, A.; D’Addabbo, A.; Creanza, T.M.; Mukherjee, S.; Ancona, N. Comparative study of gene set enrichment methods. BMC Bioinform. 2009, 10, 275. [Google Scholar] [CrossRef] [Green Version]
- Ihnatova, I.; Popovici, V.; Budinska, E. A critical comparison of topology-based pathway analysis methods. PLoS ONE 2018, 13, e0191154. [Google Scholar] [CrossRef] [Green Version]
- Fakhry, C.T.; Choudhary, P.; Gutteridge, A.; Sidders, B.; Chen, P.; Ziemek, D.; Zarringhalam, K. Interpreting transcriptional changes using causal graphs: New methods and their practical utility on public networks. BMC Bioinform. 2016, 17, 1–15. [Google Scholar] [CrossRef] [Green Version]
- Chindelevitch, L.; Ziemek, D.; Enayetallah, A.; Randhawa, R.; Sidders, B.; Brockel, C.; Huang, E.S. Causal reasoning on bio-logical networks: Interpreting transcriptional changes. Bioinformatics 2012, 28, 1114–1121. [Google Scholar] [CrossRef] [PubMed]


| Sample Name | Rg5 Concentration | Molecules of Rg5 per Cells, Ratio | Number of Deregulated Genes | Number of Deregulated Genes Unique Only in Selected Conc. | Fold Changes of the Only Gene, Ca6, Which is Deregulated in All Conc. |
|---|---|---|---|---|---|
| S2 | 10−4 M | 1 2 × 10¹¹ | 1670 | 1215 | 731 |
| S3 | 10−6 M | 1 2 × 10⁹ | 280 | 120 | −306 |
| S4 | 10−9 M | 1 2 × 10⁶ | 328 | 122 | −286 |
| S5 | 10−12 M | 1 2 × 10³ | 380 | 163 | −274 |
| S6 | 10−15 M | 1 2 | 471 | 252 | −281 |
| S7 | 10−17 M | 2:102 | 343 | 159 | −293 |
| S8 | 10−18 M | 2:103 | 422 | 178 | −313 |
| Concentration of Rg5, M | 10−4 | 10−6 | 10−9 | 10−12 | 10−15 | 10−17 | 10−18 | |
|---|---|---|---|---|---|---|---|---|
| No. of matching genes | 23 | 5 | 2 | 6 | 5 | 4 | 8 | |
| Amyloid-β plaque accumulation | disease | + | 0 | − | − | 0 | + | − |
| Astrogliosis | disease | + | − | + | + | + | + | − |
| Aβ formation/generation | disease | + | − | + | + | + | + | + |
| Blood-brain barrier disruption | disease | + | − | +/− | + | + | + | − |
| Major depression | disease | + | − | + | + | + | + | − |
| Oxidative stress | disease | + | − | − | + | − | + | − |
| Neuron’s damage | disease | + | − | + | + | + | + | − |
| Neuron’s survival | process | − | − | + | + | + | + | + |
| Neuron’s apoptosis | process | + | 0 | − | − + | + | + | + − |
| Th1 cell recruitment | process | − | + | − | − | − | − | + |
| T cell recruitment | process | + | 0 | − | + | + | + | − |
| GABAergic neuron density | process | + | − | + | + | + | + | − |
| Amyloid-β precursor protein | protein | + | 0 | − | − | 0 | + | − |
| Concentration of Rg5, M | 10−4 | 10−6 | 10−9 | 10−12 | 10−15 | 10−17 | 10−18 | |
|---|---|---|---|---|---|---|---|---|
| No. of matching genes | 43 | 10 | 5 | 8 | 9 | 3 | 8 | |
| Cell division cycle | function | − | + | + | + | + | + | + |
| Cellular senescence | function | + | − | − | − | − | − | − |
| Concentration of Rg5, M | 10−4 | 10−6 | 10−9 | 10−12 | 10−15 | 10−17 | 10−18 | |
|---|---|---|---|---|---|---|---|---|
| No. of matching genes | 32 | 3 | 8 | 5 | 9 | 8 | 9 | |
| Cardio-protection | disease | + | 0 | − | − | − | − | − |
| ER stress response | function | + | 0 | − | − | − | − | − |
| Uptake of D-glucose | function | − | 0 | + | + | + | + | + |
| Vascularization | function | − | 0 | − | − | 0 | 0 | + |
| Assembly of stress granule | function | − | 0 | − | − | 0 | 0 | − |
| Translation/protein elongation | function | − | − | − | − | + | − | − |
| Concentration of Rg5, M | 10−4 | 10−6 | 10−9 | 10−12 | 10−15 | 10−17 | 10−18 | |
|---|---|---|---|---|---|---|---|---|
| No. of matching genes | 56 | 5 | 13 | 8 | 10 | 1 | 11 | |
| Atrophy of muscle | disease | + | + | − | − | − | 0 | + |
| Breast cancer cell line tumorigenesis | disease | 0 | − | + | 0 | − | 0 | + |
| Metastasis | disease | + | 0 | − | 0 | − | 0 | 0 |
| Oxidative stress | disease | + | 0 | 0 | 0 | 0 | 0 | + |
| Tumor cell proliferation | disease | 0 | − | + | 0 | − | 0 | +0 |
| Angiogenesis | function | 0 | − | + | + | − | 0 | + |
| Apoptosis | function | + | + | − | − | − | 0 | + |
| Cell proliferation | function | − | − | + | 0 | − | 0 | + |
| Coronary vessel relaxation | function | − | 0 | − | + | 0 | 0 | + |
| Neuroprotection | function | + | − | + | + | + | + | + |
| Survival of cells | function | + | − | + | + | + | + | 0 |
| Synapse maturation | function | − | + | + | − | − | 0 | + |
| Concentration of Rg5, M | 10−4 | 10−6 | 10−9 | 10−12 | 10−15 | 10−17 | 10−18 | |
|---|---|---|---|---|---|---|---|---|
| No. of matching genes | 8 | 0 | 0 | 5 | 5 | 2 | 2 | |
| Apoptosis | function | − | 0 | 0 | − | − | − | − |
| Cell shrinkage | function | − | 0 | 0 | − | − | − | + |
| Chromatin condensation | function | − | 0 | 0 | − | − | − | − |
| DNA fragmentation | function | − | 0 | 0 | − | − | − | − |
| DNA repair | function | + | 0 | 0 | + | + | + | + |
| Concentration of Rg5, M | 10−4 | 10−6 | 10−9 | 10−12 | 10−15 | 10−17 | 10−18 | |
|---|---|---|---|---|---|---|---|---|
| No. of matching genes | 29 | 5 | 2 | 4 | 7 | 4 | 5 | |
| Apoptosis of tumor cells | Disease | − + | ++ | 0 | − − | − − | − + | − + |
| Viability of tumor cells | function | + | − | 0 | + | + | + | + |
| Survival of tumor cells | disease | + | − | 0 | + | + | + | + |
| Proliferation of tumor cells | disease | − | − | 0 | + | + | + | + |
| Metastasis | disease | + | − | 0 | + | + | + | + |
| Tumor cell invasion | disease | − | − | 0 | + | + | + | + |
| Concentration Rg5, M | 10−4 | 10−6 | 10−9 | 10−12 | 10−15 | 10−17 | 10−18 | |
|---|---|---|---|---|---|---|---|---|
| No. of matching genes | 9 | 4 | 1 | 2 | 6 | 1 | 3 | |
| Cancer cell proliferation | disease | + | − | − | 0 | + | + | + |
| T-cell exhaustion | disease | + | + | 0 | − | − | 0 | + |
| Effector function of T cells | function | − | − | 0 | + | + | 0 | − |
| T-cell apoptosis | function | − | + | 0 | 0 | − | − | + |
| T-cell proliferation | function | − | − | 0 | + | + | 0 | 0 |
| T-cell activation | function | − | − | 0 | + | + | 0 | − |
| Tr1 cell specialization | function | + | + | 0 | − | − | 0 | + |
Publisher’s Note: MDPI stays neutral with regard to jurisdictional claims in published maps and institutional affiliations. |
© 2021 by the authors. Licensee MDPI, Basel, Switzerland. This article is an open access article distributed under the terms and conditions of the Creative Commons Attribution (CC BY) license (https://creativecommons.org/licenses/by/4.0/).
Share and Cite
Panossian, A.; Abdelfatah, S.; Efferth, T. Network Pharmacology of Red Ginseng (Part I): Effects of Ginsenoside Rg5 at Physiological and Sub-Physiological Concentrations. Pharmaceuticals 2021, 14, 999. https://doi.org/10.3390/ph14100999
Panossian A, Abdelfatah S, Efferth T. Network Pharmacology of Red Ginseng (Part I): Effects of Ginsenoside Rg5 at Physiological and Sub-Physiological Concentrations. Pharmaceuticals. 2021; 14(10):999. https://doi.org/10.3390/ph14100999
Chicago/Turabian StylePanossian, Alexander, Sara Abdelfatah, and Thomas Efferth. 2021. "Network Pharmacology of Red Ginseng (Part I): Effects of Ginsenoside Rg5 at Physiological and Sub-Physiological Concentrations" Pharmaceuticals 14, no. 10: 999. https://doi.org/10.3390/ph14100999
APA StylePanossian, A., Abdelfatah, S., & Efferth, T. (2021). Network Pharmacology of Red Ginseng (Part I): Effects of Ginsenoside Rg5 at Physiological and Sub-Physiological Concentrations. Pharmaceuticals, 14(10), 999. https://doi.org/10.3390/ph14100999