
Pharmacometabolomics by NMR in Oncology: A Systematic Review

 , and
, and
Abstract
1. Introduction
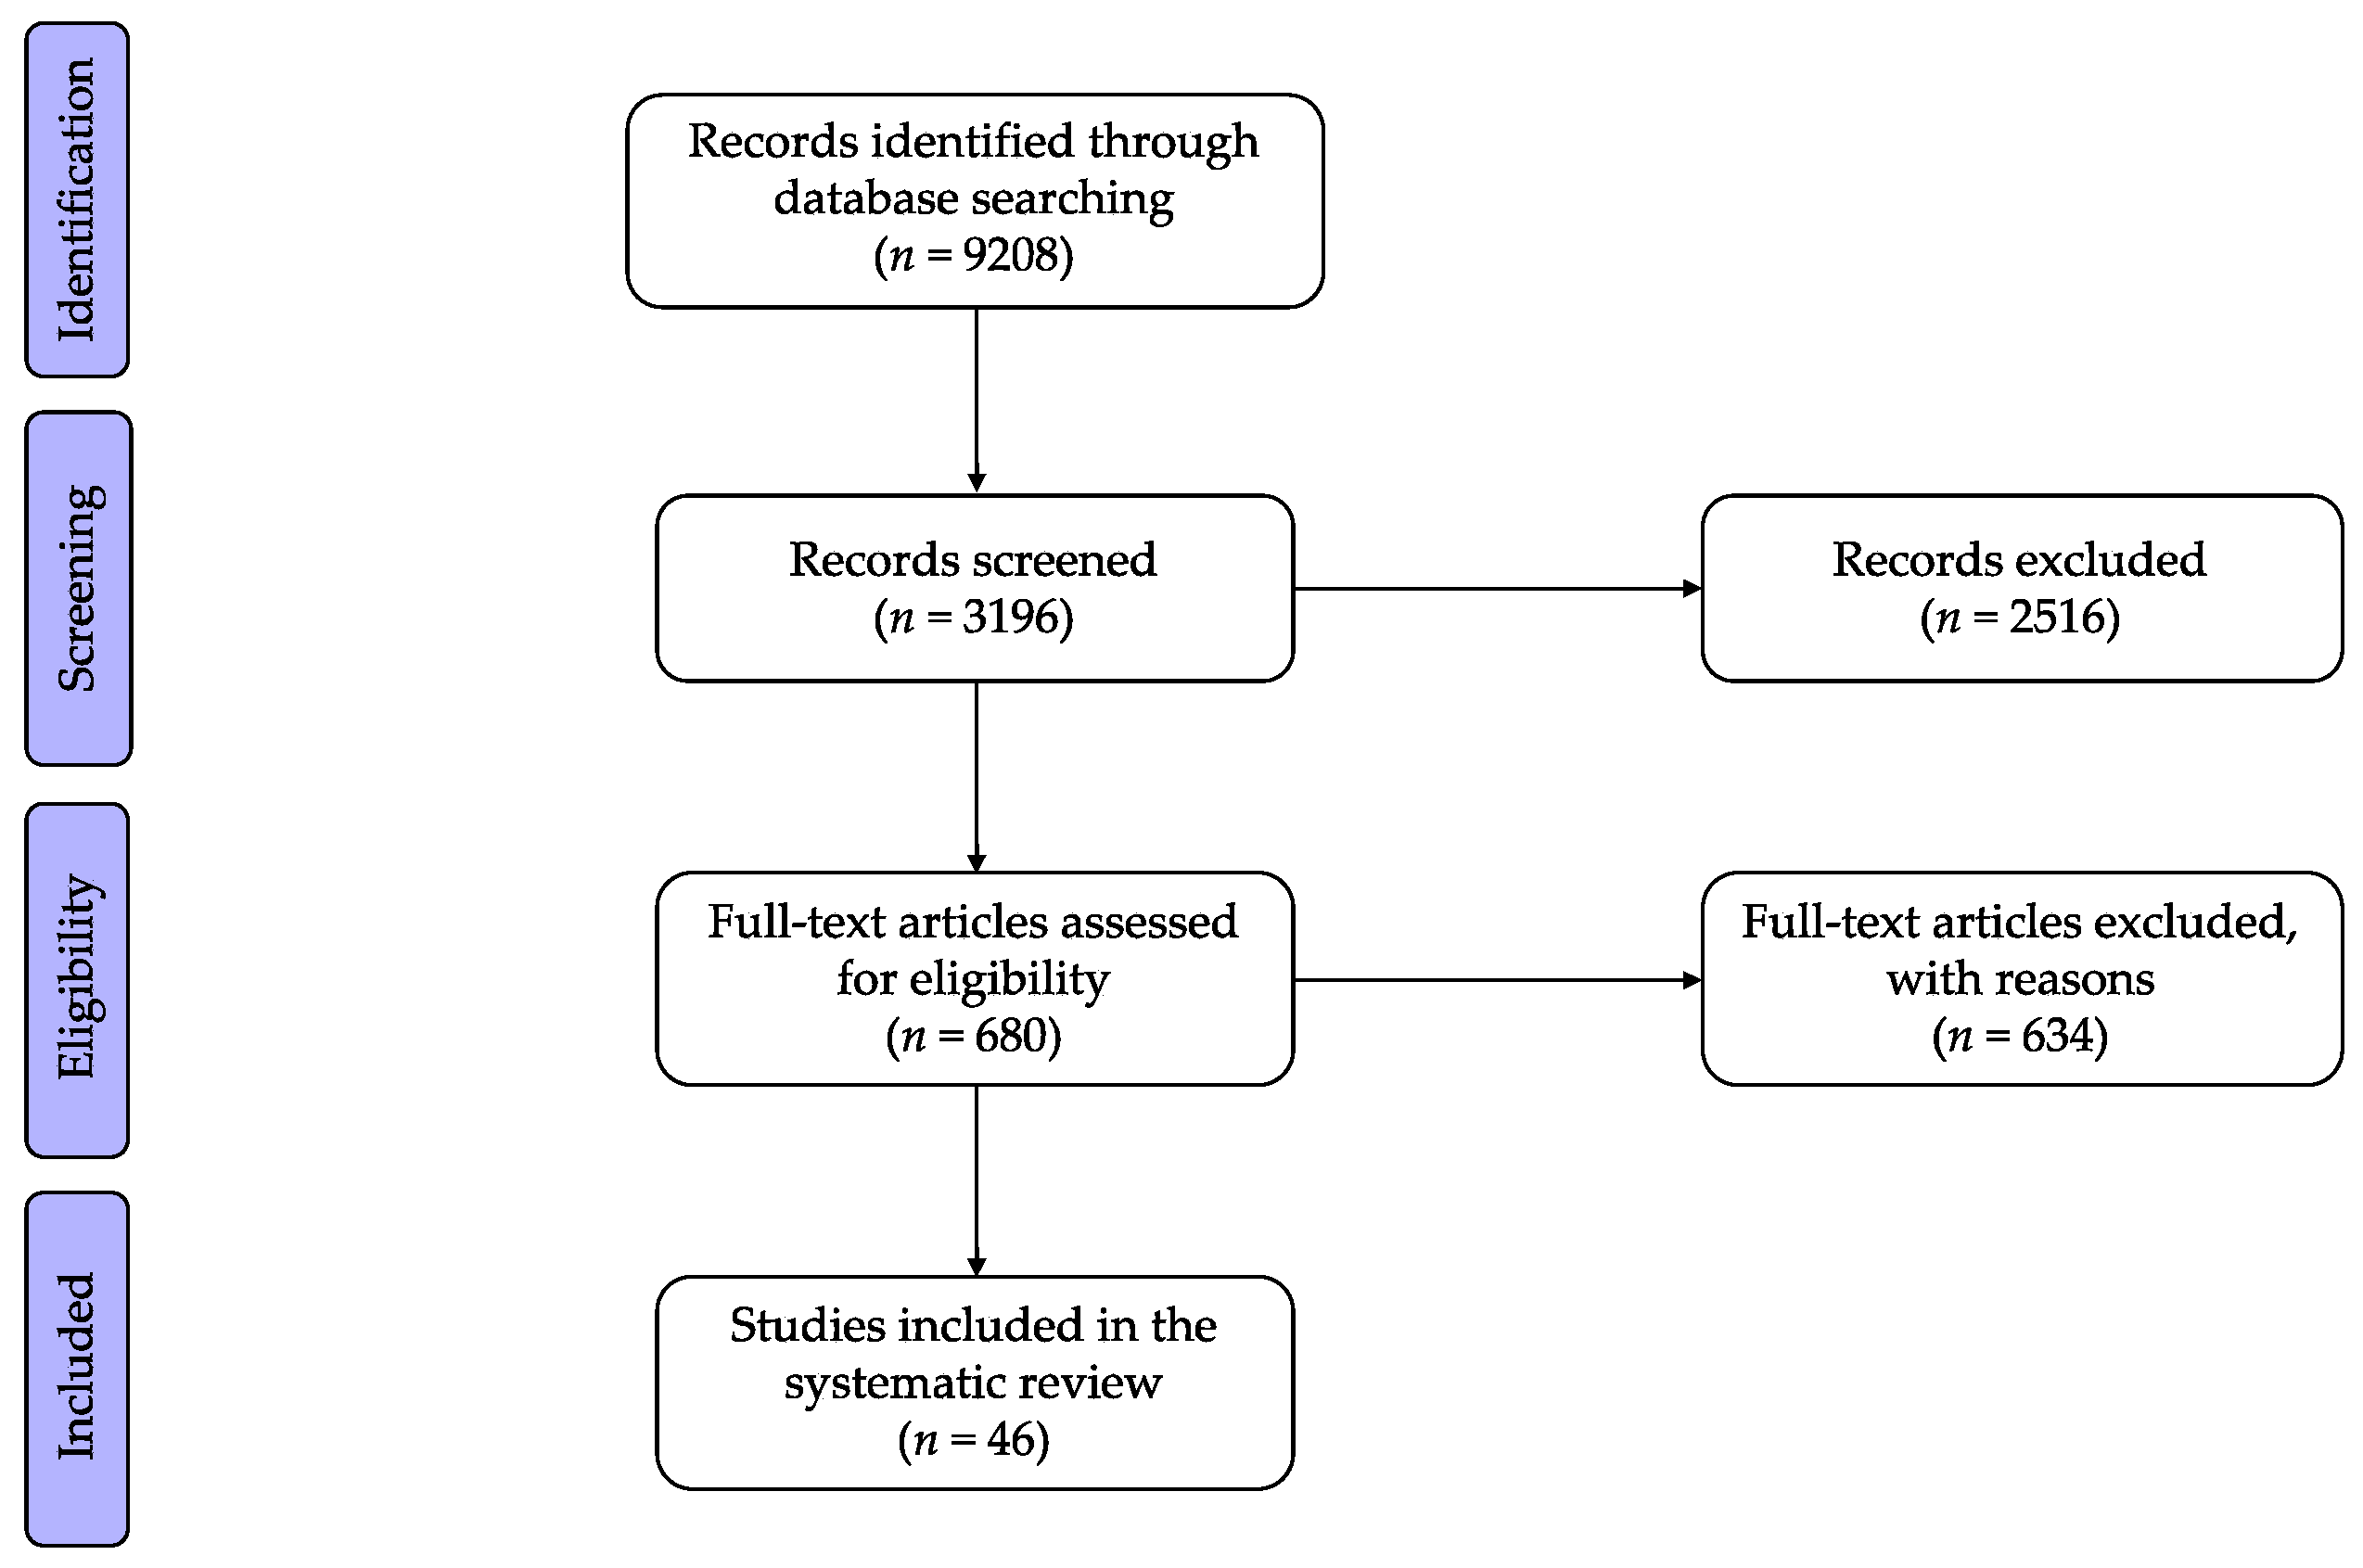
2. Methods
2.1. Search Strategy
2.2. Selection Criteria
2.3. Data Extraction
3. Results
3.1. Study Characteristics
3.1.1. Sample Collection
3.1.2. Study Design
3.1.3. NMR Sample Preparation
3.1.4. NMR Spectra Acquisition
3.1.5. NMR Data Processing
3.1.6. Metabolite Assignment
3.1.7. Statistical Analysis
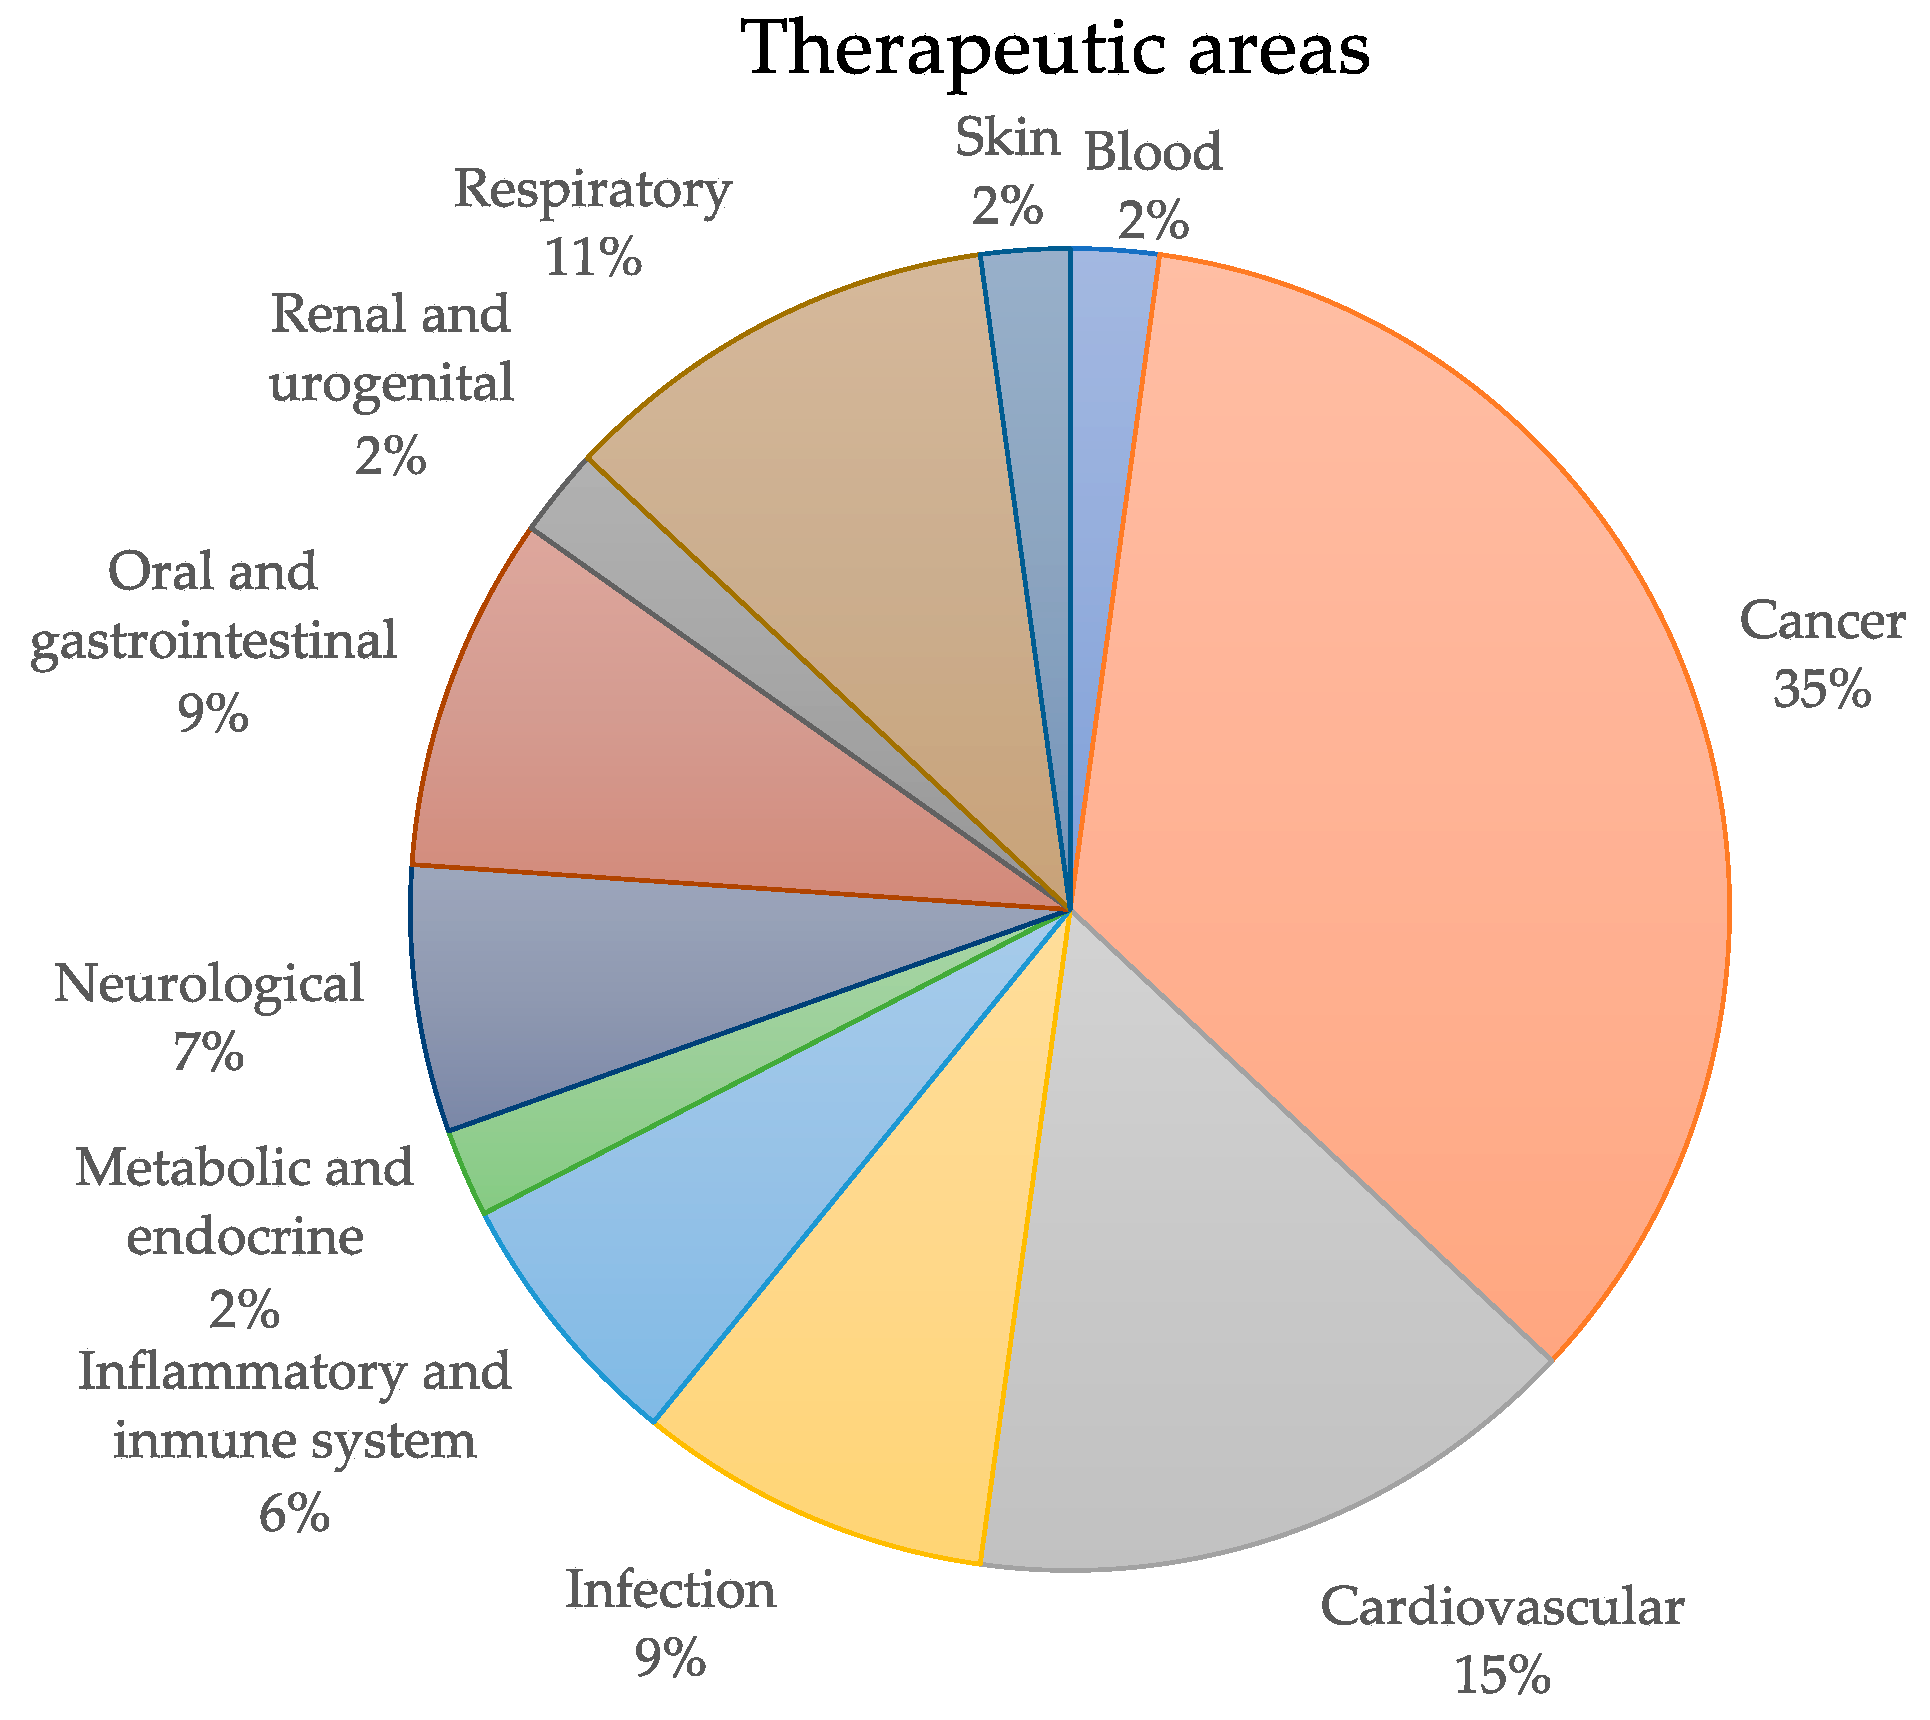
3.2. Therapeutic Areas and Treatments
3.3. Clinical Applications in Oncology
3.3.1. Breast Cancer
3.3.2. Pancreatic Cancer
3.3.3. Head and Neck Squamous Cell Carcinoma
3.3.4. Non-Small-Cell Lung Cancer
3.3.5. Prostate Cancer
3.3.6. Hodgkin and Non-Hodgkin Lymphoma
3.3.7. Hepatocellular Carcinoma
3.3.8. Multiple Myeloma
4. Conclusions and Future Perspective
Author Contributions
Funding
Institutional Review Board Statement
Informed Consent Statement
Data Availability Statement
Conflicts of Interest
References
- Spear, B.B.; Heath-Chiozzi, M.; Huff, J. Clinical Application of Pharmacogenetics. Trends Mol. Med. 2001, 7, 201–204. [Google Scholar] [CrossRef]
- Pagliarulo, V.; Datar, R.H.; Cote, R.J. Role of Genetic and Expression Profiling in Pharmacogenomics: The Changing Face of Patient Management. Curr. Issues Mol. Biol. 2002, 4, 101–110. [Google Scholar]
- Wilkinson, G.R. Drug Metabolism and Variability among Patients in Drug Response. N. Engl. J. Med. 2005, 352, 2211–2221. [Google Scholar] [CrossRef] [PubMed]
- Pirmohamed, M. Pharmacogenetics and Pharmacogenomics. Br. J. Clin. Pharmacol. 2001, 52, 345–347. [Google Scholar] [CrossRef]
- Daly, A.K. Genome-Wide Association Studies in Pharmacogenomics. Nat. Rev. Genet. 2010, 11, 241–246. [Google Scholar] [CrossRef] [PubMed]
- Roden, D.M.; Wilke, R.A.; Kroemer, H.K.; Stein, C.M. Pharmacogenomics: The Genetics of Variable Drug Responses. Circulation 2011, 123, 1661–1670. [Google Scholar] [CrossRef] [PubMed]
- Karczewski, K.J.; Daneshjou, R.; Altman, R.B. Chapter 7: Pharmacogenomics. PLoS Comput. Biol. 2012, 8, e1002817. [Google Scholar] [CrossRef] [PubMed]
- Ventola, C.L. Role of Pharmacogenomic Biomarkers in Predicting and Improving Drug Response: Part 1: The Clinical Significance of Pharmacogenetic Variants. Pharm. Ther. 2013, 38, 545–560. [Google Scholar]
- Ma, J.D.; Lee, K.C.; Kuo, G.M. Clinical Application of Pharmacogenomics. J. Pharm. Pract. 2012, 25, 417–427. [Google Scholar] [CrossRef]
- Ni, X.; Zhang, W.; Huang, R.S. Pharmacogenomics Discovery and Implementation in Genome-Wide Association Studies Era. Wiley Interdiscip. Rev. Syst. Biol. Med. 2013, 5, 1–9. [Google Scholar] [CrossRef]
- Nebert, D.W.; Jorge-Nebert, L.; Vesell, E.S. Pharmacogenomics and “Individualized Drug Therapy”: High Expectations and Disappointing Achievements. Am. J. Pharm. 2003, 3, 361–370. [Google Scholar] [CrossRef]
- Van Aken, J.; Schmedders, M.; Feuerstein, G.; Kollek, R. Prospects and Limits of Pharmacogenetics: The Thiopurine Methyl Transferase (TPMT) Experience. Am. J. Pharm. 2003, 3, 149–155. [Google Scholar] [CrossRef]
- Beger, R.D.; Schmidt, M.A.; Kaddurah-Daouk, R. Current Concepts in Pharmacometabolomics, Biomarker Discovery, and Precision Medicine. Metabolites 2020, 10, 129. [Google Scholar] [CrossRef]
- Andrew Clayton, T.; Lindon, J.C.; Cloarec, O.; Antti, H.; Charuel, C.; Hanton, G.; Provost, J.-P.; Le Net, J.-L.; Baker, D.; Walley, R.J.; et al. Pharmaco-Metabonomic Phenotyping and Personalized Drug Treatment. Nature 2006, 440, 1073–1077. [Google Scholar] [CrossRef]
- Holmes, E.; Wilson, I.D.; Nicholson, J.K. Metabolic Phenotyping in Health and Disease. Cell 2008, 134, 714–717. [Google Scholar] [CrossRef]
- Ellero-Simatos, S.; Lewis, J.P.; Georgiades, A.; Yerges-Armstrong, L.M.; Beitelshees, A.L.; Horenstein, R.B.; Dane, A.; Harms, A.C.; Ramaker, R.; Vreeken, R.J.; et al. Pharmacometabolomics Reveals That Serotonin Is Implicated in Aspirin Response Variability. CPT Pharmacomet. Syst. Pharmacol. 2014, 3, e125. [Google Scholar] [CrossRef]
- Kaddurah-Daouk, R.; Weinshilboum, R.; Pharmacometabolomics Research Network. Metabolomic Signatures for Drug Response Phenotypes: Pharmacometabolomics Enables Precision Medicine. Clin. Pharmacol. Ther. 2015, 98, 71–75. [Google Scholar] [CrossRef]
- Clayton, T.A.; Baker, D.; Lindon, J.C.; Everett, J.R.; Nicholson, J.K. Pharmacometabonomic Identification of a Significant Host-Microbiome Metabolic Interaction Affecting Human Drug Metabolism. Proc. Natl. Acad. Sci. USA 2009, 106, 14728–14733. [Google Scholar] [CrossRef] [PubMed]
- Nicholson, J.K.; Wilson, I.D.; Lindon, J.C. Pharmacometabonomics as an Effector for Personalized Medicine. Pharmacogenomics 2011, 12, 103–111. [Google Scholar] [CrossRef] [PubMed]
- Everett, J.R.; Loo, R.L.; Pullen, F.S. Pharmacometabonomics and Personalized Medicine. Ann. Clin. Biochem. 2013, 50, 523–545. [Google Scholar] [CrossRef] [PubMed]
- Emwas, A.-H.; Roy, R.; McKay, R.T.; Tenori, L.; Saccenti, E.; Gowda, G.A.N.; Raftery, D.; Alahmari, F.; Jaremko, L.; Jaremko, M.; et al. NMR Spectroscopy for Metabolomics Research. Metabolites 2019, 9, 123. [Google Scholar] [CrossRef]
- Institute of Medicine (US) Committee on Standards for Systematic Reviews of Comparative Effectiveness Research. Finding What Works in Health Care: Standards for Systematic Reviews; Eden, J., Levit, L., Berg, A., Morton, S., Eds.; National Academies Press: Washington, DC, USA, 2011; ISBN 978-0-309-16425-2. [Google Scholar]
- Botticelli, A.; Vernocchi, P.; Marini, F.; Quagliariello, A.; Cerbelli, B.; Reddel, S.; del Chierico, F.; di Pietro, F.; Giusti, R.; Tomassini, A.; et al. Gut Metabolomics Profiling of Non-Small Cell Lung Cancer (NSCLC) Patients under Immunotherapy Treatment. J. Transl. Med. 2020, 18, 49. [Google Scholar] [CrossRef] [PubMed]
- Zidi, O.; Souai, N.; Raies, H.; Ben Ayed, F.; Mezlini, A.; Mezrioui, S.; Tranchida, F.; Sabatier, J.-M.; Mosbah, A.; Cherif, A.; et al. Fecal Metabolic Profiling of Breast Cancer Patients during Neoadjuvant Chemotherapy Reveals Potential Biomarkers. Molecules 2021, 26, 2266. [Google Scholar] [CrossRef] [PubMed]
- Cano, K.E.; Li, L.; Bhatia, S.; Bhatia, R.; Forman, S.J.; Chen, Y. NMR-Based Metabolomic Analysis of the Molecular Pathogenesis of Therapy-Related Myelodysplasia/Acute Myeloid Leukemia. J. Proteome Res. 2011, 10, 2873–2881. [Google Scholar] [CrossRef] [PubMed]
- Gebregiworgis, T.; Bhinderwala, F.; Purohit, V.; Chaika, N.V.; Singh, P.K.; Powers, R. Insights into Gemcitabine Resistance and the Potential for Therapeutic Monitoring. Metabolomics 2018, 14, 156. [Google Scholar] [CrossRef] [PubMed]
- Romano, F.; Meoni, G.; Manavella, V.; Baima, G.; Mariani, G.M.; Cacciatore, S.; Tenori, L.; Aimetti, M. Effect of Non-Surgical Periodontal Therapy on Salivary Metabolic Fingerprint of Generalized Chronic Periodontitis Using Nuclear Magnetic Resonance Spectroscopy. Arch. Oral Biol. 2019, 97, 208–214. [Google Scholar] [CrossRef]
- Chaudhari, U.; Ellis, J.K.; Wagh, V.; Nemade, H.; Hescheler, J.; Keun, H.C.; Sachinidis, A. Metabolite Signatures of Doxorubicin Induced Toxicity in Human Induced Pluripotent Stem Cell-Derived Cardiomyocytes. Amino Acids 2017, 49, 1955–1963. [Google Scholar] [CrossRef] [PubMed]
- Madhu, B.; Shaw, G.L.; Warren, A.Y.; Neal, D.E.; Griffiths, J.R. Response of Degarelix Treatment in Human Prostate Cancer Monitored by HR-MAS 1H NMR Spectroscopy. Metabolomics 2016, 12, 120. [Google Scholar] [CrossRef]
- Johnson, C.H.; Ivanisevic, J.; Siuzdak, G. Metabolomics: Beyond Biomarkers and towards Mechanisms. Nat. Rev. Mol. Cell Biol. 2016, 17, 451–459. [Google Scholar] [CrossRef]
- Beckonert, O.; Keun, H.C.; Ebbels, T.M.D.; Bundy, J.; Holmes, E.; Lindon, J.C.; Nicholson, J.K. Metabolic Profiling, Metabolomic and Metabonomic Procedures for NMR Spectroscopy of Urine, Plasma, Serum and Tissue Extracts. Nat. Protoc. 2007, 2, 2692–2703. [Google Scholar] [CrossRef]
- Ghini, V.; Quaglio, D.; Luchinat, C.; Turano, P. NMR for Sample Quality Assessment in Metabolomics. New Biotechnol. 2019, 52, 25–34. [Google Scholar] [CrossRef] [PubMed]
- Karpyak, V.M. Pharmacogenomics and Pharmacometabolomics of Acamprosate Treatment Outcome. Available online: https://clinicaltrials.gov (accessed on 17 June 2021).
- Artacho, A.; Isaac, S.; Nayak, R.; Flor-Duro, A.; Alexander, M.; Koo, I.; Manasson, J.; Smith, P.B.; Rosenthal, P.; Homsi, Y.; et al. The Pretreatment Gut Microbiome Is Associated with Lack of Response to Methotrexate in New-Onset Rheumatoid Arthritis. Arthritis Rheumatol. 2021, 73, 931–942. [Google Scholar] [CrossRef] [PubMed]
- Gu, J.; Huang, C.; Hu, X.; Xia, J.; Shao, W.; Lin, D. Nuclear Magnetic Resonance-Based Tissue Metabolomic Analysis Clarifies Molecular Mechanisms of Gastric Carcinogenesis. Cancer Sci. 2020, 111, 3195–3209. [Google Scholar] [CrossRef] [PubMed]
- Chung, Y.-H.; Tsai, C.-K.; Yu, C.-F.; Wang, W.-L.; Yang, C.-L.; Hong, J.-H.; Yen, T.-C.; Chen, F.-H.; Lin, G. Radiation-Induced Metabolic Shifts in the Hepatic Parenchyma: Findings from 18F-FDG PET Imaging and Tissue NMR Metabolomics in a Mouse Model for Hepatocellular Carcinoma. Molecules 2021, 26, 2573. [Google Scholar] [CrossRef] [PubMed]
- Khattri, R.B.; Thome, T.; Ryan, T.E. Tissue-Specific 1H-NMR Metabolomic Profiling in Mice with Adenine-Induced Chronic Kidney Disease. Metabolites 2021, 11, 45. [Google Scholar] [CrossRef] [PubMed]
- Puskarich, M.A.; Finkel, M.A.; Karnovsky, A.; Jones, A.E.; Trexel, J.; Harris, B.N.; Stringer, K.A. Pharmacometabolomics of L-Carnitine Treatment Response Phenotypes in Patients with Septic Shock. Ann. Am. Thorac. Soc. 2015, 12, 46–56. [Google Scholar] [CrossRef]
- Park, Y.; Jones, D.P.; Ziegler, T.R.; Lee, K.; Kotha, K.; Yu, T.; Martin, G.S. Metabolic Effects of Albumin Therapy in Acute Lung Injury Measured by Proton Nuclear Magnetic Resonance Spectroscopy of Plasma: A Pilot Study. Crit. Care Med. 2011, 39, 2308–2313. [Google Scholar] [CrossRef] [PubMed]
- Gooding, J.R.; Agrawal, S.; McRitchie, S.; Acuff, Z.; Merchant, M.L.; Klein, J.B.; Smoyer, W.E.; Sumner, S.J.; The Midwest Pediatric Nephrology Consortium. Predicting and Defining Steroid Resistance in Pediatric Nephrotic Syndrome Using Plasma Metabolomics. Kidney Int. Rep. 2020, 5, 81–93. [Google Scholar] [CrossRef]
- Wei, S.; Liu, L.; Zhang, J.; Bowers, J.; Gowda, G.A.N.; Seeger, H.; Fehm, T.; Neubauer, H.J.; Vogel, U.; Clare, S.E.; et al. Metabolomics Approach for Predicting Response to Neoadjuvant Chemotherapy for Breast Cancer. Mol. Oncol. 2013, 7, 297–307. [Google Scholar] [CrossRef] [PubMed]
- Kapoor, S.R.; Filer, A.; Fitzpatrick, M.A.; Fisher, B.A.; Taylor, P.C.; Buckley, C.D.; McInnes, I.B.; Raza, K.; Young, S.P. Metabolic Profiling Predicts Response to Anti-Tumor Necrosis Factor α Therapy in Patients with Rheumatoid Arthritis. Arthritis Rheum. 2013, 65, 1448–1456. [Google Scholar] [CrossRef]
- Puchades-Carrasco, L.; Lecumberri, R.; Martínez-López, J.; Lahuerta, J.-J.; Mateos, M.-V.; Prósper, F.; San-Miguel, J.F.; Pineda-Lucena, A. Multiple Myeloma Patients Have a Specific Serum Metabolomic Profile That Changes after Achieving Complete Remission. Clin. Cancer Res. 2013, 19, 4770–4779. [Google Scholar] [CrossRef]
- Martin-Lorenzo, M.; Martinez, P.J.; Baldan-Martin, M.; Ruiz-Hurtado, G.; Prado, J.C.; Segura, J.; de la Cuesta, F.; Barderas, M.G.; Vivanco, F.; Ruilope, L.M.; et al. Citric Acid Metabolism in Resistant Hypertension: Underlying Mechanisms and Metabolic Prediction of Treatment Response. Hypertension 2017, 70, 1049–1056. [Google Scholar] [CrossRef]
- Rodríguez-Gallego, E.; Gómez, J.; Pacheco, Y.M.; Peraire, J.; Viladés, C.; Beltrán-Debón, R.; Mallol, R.; López-Dupla, M.; Veloso, S.; Alba, V.; et al. A Baseline Metabolomic Signature Is Associated with Immunological CD4+ T-Cell Recovery after 36 Months of Antiretroviral Therapy in HIV-Infected Patients. AIDS 2018, 32, 565–573. [Google Scholar] [CrossRef] [PubMed]
- Jiang, L.; Lee, S.C.; Ng, T.C. Pharmacometabonomics Analysis Reveals Serum Formate and Acetate Potentially Associated with Varying Response to Gemcitabine-Carboplatin Chemotherapy in Metastatic Breast Cancer Patients. J. Proteome Res. 2018, 17, 1248–1257. [Google Scholar] [CrossRef] [PubMed]
- Rodríguez-Gallego, E.; Gómez, J.; Domingo, P.; Ferrando-Martínez, S.; Peraire, J.; Viladés, C.; Veloso, S.; López-Dupla, M.; Beltrán-Debón, R.; Alba, V.; et al. Circulating Metabolomic Profile Can Predict Dyslipidemia in HIV Patients Undergoing Antiretroviral Therapy. Atherosclerosis 2018, 273, 28–36. [Google Scholar] [CrossRef]
- Debik, J.; Euceda, L.R.; Lundgren, S.; von der Lippe, G.H.; Garred, Ø.; Borgen, E.; Engebraaten, O.; Bathen, T.F.; Giskeødegård, G.F. Assessing Treatment Response and Prognosis by Serum and Tissue Metabolomics in Breast Cancer Patients. J. Proteome Res. 2019, 18, 3649–3660. [Google Scholar] [CrossRef]
- Chiang, J.-Y.; Lee, S.-H.; Chen, Y.-C.; Wu, C.-K.; Chuang, J.-Y.; Lo, S.-C.; Yeh, H.-M.; Yeh, S.-F.S.; Hsu, C.-A.; Lin, B.-B.; et al. Metabolomic Analysis of Platelets of Patients with Aspirin Non-Response. Front. Pharmacol. 2019, 10, 1107. [Google Scholar] [CrossRef]
- Murgia, F.; Muroni, A.; Puligheddu, M.; Polizzi, L.; Barberini, L.; Orofino, G.; Solla, P.; Poddighe, S.; del Carratore, F.; Griffin, J.L.; et al. Metabolomics as a Tool for the Characterization of Drug-Resistant Epilepsy. Front. Neurol. 2017, 8, 459. [Google Scholar] [CrossRef]
- Jobard, E.; Trédan, O.; Bachelot, T.; Vigneron, A.M.; Aït-Oukhatar, C.M.; Arnedos, M.; Rios, M.; Bonneterre, J.; Diéras, V.; Jimenez, M.; et al. Longitudinal Serum Metabolomics Evaluation of Trastuzumab and Everolimus Combination as Pre-Operative Treatment for HER-2 Positive Breast Cancer Patients. Oncotarget 2017, 8, 83570–83584. [Google Scholar] [CrossRef][Green Version]
- Ghini, V.; Laera, L.; Fantechi, B.; Monte, F.D.; Benelli, M.; McCartney, A.; Leonardo, T.; Luchinat, C.; Pozzessere, D. Metabolomics to Assess Response to Immune Checkpoint Inhibitors in Patients with Non-Small-Cell Lung Cancer. Cancers 2020, 12, 3574. [Google Scholar] [CrossRef]
- Meoni, G.; Ghini, V.; Maggi, L.; Vignoli, A.; Mazzoni, A.; Salvati, L.; Capone, M.; Vanni, A.; Tenori, L.; Fontanari, P.; et al. Metabolomic/Lipidomic Profiling of COVID-19 and Individual Response to Tocilizumab. PLoS Pathog. 2021, 17, e1009243. [Google Scholar] [CrossRef]
- Meiboom, S.; Gill, D. Modified Spin-Echo Method for Measuring Nuclear Relaxation Times. Rev. Sci. Instrum. 1958, 29, 688–691. [Google Scholar] [CrossRef]
- Nicholson, J.K.; Foxall, P.J.; Spraul, M.; Farrant, R.D.; Lindon, J.C. 750 MHz 1H and 1H-13C NMR Spectroscopy of Human Blood Plasma. Anal. Chem. 1995, 67, 793–811. [Google Scholar] [CrossRef]
- Nguyen, B.D.; Meng, X.; Donovan, K.J.; Shaka, A.J. SOGGY: Solvent-Optimized Double Gradient Spectroscopy for Water Suppression. A Comparison with Some Existing Techniques. J. Magn. Reson. 2007, 184, 263–274. [Google Scholar] [CrossRef]
- Hwang, T.L.; Shaka, A.J. Water Suppression That Works. Excitation Sculpting Using Arbitrary Wave-Forms and Pulsed-Field Gradients. J. Magn. Reson. Ser. A 1995, 112, 275–279. [Google Scholar] [CrossRef]
- Mckay, R.T. How the 1D-NOESY Suppresses Solvent Signal in Metabonomics NMR Spectroscopy: An Examination of the Pulse Sequence Components and Evolution. Concepts Magn. Reson. 2011, 38, 197–220. [Google Scholar] [CrossRef]
- Viant, M.R. Improved Methods for the Acquisition and Interpretation of NMR Metabolomic Data. Biochem. Biophys. Res. Commun. 2003, 310, 943–948. [Google Scholar] [CrossRef] [PubMed]
- Huo, T.; Chen, X.; Lu, X.; Qu, L.; Liu, Y.; Cai, S. An Effective Assessment of Valproate Sodium-Induced Hepatotoxicity with UPLC-MS and (1)HNMR-Based Metabonomics Approach. J. Chromatogr. B Anal. Technol. Biomed. Life Sci. 2014, 969, 109–116. [Google Scholar] [CrossRef] [PubMed]
- Bhinderwala, F.; Wase, N.; DiRusso, C.; Powers, R. Combining Mass Spectrometry and NMR Improves Metabolite Detection and Annotation. J. Proteome Res. 2018, 17, 4017–4022. [Google Scholar] [CrossRef]
- Eicher, T.; Kinnebrew, G.; Patt, A.; Spencer, K.; Ying, K.; Ma, Q.; Machiraju, R.; Mathé, E.A. Metabolomics and Multi-Omics Integration: A Survey of Computational Methods and Resources. Metabolites 2020, 10, 202. [Google Scholar] [CrossRef]
- Jendoubi, T. Approaches to Integrating Metabolomics and Multi-Omics Data: A Primer. Metabolites 2021, 11, 184. [Google Scholar] [CrossRef]
- Jacob, D.; Deborde, C.; Lefebvre, M.; Maucourt, M.; Moing, A. NMRProcFlow: A Graphical and Interactive Tool Dedicated to 1D Spectra Processing for NMR-Based Metabolomics. Metabolomics 2017, 13, 36. [Google Scholar] [CrossRef] [PubMed]
- Sousa, S.A.A.; Magalhães, A.; Ferreira, M.M.C. Optimized Bucketing for NMR Spectra: Three Case Studies. Chemom. Intell. Lab. Syst. 2013, 122, 93–102. [Google Scholar] [CrossRef]
- Lever, J.; Krzywinski, M.; Altman, N. Model Selection and Overfitting. Nat. Methods 2016, 13, 703–704. [Google Scholar] [CrossRef]
- O’Sullivan, A.; Gibney, M.J.; Connor, A.O.; Mion, B.; Kaluskar, S.; Cashman, K.D.; Flynn, A.; Shanahan, F.; Brennan, L. Biochemical and Metabolomic Phenotyping in the Identification of a Vitamin D Responsive Metabotype for Markers of the Metabolic Syndrome. Mol. Nutr. Food Res. 2011, 55, 679–690. [Google Scholar] [CrossRef] [PubMed]
- Tan, L.-C.; Yang, W.-J.; Fu, W.-P.; Su, P.; Shu, J.-K.; Dai, L.-M. 1H-NMR-Based Metabolic Profiling of Healthy Individuals and High-Resolution CT-Classified Phenotypes of COPD with Treatment of Tiotropium Bromide. Int. J. Chronic Obstruct. Pulmon. Dis. 2018, 13, 2985–2997. [Google Scholar] [CrossRef] [PubMed]
- Signoriello, E.; Iardino, P.; Casertano, S.; de Lucia, D.; Pucciarelli, A.; Puoti, G.; Chiosi, E.; Lus, G. 12-Months Prospective Pentraxin-3 and Metabolomic Evaluation in Multiple Sclerosis Patients Treated with Glatiramer Acetate. J. Neuroimmunol. 2020, 348, 577385. [Google Scholar] [CrossRef]
- Amin, A.M.; Sheau Chin, L.; Teh, C.-H.; Mostafa, H.; Mohamed Noor, D.A.; Sk Abdul Kader, M.A.; Kah Hay, Y.; Ibrahim, B. 1H NMR Based Pharmacometabolomics Analysis of Urine Identifies Metabolic Phenotype of Clopidogrel High on Treatment Platelets Reactivity in Coronary Artery Disease Patients. J. Pharm. Biomed. Anal. 2017, 146, 135–146. [Google Scholar] [CrossRef]
- Wang, Z.; Chen, Z.; Yang, S.; Wang, Y.; Yu, L.; Zhang, B.; Rao, Z.; Gao, J.; Tu, S. (1)H NMR-Based Metabolomic Analysis for Identifying Serum Biomarkers to Evaluate Methotrexate Treatment in Patients with Early Rheumatoid Arthritis. Exp. Ther. Med. 2012, 4, 165–171. [Google Scholar] [CrossRef]
- Priori, R.; Casadei, L.; Valerio, M.; Scrivo, R.; Valesini, G.; Manetti, C. 1H-NMR-Based Metabolomic Study for Identifying Serum Profiles Associated with the Response to Etanercept in Patients with Rheumatoid Arthritis. PLoS ONE 2015, 10, e0138537. [Google Scholar] [CrossRef]
- Wang, C.; Li, J.-X.; Tang, D.; Zhang, J.-Q.; Fang, L.-Z.; Fu, W.-P.; Liu, L.; Dai, L.-M. Metabolic Changes of Different High-Resolution Computed Tomography Phenotypes of COPD after Budesonide-Formoterol Treatment. Int. J. Chronic Obstruct. Pulmon. Dis. 2017, 12, 3511–3521. [Google Scholar] [CrossRef] [PubMed][Green Version]
- Amin, A.M.; Sheau Chin, L.; Teh, C.-H.; Mostafa, H.; Mohamed Noor, D.A.; Abdul Kader, M.A.S.K.; Kah Hay, Y.; Ibrahim, B. Pharmacometabolomics Analysis of Plasma to Phenotype Clopidogrel High on Treatment Platelets Reactivity in Coronary Artery Disease Patients. Eur. J. Pharm. Sci. 2018, 117, 351–361. [Google Scholar] [CrossRef] [PubMed]
- Khalid, A.; Siddiqui, A.J.; Ansari, S.H.; Musharraf, S.G. Reflection of Treatment Proficiency of Hydroxyurea Treated β-Thalassemia Serum Samples through Nuclear Magnetic Resonance Based Metabonomics. Sci. Rep. 2019, 9, 2041. [Google Scholar] [CrossRef] [PubMed]
- Wei, B.; Wang, C.; Teng, T.; Guo, P.; Chen, M.; Xia, F.; Liu, H.; Xie, J.; Feng, J.; Huang, H. Chemotherapeutic Efficacy of Cucurmosin for Pancreatic Cancer as an Alternative of Gemcitabine: A Comparative Metabolomic Study. Gland Surg. 2020, 9, 1428–1442. [Google Scholar] [CrossRef]
- Goossens, C.; Nahon, P.; le Moyec, L.; Triba, M.N.; Bouchemal, N.; Amathieu, R.; Ganne-Carrié, N.; Ziol, M.; Trinchet, J.-C.; Sellier, N.; et al. Sequential Serum Metabolomic Profiling after Radiofrequency Ablation of Hepatocellular Carcinoma Reveals Different Response Patterns According to Etiology. J. Proteome Res. 2016, 15, 1446–1454. [Google Scholar] [CrossRef]
- Bawadikji, A.A.; Teh, C.-H.; Sheikh Abdul Kader, M.A.B.; Abdul Wahab, M.J.B.; Syed Sulaiman, S.A.; Ibrahim, B. Plasma Metabolites as Predictors of Warfarin Outcome in Atrial Fibrillation. Am. J. Cardiovasc. Drugs 2020, 20, 169–177. [Google Scholar] [CrossRef]
- Kim, J.W.; Ryu, S.H.; Kim, S.; Lee, H.W.; Lim, M.; Seong, S.J.; Kim, S.; Yoon, Y.-R.; Kim, K.-B. Pattern Recognition Analysis for Hepatotoxicity Induced by Acetaminophen Using Plasma and Urinary 1H NMR-Based Metabolomics in Humans. Anal. Chem. 2013, 85, 11326–11334. [Google Scholar] [CrossRef]
- Miccheli, A.; Capuani, G.; Marini, F.; Tomassini, A.; Praticò, G.; Ceccarelli, S.; Gnani, D.; Baviera, G.; Alisi, A.; Putignani, L.; et al. Urinary (1)H-NMR-Based Metabolic Profiling of Children with NAFLD Undergoing VSL#3 Treatment. Int. J. Obes. 2015, 39, 1118–1125. [Google Scholar] [CrossRef]
- Alonso, A.; Marsal, S.; Julià, A. Analytical Methods in Untargeted Metabolomics: State of the Art in 2015. Front. Bioeng. Biotechnol. 2015, 3, 23. [Google Scholar] [CrossRef]
- Emwas, A.-H.; Saccenti, E.; Gao, X.; McKay, R.T.; dos Santos, V.A.P.M.; Roy, R.; Wishart, D.S. Recommended Strategies for Spectral Processing and Post-Processing of 1D 1H-NMR Data of Biofluids with a Particular Focus on Urine. Metabolomics 2018, 14, 31. [Google Scholar] [CrossRef]
- Craig, A.; Cloarec, O.; Holmes, E.; Nicholson, J.K.; Lindon, J.C. Scaling and Normalization Effects in NMR Spectroscopic Metabonomic Data Sets. Anal. Chem. 2006, 78, 2262–2267. [Google Scholar] [CrossRef]
- Wishart, D.S.; Tzur, D.; Knox, C.; Eisner, R.; Guo, A.C.; Young, N.; Cheng, D.; Jewell, K.; Arndt, D.; Sawhney, S.; et al. HMDB: The Human Metabolome Database. Nucleic Acids Res. 2007, 35, D521–D526. [Google Scholar] [CrossRef] [PubMed]
- Wishart, D.S.; Jewison, T.; Guo, A.C.; Wilson, M.; Knox, C.; Liu, Y.; Djoumbou, Y.; Mandal, R.; Aziat, F.; Dong, E.; et al. HMDB 3. 0—The Human Metabolome Database in Nucleic Acids Res. 2013, 41, D801–D807. [Google Scholar] [CrossRef] [PubMed]
- Cui, Q.; Lewis, I.A.; Hegeman, A.D.; Anderson, M.E.; Li, J.; Schulte, C.F.; Westler, W.M.; Eghbalnia, H.R.; Sussman, M.R.; Markley, J.L. Metabolite Identification via the Madison Metabolomics Consortium Database. Nat. Biotechnol. 2008, 26, 162–164. [Google Scholar] [CrossRef] [PubMed]
- Weljie, A.M.; Newton, J.; Mercier, P.; Carlson, E.; Slupsky, C.M. Targeted Profiling: Quantitative Analysis of 1H NMR Metabolomics Data. Anal. Chem. 2006, 78, 4430–4442. [Google Scholar] [CrossRef] [PubMed]
- Xia, J. Computational Strategies for Biological Interpretation of Metabolomics Data. Adv. Exp. Med. Biol. 2017, 965, 191–206. [Google Scholar] [CrossRef]
- Ulrich, E.L.; Akutsu, H.; Doreleijers, J.F.; Harano, Y.; Ioannidis, Y.E.; Lin, J.; Livny, M.; Mading, S.; Maziuk, D.; Miller, Z.; et al. BioMagResBank. Nucleic Acids Res. 2008, 36, D402–D408. [Google Scholar] [CrossRef]
- Yamada, S.; Ito, K.; Kurotani, A.; Yamada, Y.; Chikayama, E.; Kikuchi, J. InterSpin: Integrated Supportive Webtools for Low- and High-Field NMR Analyses Toward Molecular Complexity. ACS Omega 2019, 4, 3361–3369. [Google Scholar] [CrossRef]
- Haug, K.; Cochrane, K.; Nainala, V.C.; Williams, M.; Chang, J.; Jayaseelan, K.V.; O’Donovan, C. MetaboLights: A Resource Evolving in Response to the Needs of Its Scientific Community. Nucleic Acids Res. 2020, 48, D440–D444. [Google Scholar] [CrossRef]
- Ferry-Dumazet, H.; Gil, L.; Deborde, C.; Moing, A.; Bernillon, S.; Rolin, D.; Nikolski, M.; de Daruvar, A.; Jacob, D. MeRy-B: A Web Knowledgebase for the Storage, Visualization, Analysis and Annotation of Plant NMR Metabolomic Profiles. BMC Plant. Biol. 2011, 11, 104. [Google Scholar] [CrossRef]
- Ara, T.; Enomoto, M.; Arita, M.; Ikeda, C.; Kera, K.; Yamada, M.; Nishioka, T.; Ikeda, T.; Nihei, Y.; Shibata, D.; et al. Metabolonote: A Wiki-Based Database for Managing Hierarchical Metadata of Metabolome Analyses. Front. Bioeng. Biotechnol. 2015, 3, 38. [Google Scholar] [CrossRef]
- Sun, Y.; Kim, J.H.; Vangipuram, K.; Hayes, D.F.; Smith, E.M.L.; Yeomans, L.; Henry, N.L.; Stringer, K.A.; Hertz, D.L. Pharmacometabolomics Reveals a Role for Histidine, Phenylalanine, and Threonine in the Development of Paclitaxel-Induced Peripheral Neuropathy. Breast Cancer Res. Treat. 2018, 171, 657–666. [Google Scholar] [CrossRef]
- Sud, M.; Fahy, E.; Cotter, D.; Azam, K.; Vadivelu, I.; Burant, C.; Edison, A.; Fiehn, O.; Higashi, R.; Nair, K.S.; et al. Metabolomics Workbench: An International Repository for Metabolomics Data and Metadata, Metabolite Standards, Protocols, Tutorials and Training, and Analysis Tools. Nucleic Acids Res. 2016, 44, D463–D470. [Google Scholar] [CrossRef]
- Lindon, J.C.; Holmes, E.; Nicholson, J.K. Metabonomics Techniques and Applications to Pharmaceutical Research & Development. Pharm. Res. 2006, 23, 1075–1088. [Google Scholar] [CrossRef] [PubMed]
- Beckonert, O.; Bollard, M.E.; Ebbels, T.M.D.; Keun, H.C.; Antti, H.; Holmes, E.; Lindon, J.C.; Nicholson, J.K. NMR-Based Metabonomic Toxicity Classification: Hierarchical Cluster Analysis and k-Nearest-Neighbour Approaches. Anal. Chim. Acta 2003, 490, 3–15. [Google Scholar] [CrossRef]
- Singh, B.; Jana, S.K.; Ghosh, N.; Das, S.K.; Joshi, M.; Bhattacharyya, P.; Chaudhury, K. Metabolomic Profiling of Doxycycline Treatment in Chronic Obstructive Pulmonary Disease. J. Pharm. Biomed. Anal. 2017, 132, 103–108. [Google Scholar] [CrossRef] [PubMed]
- Chashmniam, S.; Mirhafez, S.R.; Dehabeh, M.; Hariri, M.; Azimi Nezhad, M.; Nobakht, M.; Gh, B.F. A Pilot Study of the Effect of Phospholipid Curcumin on Serum Metabolomic Profile in Patients with Non-Alcoholic Fatty Liver Disease: A Randomized, Double-Blind, Placebo-Controlled Trial. Eur. J. Clin. Nutr. 2019, 73, 1224–1235. [Google Scholar] [CrossRef]
- Cai, A.; Qi, S.; Su, Z.; Shen, H.; Yang, Y.; Cai, W.; Dai, Y. A Pilot Metabolic Profiling Study of Patients with Neonatal Jaundice and Response to Phototherapy. Clin. Transl. Sci. 2016, 9, 216–220. [Google Scholar] [CrossRef] [PubMed]
- Boguszewicz, Ł.; Bieleń, A.; Mrochem-Kwarciak, J.; Skorupa, A.; Ciszek, M.; Heyda, A.; Wygoda, A.; Kotylak, A.; Składowski, K.; Sokół, M. NMR-Based Metabolomics in Real-Time Monitoring of Treatment Induced Toxicity and Cachexia in Head and Neck Cancer: A Method for Early Detection of High Risk Patients. Metabolomics 2019, 15, 110. [Google Scholar] [CrossRef] [PubMed]
- Boguszewicz, Ł.; Bieleń, A.; Jarczewski, J.D.; Ciszek, M.; Skorupa, A.; Składowski, K.; Sokół, M. Molecular Response to Induction Chemotherapy and Its Correlation with Treatment Outcome in Head and Neck Cancer Patients by Means of NMR-Based Metabolomics. BMC Cancer 2021, 21, 410. [Google Scholar] [CrossRef] [PubMed]
- Trevino, V.; Falciani, F. GALGO: An R Package for Multivariate Variable Selection Using Genetic Algorithms. Bioinformatics 2006, 22, 1154–1156. [Google Scholar] [CrossRef]
- Xia, J.; Sinelnikov, I.V.; Han, B.; Wishart, D.S. MetaboAnalyst 3.0—Making Metabolomics More Meaningful. Nucleic Acids Res. 2015, 43, W251–W257. [Google Scholar] [CrossRef]
- Xia, J.; Wishart, D.S. Using MetaboAnalyst 3.0 for Comprehensive Metabolomics Data Analysis. Curr. Protoc. Bioinform. 2016, 55, 1–91. [Google Scholar] [CrossRef]
- Health Categories. Available online: https://hrcsonline.net/health-categories/ (accessed on 6 August 2021).
- Eppinga, R.N.; Kofink, D.; Dullaart, R.P.F.; Dalmeijer, G.W.; Lipsic, E.; van Veldhuisen, D.J.; van der Horst, I.C.C.; Asselbergs, F.W.; van der Harst, P. Effect of Metformin on Metabolites and Relation with Myocardial Infarct Size and Left Ventricular Ejection Fraction After Myocardial Infarction. Circ. Cardiovasc. Genet. 2017, 10, e001564. [Google Scholar] [CrossRef]
- Boekhout, A.H.; Beijnen, J.H.; Schellens, J.H.M. Trastuzumab. Oncologist 2011, 16, 800–810. [Google Scholar] [CrossRef]
- Hart, C.D.; Vignoli, A.; Tenori, L.; Uy, G.L.; van To, T.; Adebamowo, C.; Hossain, S.M.; Biganzoli, L.; Risi, E.; Love, R.R.; et al. Serum Metabolomic Profiles Identify ER-Positive Early Breast Cancer Patients at Increased Risk of Disease Recurrence in a Multicenter Population. Clin. Cancer Res. 2017, 23, 1422–1431. [Google Scholar] [CrossRef]
- Ricoult, S.J.H.; Manning, B.D. The Multifaceted Role of MTORC1 in the Control of Lipid Metabolism. EMBO Rep. 2013, 14, 242–251. [Google Scholar] [CrossRef]
- Lamming, D.W.; Sabatini, D.M. A Central Role for MTOR in Lipid Homeostasis. Cell Metab. 2013, 18, 465–469. [Google Scholar] [CrossRef]
- Peng, T.; Golub, T.R.; Sabatini, D.M. The Immunosuppressant Rapamycin Mimics a Starvation-like Signal Distinct from Amino Acid and Glucose Deprivation. Mol. Cell. Biol. 2002, 22, 5575–5584. [Google Scholar] [CrossRef]
- Soefje, S.A.; Karnad, A.; Brenner, A.J. Common Toxicities of Mammalian Target of Rapamycin Inhibitors. Target. Oncol. 2011, 6, 125–129. [Google Scholar] [CrossRef]
- Kaplan, B.; Qazi, Y.; Wellen, J.R. Strategies for the Management of Adverse Events Associated with MTOR Inhibitors. Transplant. Rev. 2014, 28, 126–133. [Google Scholar] [CrossRef]
- Moschetta, M.; Reale, A.; Marasco, C.; Vacca, A.; Carratù, M.R. Therapeutic Targeting of the MTOR-Signalling Pathway in Cancer: Benefits and Limitations. Br. J. Pharmacol. 2014, 171, 3801–3813. [Google Scholar] [CrossRef]
- Huang, L.; Adachi, N.; Nagaro, T.; Liu, K.; Arai, T. Histaminergic Involvement in Neuropathic Pain Produced by Partial Ligation of the Sciatic Nerve in Rats. Reg. Anesth. Pain Med. 2007, 32, 124–129. [Google Scholar] [CrossRef]
- Yu, J.; Lou, G.-D.; Yue, J.-X.; Tang, Y.-Y.; Hou, W.-W.; Shou, W.-T.; Ohtsu, H.; Zhang, S.-H.; Chen, Z. Effects of Histamine on Spontaneous Neuropathic Pain Induced by Peripheral Axotomy. Neurosci. Bull. 2013, 29, 261–269. [Google Scholar] [CrossRef]
- Farshid, A.A.; Tamaddonfard, E.; Najafi, S. Effects of Histidine and N-Acetylcysteine on Experimental Lesions Induced by Doxorubicin in Sciatic Nerve of Rats. Drug Chem. Toxicol. 2015, 38, 436–441. [Google Scholar] [CrossRef]
- Zhou, G.; Shoji, H.; Yamada, S.; Matsuishi, T. Decreased Beta -Phenylethylamine in CSF in Parkinson’s Disease. J. Neurol. Neurosurg. Psychiatry 1997, 63, 754–758. [Google Scholar] [CrossRef]
- Moyle, J.J.; Fox, A.M.; Arthur, M.; Bynevelt, M.; Burnett, J.R. Meta-Analysis of Neuropsychological Symptoms of Adolescents and Adults with PKU. Neuropsychol. Rev. 2007, 17, 91–101. [Google Scholar] [CrossRef]
- Boehm, G.; Cervantes, H.; Georgi, G.; Jelinek, J.; Sawatzki, G.; Wermuth, B.; Colombo, J.P. Effect of Increasing Dietary Threonine Intakes on Amino Acid Metabolism of the Central Nervous System and Peripheral Tissues in Growing Rats. Pediatr. Res. 1998, 44, 900–906. [Google Scholar] [CrossRef]
- Raykov, Z.; Grekova, S.P.; Bour, G.; Lehn, J.M.; Giese, N.A.; Nicolau, C.; Aprahamian, M. Myo-Inositol Trispyrophosphate-Mediated Hypoxia Reversion Controls Pancreatic Cancer in Rodents and Enhances Gemcitabine Efficacy. Int. J. Cancer 2014, 134, 2572–2582. [Google Scholar] [CrossRef]
- Shukla, S.K.; Purohit, V.; Mehla, K.; Gunda, V.; Chaika, N.V.; Vernucci, E.; King, R.J.; Abrego, J.; Goode, G.D.; Dasgupta, A.; et al. MUC1 and HIF-1alpha Signaling Crosstalk Induces Anabolic Glucose Metabolism to Impart Gemcitabine Resistance to Pancreatic Cancer. Cancer Cell 2017, 32, 71–87. [Google Scholar] [CrossRef]
- Vuckovic, D. Current Trends and Challenges in Sample Preparation for Global Metabolomics Using Liquid Chromatography–Mass Spectrometry. Anal. Bioanal. Chem. 2012, 403, 1523–1548. [Google Scholar] [CrossRef]
- Lu, W.; Su, X.; Klein, M.S.; Lewis, I.A.; Fiehn, O.; Rabinowitz, J.D. Metabolite Measurement: Pitfalls to Avoid and Practices to Follow. Annu. Rev. Biochem. 2017, 86, 277–304. [Google Scholar] [CrossRef]
- Hendriks, M.M.W.B.; van Eeuwijk, F.A.; Jellema, R.H.; Westerhuis, J.A.; Reijmers, T.H.; Hoefsloot, H.C.J.; Smilde, A.K. Data-Processing Strategies for Metabolomics Studies. Trends Anal. Chem. 2011, 30, 1685–1698. [Google Scholar] [CrossRef]
- Yin, P.; Lehmann, R.; Xu, G. Effects of Pre-Analytical Processes on Blood Samples Used in Metabolomics Studies. Anal. Bioanal. Chem. 2015, 407, 4879–4892. [Google Scholar] [CrossRef]
- Delanghe, J.R.; Speeckaert, M.M. Preanalytics in Urinalysis. Clin. Biochem. 2016, 49, 1346–1350. [Google Scholar] [CrossRef]
- Kirwan, J.A.; Brennan, L.; Broadhurst, D.; Fiehn, O.; Cascante, M.; Dunn, W.B.; Schmidt, M.A.; Velagapudi, V. Preanalytical Processing and Biobanking Procedures of Biological Samples for Metabolomics Research: A White Paper, Community Perspective (for “Precision Medicine and Pharmacometabolomics Task Group”-The Metabolomics Society Initiative). Clin. Chem. 2018, 64, 1158–1182. [Google Scholar] [CrossRef]


| Disease | Treatment | Experimental Design | Sample | Sample Collection | Research Aim | NMR Instrument | Pulse Sequences | Reference |
|---|---|---|---|---|---|---|---|---|
| BC | GC chemotherapy | 29 (1 CR, 13 PR, 8 SD, 7 PD) | Serum | Before treatment | Prediction of treatment response | 800 MHz | 1D: CPMG 2D: COSY, HMBC, HSQC, J-RES, TOCSY | [46] |
| BC | NAC | 28 (8 CR, 14 PR and 6 NR) | Serum | Before treatment | Prediction of treatment response | 500 MHz | CPMG | [41] |
| HER2+ BC | T/T+E | 79 (40 T, 39 T+E) | Serum | Before, during, and after treatment | Evaluation of treatment impact | 800 MHz | 1D: CPMG, NOESY 2D: HSQC, J-RES, TOCSY | [51] |
| BC | NAC/ NAC + Bev | 118 (58 NAC, 60 NAC + Bev) | Tissue and serum | Before and during treatment, and 6 weeks after surgery | Evaluation of treatment impact Prediction of patient prognosis | 600 MHz | CPMG | [48] |
| BC | NAC | 8 (6 good, 2 non-responders) | Feces | Before and 20 days after each chemotherapy cycle | Evaluation of treatment impact Prediction of treatment response | 600 MHz | 1D: NOESY 2D: COSY, HSQC, TOCSY | [24] |
| BC | Paclitaxel | 48 | Blood | Before, during, and after treatment | Prediction of treatment adverse effects | 500 MHz | 1D-1H-NMR | [94] |
| PC | Gemcitabine | 10 replicates | Cell lines | Before and after treatment | Biomarkers of treatment resistance and response | 500 MHz | 1D-SOGGY 2D: HSQC | [26] |
| PC | Gemcitabine/CUS | 50 (12 control, 9 PC, 10 CUS-high, 10 CUS-low, 9 gemcitabine) | Serum from xenografts | 33 days after treatment | Evaluation of treatment impact | 600 MHz | CPMG | [76] |
| HNSCC | Radio-/Chemo-therapy | 170 | Serum | Weekly, from the day before to the week after treatment | Prediction of treatment adverse effects | 400 MHz | 1D: CPMG, DIFF, NOESY 2D: J-RES | [101] |
| HNSCC | Induction chemotherapy | 53 | Serum | Before and after treatment | Prediction of treatment response | 400 MHz | 1D: CPMG, DIFF, NOESY 2D: J-RES | [102] |
| NSCLC | Nivolumab/Pembrolizumab | 50 (34 nivolumab, 19 pembrolizumab) | Serum | Before treatment | Prediction of treatment response | 600 MHz | CPMG, DIFF NOESY | [52] |
| NSCLC | Nivolumab | 9 (4 EP, 5 LR) | Feces | After treatment | Prediction of treatment response | 400 MHz | 2D: HSQC, TOCSY | [23] |
| PCa | Degarelix | 13 (10 benign, 7 PCa untreated, 6 PCa treated) | Tissue | 7 days after treatment | Evaluation of treatment impact | 600 MHz | CPMG | [29] |
| HL/NHL | High dose therapy | 12 (6 t-MDS/AML, 6 no t-MDS/AML) | Peripheral blood stem cells | Before aHCT | Evaluation of metabolic changes associated to adverse effects | 600MHz | 1D-1H-NMR | [25] |
| HCC | RFA | 120 (59 viral, 61 Non-viral cirrhosis) | Serum | Before and after treatment | Prediction of treatment response | 500 MHz | 1D: CPMG, NOESY 2D: J-RES, TOCSY | [77] |
| MM | Chemotherapy | 81 (31 control, 27 diagnosed, 23 remission) | Serum | Before and after treatment | Evaluation of treatment impact | 600 MHz | 1D: CPMG, NOESY 2D: HSQC, J-RES, TOCSY | [43] |
Publisher’s Note: MDPI stays neutral with regard to jurisdictional claims in published maps and institutional affiliations. |
© 2021 by the authors. Licensee MDPI, Basel, Switzerland. This article is an open access article distributed under the terms and conditions of the Creative Commons Attribution (CC BY) license (https://creativecommons.org/licenses/by/4.0/).
Share and Cite
Gómez-Cebrián, N.; Vázquez Ferreiro, P.; Carrera Hueso, F.J.; Poveda Andrés, J.L.; Puchades-Carrasco, L.; Pineda-Lucena, A. Pharmacometabolomics by NMR in Oncology: A Systematic Review. Pharmaceuticals 2021, 14, 1015. https://doi.org/10.3390/ph14101015
Gómez-Cebrián N, Vázquez Ferreiro P, Carrera Hueso FJ, Poveda Andrés JL, Puchades-Carrasco L, Pineda-Lucena A. Pharmacometabolomics by NMR in Oncology: A Systematic Review. Pharmaceuticals. 2021; 14(10):1015. https://doi.org/10.3390/ph14101015
Chicago/Turabian StyleGómez-Cebrián, Nuria, Pedro Vázquez Ferreiro, Francisco Javier Carrera Hueso, José Luis Poveda Andrés, Leonor Puchades-Carrasco, and Antonio Pineda-Lucena. 2021. "Pharmacometabolomics by NMR in Oncology: A Systematic Review" Pharmaceuticals 14, no. 10: 1015. https://doi.org/10.3390/ph14101015
APA StyleGómez-Cebrián, N., Vázquez Ferreiro, P., Carrera Hueso, F. J., Poveda Andrés, J. L., Puchades-Carrasco, L., & Pineda-Lucena, A. (2021). Pharmacometabolomics by NMR in Oncology: A Systematic Review. Pharmaceuticals, 14(10), 1015. https://doi.org/10.3390/ph14101015