1. Introduction
The deterioration of food commodities by fungi is a serious and widely diffused problem, not only for the quality loss due to spoilage but in particular for the ability by different fungal species to produce mycotoxins [
1,
2]. Among different mycotoxins ochratoxin A (OTA) is a mycotoxin of particular concern since it is produced by several widespread fungal species, able to colonize different food commodities both in the field and during storage [
3]. OTA has an established cancerogenic effect on animals and a supposed cancerogenic effect on humans, so it has been included by the International Agency for Research on Cancer (IARC) among the compounds of 2B group [
4]. Moreover, when ingested as a food contaminant, OTA is very persistent (blood halflife: 35 days) because of an unfavourable elimination toxicokinetic [
5].
These characteristics have prompted to decree regulatory limits in several countries which in turn have implied the development of appropriate analytical methods to detect OTA. Currently methods available for the determination of OTA in barley, raw coffee, beer and wine are based on High Performance Liquid Chromatography (HPLC) detection and have a good performances concerning selectivity, sensitivity and reproducibility [
6-
8]. However HPLC analyses are usually time consuming, request harmful organic solvent and expensive equipments.
In this work we have studied, for the first time, the suitability of a detection system based on amorphous silicon (a-Si:H) sensors to detect and quantify OTA, taking advantage of the naturally fluorescence of this mycotoxin. This system promises to be compact, fast and low cost because the a-Si:H technology is mature, inexpensive and suitable for different kind of substrates due to its low deposition temperature (below 150°C) [
9].
2. Experimental details
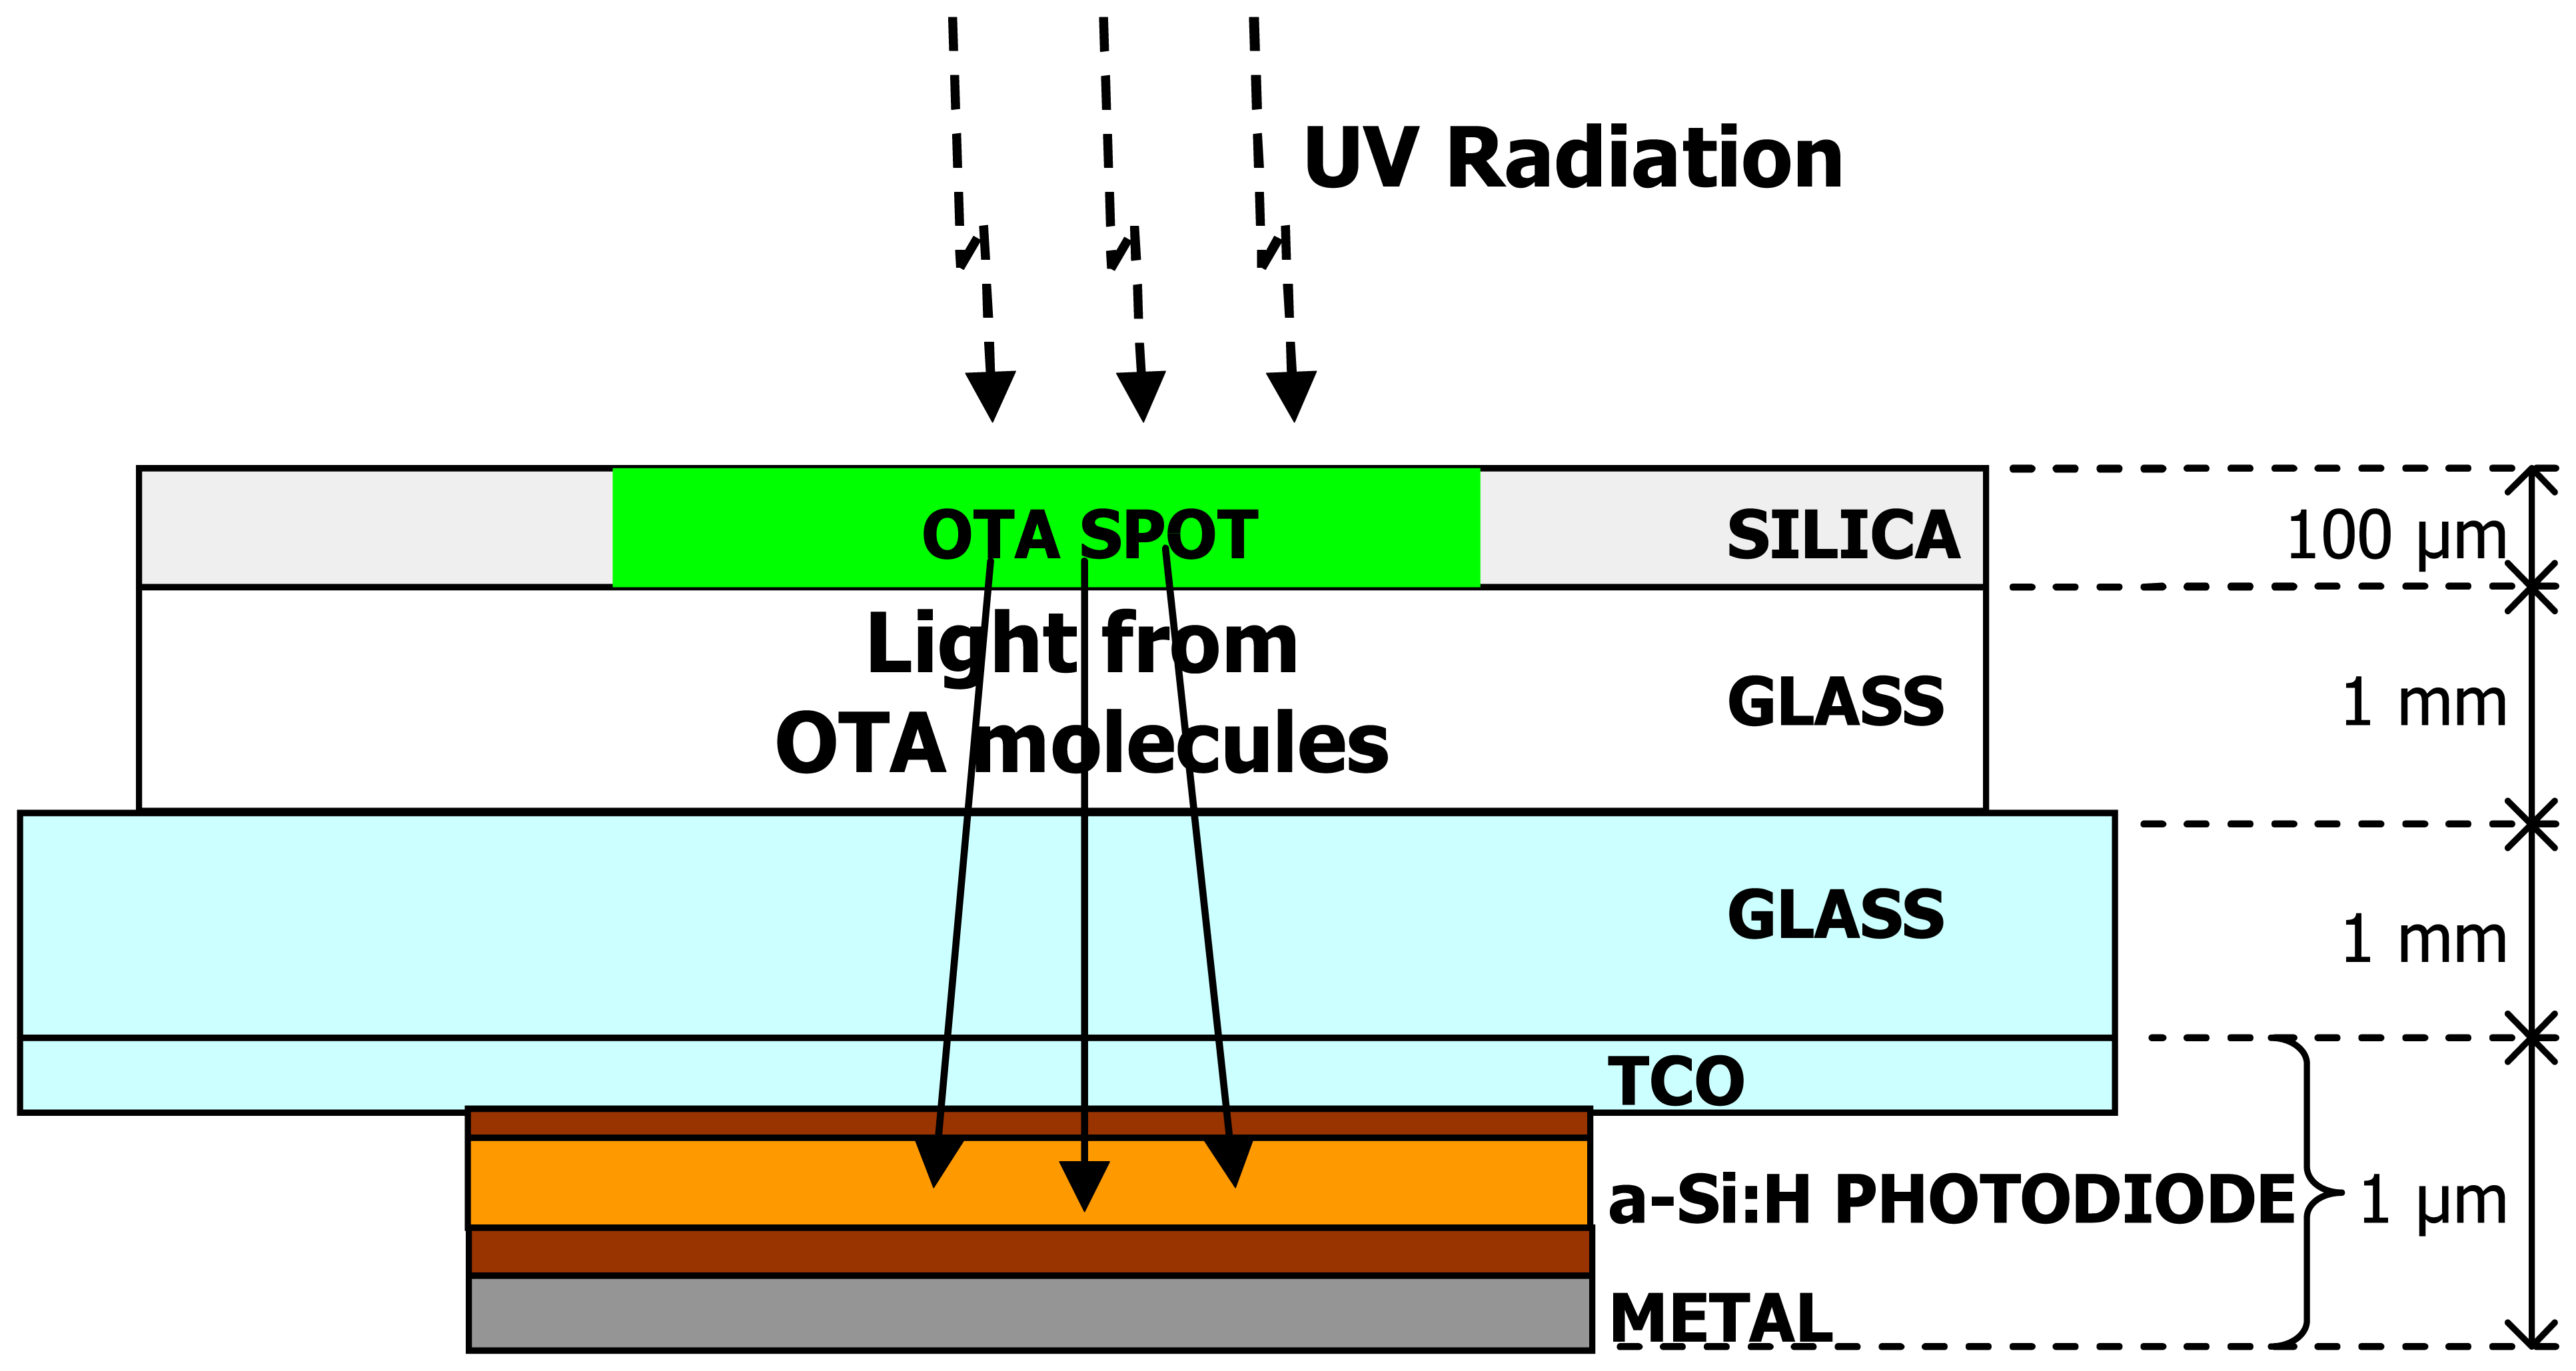
A prototype of the detection system is depicted in
figure 1. On the silica side of a High Performance Thin Layer Cromatography (HPTLC) plate 2 μl of OTA solution are spotted. Work solutions have been prepared by diluting OTA (20 μg ml-1) with toluene acidified by 1% glacial acetic acid. The silica area covered by the OTA solution was 0.2 cm
2. The free side of the HPTLC plate is placed on one side of another glass substrate. The opposite side of this last substrate is covered by Transparent Conductive Oxide (TCO) on which the a-Si:H photodiode is fabricated. The sensor is constituted by a stacked structure of p-type/intrinsic/n-type a-Si:H layers deposited by Plasma Enhanced Chemical Vapor technique (PECVD). The top metal contact is a vacuum evaporated three metal layer chromium/aluminium/chromium stack.
An UV radiation at 253.4nm excites the mycotoxin, whose re-emitted light (mainly in the green range) passes through the glasses/TCO layers and is absorbed by the a-Si:H photosensor, which is aligned with the OTA molecules deposited on the silica. A photocurrent is generated in the sensor, kept in short circuit condition, and measured by a Source Measure Unit (SMU) Keithley 236.
The thicknesses of the a-Si:H device have been designed to match the sensor spectral response with the emission spectra of OTA molecules and to keep the reverse saturation current as low as possible. From simulations by a numerical device program [
10,
11] and experimental results, we found that a good compromise between the above mentioned requirements is obtained using 100, 1500 and 500 Å thick p-doped, intrinsic and n-doped layers, respectively.
3. Results and discussion
A set of devices, fabricated following the above specifications, has been characterized by current-voltage (I-V) measurements under different illumination conditions. In
figure 2, I-V curves in dark conditions (solid squares) and under monochromatic light at 465nm (open squares) for a device with area equal to 0.2 cm
2 are reported. The incident radiation power was 1.3mW/cm
2. A responsivity of 247mA/W at 465nm, which is the emission spectra peak of OTA, and a reverse saturation current of 1×10
-10 A/cm
2, at small reverse applied voltages, have been achieved.
In the same figure we report as open circles the photocurrent induced in the sensor when 2μl of acidified toluene without OTA are deposited in the silica and the UV radiation is incident on it. Even though the silica, the TCO and the glass substrates act as a good filters for wavelengths below 370nm, the fluorescence induced in the silica and in the glass substrates by the UV energy causes a photocurrent which has to be taken into account to infer the correct photodetector response. An offset correction has been then performed. The current flowing through the sensor, under UV illumination, when 2μl of toluene acidified with 1% glacial acetic acid without OTA are deposited on the silice, has been subtracted to the sensor photocurrent measured when the solution containing different concentrations of OTA have been assayed. The results of this calculation represent the photocurrent due only to the mycotoxin fluorescence.
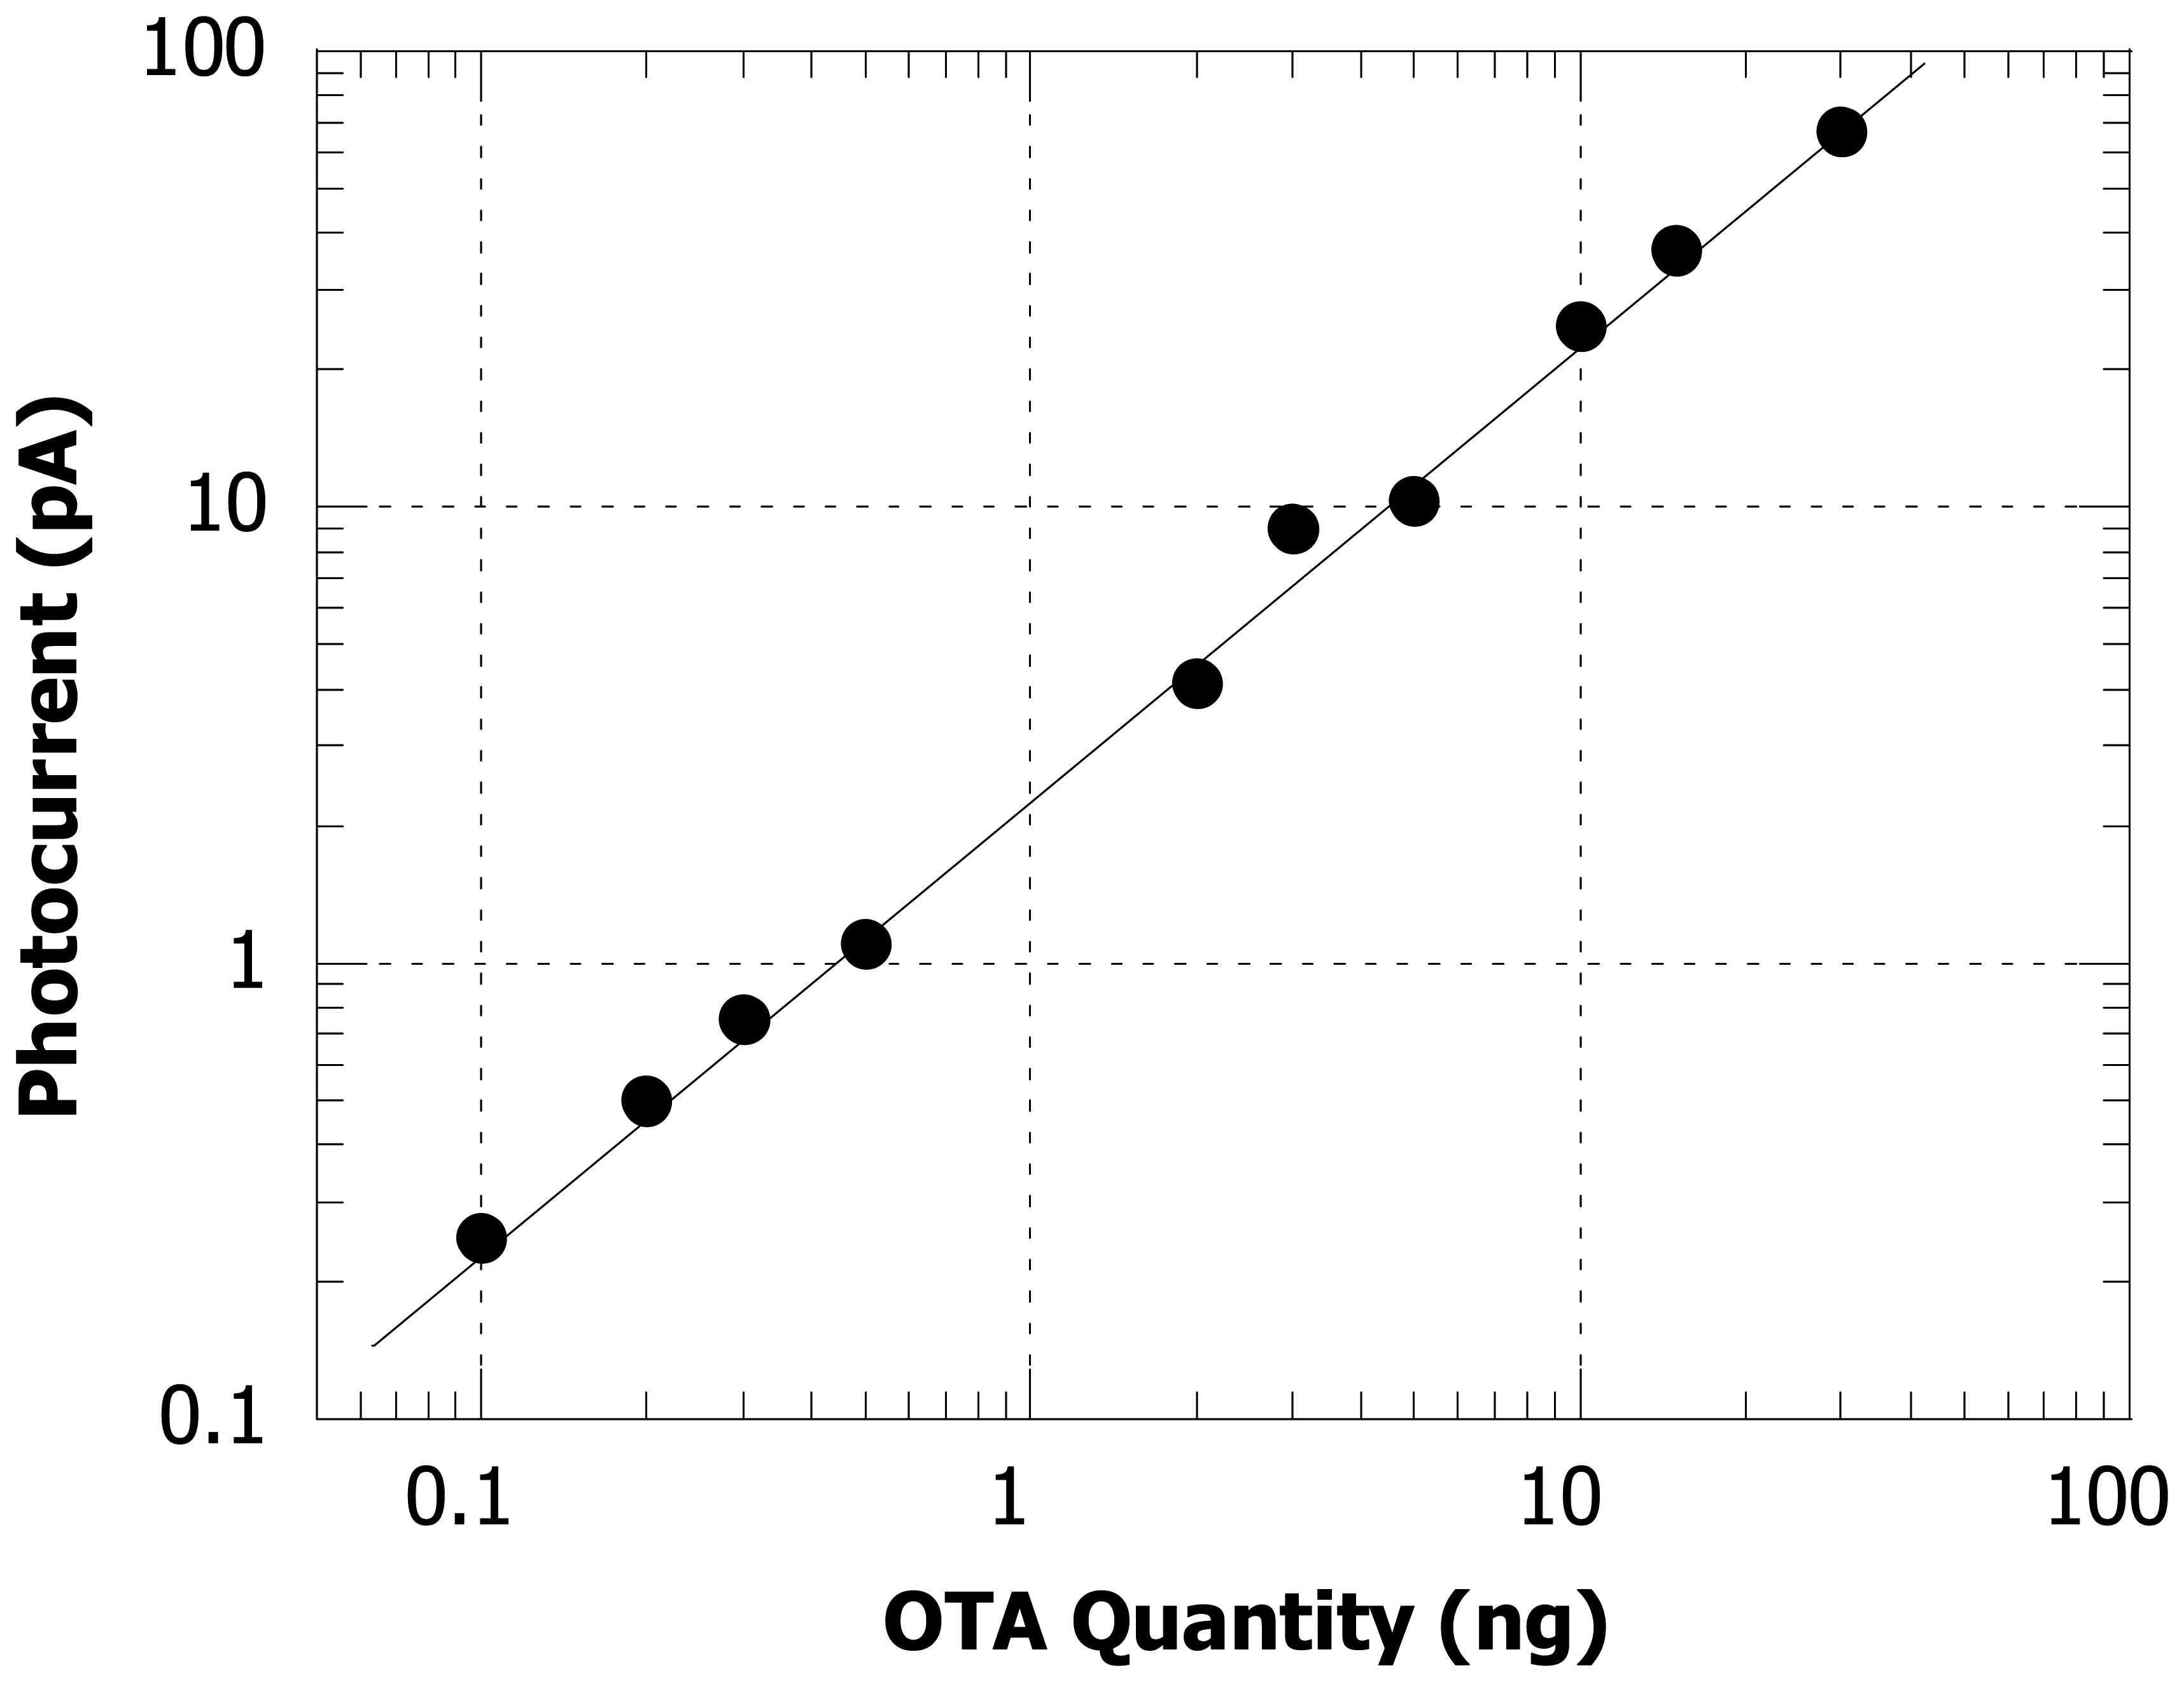
The photocurrent values due to the mycotoxin are reported in a log-log scale in
figure 3, where the slope-1 solid line is a guide for the eyes and indicates an excellent linearity of the detector response in a range of almost three orders of magnitude. No saturation behaviour for high concentration values is observed.
The minimum detected OTA quantity is equal to 0.1ng which correspond to 0.25ppb of OTA in red wine samples after an extraction process starting from 10 ml of sample. From the graph we observe also that 0.1ng of OTA induce in the sensor a photocurrent of 300fA. This value is at least one order of magnitude higher than the intrinsic current noise of the system [
12] due to the photodiode noise current and to the equipment utilized for the measurement. The minimum detected signal could be then ascribed to the fluorescence signal and to the associated noise that masks the signal due to the OTA molecules. The effect of the silica fluorescence, however, could be limited by filtering this light by a stacked structure of thin films deposited by PECVD on the same glass substrate improving the detection limit. An improvement of the system can be achieved for example using an optical coupling oil between the two substrates in order to reduce the signal losses due to the glass interfaces. Furthermore, in the perspective of a very low cost, disposable detection system, the same glass substrate can be utilized for both the sensor and the OTA sample achieving a system where the signal losses are minimized.
4. Conclusions
In this letter, we have presented an innovative detection system for OTA based on amorphous silicon photodetectors and on the natural fluorescence of the monitored mycotoxin under UV radiation. We have found an excellent linearity over more than two orders of magnitude of OTA concentration with a minimum detected quantity equal to 0.1ng. Taking into account that the law limits of OTA concentration for foods ranges from 0.5 ppb (baby foods) to 10 ppb (dried wine fruits), and that the sensor described in our work is able to detect 0.25 ppb of OTA in red wine samples after an extraction process starting from 10 ml of sample, these results are encouraging to further investigate the presented system as a rapid, analytical, alternative method to perform OTA analysis in different kind of samples.


