1. Introduction
Concealed defects and cracks in metallic objects may give rise to serious consequences leading to equipment failure, but these can be difficult to locate just using a simple testing device. In chemical processes, defective equipment and piping systems have often been the cause of large-scale fires or explosions resulting in operator casualty. Most equipment maintenance in such processes utilizes radioactive materials and x-ray detection devices, which are hazardous to handle, and thus difficult to implement. In spite of the importance of defect detection in the chemical industry, it has been limited by a lack of proper detection techniques.
Thermographic defect detection systems have come to be widely applied in the detection of defects in various materials. Such systems are utilized in the inspection of composite materials [
1-
3], aerospace materials [
4], laminated wood [
5], and thermal barrier coating [
6]. Also, they have been used in the inspection of manufacturing defects in polystyrene and a plaster [
7]. For the improvement of IR thermography, a self-referencing technique eliminating the need for preliminary inspection has been proposed in the analysis of an IR thermogram [
8], and pulsed phase thermography has also been introduced [
9]. In addition, the effect of defect size on IR thermographic detection has been examined by means of numerical computation [
10,
11].
Vessels and pipes are often in service at high temperatures in chemical processes, in which thermographic measurement for defect detection is useful because the process operation need not be interrupted. In contrast, current nondestructive detection techniques employing x-ray and radioactive materials require the process to be shut down, which is an inconvenient, costly and time-consuming procedure. Therefore, a thermographic detection device demanding no interruption of operation is desirable in such applications. At the same time, an IR camera such as is utilized widely in thermographic defect detection is expensive, and its limited imaging resolution makes the detection of a small magnitude defect difficult. An alternative device for a thermographic detection system is a temperature measurement sensor, an IR thermometer. Its resolution is limited, but it is superior to that of the IR camera when a small area is scanned. It also has the merits of low cost and ready availability. As proof of their effectiveness, IR thermometers have been employed to locate a concealed groove in a metal plate as small as 1 mm wide [
12].
In this study, a previously developed IR sensor system was modified to detect a concealed groove in an aluminum pipe. For dense arrangement of the sensors leaving only narrow gaps between sensors in which no measurement is made, a sensor holder was developed so as to place the sensors side-by-side while maintaining a constant distance between sensors and object. Experimental measurements were yielded to evaluate the performance of the detection device. Also, the results of temperature measurement around the concealed groove were compared with the temperature distribution computed using a heat conduction equation.
2. Numerical Analysis
An aluminum pipe of 100 mm outside diameter, 150 mm length, and 5 mm thickness was used in this experiment (
Figure 1). In the middle of the pipe a groove 2 mm high and 10 mm wide was drilled, and both sides of the groove were covered with a piece of aluminum foil to conceal the hole. In the numerical analysis the size of a detectable defect is determined by the size of computational grid, therefore the defect size can be very small unless too much computation time is required due to the large number of grids. However, the size of simulated defect is determined by the practical tooling in the experiment. The size of the hole in this experiment was the limit of drilling a hole in our lab. In order to provide a temperature distribution on the pipe a plate heater was placed on the top with a water cooler at the bottom, as illustrated in
Figure 2. Because the pipe thickness was much less than the diameter, the radial temperature distribution was ignored and a conduction equation for a two-dimensional cylinder was utilized in the development of the system equation. For computational simplicity, the conduction equation was formulated based on the following assumptions:
steady-state heat transfer
constant temperatures at the top and bottom of the vertical pipe
adiabatic in the concealed groove
constant thermal conductivity throughout the pipe
A two-dimensional conduction equation in cylindrical coordinate was derived as
For computational simplicity the pipe was sectionalized into four by halving in both θ and z directions. The origin of the azimuth angle θ locates in the middle of the groove, and the pipe top is the origin of axial distance z. The boundary conditions are of the top section of the right half of the pipe. The first two boundary conditions denote symmetrical temperature distribution, and the three conditions of the axial boundary are of uniform temperature distribution except the adiabatic groove. When the temperature distribution of the lower half of the pipe was calculated, the axial boundary conditions were modified by exchanging the top and bottom conditions. The left half of the pipe is symmetrical with the right half.
The conduction equation was rewritten in dimensionless form.
where the dimensionless variables are defined as below.
Using a two dimensional grid a finite difference equation was derived from
Eq. (2). Because the radial temperature distribution was ignored, the two dimensional grid was adopted for the numerical computation.
The equation was applied to the nodes of the grid yielding a set of simultaneous equations. The set was combined into a matrix equation, and the solution — temperature distribution — was obtained using a matrix computation tool MATLAB.
3. Experimental
3.1. Preparation of sensor module
Five infrared sensors (Heimann Sensor GmbH, Germany, Model 3129) were utilized in this experiment. Though the sensor has a circular optical window of 3 mm diameter, its casing diameter is 9 mm as illustrated in
Figure 3a. Because the casing size makes close placement of two adjacent sensors impossible, a short distance measurement using the sensors placed in a line will leave an undetected area between them. In order to reduce the undetected area, a specially designed sensor holder made of bakelite was employed, as demonstrated in
Figure 3. The five sensors were arranged in two lines, with three located in the left line with viewing holes of short length, and two, with long holes, on the right. Locating them in this staggered arrangement minimized the area left undetected when the module scans the pipe surface horizontally. The sensor had an internal thermistor for temperature compensation, and an independent amplification circuit was used for the signal processing of each sensor. In order to maintain the distance between the sensor and pipe constant, the front side of the sensor module was in contact with the pipe surface. The number of sensors can be doubled by attaching the same module in series, but only one module holding five sensors was utilized in this work for the simplicity of experiment.
3.2. Experimental setup
A general illustration of the experimental setup is shown in
Figure 2. The pipe was placed on a turntable, the rotational angle of which was measured with a potentiometer and the measurement relayed to a PC. To provide a temperature distribution on the pipe, an aluminum plate 1 cm thick holding three electric rod heaters was placed on the top of the pipe. The heaters were 6 mm in diameter and 5 cm long, and the heat supply was adjusted with a slidacs. The pipe was put in a shallow container of cooling water placed on the turntable. Cooling water at 15°C was provided from a water circulation bath (Daeil Engineering, Korea, Model DTC-312). During the experimental preparation, a portable IR thermometer (Raytek, U.S.A., Model Raynger IP-K) was utilized for the measurement of reference temperatures at the top and bottom of the pipe. The IR sensors in the measurement module were calibrated with measurements using a thermocouple thermometer. The five voltage signals from the sensor module and the signal of rotational angle were fed to a PC through an A/D converter.
3.3. Experimental procedure
While the circulating cooling water was supplied to the bottom of the pipe, the heater was activated. After an hour of a constant supply of cooling water and heat to the pipe, the top and bottom temperatures were periodically measured with the portable thermometer until they were steady. When the setup was ready, with a steady temperature distribution on the pipe surface, measurements were begun using the stationary IR sensors while the pipe was rotated manually. The sensor module was aligned so that the third sensor from the top would detect the temperature across the groove. The turntable holding the pipe rotated at a speed of about 30 degrees per minute, and the measurements of temperature and rotational angle were fed to the PC. The data were stored during the measurement and retrieved for processing after the experiment was completed.
4. Results and Discussion
For the performance evaluation of the proposed detection device three different settings of temperature distribution on the pipe were applied, and the surface temperature was measured while the pipe was rotated.
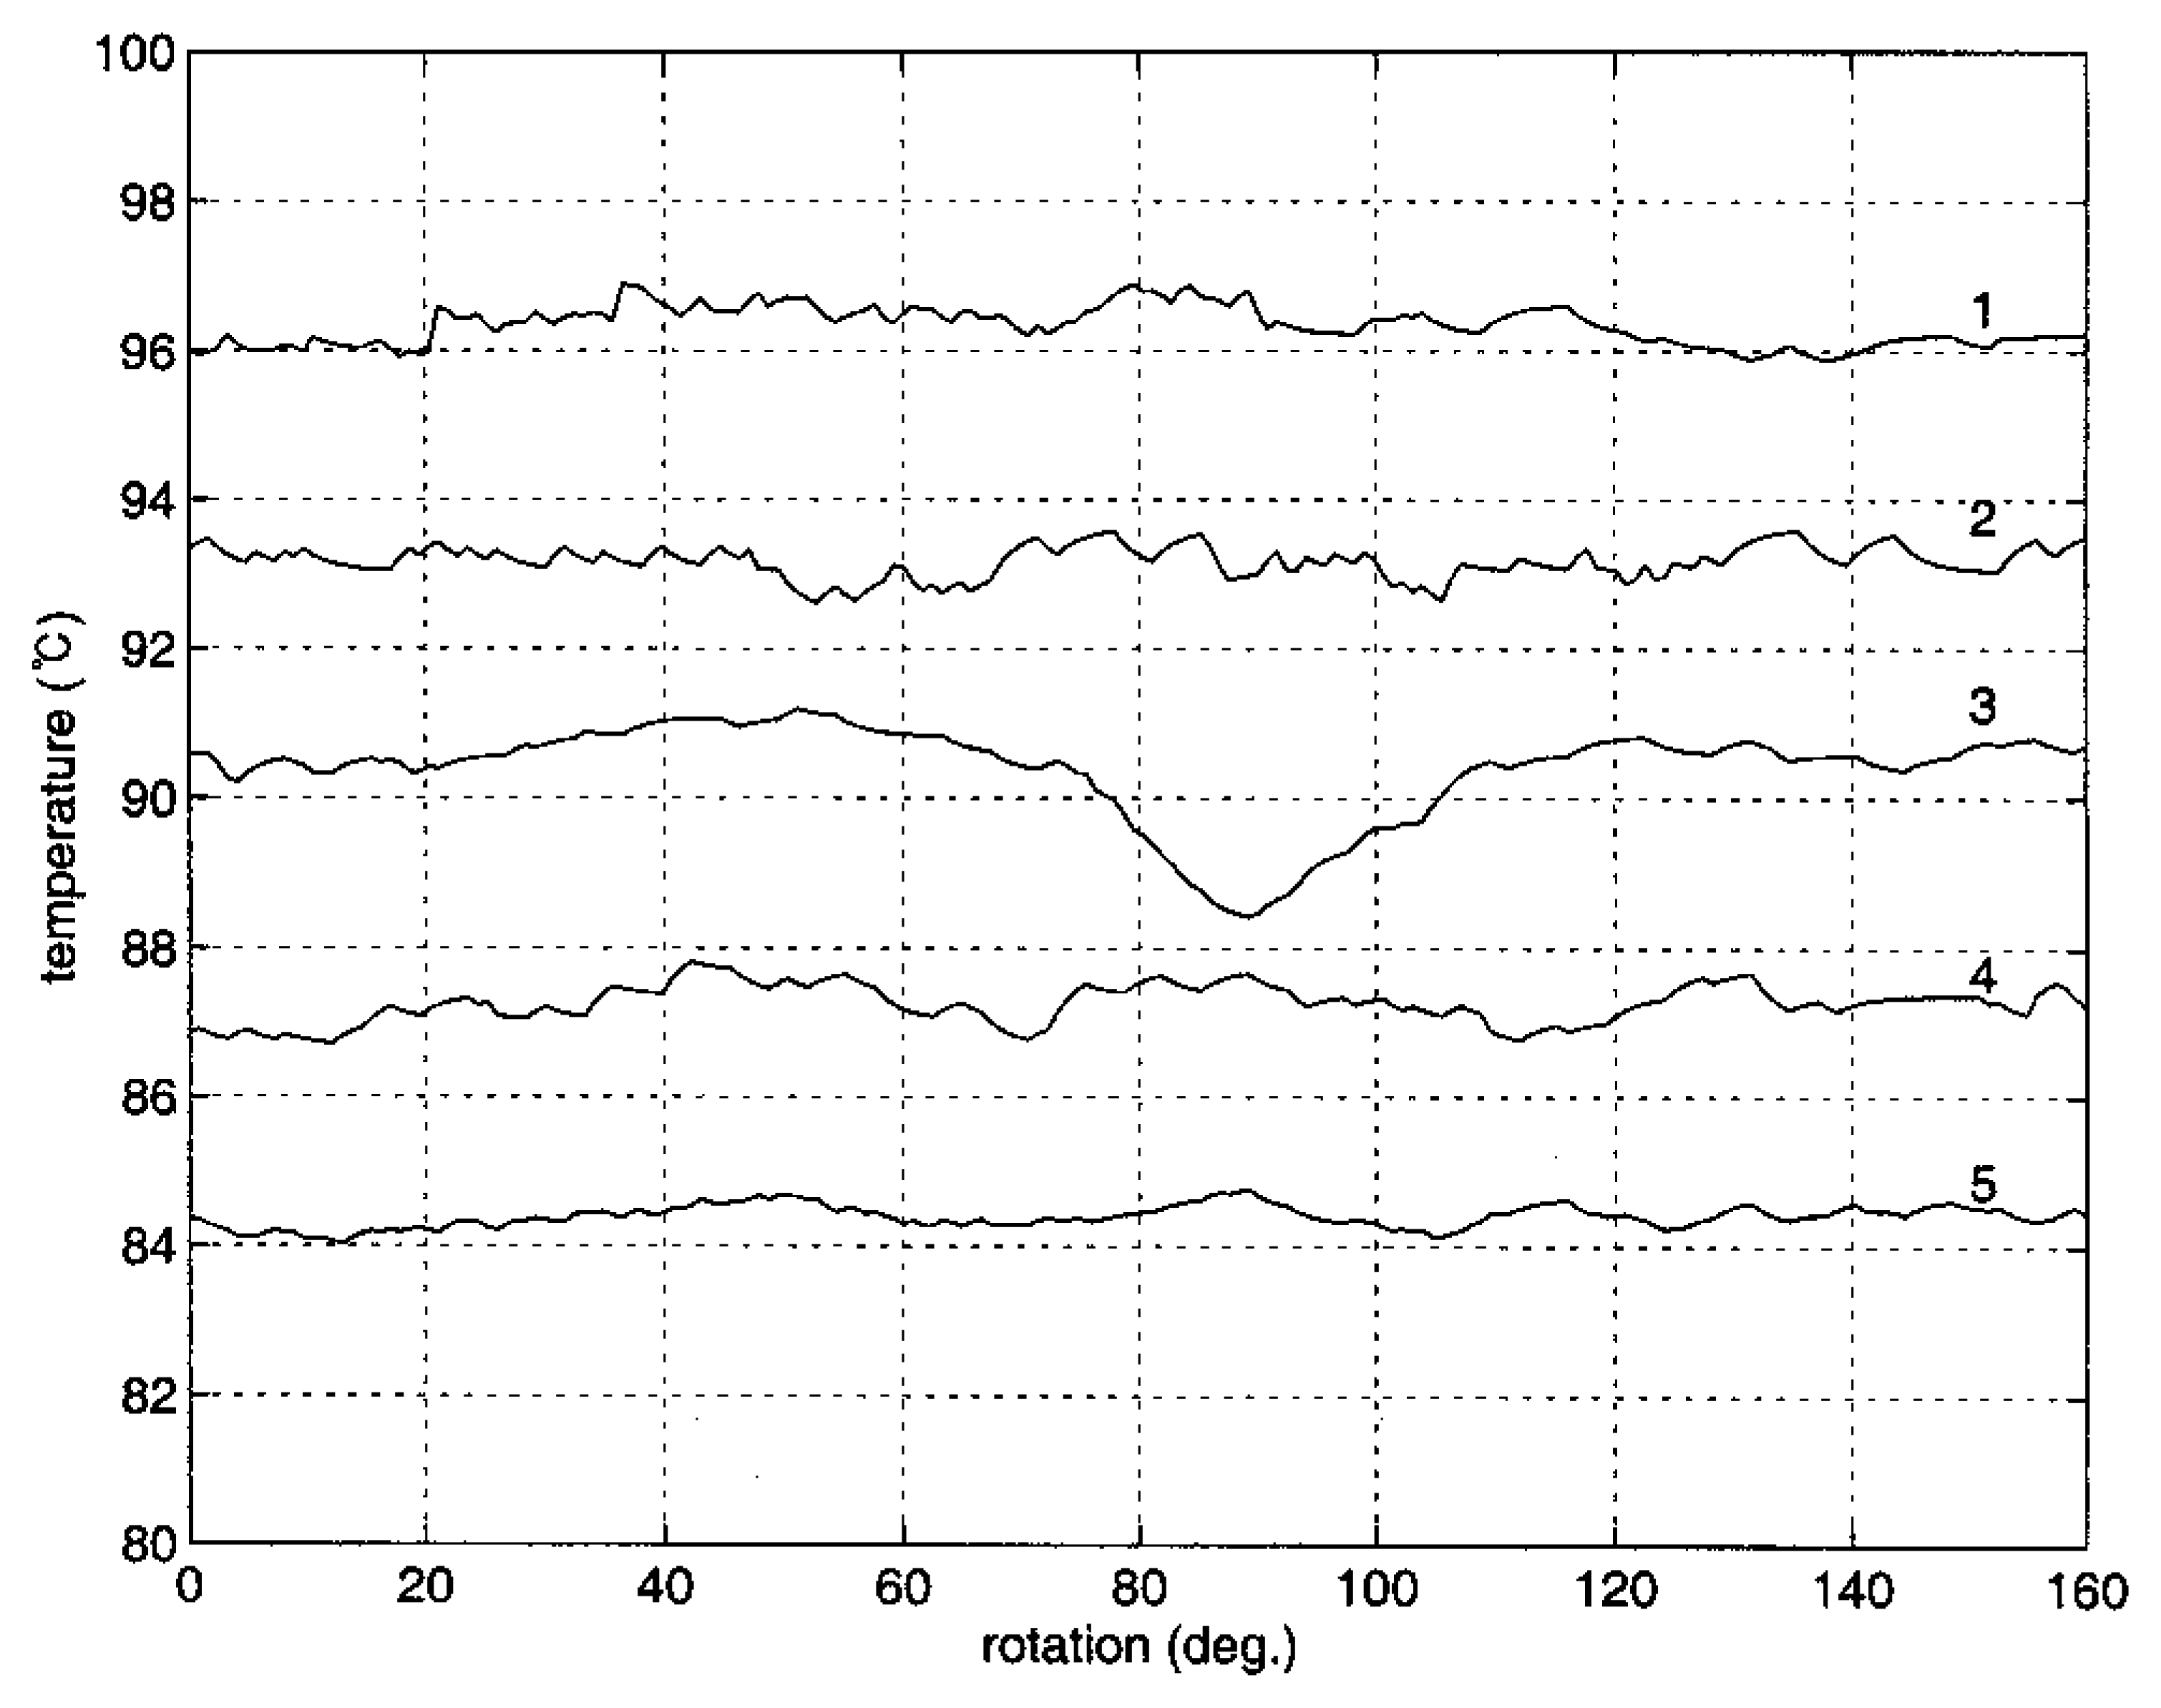
Figure 4 shows the results of temperature measurement of the pipe while having a temperature of 95°C at the top and 40°C at the bottom. The numbers on the curves refer to sensor position counted from the top. Note that the third sensor passes through the concealed groove. The temperature here shows a decrease and then an increase in the middle of the curve, while other curves indicate no such temperature alteration. Though there is some temperature fluctuation in the measurements, the temperature variation at the third sensor is apparent enough to indicate the existence of a defect on the path of temperature measurement. A numerical comparison using standard deviations is given below. Because there is no conduction heat transfer at the groove, the groove temperature is lower than at each side.
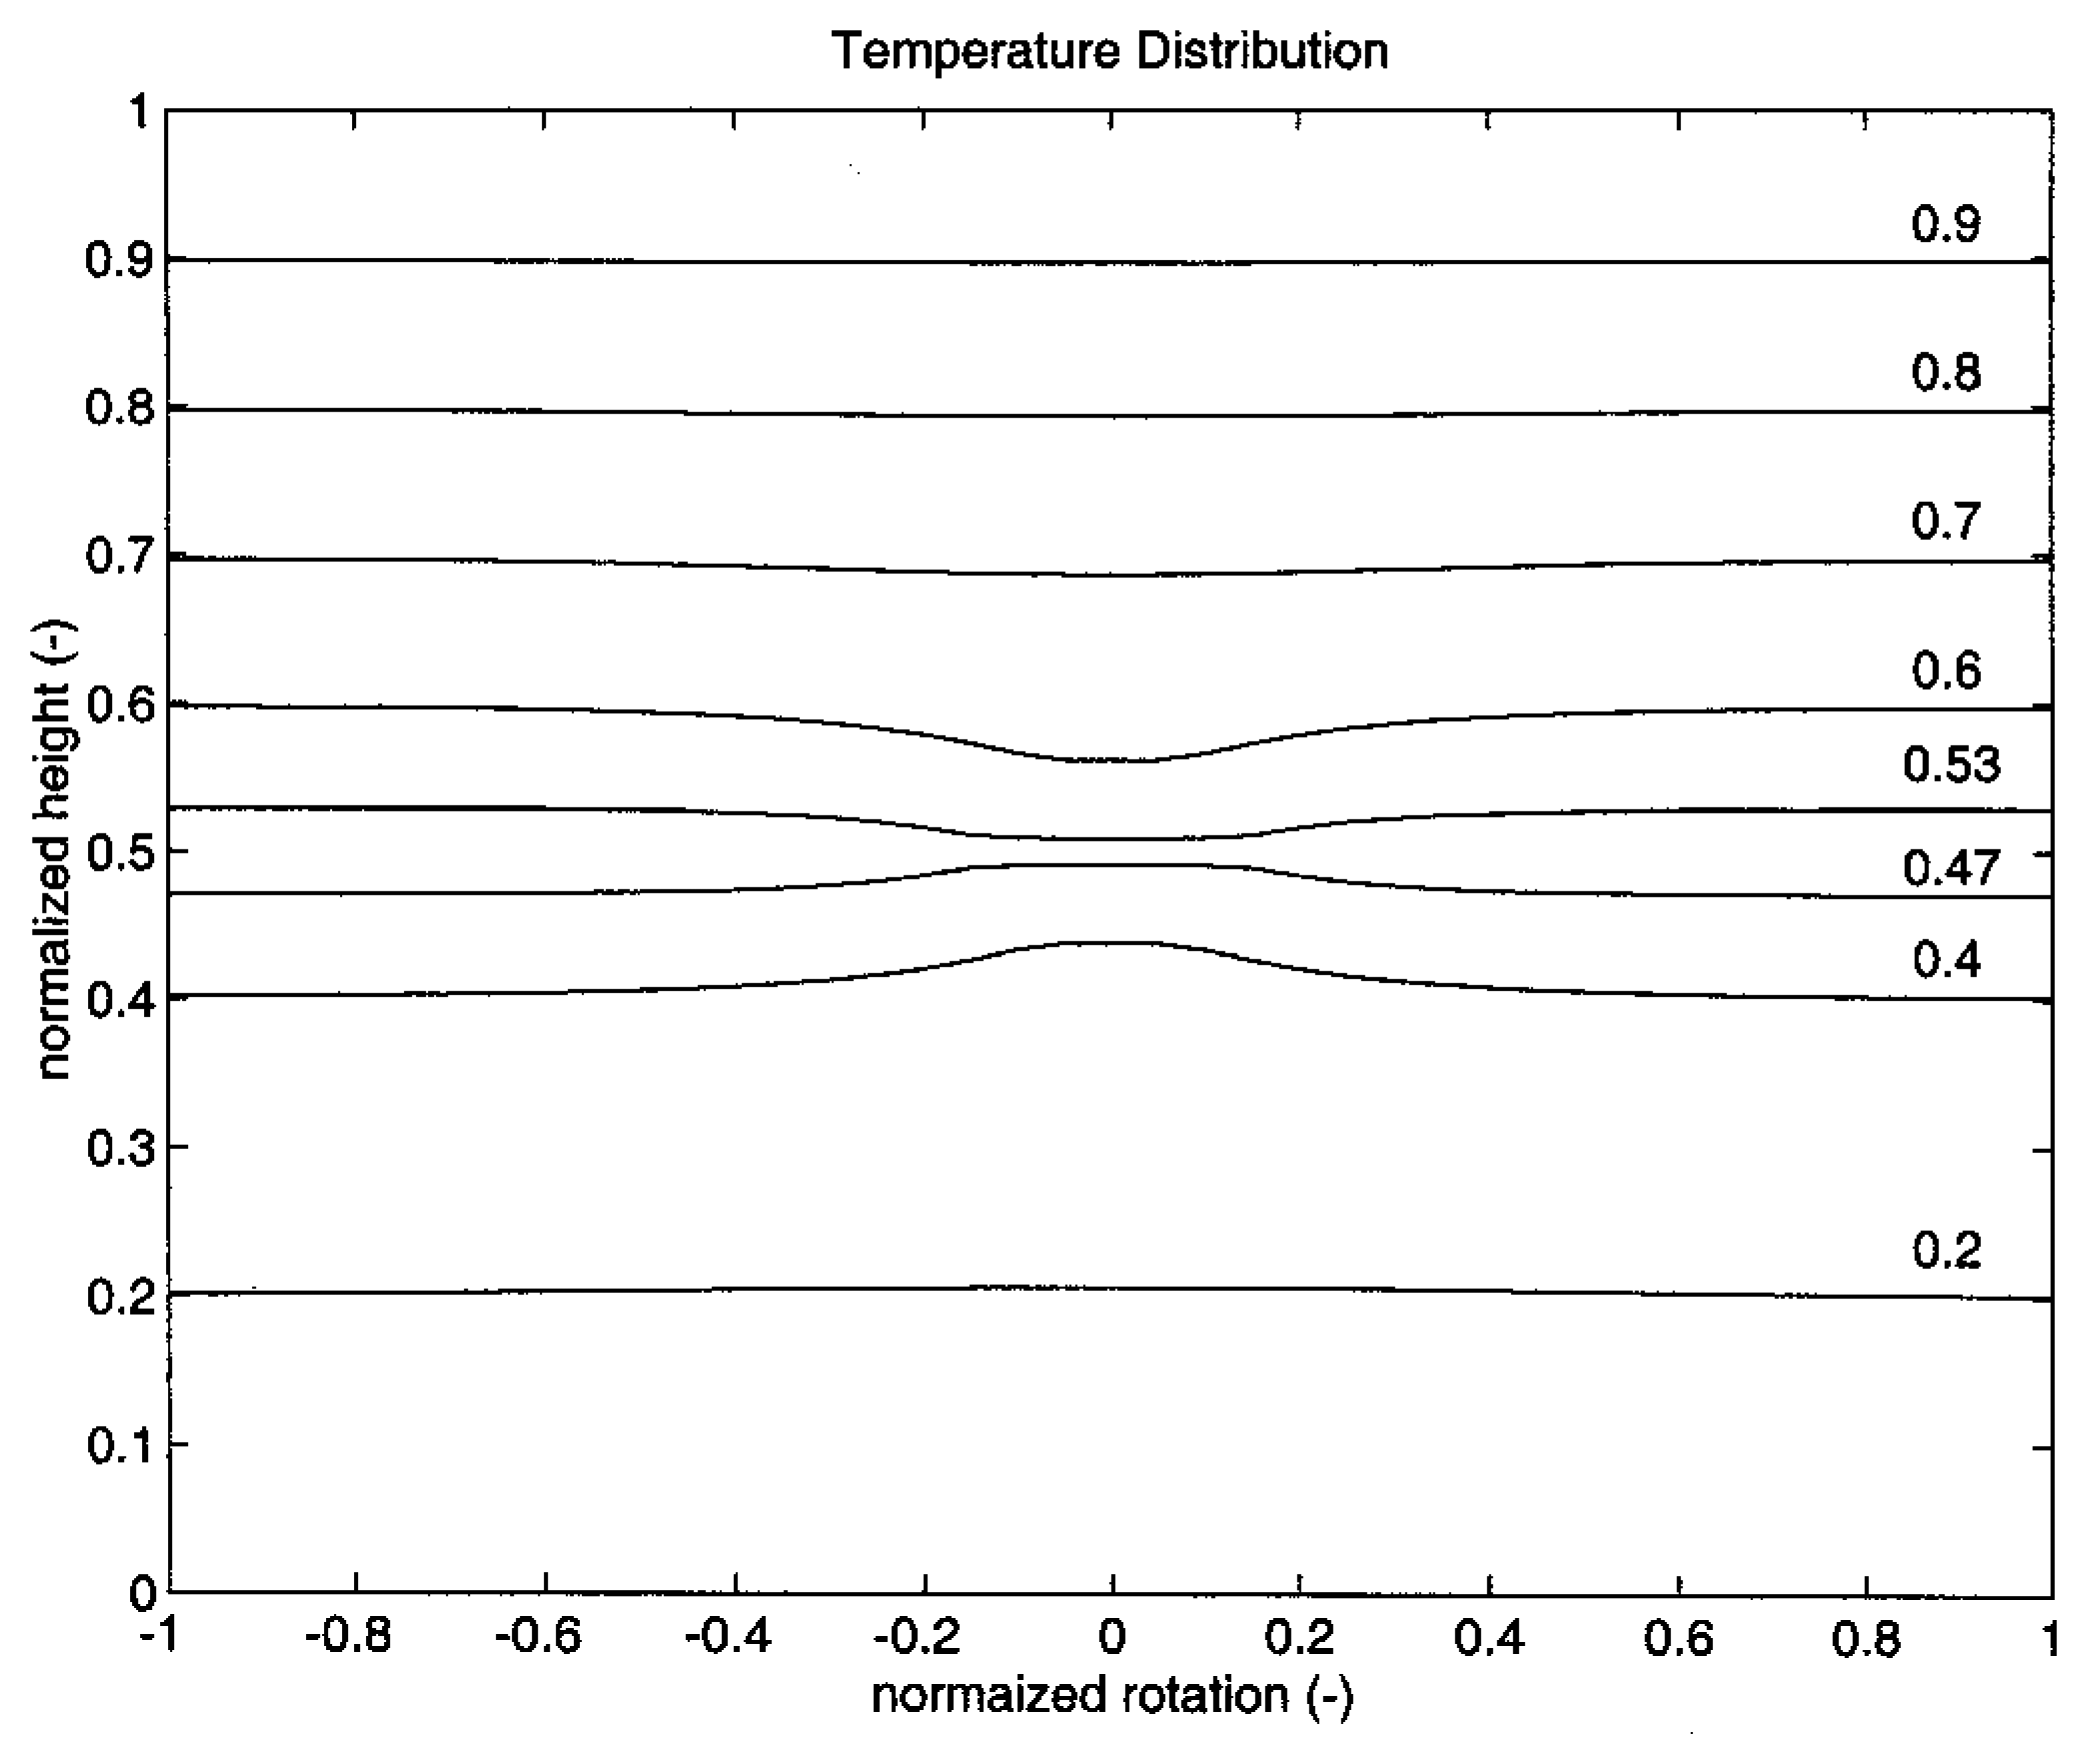
The experimental measurement was compared with the computed temperature distribution using the conduction equation. The computational outcome using
Eq. (3) is illustrated in
Figure 5. The numbers on the curves are normalized temperatures. The distribution is horizontally uniform except at the center where the groove is located. Because no conduction occurs at this site, a higher temperature than at both side locations is observed above the groove, while as expected, a lower temperature is indicated below the groove. When the sensor measures the groove temperature, a lower temperature is detected as demonstrated in the third curve of
Figure 4. A comparison of measured and computed temperatures in a rectangular plate has been conducted, yielding a similar outcome [
12]. For further performance evaluation, the experimental measurements were carried out with two more temperature distributions in the pipe.
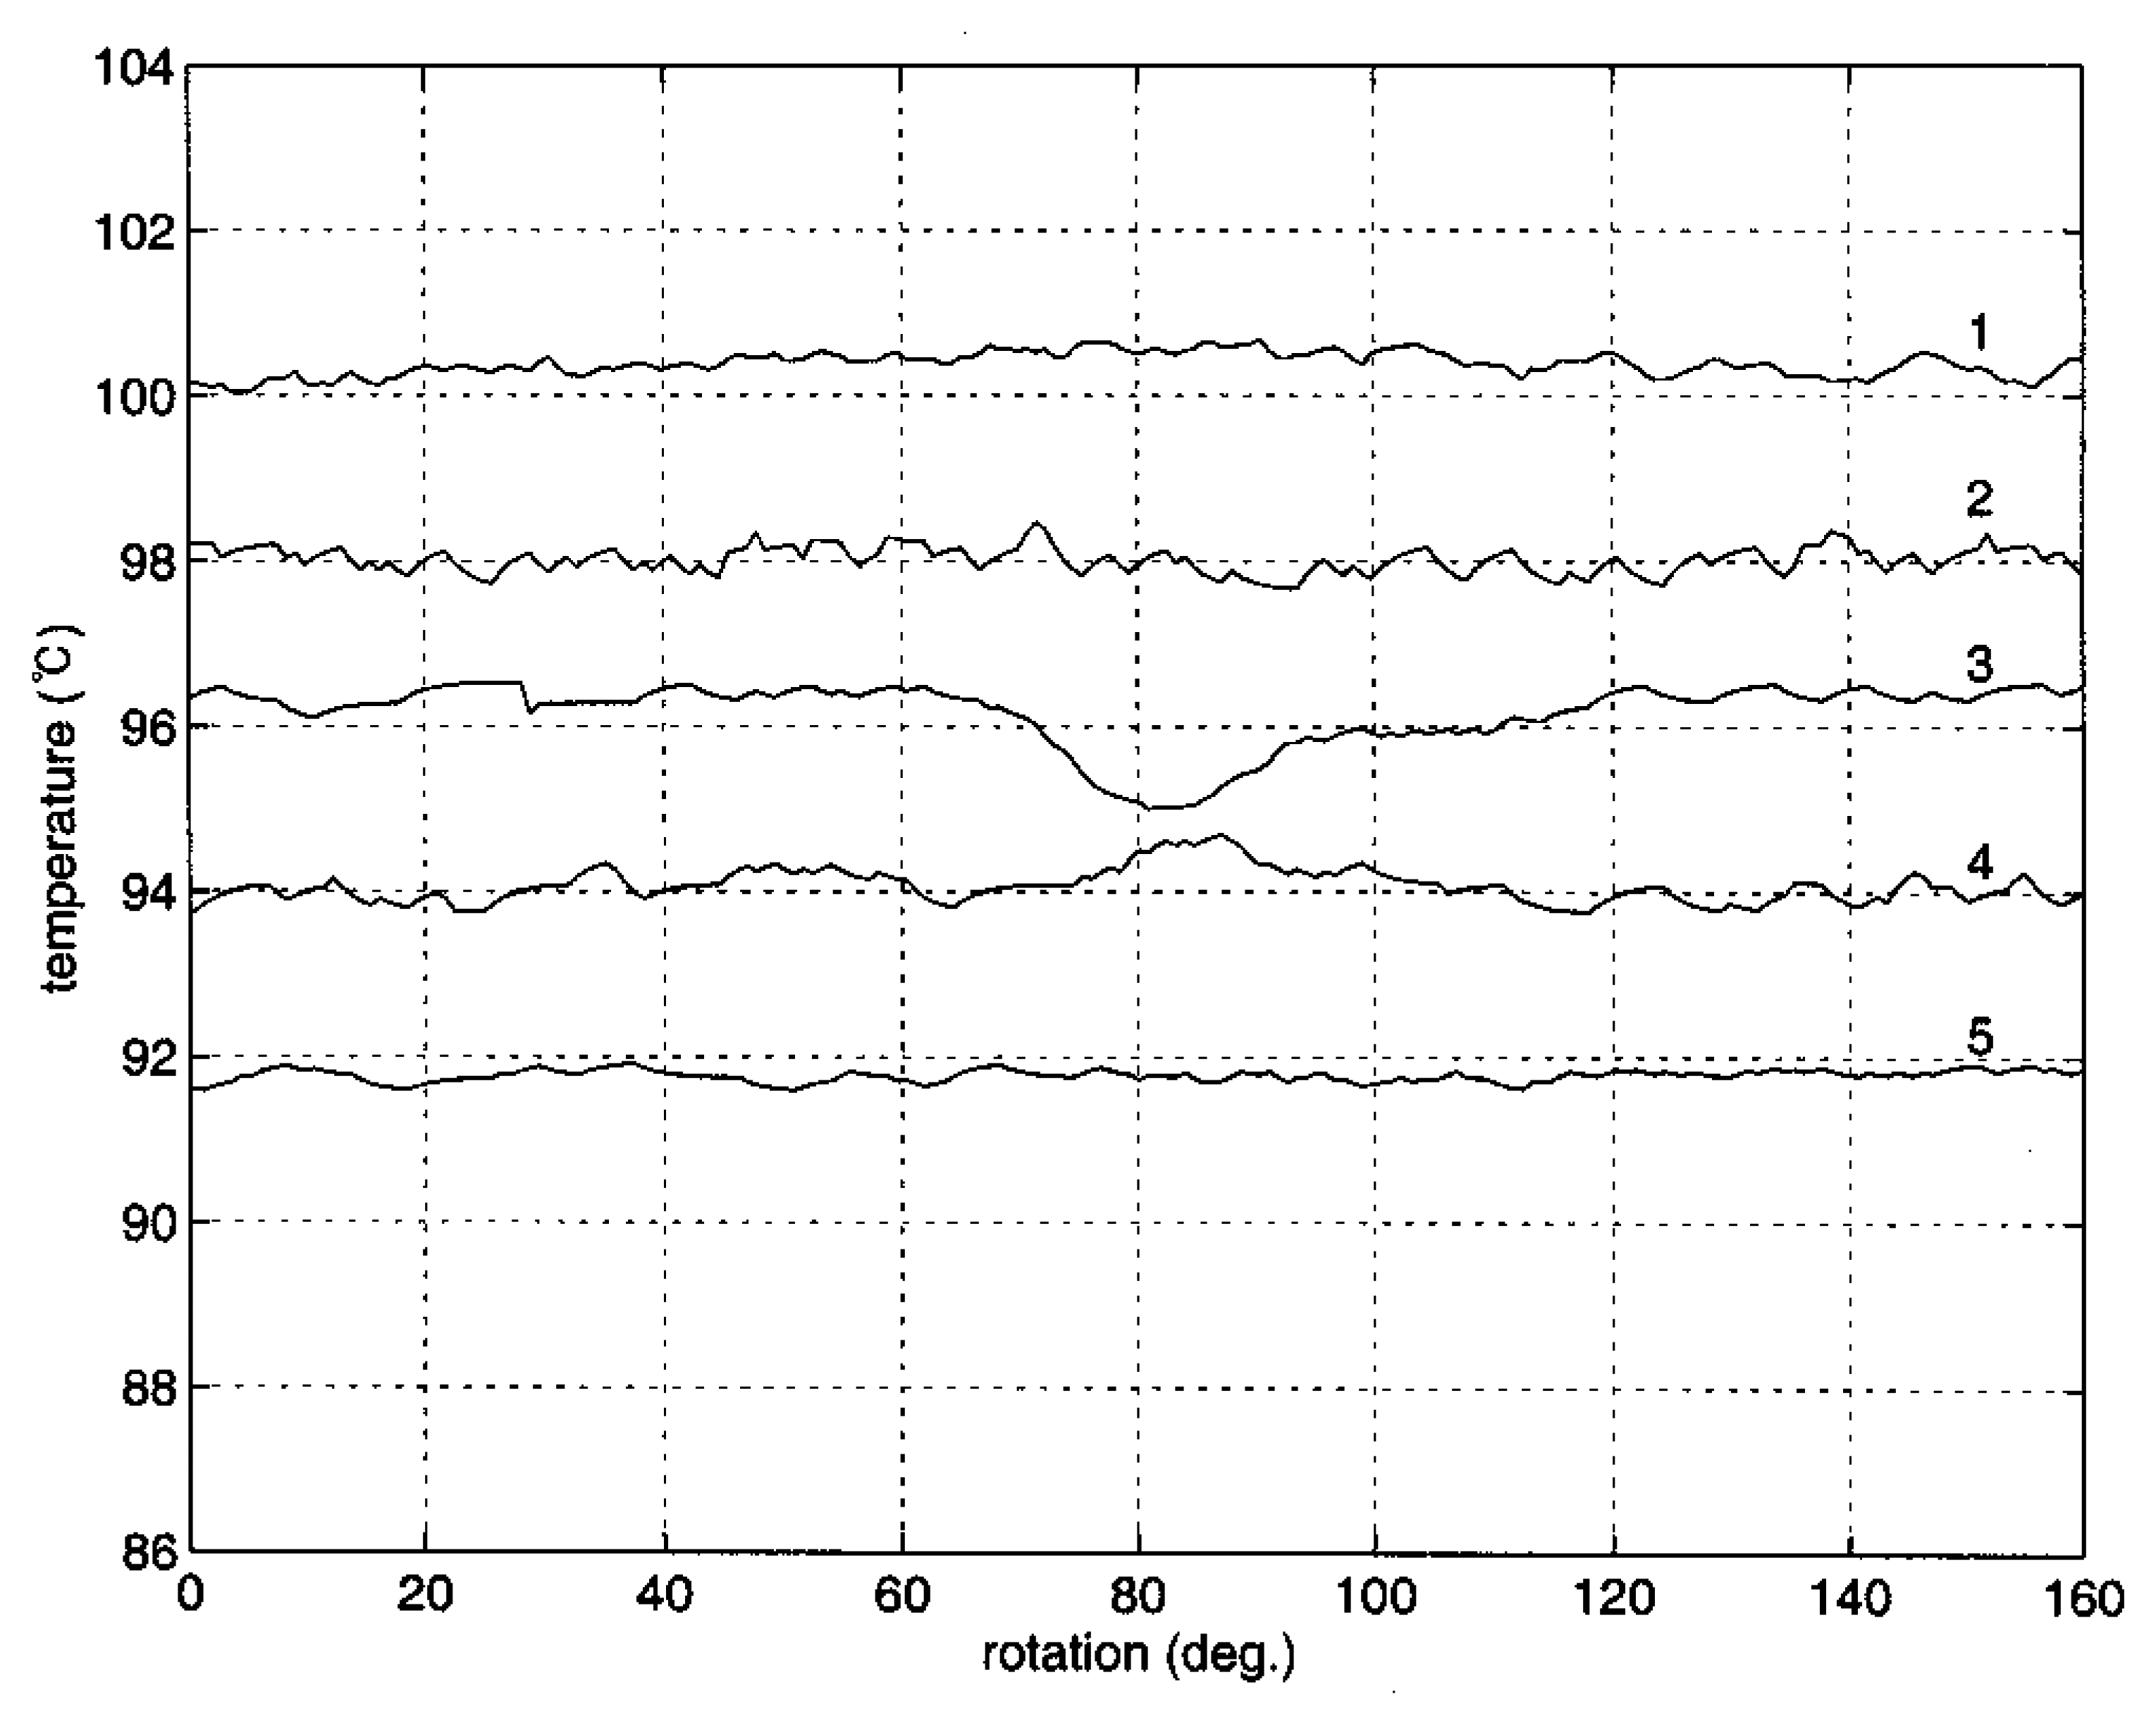
Figure 6 demonstrates the measurements with the pipe top and bottom temperatures of 120°C and 55 °C respectively. Again, the third sensor indicated a significant temperature drop at the middle of the pipe, whereas the rest of the sensors indicated steady temperature profiles. The same procedure was applied with a temperature distribution between 125°C and 60°C, and the outcome is demonstrated in
Figure 7. The temperature variation is similar to what had appeared in the previous measurements.
For numerical analysis of the experimental measurements, the standard deviations of the five sensor measurements are listed in
Table 1. All three runs show a distinct increase in the standard deviation of the third sensor, which passes over the simulated defect. Note that the fourth sensor in Run 1 gave more deviation than the third due to a drift of base temperature. This drift can be readily detected from observation of temperature distribution. As the temperature of the measured object goes higher, the average deviation becomes less, which means that the proposed device works better with the object at a higher temperature. The measurement in this study was also compared with a previous experimental result using the same IR thermometer [
12] as listed in the last row of
Table 1. An apparent reduction of the standard deviation was yielded from the outcome of the present study; in other words, more accurate measurement is available with the newly developed sensor holder. Utilizing the holder reduced the distance between sensors, thus minimizing the undetected area, resulting in closer scanning than the previous study. One other improvement is that maintaining a constant distance between the sensor and the surface of the measured object is conducive to stable temperature measurement.
In addition, the proposed sensor holder is more suitable for practical implementation than the sensor module designed for a plate in the previous study, because most vessels and piping systems used in chemical processes are cylindrical in shape. Moreover, in practical applications the temperature of a metallic object is often sufficiently high that no external heating is necessary as it was in this experiment, which makes it more convenient to utilize the proposed sensor system. Note also that current techniques of nondestructive defect detection require total shutdown of a process to inspect the vessels and reactors, which limits their application.
5. Conclusion
An IR thermographic device for the detection of a groove in a metal plate was modified for cylindrical objects. For easy adjustment of sensor-object distance a sensor holder was developed and utilized to maintain the distance constant. The temperature measurement results show that the modified device not only indicates the location of the simulated defect, but also gives more stable temperature measurement than the thermographic device used previously. Comparison of standard deviations of measurements indicates the accuracy of the defect detection and the improvement in temperature measurement. The measured temperature distribution was also shown to be comparable to the distribution calculated from a conduction equation. Because the proposed device is developed to detect defects in a cylinder, it can be expected to find wide application in chemical processes, where most vessels and piping systems are cylindrical in shape.


