Circuit and Noise Analysis of Odorant Gas Sensors in an E-Nose
Abstract
:Introduction
- (1)
- The sensors in the array interfere with each other.
- (2)
- Different types of sensors are used, some of which have large heating current and power dissipation.
- (3)
- Some sensors require amplifiers with extremely high input impedance (e.g., higher than 1011 Ohm) that makes them susceptible to interference.
- (4)
- Some sensors have large dynamic current that produces electromagnetic disturbances to the output of other sensors in the same array.
- (1)
- The sensors are very sensitive to temperature and humidity.
- (2)
- The baseline of sensors shifts with time.
- (3)
- Large noise exists in sensor output.
Typical gas sensors and their noise
Resistive gas sensors
Gas sensors with electromotive output
Sensors with dynamic heating
Gas sensors with current output
Probability distribution function (pdf) of noise
- 1)
- How to measure the error between f̂n (x) and the real probability distribution function f (x) ?, and
- 2)
- What is the optimal h that makes the approximation of f̂n (x) to f (x) the best?
Power spectrum estimation of noise
Experiment results
- (1)
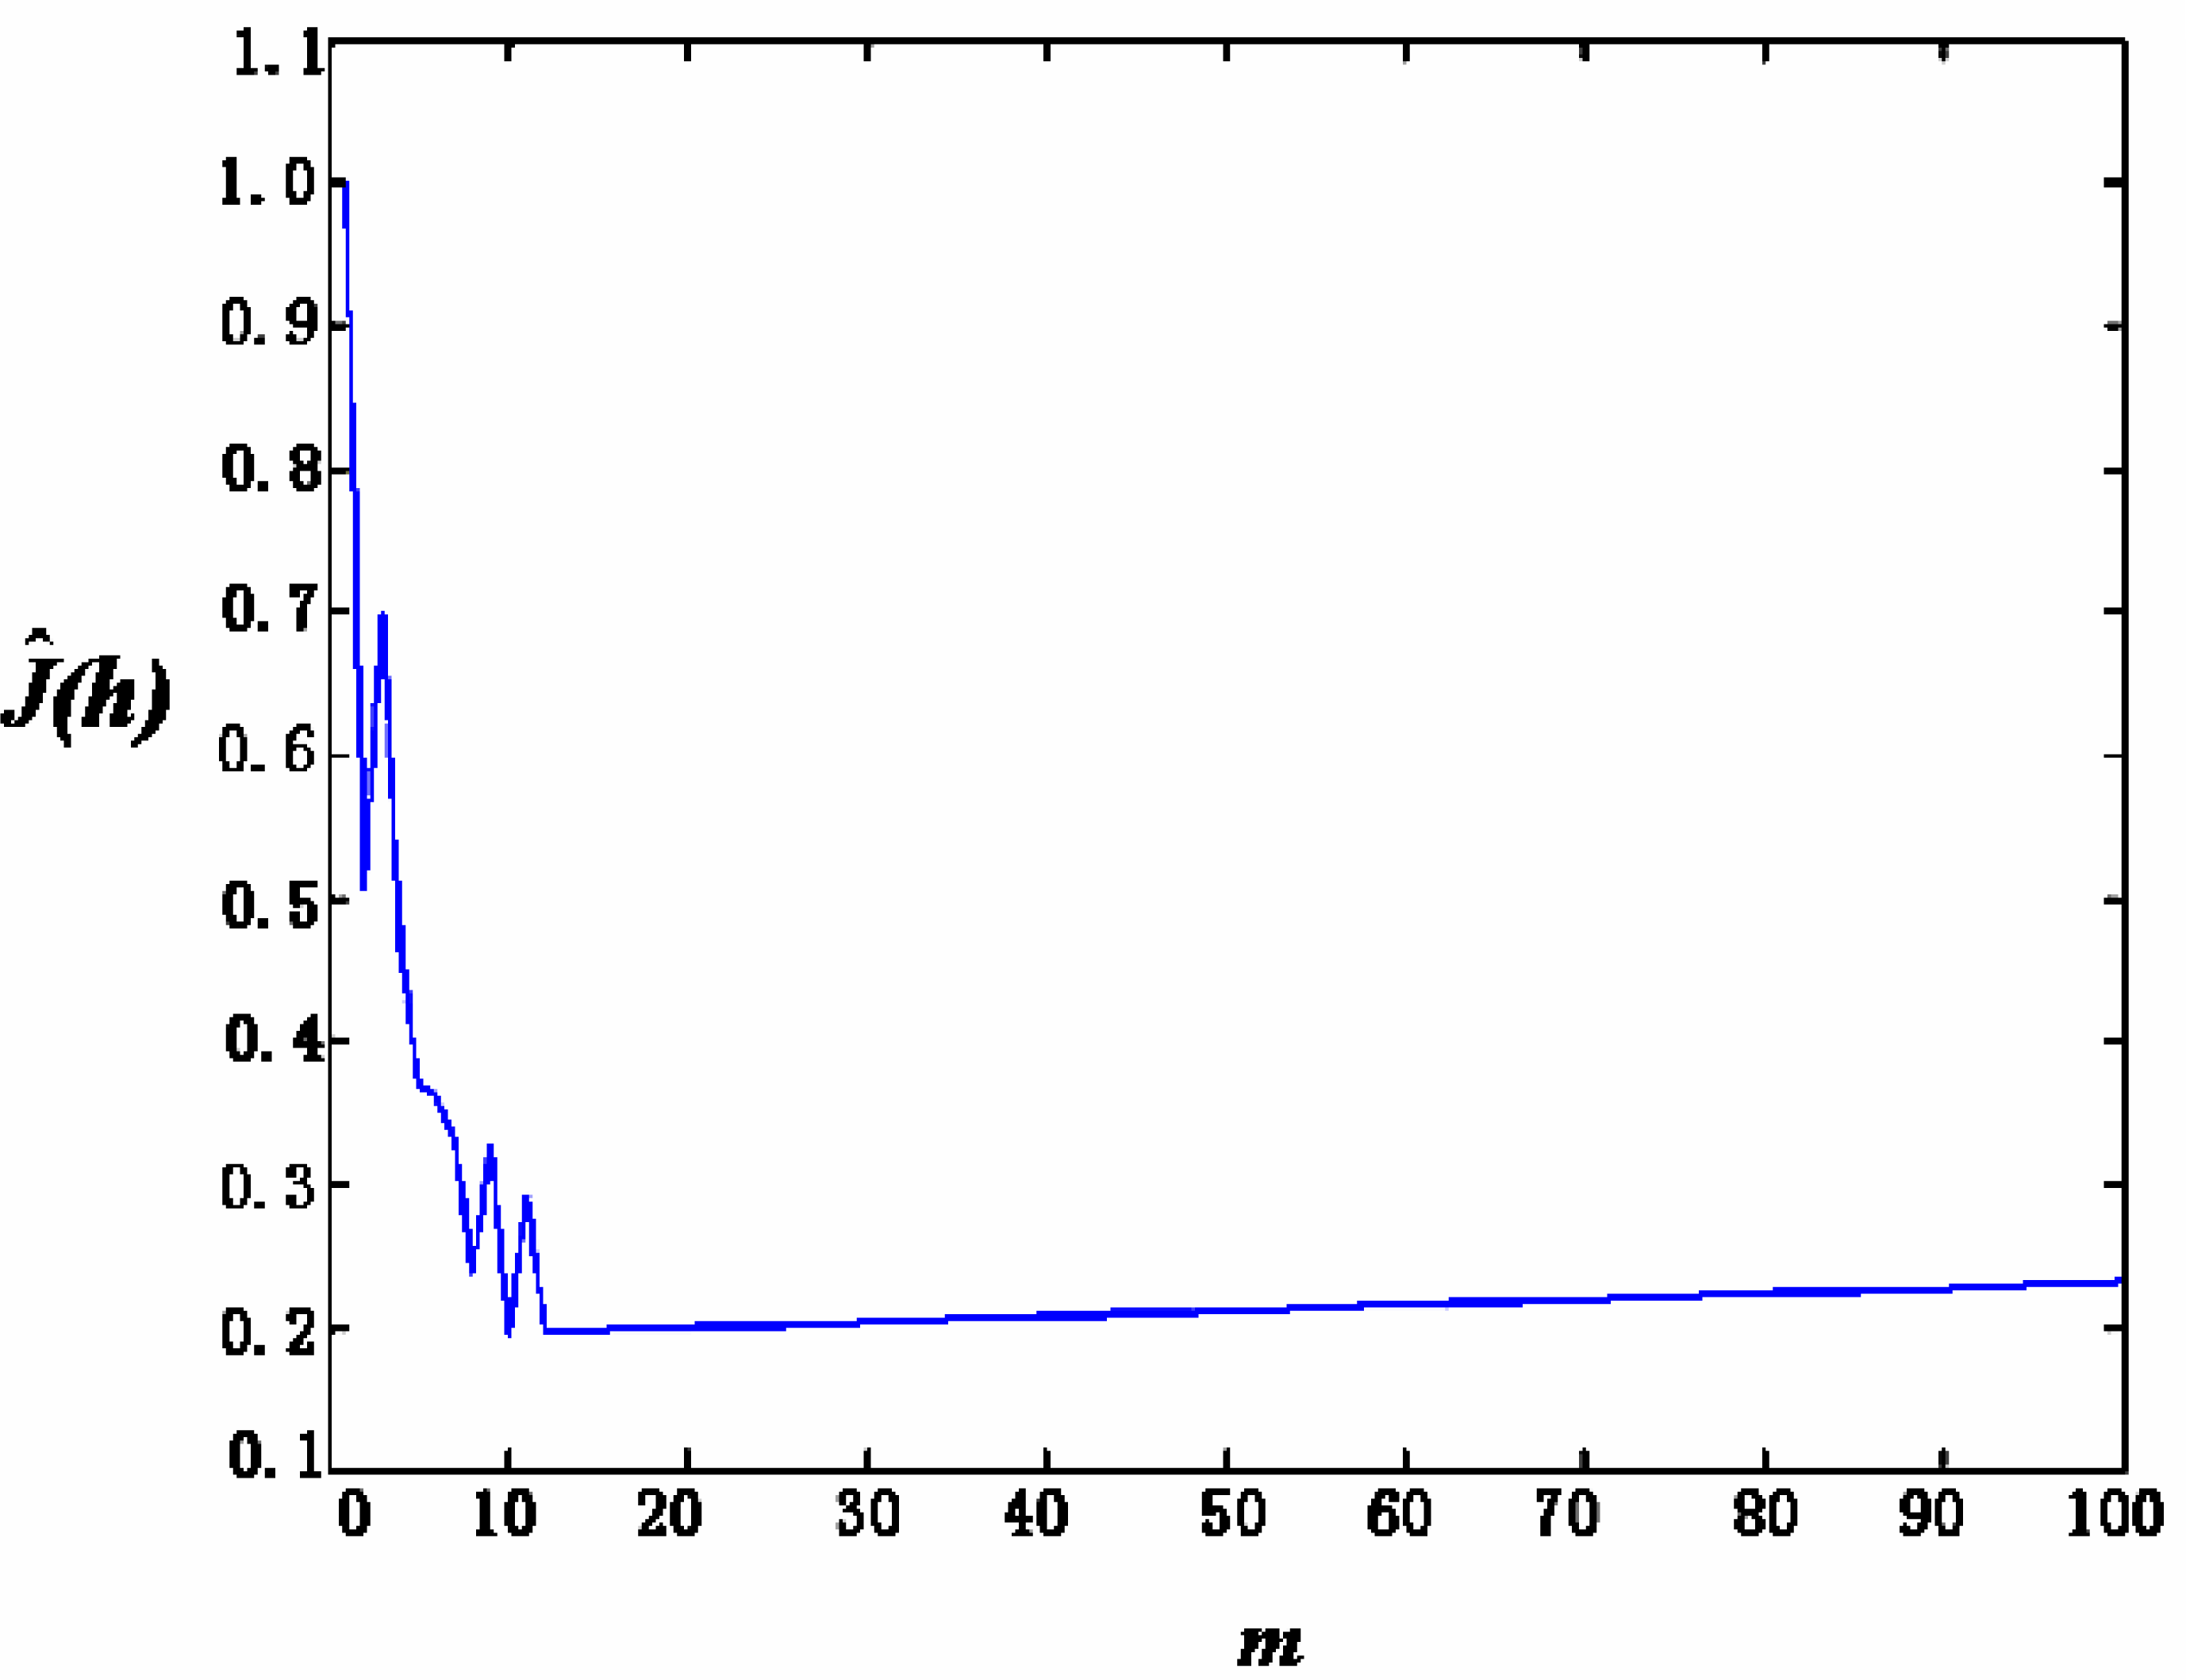
- For the case of coloured noise with a single peak pdf, Figures 8(a) and 8(b) show the time-domain curve and the power-spectrum estimation curve, respectively. It shows that the power spectrum of noise mainly consists of two parts: one is the almost constant-magnitude part filling the whole frequency band, and the other is composed of some lower frequency components that may be caused by some inherent feature of the sensor and its circuit. Some of them have the same frequency as signal; it cannot be filtered out by just a simple low-pass filter.Figure 9 shows the curve of Ĵ(h) from Equation (4) with h = 1/m. It can be seen that when m = 10, i.e., h = 0.1, Ĵ(h) reaches its minimum that makes the risk function R (f, f̂; minimum. The h value at h = 0.1 makes the estimation of pdf to be optimal. Figure 10 gives the pdf estimation under this h value. It is close to a Gaussian distribution.
- (2)
- In the case of white noise with single peak, the noise in time domain and its power-spectrum estimation curve are shown in Figures 11(a) and 11(b), respectively. The pdf estimation is shown in Figure 11(c) with the optimal value at h = 1/75. It is similar to a Gaussian distribution. The envelop of the noise power spectrum is almost constant in the whole band. Thus, it is reasonable to consider this type of noise as normal white noise. For the sensors 3SH (current output) and TGS4160 (electromotive), their output signals are too weak and the gain of amplifier has to be large enough (about 6,000), or the input impedance is too high (more than 1011 Ohm). The noise energy of these sensors is much bigger than that of the first type in Table 1, which implies that the noise in this type of sensor cannot be ignored.
- (3)
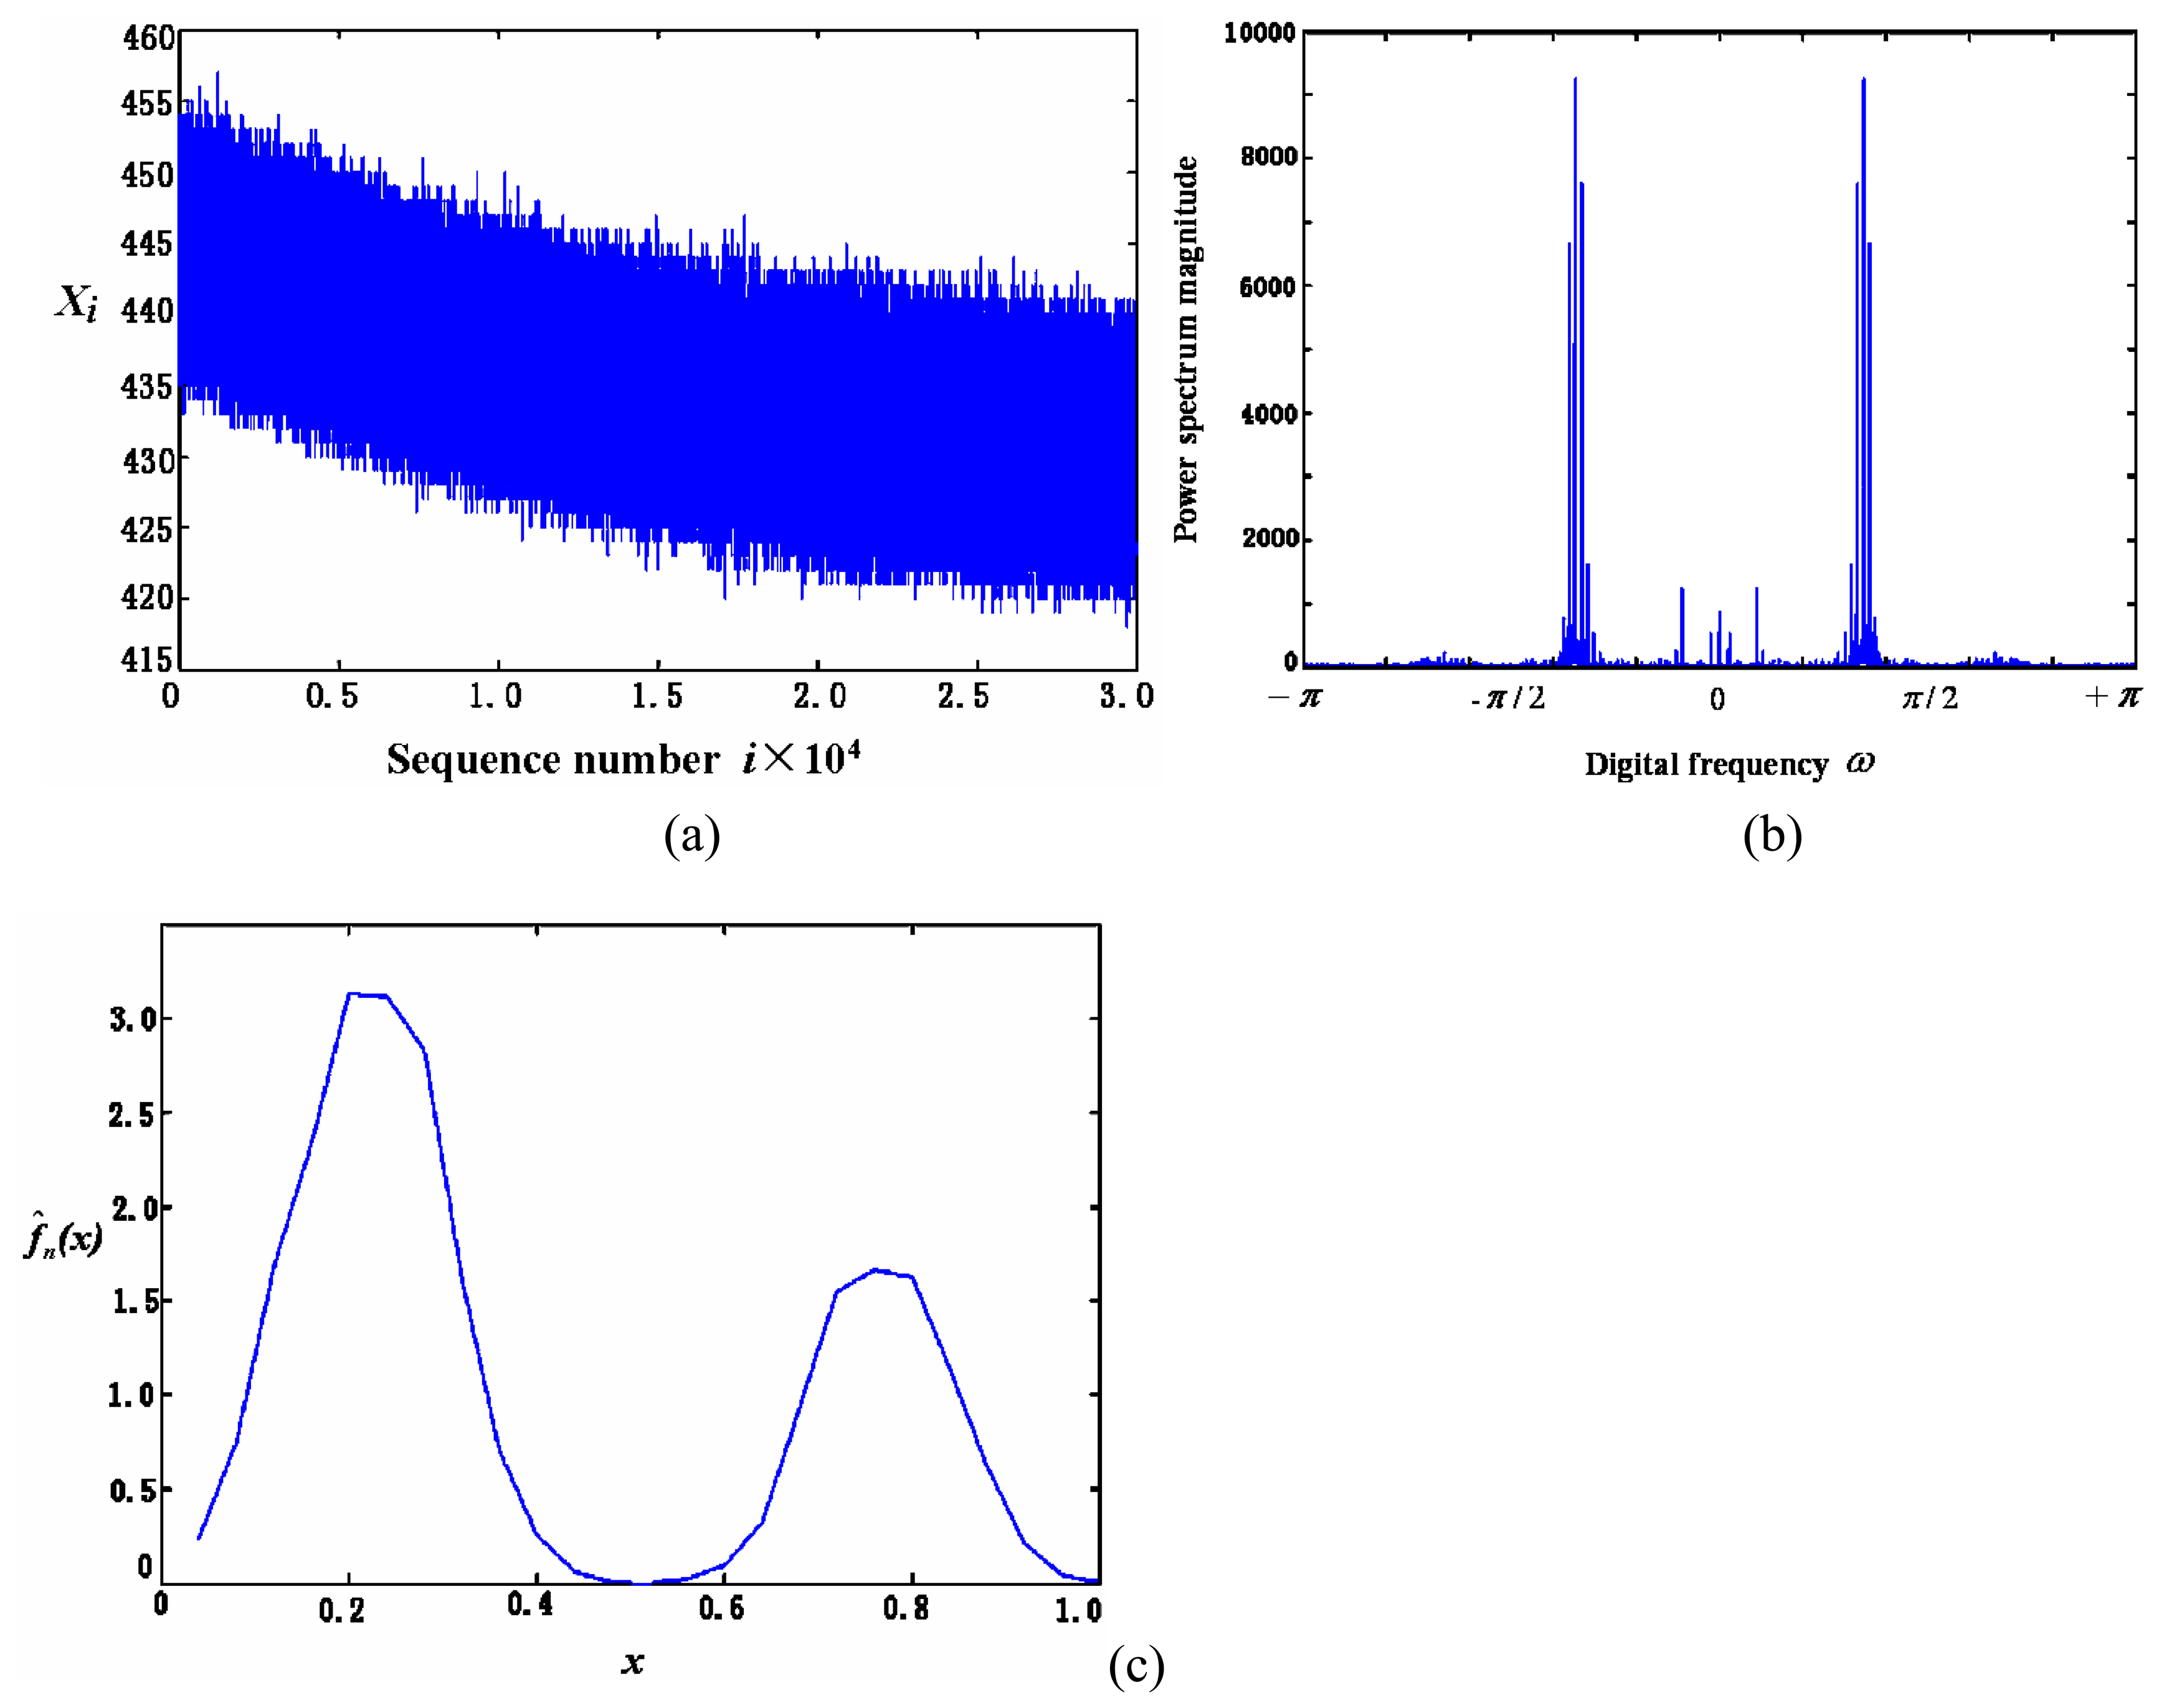
- For the coloured noise with double peak pdf, Figures 12(a) and 12(b) show the noise in time domain and its power spectrum estimation of sensor, respectively. Figure 12(c) is the estimation of pdf with the optimal value at h = 1/29. In comparison to the first type of sensors in Table 1, both have similar coloured noise power spectrum and many of their low frequency components have the same location in the frequency domain. This implies that the inherent features of the sensors are similar, as they are produced by the same manufacturer. The only obvious difference here is that its pdf has double peaks, while the first type has only one. The double peaks in its pdf imply the high appearance frequency of these two types of noise magnitude.
- (4)
- For some sensors such as TGS830, TGS2600, the remarkable difference exists in their zero frequency component of noise power spectrum between the periodical graphs and averaged segmenting periodical graph methods. This can be observed when comparing Figure 12(b) and Figure 13. No peak appears in the nearby zero frequency of the averaged segmenting periodical graph in Figure 12(b), which is opposite to its counterpart in Figure 13. It is due to the fact that the sensor baseline shifts slowly within the whole time period (the total 30,000 data sets), although in both methods the mean is removed. Whereas in each small section (5,000 data sets) the baseline changes little and results in almost no nearby zero frequency component. That indicates, of all sensors tested, the three types of sensors can work more stably and have much smaller baseline shift than other sensors.
Conclusions
- Since the sensors only work with its corresponding circuits as a whole, the sensor noise here means the whole noise from the sensor and its amplifying circuit. The noise is related to the art of manufacture, the input impedance of amplifier and its gain. In our experiment, the optimal operating circuits and devices recommended by the manufacturers are adopted. So it is reasonable to believe those e-noses which use the same type of sensors have similar circuit structure and noise feature as we give here.
- The noise in the sensors of the e-nose can be categorized into coloured or white noise according to its power spectrum. The coloured noise can be regarded as the white noise plus some stronger low frequency components. The pdf of noise is of either single peak or double peaks.
- The noise of resistive gas sensor is coloured one.
- The white noise lies in either electromotive sensor or sensor with current output, which is due to either the weak signal or the high input impedance.
- To estimate the pdf of noise, we have used the optimal width (h) for bins in histogram that results in the closest estimation to the real pdf in the sense of smallest integrated mean squared error. The averaged segmenting periodical graph estimation of noise power spectrum is an asymptotic consistent estimator of the real power spectrum. The error of estimation is expected to be small enough considering the huge number of data sets.
- The baseline shift of sensor can be observed through comparing the periodical graph and the averaged segmenting periodical graph of noise. Of all the sensors tested, the three sensors TGS830, TGS2600, TGS2602 can work more stably and have smaller baseline shift than others. They almost have no baseline shift in each small section of 5,000 data sets (corresponding to 13 minutes or so). But in the whole period of 30,000 data (corresponding to 1.5 hours), there is still baseline shift.
References
- Pearce, T.C. Handbook of machine olfaction: electronic nose technology; Wiley-VCH: Weinheim, 2003; Chap. 5. [Google Scholar]
- Gardner, J.W.; Bartlett, P.N. Electronic noses principles and applications; Oxford University Press Inc.: New York, 1999. [Google Scholar]
- Hurst, J.W. Electronic noses and sensor array based systems: design and applications. In Proceedings of the 5th International symposium on Olfaction and the Electronic Nose; Pennsylvania, 1999. [Google Scholar]
- Schiffman, S.S.; Bennett, J.L.; Raymer, J.H. Quantification of odours and odorants from swine operations in North Carolina. Agricultural and Forest Meteorology 2001, 108, 213. [Google Scholar]
- Goodner, K.L.; Dreher, J.G.; Rouseff, R.L. The dangers of creating false classifications due to noise in e-nose and similar multivariate analyses. Sens. Actuators B 2001, 80, 261. [Google Scholar]
- Wang, Y.; Zhang, C. A novel methodology to cancel the additive coloured noise for real-time communication application. IEICE Transactions on Electronics 2002, 85, 480. [Google Scholar]
- Biswal, B.; DeYoe, E.A.; Hyde, J.S. Reduction of physiological fluctuations in fmri using digital filters. Magnetic Resonance in Medicine 1996, 35, 107. [Google Scholar]
- Friedrichs, M.S. A model-free algorithm for the removal of baseline artifacts. Journal of Biomolecular NMR 1995, 5, 147. [Google Scholar]
- Solis, J.L.; Kish, L.B.; Vajtai, R.; Granqvist, C.G.; Olsson, J.; Shnurer, J.; Lantto, V. Identifying natural and artificial odors through noise analysis with a sampling-and-hold electronic nose. Sens. Actuators B 2001, 77, 312. [Google Scholar]
- Wasserman, L.A. All of statistics: a concise course in statistical inference; Springer: New York, 2004. [Google Scholar]
- Mulgrew, B.; Grant, P.; Thompson, J. Digital signal processing; Palgrave: New York, 1999. [Google Scholar]


| Single peak | Double peaks | |
|---|---|---|
| Power spectra | ||
| Coloured noise | (1) TGS813 etc. | (3) TGS830 etc. |
| White noise | (2) 3ETO etc. | N/A |
© 2005 by the authors; licensee MDPI, Basel, Switzerland. This article is an open access article distributed under the terms and conditions of the Creative Commons Attribution license ( http://creativecommons.org/licenses/by/3.0/).
Share and Cite
Tian, F.; Yang, S.X.; Dong, K. Circuit and Noise Analysis of Odorant Gas Sensors in an E-Nose. Sensors 2005, 5, 85-96. https://doi.org/10.3390/s5010085
Tian F, Yang SX, Dong K. Circuit and Noise Analysis of Odorant Gas Sensors in an E-Nose. Sensors. 2005; 5(1):85-96. https://doi.org/10.3390/s5010085
Chicago/Turabian StyleTian, Fengchun, Simon X. Yang, and Kevin Dong. 2005. "Circuit and Noise Analysis of Odorant Gas Sensors in an E-Nose" Sensors 5, no. 1: 85-96. https://doi.org/10.3390/s5010085
APA StyleTian, F., Yang, S. X., & Dong, K. (2005). Circuit and Noise Analysis of Odorant Gas Sensors in an E-Nose. Sensors, 5(1), 85-96. https://doi.org/10.3390/s5010085


