1. Introduction
UAV swarms have provided new application scenarios and technical solutions due to their advantages of low cost, large-scale deployment capability, high autonomy, and multi-platform collaboration [
1,
2]. With the continuous increase in the number of UAVs in swarm networks, network density is growing, and the types, scale, and quality requirements of services supported by the network are constantly rising, thereby imposing new and higher demands on the networking communication capabilities of UAV swarms.
The SPMA protocol is an emerging and promising wireless MAC protocol that is widely used in UAV networks [
3]. By comprehensively adopting mechanisms such as channel load statistics, multi-priority processing, and random contention access, the SPMA protocol can ensure that the TTNT network accommodates more than 100 nodes while maintaining a transmission delay of no more than 2 ms and a transmission success rate of no less than 99% for high-priority services [
4]. Therefore, compared with two classic MAC protocols (CSMA [
5] and TDMA [
6]), the SPMA protocol is more suitable for the communication needs of UAV swarm networks.
Current research on the SPMA protocol mainly focuses on the optimization of mechanisms such as channel load statistics, transmission threshold setting, and random backoff, while increasingly adopting machine learning and deep learning methods to intelligently adjust multiple protocol parameters. Equations for the slot transmission probability are derived, and a resource reservation minimization strategy among priorities is adopted to set low-priority thresholds [
7]. A dynamic threshold adjustment mechanism and an adaptive backoff window mechanism are designed to improve system throughput and packet transmission success rates [
8]. A non-preemptive M/M/1/K queuing model is established, and a percentile scoring system combined with a Q-learning algorithm is designed to optimize protocol parameters based on this model [
9]. A channel load prediction model based on a bi-directional long short-term memory (BiLSTM) neural network is developed, which significantly improves prediction accuracy compared with conventional weighted average-based prediction methods [
10]. An Adaptive Credit-Based Shaper with Reinforcement Learning (ACBS-RL) scheduling mechanism is proposed to allocate more transmission opportunities to low-priority services while preferentially satisfying the quality-of-service requirements of high-priority services, thereby improving overall system throughput [
11]. A novel model containing two deep Q-learning networks (DQN) is designed, in which a transmission network is used to increase transmission opportunities for low-priority services and a backoff network is used to optimize the backoff mechanism, achieving better throughput and delay performance [
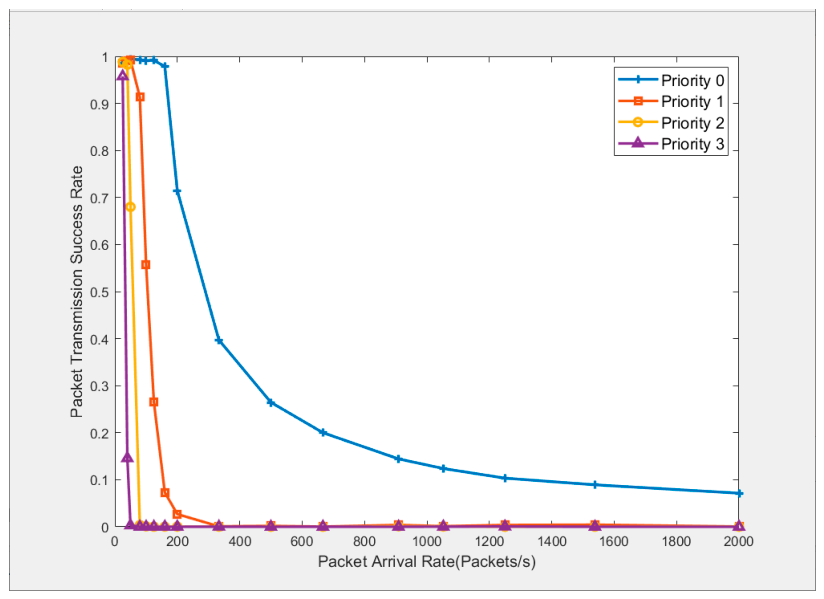
12]. Although the above studies improve the performance of the SPMA protocol to a certain extent, none of them break through the inherent limitation that the SPMA protocol relies on multiple frequency channels for large-scale networking [
7,
13]. Under the condition of limited frequency resources, existing research is insufficient to meet the demands of large-scale UAV swarm networking in terms of node quantity and traffic volume.
Clustering is an effective approach to optimize network topology, reduce routing overhead, and improve energy efficiency and scalability in wireless ad hoc networks [
14,
15]. As a typical clustering algorithm, LEACH achieves energy balance through random rotation of cluster heads, but tends to aggravate intra-cluster interference and introduce excessive inter-cluster routing hops in large-scale scenarios [
16,
17]. HEED improves energy efficiency by introducing residual energy and link quality metrics, but still fails to fully guarantee multi-service QoS in dynamic environments [
18]. In recent years, intelligent optimization algorithms have driven clustering techniques toward higher efficiency and adaptability, and mainstream solutions can be divided into two categories. The first category is swarm intelligence-based metaheuristic clustering algorithms, which achieve more stable cluster structures and lower energy consumption via multi-objective optimization: GWO models cluster head election as a wolf pack search problem [
19]; MWCRSF implements weighted dynamic cluster head election using a sparrow search algorithm [
20]; ICW constructs a centralized clustering framework based on a whale optimization algorithm and exhibits outstanding performance in cluster lifetime and energy consumption optimization [
21]. The second category is machine learning clustering algorithms represented by K-means, which are widely used due to their low complexity and fast convergence: a dynamic transmission power adjustment scheme for cluster heads is adopted to enhance link stability [
22]; the optimal number of clusters is adaptively determined according to topology changes to realize lightweight and efficient clustering [
23].
With the popularization of deep learning (DL) in communication networks, DL-based clustering algorithms have gradually emerged. For example, a DQN-based clustering strategy is proposed for dynamic topology in UAV networks, where deep neural networks are used to replace traditional table lookup methods and effectively solve the curse of dimensionality in large-scale state spaces [
24]. A graph neural network (GNN) is combined with the HEED protocol to implement energy-efficient clustering in heterogeneous networks by learning topological relationships [
25]. Deep reinforcement learning methods, including Q-learning, DQN, and DDPG, are adopted to achieve cross-layer clustering and cooperative optimization of vertical and horizontal routing in Flying Ad Hoc Networks [
26]. Although DL-based clustering has significant advantages in dynamic adaptability, it generally suffers from high computational complexity, weak interpretability, and high deployment cost, making it difficult to be directly applied to UAV swarm networking scenarios with strict resource constraints and high real-time requirements.
Clustering integrated with the SPMA protocol offers three key benefits for large-scale UAV swarm networking. First, clustering reduces inter-cluster data interactions. Periodic broadcast services, such as swarm networking, only communicate within clusters and among a small number of cluster heads, while inter-cluster services exchange data among limited nodes without full-network participation. Second, clustering suppresses mutual interference across clusters. Most member nodes transmit at low power to cover only their cluster heads, resulting in weak or negligible inter-cluster interference and a higher data transmission success rate. Third, clustering boosts network capacity. Reduced inter-cluster interference raises the success rate of simultaneous transmissions under the contention-based SPMA protocol, allowing the network to support more nodes and services. Making full use of these benefits can effectively offset performance degradation caused by frequency constraints and better satisfy communication demands in large-scale UAV networks.
The main contributions and novelty of this paper are as follows:
This paper identifies the inherent performance bottleneck of the SPMA protocol in frequency-constrained UAV swarm networks and proposes a unified framework that jointly optimizes clustering structure, routing, and transmission power. To the best of our knowledge, this is the first attempt to systematically address severe channel contention in SPMA-based UAV swarms.
This paper constructs a multi-service utility function centered on the end-to-end transmission success rate and formally models the optimal clustering problem as a constrained combinatorial optimization problem. The model quantitatively captures the opposite effects of cluster count on intra-cluster and inter-cluster performance, which provides a solid theoretical basis for subsequent joint optimization.
This paper designs a three-stage hybrid heuristic algorithm that integrates clustering, routing refinement, and power adjustment. The proposed pipeline efficiently transforms the original NP-hard problem into a polynomial time solvable form, significantly improving both efficiency and real-time performance.
Comprehensive experimental results demonstrate that the proposed scheme achieves significant gains in transmission reliability and power efficiency. The proposed design offers a practical and effective solution for large-scale UAV swarm communication under stringent frequency constraints.
The rest of this paper is organized as follows:
Section 2 analyzes the SPMA bottlenecks.
Section 3 describes the system model.
Section 4 derives the theoretical performance.
Section 5 presents the hybrid algorithm.
Section 6 shows the simulation results, and
Section 7 discusses the comparative advantages.
Section 8 concludes the work.
3. System Model and Problem Description
3.1. System Model
Consider a UAV swarm composed of N UAV nodes, supporting M types of priority services, with the entire network only supporting one communication frequency channel. The transmission power of UAV nodes can be adjusted in P levels within the range . When each node takes off, it first uses the maximum transmission power to form a fully connected network and broadcasts its geographic location information through the highest-priority swarm networking service. The predefined global control node executes the power-controlled clustering algorithm in a centralized manner based on the location information of each node and the priority services to be run by each node, and broadcasts the calculated optimal clustering scheme and power configuration scheme to the entire network through swarm networking service packets, thereby reconstructing the fully connected network into clusters with minimal mutual interference. Denote the clustering set as , where all nodes belong to exactly one cluster, and each cluster has exactly one cluster head node and the rest are member nodes. The basic requirements for clustering and power configuration are: member nodes in each cluster can communicate directly with the cluster head; any cluster heads can communicate directly or in multi-hop form; to support specific inter-cluster services, the source and destination nodes of the service can communicate directly or in multi-hop form, and the nodes completing the forwarding can be either cluster head nodes or member nodes.
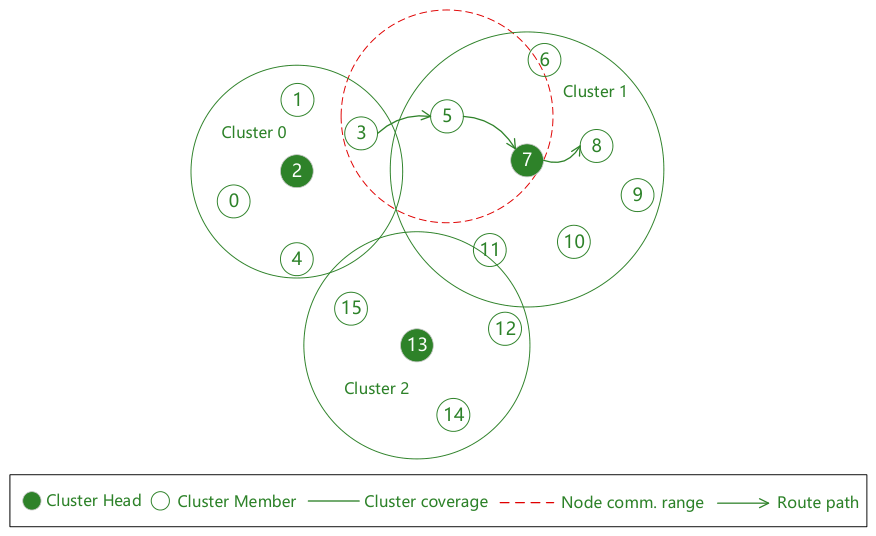
The core advantage of forming a clustered network through power control is that a smaller transmission power can be adopted according to the communication needs of specific services, confining interference to a small range, significantly improving the intra-cluster transmission success rate, and also increasing the success rate of simultaneous transmission between different clusters, thereby increasing the network capacity. As shown in
Figure 3, when node 0 broadcasts its swarm networking service data to node 2, it will only be interfered with by nodes 1, 3 and 4; moreover, nodes 0 and 10 can broadcast their respective swarm networking service data simultaneously without causing interference to each other’s receiving nodes.
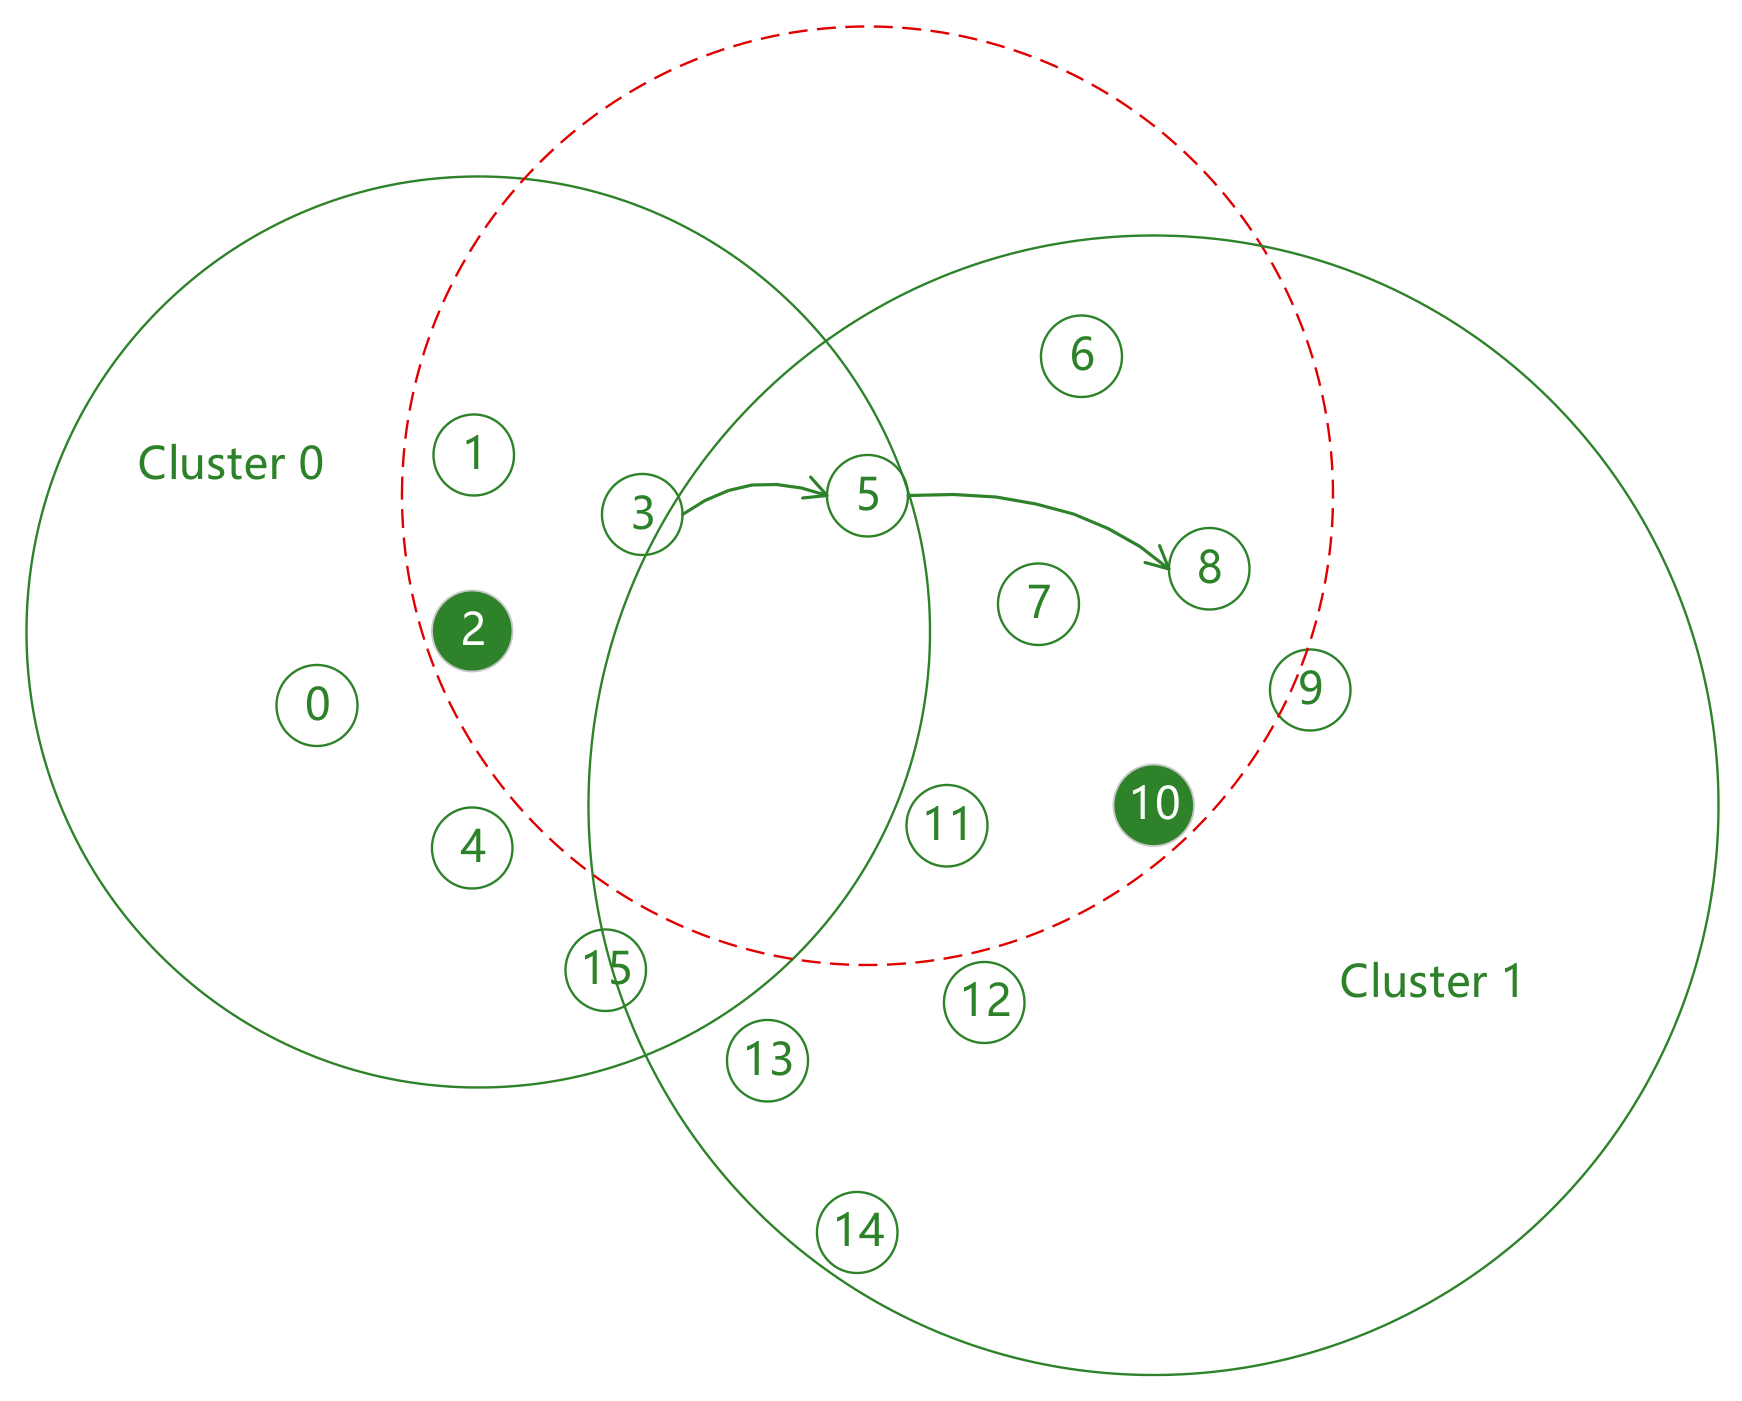
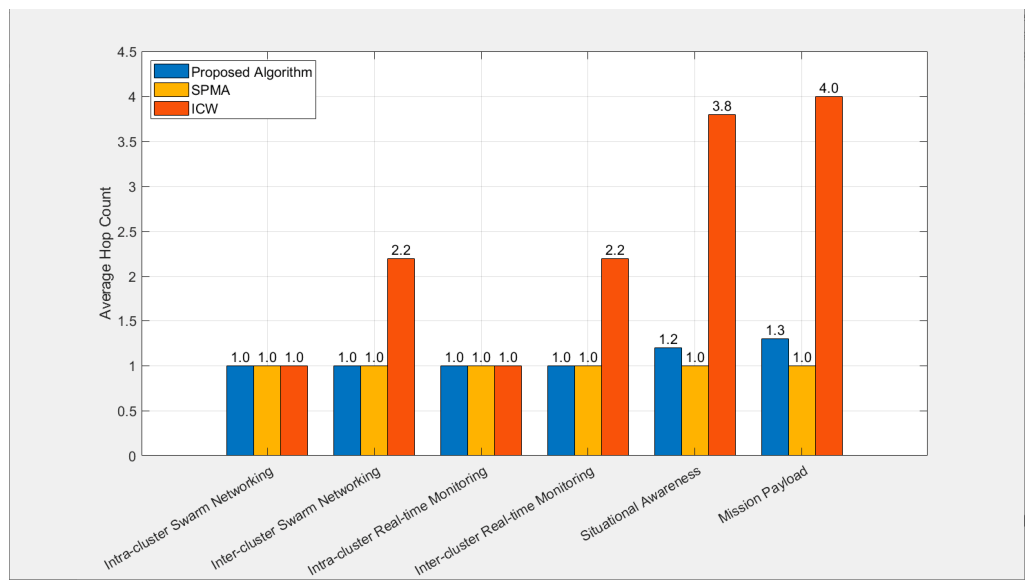
However, on the other hand, more clusters are not always better. Since cluster head nodes also need to broadcast swarm networking services, as the number of clusters increases, the number of cluster head nodes also increases, which will inevitably lead to a decrease in the transmission success rate of swarm networking services between cluster heads. At the same time, there are many other types of services in UAV swarms that need to communicate between any two nodes in the entire network. Under power control, multi-hop transmission is usually required. Obviously, the more clusters there are, the smaller the transmission power of member nodes, and the lower the end-to-end transmission success rate. As shown in
Figure 3, when node 3 transmits situational awareness services to node 8, three hops are required; while if divided into two clusters as shown in
Figure 4, only two hops are needed.
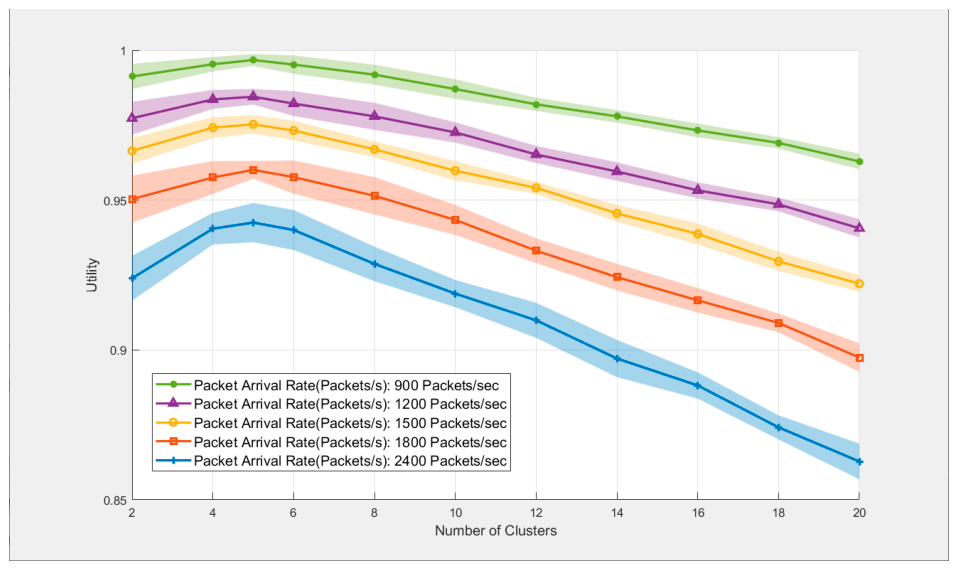
It can be seen that the number of clusters, clustering method, and power configuration have a direct impact on the quality of service of various services. Among them, the number of clusters has a crucial and opposite impact on the quality of service of intra-cluster and inter-cluster services. Therefore, when both types of services exist, the appropriate number of clusters must be a compromise value. To determine the optimal clustering scheme, the following optimization objective is to maximize the quality of service across all services.
It should be clarified that the proposed system uses a centralized decision-making framework relying on global location information and predefined service requirements. It is suitable for UAV swarms with a leader or command node in formation flight and cooperative missions. The global control node only executes clustering and power optimization once at network initialization, so it introduces no communication bottlenecks or extra signaling overhead. This work focuses on verifying the theoretical feasibility and performance gain of joint optimization for the SPMA protocol in frequency-constrained scenarios.
3.2. Problem Description
Define
as the quality of service obtained by priority service
s supported by node
i under clustering scheme
:
where
denotes the end-to-end transmission success rate of priority service
s data packets sent by node
i under clustering scheme
, and
denotes the required packet transmission success rate of priority service
s.
On this basis, let the utility function
represent the weighted sum of the quality of service of all priority services under clustering scheme
:
where
denotes the average value of
of all nodes supporting priority service
s,
denotes the weight of priority
s, and
. Then, the problem of selecting the optimal clustering scheme is modeled as choosing the clustering scheme with the maximum utility function under several constraints:
where
indicates whether node
i belongs to the
k-th cluster
, and
indicates whether node
i is the cluster head node of
. Therefore, Equation (4) ensures that each node belongs to exactly one cluster, Equation (5) ensures that each cluster has exactly one cluster head, and Equation (6) ensures that the transmission power
of any node
i is within the range
.
In the following section, theoretical modeling and quantitative analysis are performed on the end-to-end packet transmission success rate of the SPMA protocol and the optimal clustering scheme in clustered multi-hop networks.
4. Theoretical Analysis of the Optimal Clustering Scheme
4.1. Queuing Model of the SPMA Protocol
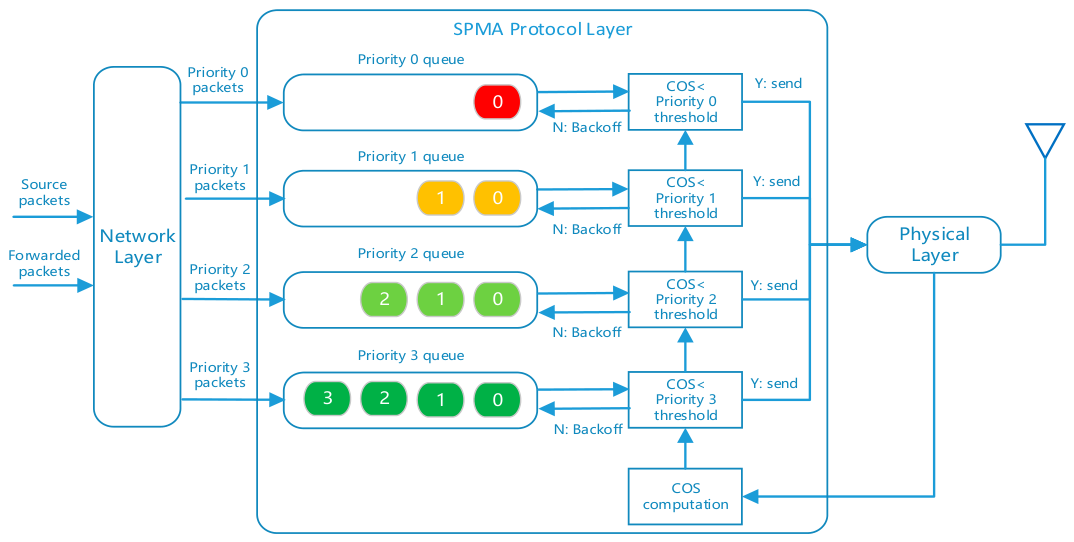
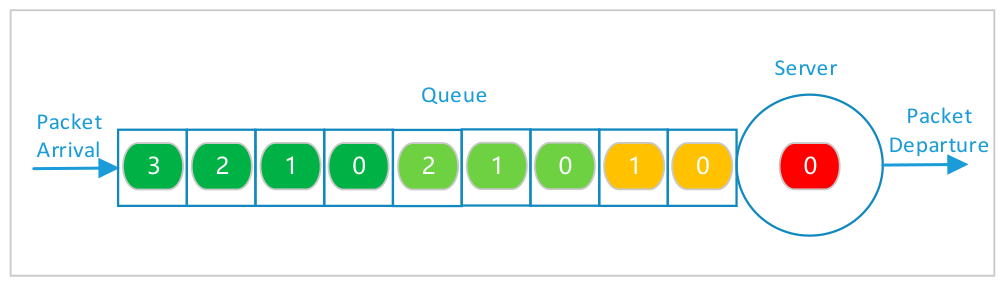
The operational logic of the SPMA protocol in clustered UAV swarm networks can be modeled by a preemptive M/G/1 queuing model, as illustrated in
Figure 5. In this tailored model, the notation “M” denotes that the arrival process of data packets (both source packets and forwarded packets) adheres to an independent Poisson distribution, consistent with the randomness of UAV mission traffic. “G” represents that the service time of data packets follows a general distribution, considering the dynamic variations in transmission latency caused by cluster topology changes and power control adjustments. The symbol “1” indicates that each node operates with a single-frequency channel, corresponding to a single-server configuration in the queuing model—meaning the departure process of data packets follows a single-channel transmission constraint, where only one data packet can be transmitted at any given time. Consistent with the preemptive priority design of the SPMA protocol, the queuing model enforces a strict scheduling rule: data packets with higher service priorities are granted absolute transmission precedence and are placed at the head of the queue. For packets of the same priority, the first-come-first-served (FCFS) principle is adopted to ensure fair access to the channel, where packets arriving earlier are scheduled for transmission prior to subsequent ones.
In the following section, the M/G/1 queuing model is used to derive the end-to-end transmission success rate of data packets in the SPMA protocol in multi-hop and clustered networks.
4.2. Slot Transmission Probability
Assume that the arrival process of data packets of each priority service generated by each node in the network as a source node follows an independent Poisson distribution. Then, the probability that node
i generates
k data packets of priority
s within time
t is:
where
is the arrival rate of data packets of the
s-th type of service.
In the clustered network topology, the data packets entering the priority transmission queue of node
i include not only those generated by node
i itself but also those generated by other nodes that need to be forwarded by node
i. Therefore, define
as the set of all source nodes that generate priority
s services and require forwarding by node
i. Then, the arrival rate of data packets of the
s-th type of service that need to be forwarded by node
i is
. As a result, the total probability that
k data packets of priority
s enter node
i within time
t is:
Given the preemptive scheduling nature of the SPMA protocol, low-priority data packets in a backoff state face a key constraint: once a higher-priority data packet is admitted into the transmission queue, the low-priority packet must immediately pause its backoff counting process. This pause mechanism ensures that higher-priority service gains unimpeded transmission priority—an essential design to meet the low-latency demands of critical services such as swarm networking in clustered UAV communication scenarios. For data packets of service type
s, the likelihood that no higher-priority service arrives within a time window
t is expressed as:
Based on the above equation, we can obtain the total number of slots in the backoff phase before the data packet of priority
s at node
i is transmitted without being preempted:
where
denotes the backoff probability of data packets of priority
s at node
i;
B is the maximum number of backoffs;
is the length of the
a-th backoff window, in slots.
denotes the probability that no higher-priority data packets arrive from the 1st to
j-th backoff process. For data packets of priority 0, since there is no higher priority, this product term is always 1.
In the above equation, the first line on the right-hand side represents the total number of slots in the backoff phase before non-highest-priority data packets are transmitted without being preempted. The second line represents the total number of slots in the backoff phase before the highest-priority data packets are transmitted. For the highest-priority data packets, since there are no higher-priority data packets in the system, their backoff process will not be affected by the arrival of data packets. However, if the channel load is higher than the priority threshold, it will enter backoff.
The average probability that a packet of priority
s is transmitted after
j backoffs is:
In the above equation, the first line represents the probability that a data packet of priority
s is transmitted directly without backoff because the channel load is lower than its priority threshold; the second line represents the probability that a data packet of priority
s is transmitted after 1 to
B backoffs. Based on the above equation, the probability that the data packet is transmitted before the arrival of a higher-priority packet is:
Since the arrival process of data packets of priority
s entering node
i follows a Poisson distribution with an arrival rate of
, according to the characteristics of the M/G/1 queue, the traffic intensity of data packets of priority
s is
, where
. The total traffic intensity of all priorities is:
The probability
that a data packet of priority
s is at the head of the waiting queue of node
i is:
Combining the above equations, it can be found that the probability that node
i has a data packet transmitted in any slot, i.e., the slot transmission probability
of node
i, is a function closely related to the backoff probability
. Its expression is:
From a physical perspective, the slot transmission probability intuitively reflects the possibility that a node successfully transmits data packets within a unit slot and is also a core indicator for measuring the intensity of channel contention: when this probability is high, it indicates that the node has a higher probability of successfully seizing resources in channel contention, which indirectly reflects that the channel load is relatively low; on the contrary, the lower the slot transmission probability, the more intense the channel contention, and the higher the probability that the node fails to transmit due to the triggering of the backoff mechanism and data packet collision.
Based on the core role of this indicator, the following will specifically derive the calculation formula of the backoff probability of data packets of different priorities and further analyze its quantitative correlation with the slot transmission probability.
4.3. Priority Backoff Probability
Define the neighbor set of node
i in the clustered network topology as
(including node
i itself). If a data packet arrives at the head of the waiting queue of node
i, the node first counts the number of data packets present on the channel within the occupancy statistics window
. This count is denoted as
and serves as the COS, with
measured in slots. Then, compare
with the priority threshold of the data packet. If
is greater than the priority threshold, the data packet enters the backoff state; if
is less than the priority threshold, the data packet can be transmitted. Since the nodes are mutually independent,
can be considered to follow a binomial distribution
, where
is the average value of the probability that all nodes in
transmit data packets in any slot:
where
is the probability that node
j transmits data packets in any slot, and
n is the total number of slots:
Then, the probability that
is:
Let
be the priority threshold of priority
s. When
is less than
, the data packet of priority
s will enter the backoff state. Therefore, the expression of the backoff probability with respect to
can be obtained:
The above equation indicates that for a given slot transmission probability
, the backoff probability
for priority
s at node
i can be calculated. Substituting
into Equation (15) yields a new slot transmission probability
. Its physical implication is as follows: when the initial slot transmission probability of each node is relatively low, the channel load is low, leading to a small backoff probability for each priority. In this case, more data packets of services with all priorities can be transmitted, which allows the slot transmission probability to increase further. However, as the slot transmission probability rises, the channel load increases accordingly, resulting in a larger backoff probability for each priority. When the backoff probability increases to a certain extent, the slot transmission probability will cease to rise, and at this point, the slot transmission probability of each node will reach a balanced value, namely
:
The balanced value given by the above equation represents the maximum achievable slot transmission probability under the given network scale and service requirements of the UAV swarm.
4.4. End-to-End Packet Transmission Success Rate
Factors affecting the end-to-end packet transmission success rate include the number of hops and the collision probability of each hop. As shown in
Figure 3, the end-to-end transmission success rate of inter-cluster service data packets sent from node 3 to node 8 should be the product of the transmission success rates from node 3 to node 5, node 5 to node 7, and node 7 to node 8. Moreover, the factors affecting the single-hop transmission success rate are all transmitting nodes that cause interference to the receiving node of this hop, i.e., the neighbor set of this receiving node.
First, calculate the packet transmission success rate in the single-hop case.
The SPMA system adopts a packet-splitting time-hopping and frequency-hopping mechanism. In this case, assume that each packet has the same length. After channel coding at the physical layer, it is split into
data frames, which are randomly transmitted on
frequency channels. The duration of each data frame is one slot, and the slot length is
. For any receiving node
i, let node
j be a node in its neighbor set
. Since we have derived that the probability that node
j has a data packet transmitted in any slot is
, node
j can send
data packets per unit time. Furthermore, the number of data frames sent by all nodes in
on a single channel per unit time is:
Assuming that the arrival interval of data frames on each channel still follows a Poisson distribution,
is the arrival rate of the Poisson distribution. Furthermore, since data frames are transmitted in a time-hopping manner, the start times of all data frames over the channel are synchronized. In this case, the transmission success rate of node
i successfully receiving a data frame is the probability that the number of data frames sent from
within the
time when node
i receives a data frame is 0:
To correctly decode a complete data packet, node
i needs to successfully receive at least half of the split data frames. Therefore, the packet transmission success rate of node
i successfully receiving a data packet is:
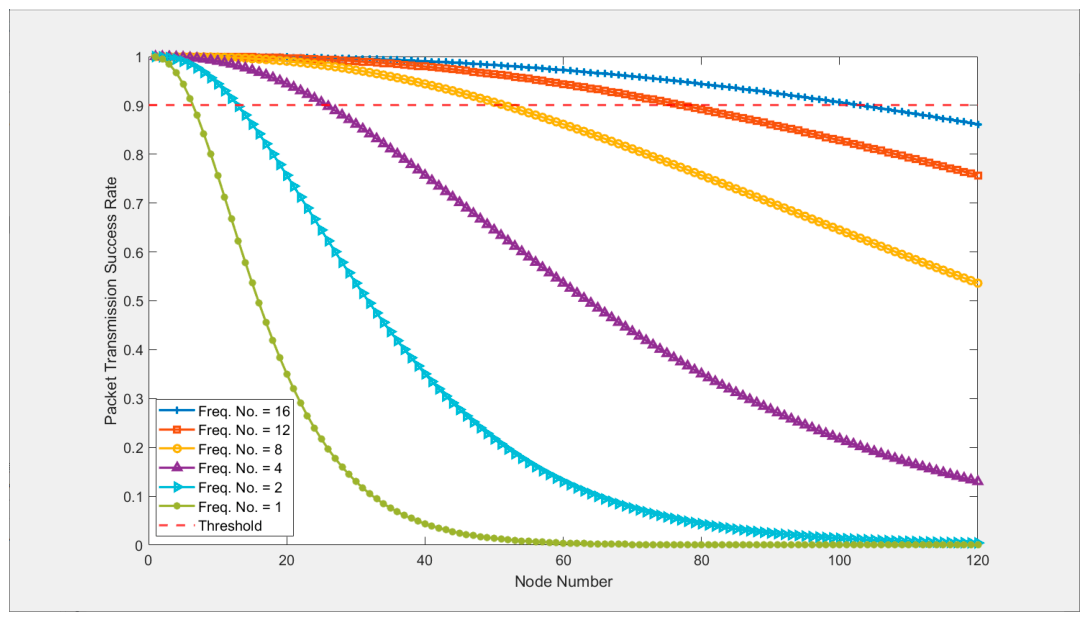
Observing Equations (21)–(23), it can be found that the packet transmission success rate is proportional to the number of frequency channels and inversely proportional to the number of nodes in the neighbor set and the slot transmission probability of each node. That is, the fewer the number of frequency channels, the higher the collision probability on a single channel. However, forming a clustered structure through power control can reduce the number of neighboring nodes for each node, thereby compensating for the loss caused by the insufficient number of frequency channels. Moreover, the more clusters there are, the fewer the number of neighboring nodes for each node, the lower the collision probability, and the higher the transmission success rate.
Based on the single-hop packet transmission success rate, assume that the destination node of the priority service
s sent by the source node
is
, and the end-to-end multi-hop route under the clustering scheme
is {
,
, …,
}. Then, the end-to-end packet transmission success rate of this multi-hop data packet is:
From the above equation, it can be found that the more hops there are, the lower the transmission success rate of inter-cluster service data packets. Moreover, during the forwarding of data packets by intermediate nodes, interference will also be generated for the neighboring nodes of the intermediate nodes. Therefore, it is necessary to reduce the number of forwarding hops for inter-cluster services, that is, reduce the number of clusters. Overall, Equations (23) and (24) put forward completely opposite requirements on the number of clusters. Therefore, to balance the packet transmission success rates of intra-cluster and inter-cluster services, a compromise number of clusters must be selected.
4.5. Complexity of the Optimal Solution
Although the optimal clustering scheme can theoretically be obtained through exhaustive search, in a network with N nodes, the number of clustering schemes is given by the Bell number , where denotes the N-th Bell number; further, since each node has P optional transmission power levels, the total number of clustering schemes combined with power control is as many as . Since grows super-exponentially and grows exponentially, the computational complexity of this optimization problem is extremely high, indicating that it belongs to an NP-hard problem. Therefore, exhaustive search is not feasible in engineering, and only heuristic algorithms can be used to find suboptimal solutions within polynomial time.
5. Clustering and Power Control Algorithm Based on K-Means and Ant Colony Optimization
5.1. Basic Method
To enable the actual UAV swarm system to quickly converge to a high-quality scheme, this paper designs a virtual iterative heuristic algorithm that performs all computations virtually after swarm initialization using only node positions and predefined service requirements, without additional real-time message exchange during iteration; only the final suboptimal clustering and power configuration are broadcast once to the network. The algorithm includes three stages: K-means-based clustering, GPSR (Greedy Perimeter Stateless Routing)-based inter-cluster route establishment, and an ant colony algorithm-based power adjustment.
The algorithm starts with the initial number of clusters K = and is executed in a centralized manner by the predefined global control node according to the following steps:
Step 1: Use the K-means algorithm to divide the network into K clusters and determine the nominal transmission power of any node i according to the requirements of intra-cluster services. The nominal transmission power is not actually assigned to the node.
Step 2: Calculate the route of each inter-cluster service according to the GPSR algorithm. In this process, the nominal transmission power of the nodes participating in transmission and forwarding on the route may be appropriately increased. After the route calculation is completed, the transmitting and forwarding nodes of all routes form an inter-cluster route node set . At the same time, the nominal transmission power of any node i is denoted as , which indicates that this power is the minimum power required to meet all intra-cluster and inter-cluster service requirements under the current clustering scheme .
Step 3: Adopt the ant colony algorithm, using the utility function defined in Equation (2) as the fitness of the ant colony algorithm, and iteratively adjust the nominal transmission power of each node in the set . The adjustment interval is . After the iteration is completed, the best fitness obtained is denoted as .
Step 4: Increase the number of clusters K and re-execute Step 1 until the maximum number of clusters is reached. Calculate the maximum value of the best fitness among all clustering schemes, denoted as , and the corresponding is the suboptimal clustering scheme obtained by the heuristic algorithm. Based on this, the global control node broadcasts the clustering scheme and the corresponding nominal transmission power of each node to the entire network through swarm networking service data packets and finally completes the clustering and the actual power configuration of each node.
The proposed three-stage framework follows a logical and sequential design. K-means clustering first generates the network topology and determines the basic transmission power to guarantee intra-cluster connectivity, thereby establishing a constrained solution space for subsequent procedures. GPSR routing then constructs feasible inter-cluster routes and refines the optimization scope. Finally, the ant colony algorithm performs refined power adjustment to enhance overall system performance and ensure stable convergence. Given that the joint optimization problem is NP-hard, the proposed hierarchical approach efficiently yields high-quality suboptimal solutions with controllable approximation performance. Each stage provides necessary inputs for the next, making the entire framework systematic and well-founded.
5.2. K-Means-Based Clustering
Since the purpose of clustering is to reduce mutual interference between different clusters by reducing transmission power, this paper adopts the K-means algorithm based on Euclidean distance as the clustering principle and then completes the preliminary calculation of the nominal transmission power. The specific steps are as follows:
Step 1: Randomly select K nodes from the network as initial cluster heads according to the current number of clusters K.
Step 2: Calculate the Euclidean distances between other nodes and each cluster head node, and assign each node to the cluster with the closest distance.
Step 3: Calculate the geometric center of all nodes in each cluster, and select the node in the cluster closest to the geometric center as the updated cluster head.
Step 4: If the displacement of the cluster head is less than the iterative convergence threshold or the maximum number of iterations IK is reached, complete the clustering and execute the following steps; otherwise, re-execute Step 2.
Step 5: For the cluster head node
of any cluster
, the nominal transmission power is calculated based on the free-space propagation model as follows:
where
is the receiver sensitivity,
is the maximum distance between
and other member nodes in the cluster,
L is the system loss coefficient,
and
are the transmit antenna gain and receive antenna gain, respectively, and
is the electromagnetic wave wavelength.
For any member node
i of any cluster
, its nominal transmission power is:
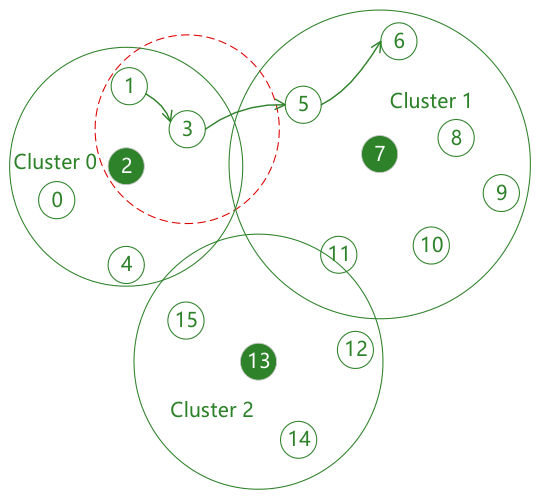
After the above steps, as shown in Cluster 0 in
Figure 6, the nominal transmission power of the cluster head node 2 can cover all nodes in the cluster, while the nominal transmission power of node 3 as a member is calculated only based on the principle of covering the cluster head.
5.3. GPSR-Based Inter-Cluster Route Establishment
The initial calculation of K-means-based clustering and nominal transmission power can only meet the requirements of intra-cluster services. To meet the requirements of inter-cluster services, this paper adopts the GPSR algorithm to establish a route from the source node src to the destination node dst for each inter-cluster service and appropriately increases the nominal transmission power of the relevant transmitting nodes during the route establishment process.
The algorithm executes the following steps for each inter-cluster service, starting from the source node src as the current node curr:
Step 1: Calculate the distance from the current node to the destination node as a reference value;
Step 2: Under the current nominal transmission power of the current node, traverse all its neighboring nodes. If the neighboring nodes include the destination node dst, complete the route establishment; otherwise, calculate the Euclidean distance from each neighboring node to the destination node;
Step 3: Add all neighboring nodes satisfying to the candidate next-hop node set of the current node;
Step 4: If the candidate next-hop node set is empty, increase the nominal transmission power of the current node by a small step and then re-execute Step 2; otherwise, select the neighboring node with the smallest as the next-hop node of the current node, add it to the global inter-cluster route node set , and take this node as the current node curr, then re-execute Step 1.
As shown in
Figure 6, according to the GPSR algorithm, node 3 is the next-hop node of node 1, where node 1 acts as the source node and node 6 is the destination node. According to the initial nominal transmission power of node 3, its candidate next-hop node set is empty. Therefore, it is necessary to incrementally increase its nominal transmission power until it covers node 5.
5.4. Ant Colony Algorithm-Based Power Adjustment
After the establishment of inter-cluster routes, although each inter-cluster service has a route with small transmission power, the number of hops of this route is large, which cannot provide good quality of service. In
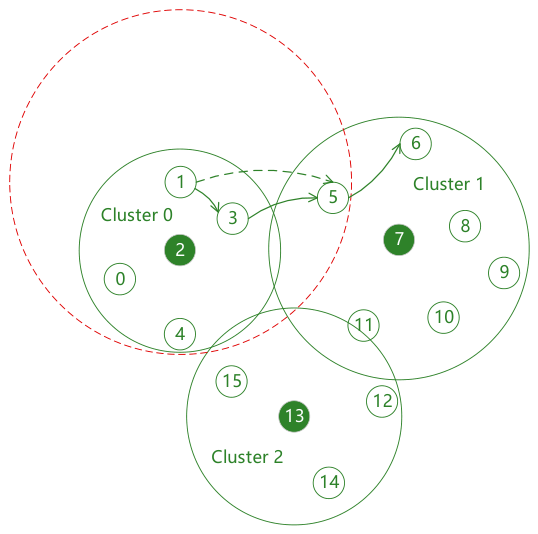
Figure 6, the number of hops of the route from node 1 to node 6 is 3. However, if the transmission power of node 1 is increased to directly cover node 5 as shown in
Figure 7, the number of hops of the route is reduced to 2, thereby significantly improving the end-to-end transmission success rate of this route. However, on the other hand, increasing the transmission power of node 1 will cause more nodes to be interfered with, leading to a decrease in the quality of service of intra-cluster and inter-cluster services related to these nodes. This indicates that the transmission power of relevant nodes cannot be blindly increased only for a certain service. A balanced solution to this problem must be sought from the perspective of the entire network. For this reason, this paper adopts the ant colony algorithm for heuristic solution.
Let each ant in the ant colony algorithm represent a nominal transmission power vector
, which represents a combination of nominal transmission power values of each node in the set
. Let
represent the number of ants used in the ant colony algorithm. Then, in each iteration of the algorithm,
ants are released, which is equivalent to generating
groups of different nominal transmission power candidate schemes simultaneously to search for the optimal solution in parallel. It should be emphasized that the nominal transmission power of each node in the set
only takes discrete values based on the route within the range
. For example, the nominal transmission power of node 3 in
Figure 7 has at most two values within the range not exceeding
, which exactly covers node 5 and node 6, respectively. This is because other values not only do not help improve the quality of service of the inter-cluster service from node 1 to node 6 but also increase interference to other nodes, and this discrete value method can significantly improve the convergence speed of the ant colony search.
Define the fitness function
of the ant colony algorithm as equal to the utility function:
where
denotes the utility function value determined by the nominal transmission power vector
during the ant colony iteration.
Let the pheromone matrix of the ant colony algorithm be
, whose dimension is
rows ×
columns, where
is the number of discrete values of the nominal transmission power of any node
i. Initially, all pheromones are set to a constant
. After each iteration, the pheromones are updated according to the following rules:
where
is the pheromone evaporation factor satisfying
, a larger value of
indicates a weaker influence of historical pheromones and thus stronger global search capability;
is the pheromone concentration of the
j-th power of node
i in the
t-th iteration;
is the pheromone left by the
n-th ant in this iteration, which is proportional to the quality of the solution found by the ant:
where
Q is the pheromone enhancement coefficient, which is used to adjust the magnitude of the pheromone increment.
Ants select discrete power by combining pheromone guidance and random exploration. For node
i, the selection probability of its
j-th discrete power is:
where
is the heuristic factor, a larger
leads to a stronger guiding effect of pheromones and faster convergence, while a smaller
results in stronger random exploration.
On this basis, the main steps of the ant colony-based power adjustment algorithm are as follows:
Step 1: Release ants in each iteration t, and each ant independently completes the following operations:
Step 2: For each node , calculate the selection probability of each discrete power j;
Step 3: Select the nominal transmission power of each node using the roulette wheel method to form a set of nominal transmission power vectors ;
Step 4: Calculate the fitness corresponding to this vector;
Step 5: Calculate the maximum fitness among all ants in this iteration, denoted as . The vector corresponding to this value, , is the optimal power vector of this iteration. Then, update the pheromone matrix according to the solutions of all ants in this iteration;
Step 6: Increase the number of iterations and re-execute Step 1 until the maximum number of iterations IA is reached. Calculate the global optimal fitness and obtain the global optimal power vector .
5.5. Algorithm Complexity Analysis
This section quantitatively analyzes the computational complexity of the proposed heuristic algorithm from three stages: K-means clustering, GPSR inter-cluster route establishment, and ant colony algorithm-based power optimization. The core parameters involved in the analysis include the total number of UAV swarm nodes N, the number of clusters K, the number of single-round iterations of the K-means algorithm IK, the total number of service types M, the maximum number of hops of GPSR routes H, the number of ants in the ant colony algorithm , the maximum number of iterations IA, as well as the scale of the set and the discrete value of node power .
5.5.1. Computational Complexity of the K-Means Clustering Stage
The proposed algorithm traverses the number of clusters and executes the K-means clustering once for each K. The computational complexity of a single round of iteration of the classic K-means algorithm is , and the main overhead lies in calculating the Euclidean distance between N nodes and K cluster heads and updating node cluster membership. Then, the computational complexity of K-means clustering under a single K value is .
When traversing all K values, the total computational complexity of the clustering stage is the sum of the complexities corresponding to each K value, and the expression is . Among them, the sum term . In this paper, and . Therefore, . Combined with the characteristic that is a constant, the total complexity of the clustering stage can be simplified to: .
Note that is set as a general lower bound to ensure a basic clustered structure and can be flexibly adjusted for different UAV swarm scales.
5.5.2. Computational Complexity of the GPSR Inter-Cluster Route Establishment Stage
GPSR routing is a greedy state routing, and the core operations include neighboring node searching and hop-by-hop iteration. In the worst case, all N nodes support all M services, and all services are broadcast services. At this time, each service needs to establish at most (N − 1) end-to-end routes, and the total number of routes is . For each route, the source node needs to select the next hop among (N − 1) candidate nodes, and the next-hop node continues to select among the remaining nodes until it reaches the destination node. Theoretically, the total number of possible routes reaches the factorial level. However, the greedy search strategy of GPSR greatly compresses the search space: each node only needs to evaluate the neighboring nodes that are closer to the destination node, and the average number of neighbors is much smaller than N. Let the average node degree be deg; then the computational complexity of establishing a single route is Therefore, the complexity of the GPSR stage is . Since M, H, and deg are all constants much smaller than N, the complexity of this stage can be simplified to .
In actual engineering scenarios, UAV swarm services are mostly communications between specific nodes, not fully connected broadcasts. Therefore, the actual routing complexity is much lower than the above theoretical maximum value.
5.5.3. Computational Complexity of the Ant Colony Algorithm-Based Power Optimization Stage
The ant colony algorithm only optimizes the power of nodes in the set , not all nodes in the network, and the power of each node only selects among discrete values. Each iteration of the ant colony algorithm needs to calculate the fitness function of each ant, and the calculation of the fitness function needs to traverse all nodes supporting each service. In the worst case, N nodes all support M services. At this time, the total complexity of the ant colony optimization stage is: . Since and are constants, and , , and M are much smaller than N, the complexity of this stage can be simplified to .
5.5.4. Overall Algorithm Complexity and Theoretical Comparison
The overall computational complexity of the proposed heuristic algorithm is the sum of the complexities of the three stages. According to the above analysis, since the computational complexity of the ant colony algorithm stage is negligible, the overall complexity of the algorithm is dominated by the K-means clustering and GPSR routing stages, namely:
Compared with the theoretical optimal solution in
Section 4.5, the proposed algorithm reduces the super-exponential complexity
to the polynomial complexity
through a heuristic strategy.
Compared with the theoretical complexity of the typical clustering algorithm ICW [
21], it can be seen that the core complexity of the ICW algorithm comes from the clustering optimization process of the Whale Optimization Algorithm (WOA), and its overall complexity is also
, which is comparable to the complexity level of the proposed algorithm. Both are polynomial complexities, providing a computationally efficient and fair basis for the performance comparison in the subsequent simulation stage.
8. Conclusions
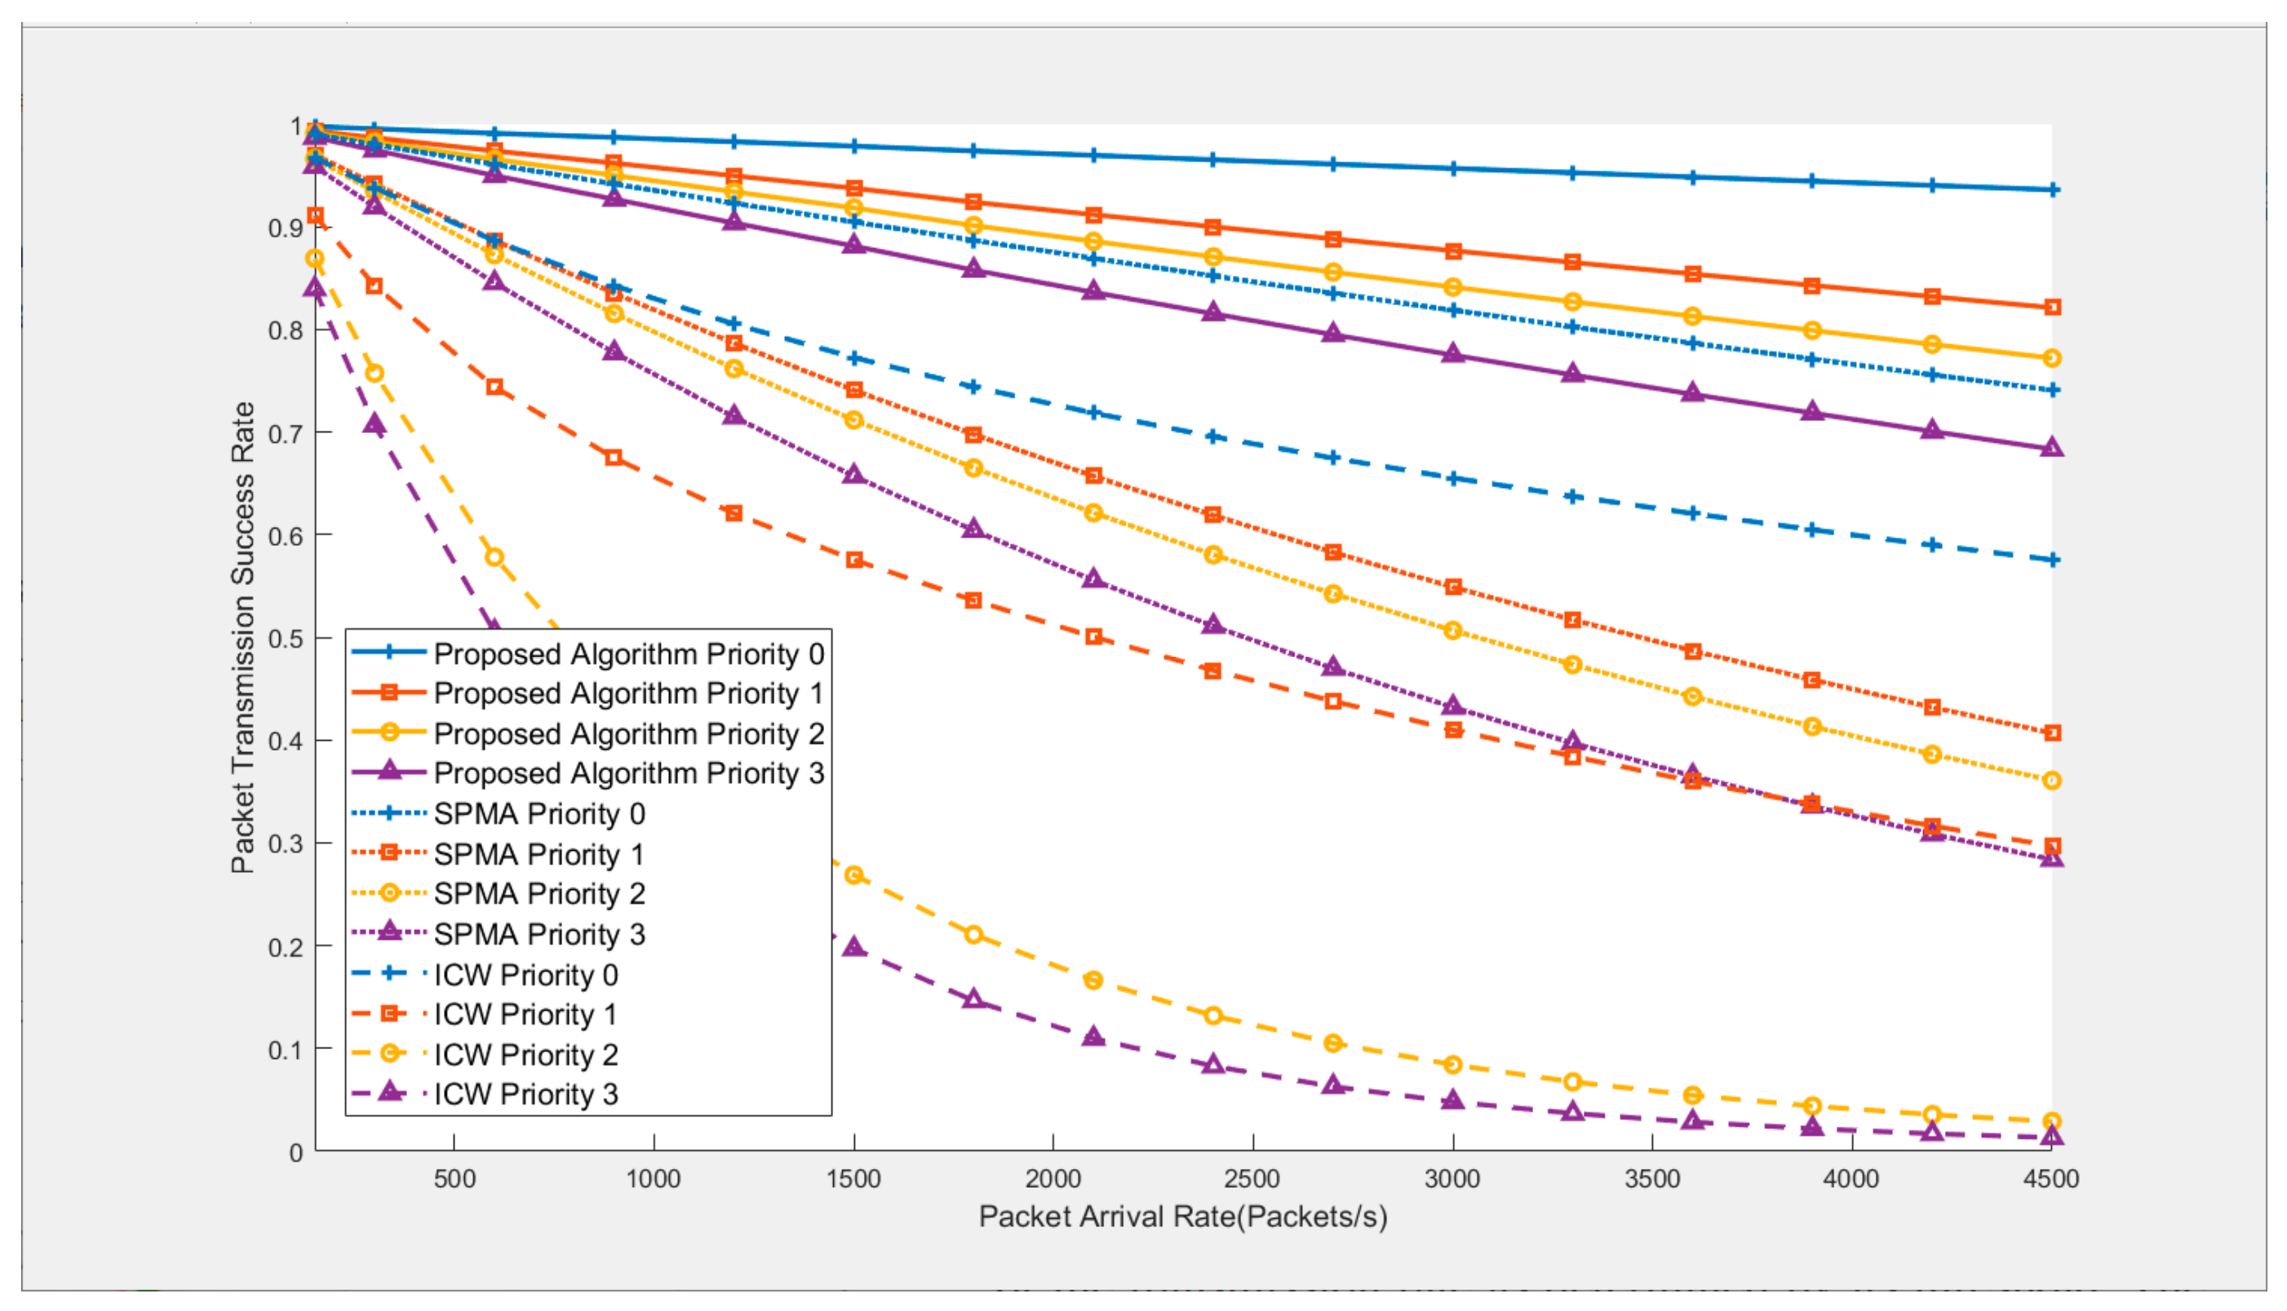
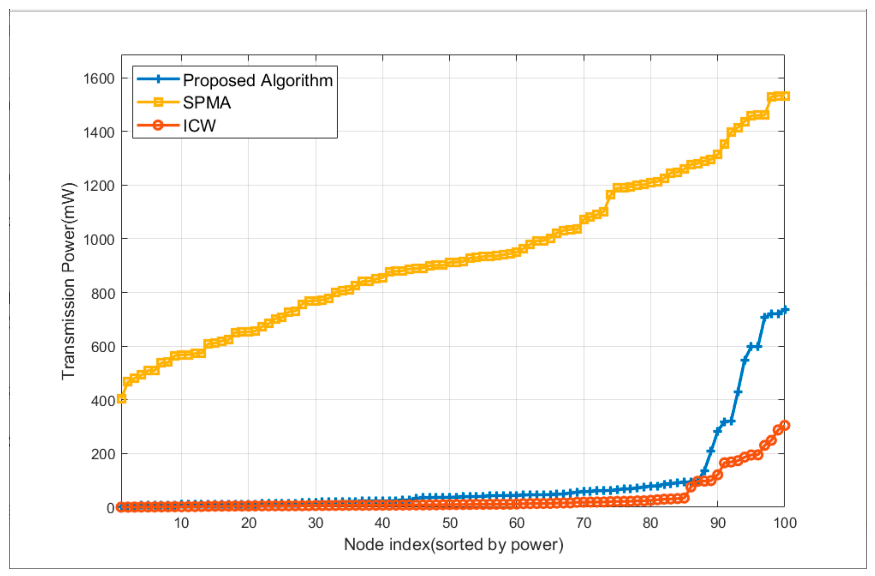
To address the performance limitation of the SPMA protocol in large-scale UAV swarm networking under severely constrained frequency resources, this paper proposes a joint clustering and power optimization method. Simulation results demonstrate that under heavy traffic loads, the proposed method improves the end-to-end packet transmission success rate by 63.5% compared with the standalone SPMA protocol and by 162.3% compared with the ICW algorithm, while reducing the average transmission power by 90.4% relative to SPMA. The highest-priority swarm networking service maintains a delivery probability above 93.6% even at high arrival rates, and the end-to-end delay satisfies the requirement of no more than 2 ms for critical control traffic. These results verify that the proposed scheme effectively balances transmission reliability, power consumption, and latency, providing a practical solution for UAV swarms in frequency-constrained scenarios.
In future work, we will extend the proposed framework to distributed clustering to reduce the dependence on global information. Moreover, imperfect state knowledge, dynamic topology, and mobility-adaptive clustering mechanisms will be investigated to improve the practicality in realistic UAV swarm deployments.