4.1. Pseudo-Satellite Layout Experiment
To quantitatively validate the performance advantages of the proposed Voronoi-partition-based improved genetic algorithm in tunnel pseudolite layout optimization, a standardized simulation environment was constructed, and controlled variable comparative experiments were designed. The specific parameter settings and experimental scheme are as follows:
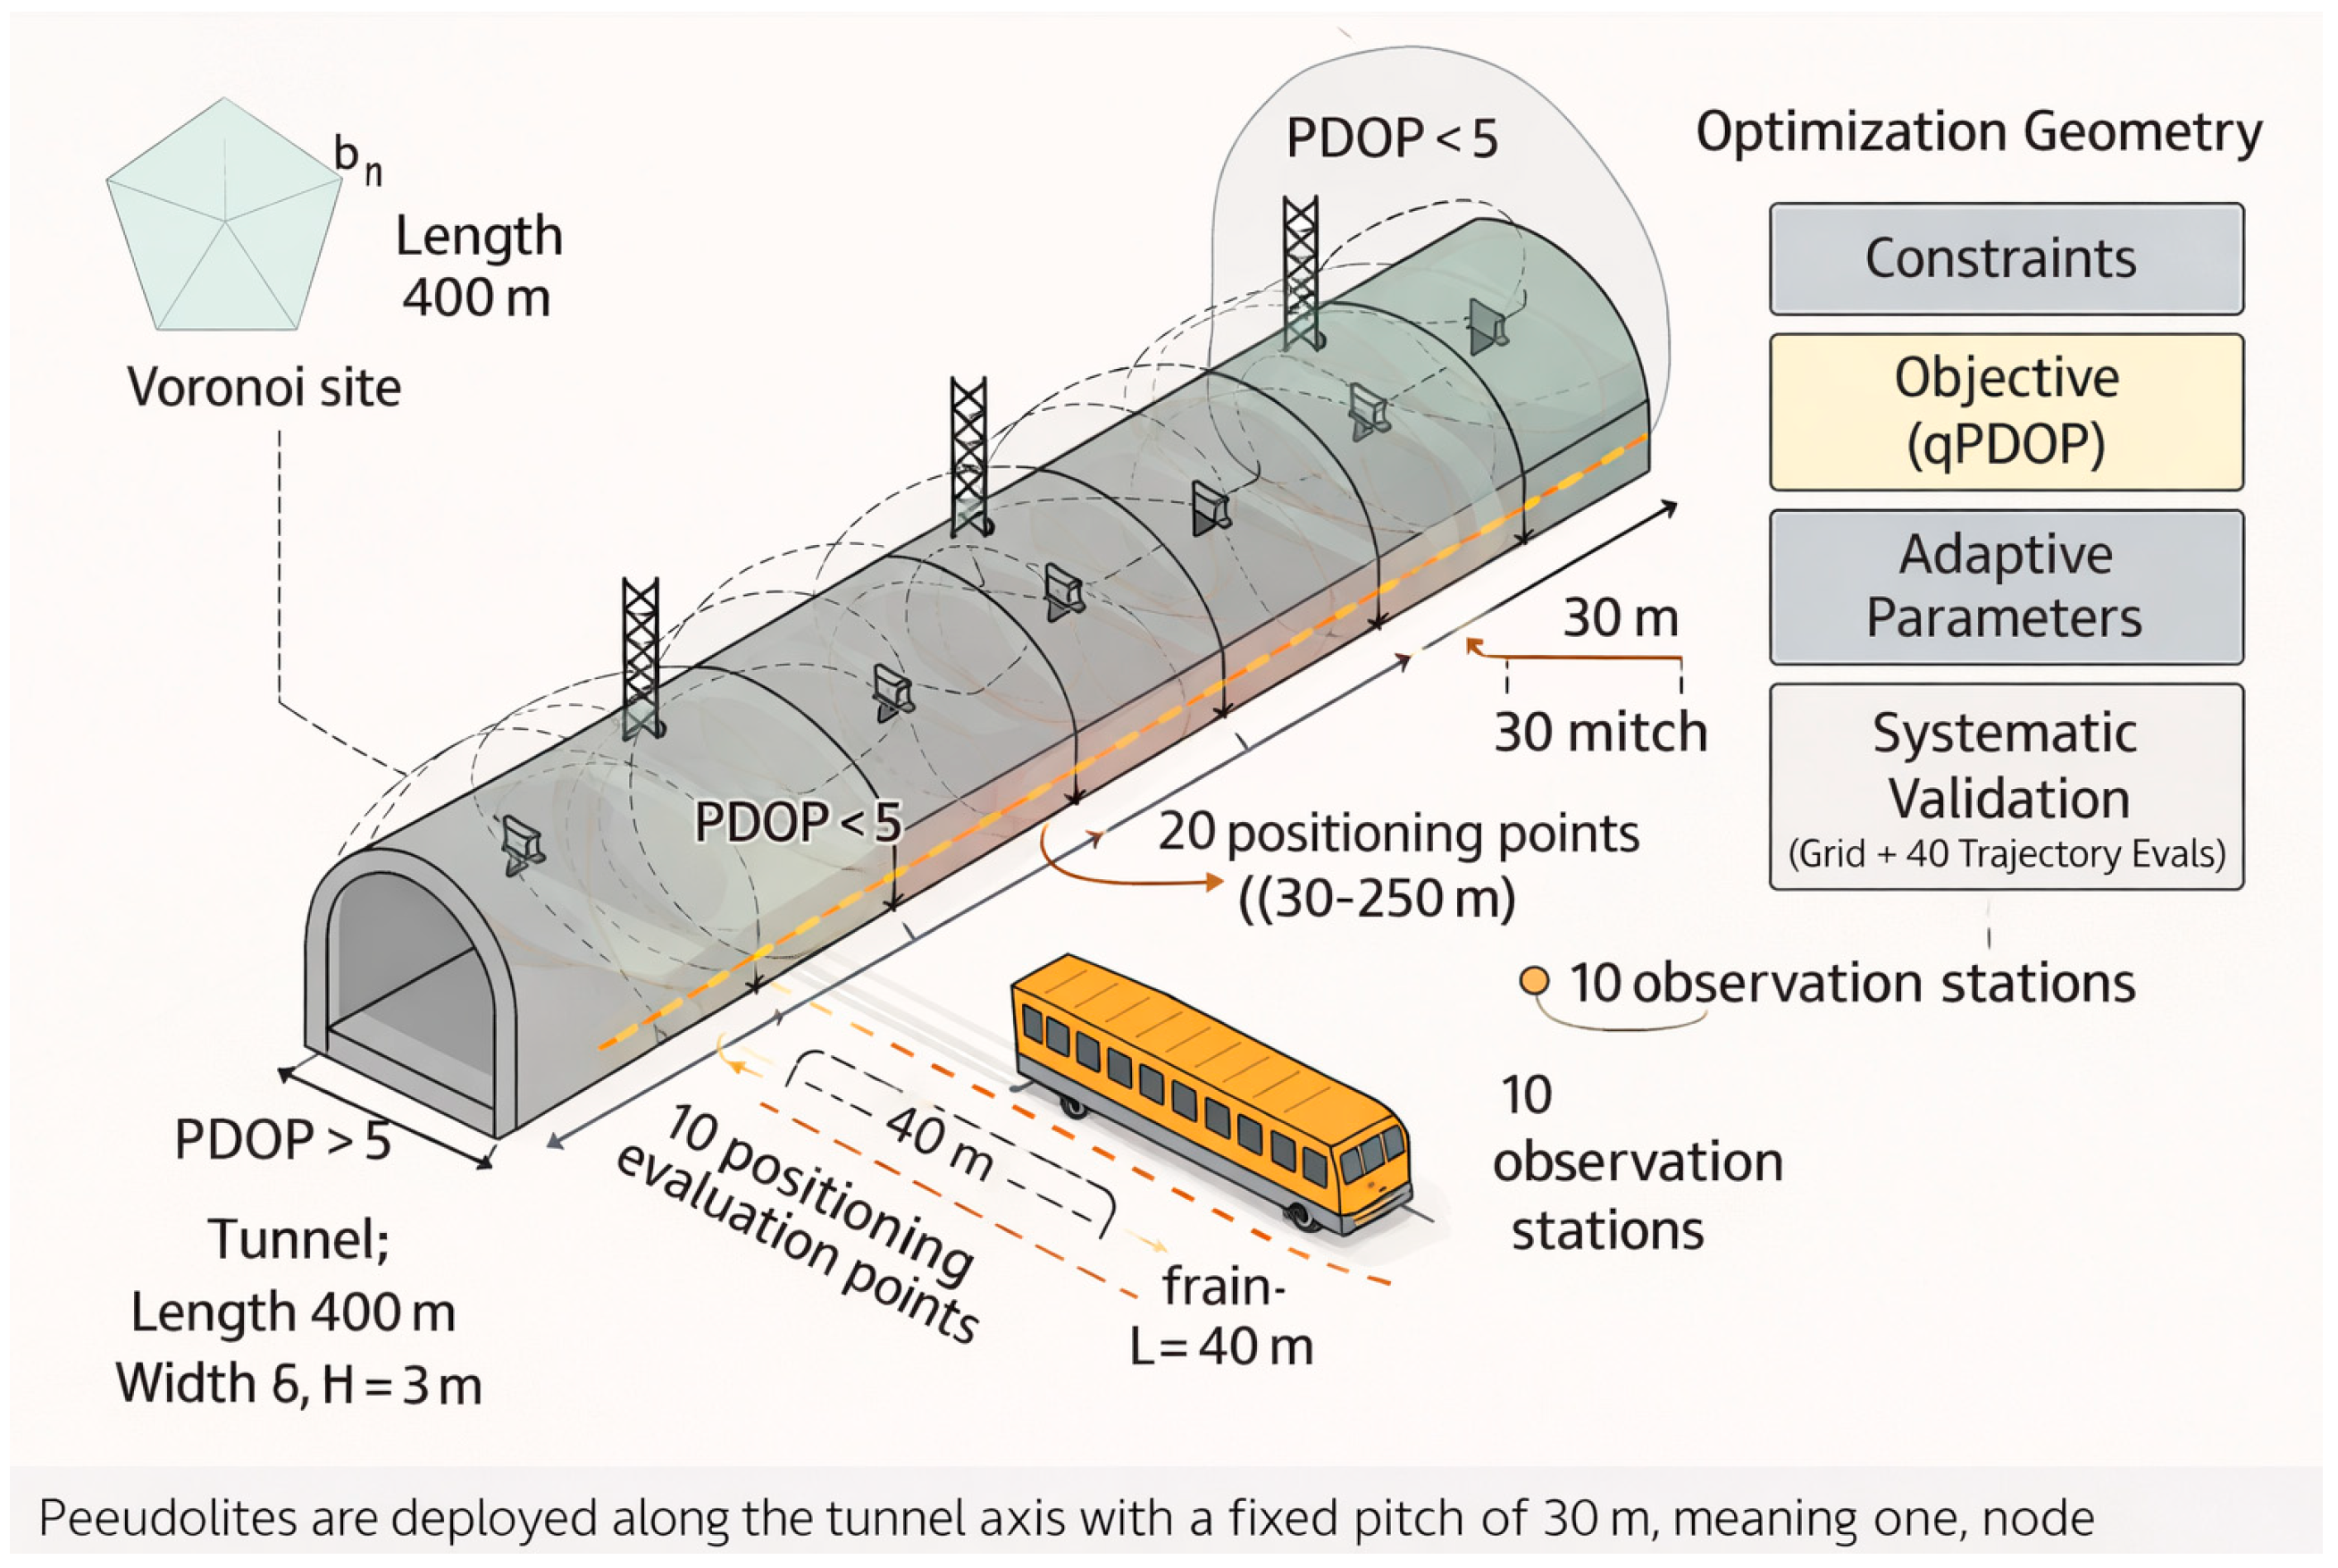
The simulation models a constrained tunnel-navigation environment using a reproducible evaluation protocol. The tunnel geometry is 400 m in length, 6 m in width, and 3 m in height. The train is modeled as a rectangular prism with dimensions of 40 m by 3 m by 2 m. The vehicle trajectory is restricted to the 0 m to 360 m interval along the tunnel axis to focus on the core passage region. Within this 360 m segment, 20 positioning evaluation points are uniformly sampled. In addition, 10 observation stations are uniformly deployed. This sampling density captures localized visibility loss and geometry degradation while keeping repeated fitness evaluations computationally tractable.
The pseudolite communication radius is set to 60 m to balance feasibility and constraint effectiveness. Based on tunnel occlusion characteristics, this study further analyzes the sensitivity trend of communication radius on algorithm performance: ① When the radius is <60 m, train occlusion significantly compresses effective line-of-sight, with qPDOP increasing by over 50% and visibility satisfaction dropping below 90%. ② When the radius exceeds 60 m, qPDOP and visibility satisfaction only improve slightly (<5%), but engineering deployment costs and pseudo-satellite interference increase. ③ A 60 m radius represents the optimal balance between positioning performance and engineering feasibility, with the algorithm demonstrating robustness within the 60–80 m range.
In tunnel environments, occlusion by the train body and tunnel boundaries reduces the effective line-of-sight region. If the radius is too small, large portions of the trajectory become infeasible and penalty terms dominate the search. If the radius is too large, locality is weakened and PDOP becomes less sensitive to placement changes [
18]. A 60 m radius provides margin against range shrinkage caused by occlusion and discretized mounting locations, while preserving local geometric variations along the trajectory. The radius is selected to be slightly larger than the axial-coverage distance scale used in the constraint set, so that axial-continuity requirements remain feasible while axial coverage holes are still penalized. This reduces the probability of visibility drops and associated PDOP spikes.
Unless otherwise specified, candidate pseudolite installation positions are discretized along the tunnel axis at a 30 m pitch, and the proposed IGA optimizes the selection and configuration of nodes over these candidate locations. This pitch reflects a cost-constrained deployment while maintaining service continuity under the selected radius. With a 60 m communication radius, adjacent nodes provide overlapping coverage along the axis. The overlap mitigates axial gaps that would otherwise reduce the number of simultaneously visible transmitters. It also supports continuity-oriented constraints and improves the stability of trajectory-level PDOP statistics. The layout is shown in
Figure 4.
To examine the effect of population size on optimization performance in a statistically reliable manner, we conducted a controlled-variable study in which all environmental settings, constraints, objective definitions, and genetic operators were kept unchanged, and only the population size was varied. The number of generations was fixed at 300 to ensure sufficient evolutionary depth under an identical computational budget per run. Population sizes of 20, 50, and 100 were tested to represent small, medium, and large search populations. Because genetic algorithms are stochastic, each configuration was repeated for multiple independent runs with different random seeds, and performance was summarized using the mean and standard deviation of key metrics, including the trajectory-level 90th-percentile PDOP. We adopted the 90th-percentile PDOP because tunnel layouts often produce localized geometry spikes driven by occlusion, and the mean PDOP can mask these tail degradations, while the maximum PDOP is overly sensitive to isolated outliers and sampling effects. The 90th percentile provides a robust tail-risk indicator that reflects worst-section performance over a non-negligible portion of the trajectory and is therefore more aligned with reliability-oriented deployment design. In general, a smaller population reduces computation but may suffer from limited diversity and premature convergence, whereas a larger population improves exploration at the cost of additional fitness evaluations; the intermediate setting provides a practical trade-off and serves as a reference. This experimental design enables a fair attribution of performance differences to population size and identifies a configuration that yields stable PDOP improvement without excessive computation. Finally, we emphasize that the proposed pseudolite layout optimization is performed in the pre-deployment planning stage, and the system is assumed to be time-synchronized prior to actual positioning operations, so the reported results should be interpreted within this planning-oriented scope [
19,
20,
21,
22,
23,
24].
To validate the algorithm, we conducted 10 repeated experiments and calculated the average for each observation point to verify the method. The simulation results are summarized as follows:
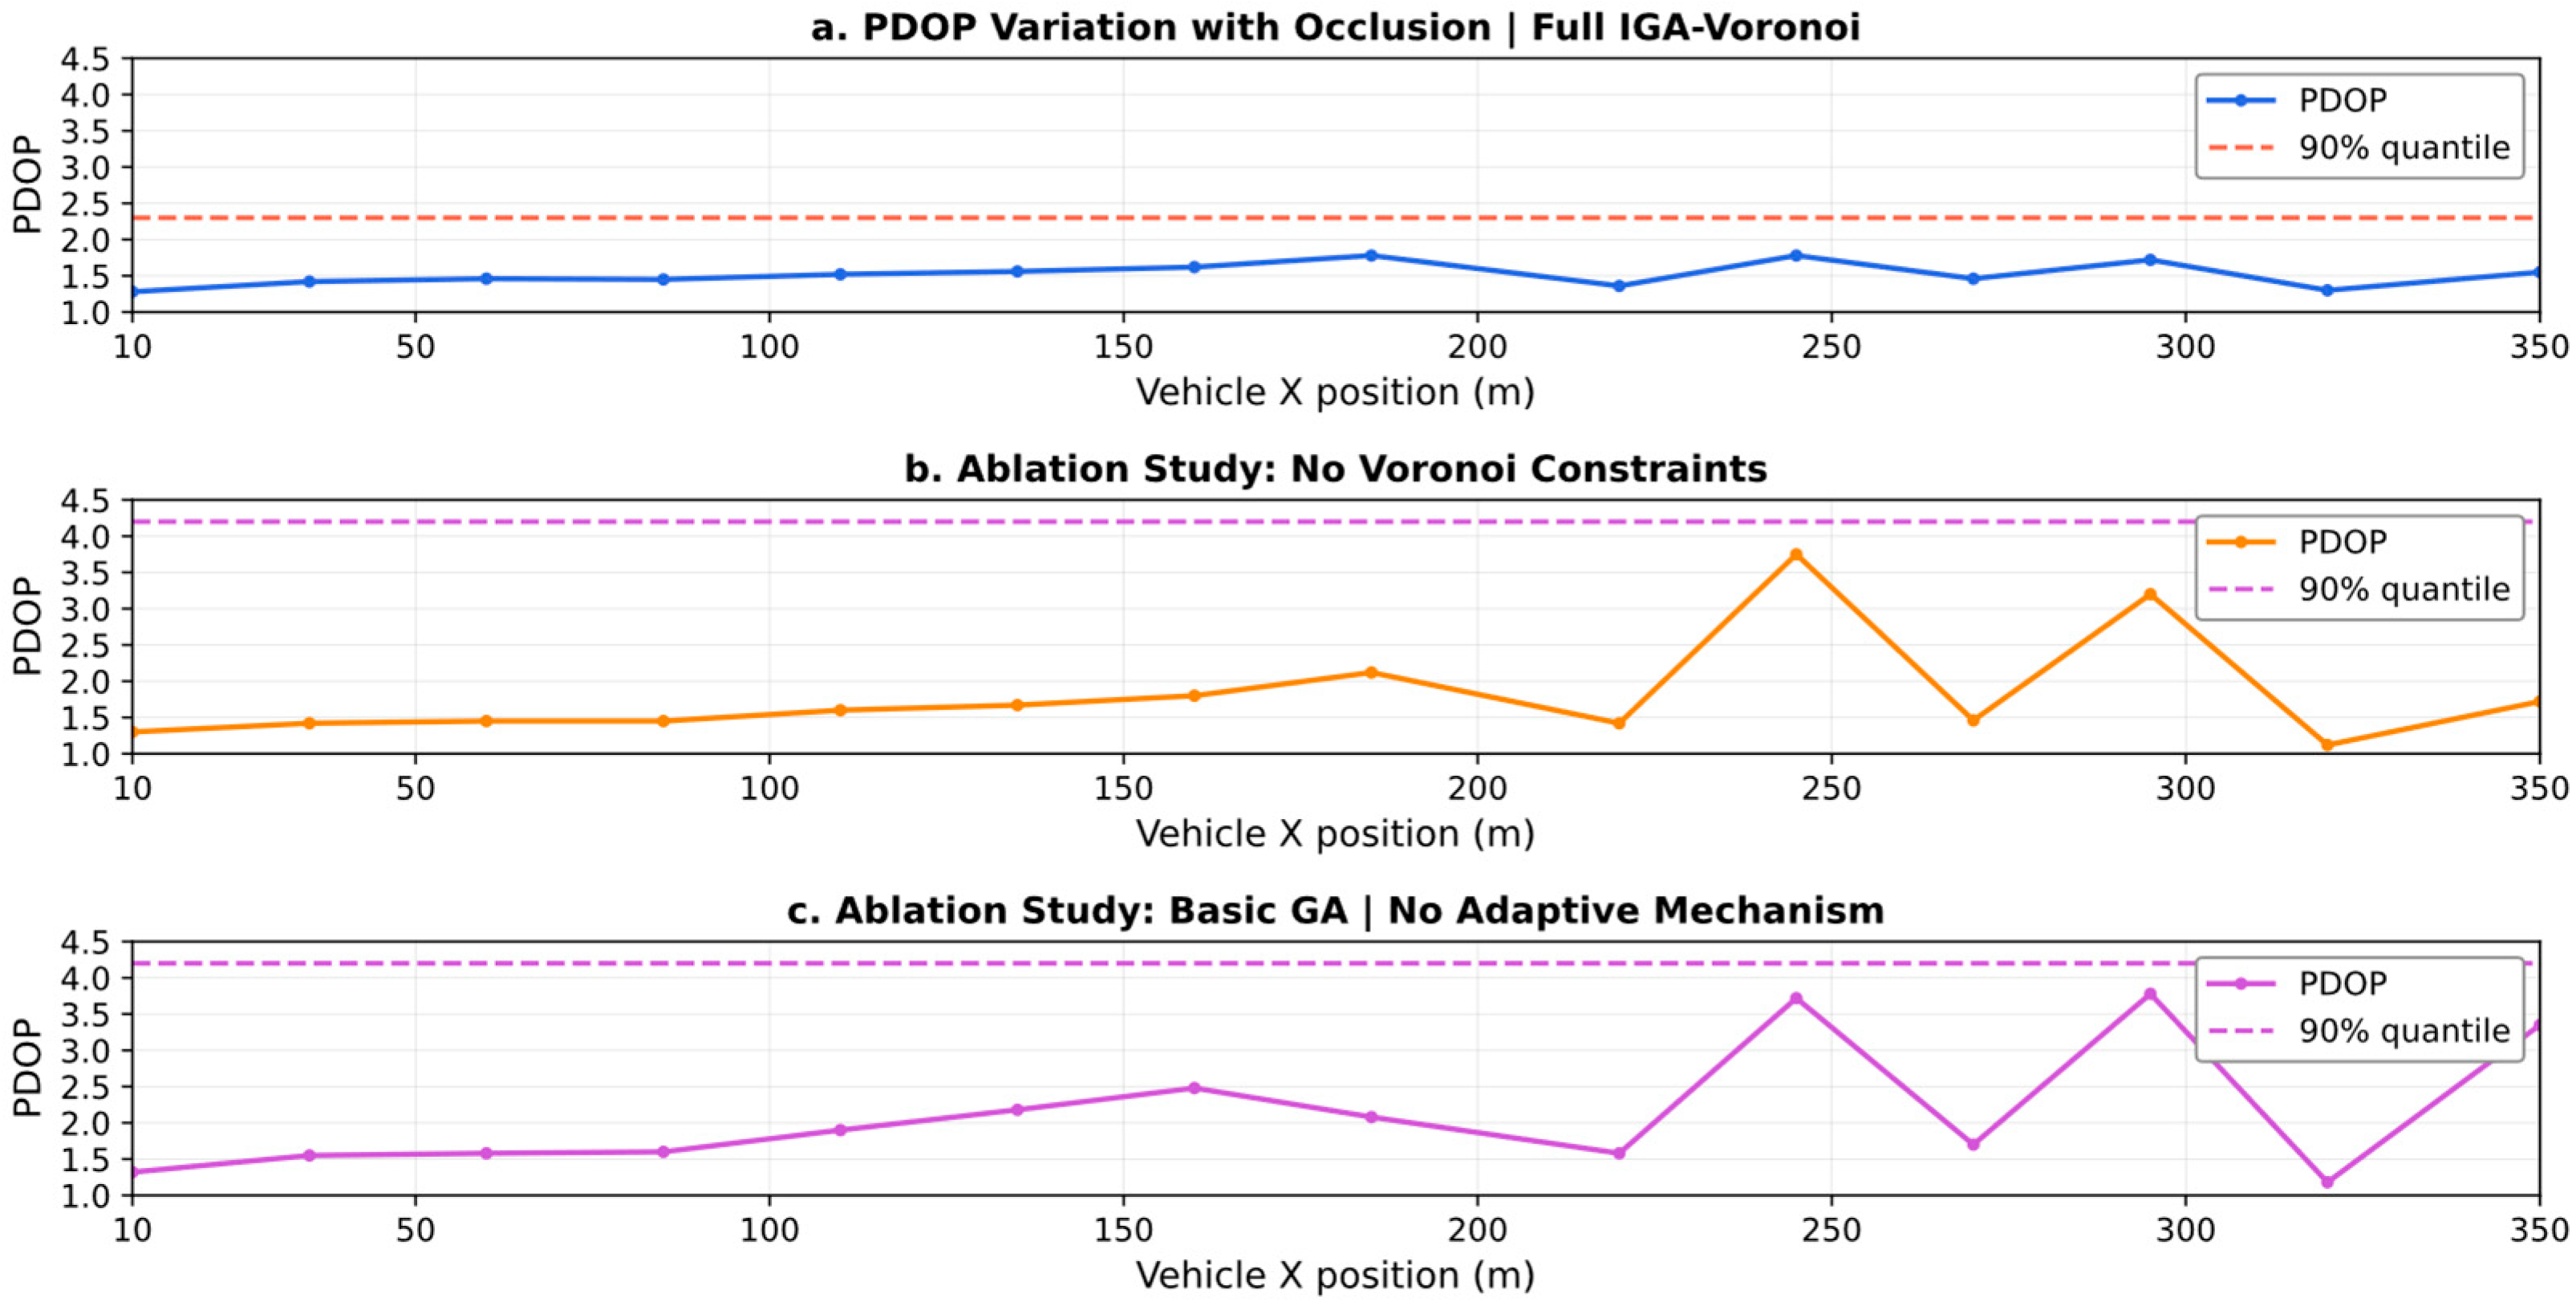
Figure 5 reveals that compared to the scenario with a population size of 20, when the genetic algorithm population size is 20, the PDOP values of vehicle trajectories exhibit fluctuating characteristics along the
X-axis. Most segments remain within the optimal range of 1.5–3, with 90% of trajectory points having PDOP ≤ 2.0. Only in obstructed areas such as X ≈ 200 m and 250 m do PDOP values abruptly rise above 2.0. Within the tunnel’s three-dimensional space, the geometrically advantageous region at X ≈ 200–250 m and Y ≈ 0–2 m exhibits a low PDOP of approximately 2, confirming the three-dimensional spatial correlation of PDOP. The Voronoi partitioning + improved genetic algorithm (IGA) employed in this experiment demonstrated significant superiority: even with a small population size (only 20), Voronoi’s partitioning constraints ensured at least one LSOA was deployed per interval, eliminating coverage blind spots inherent in traditional random layouts.
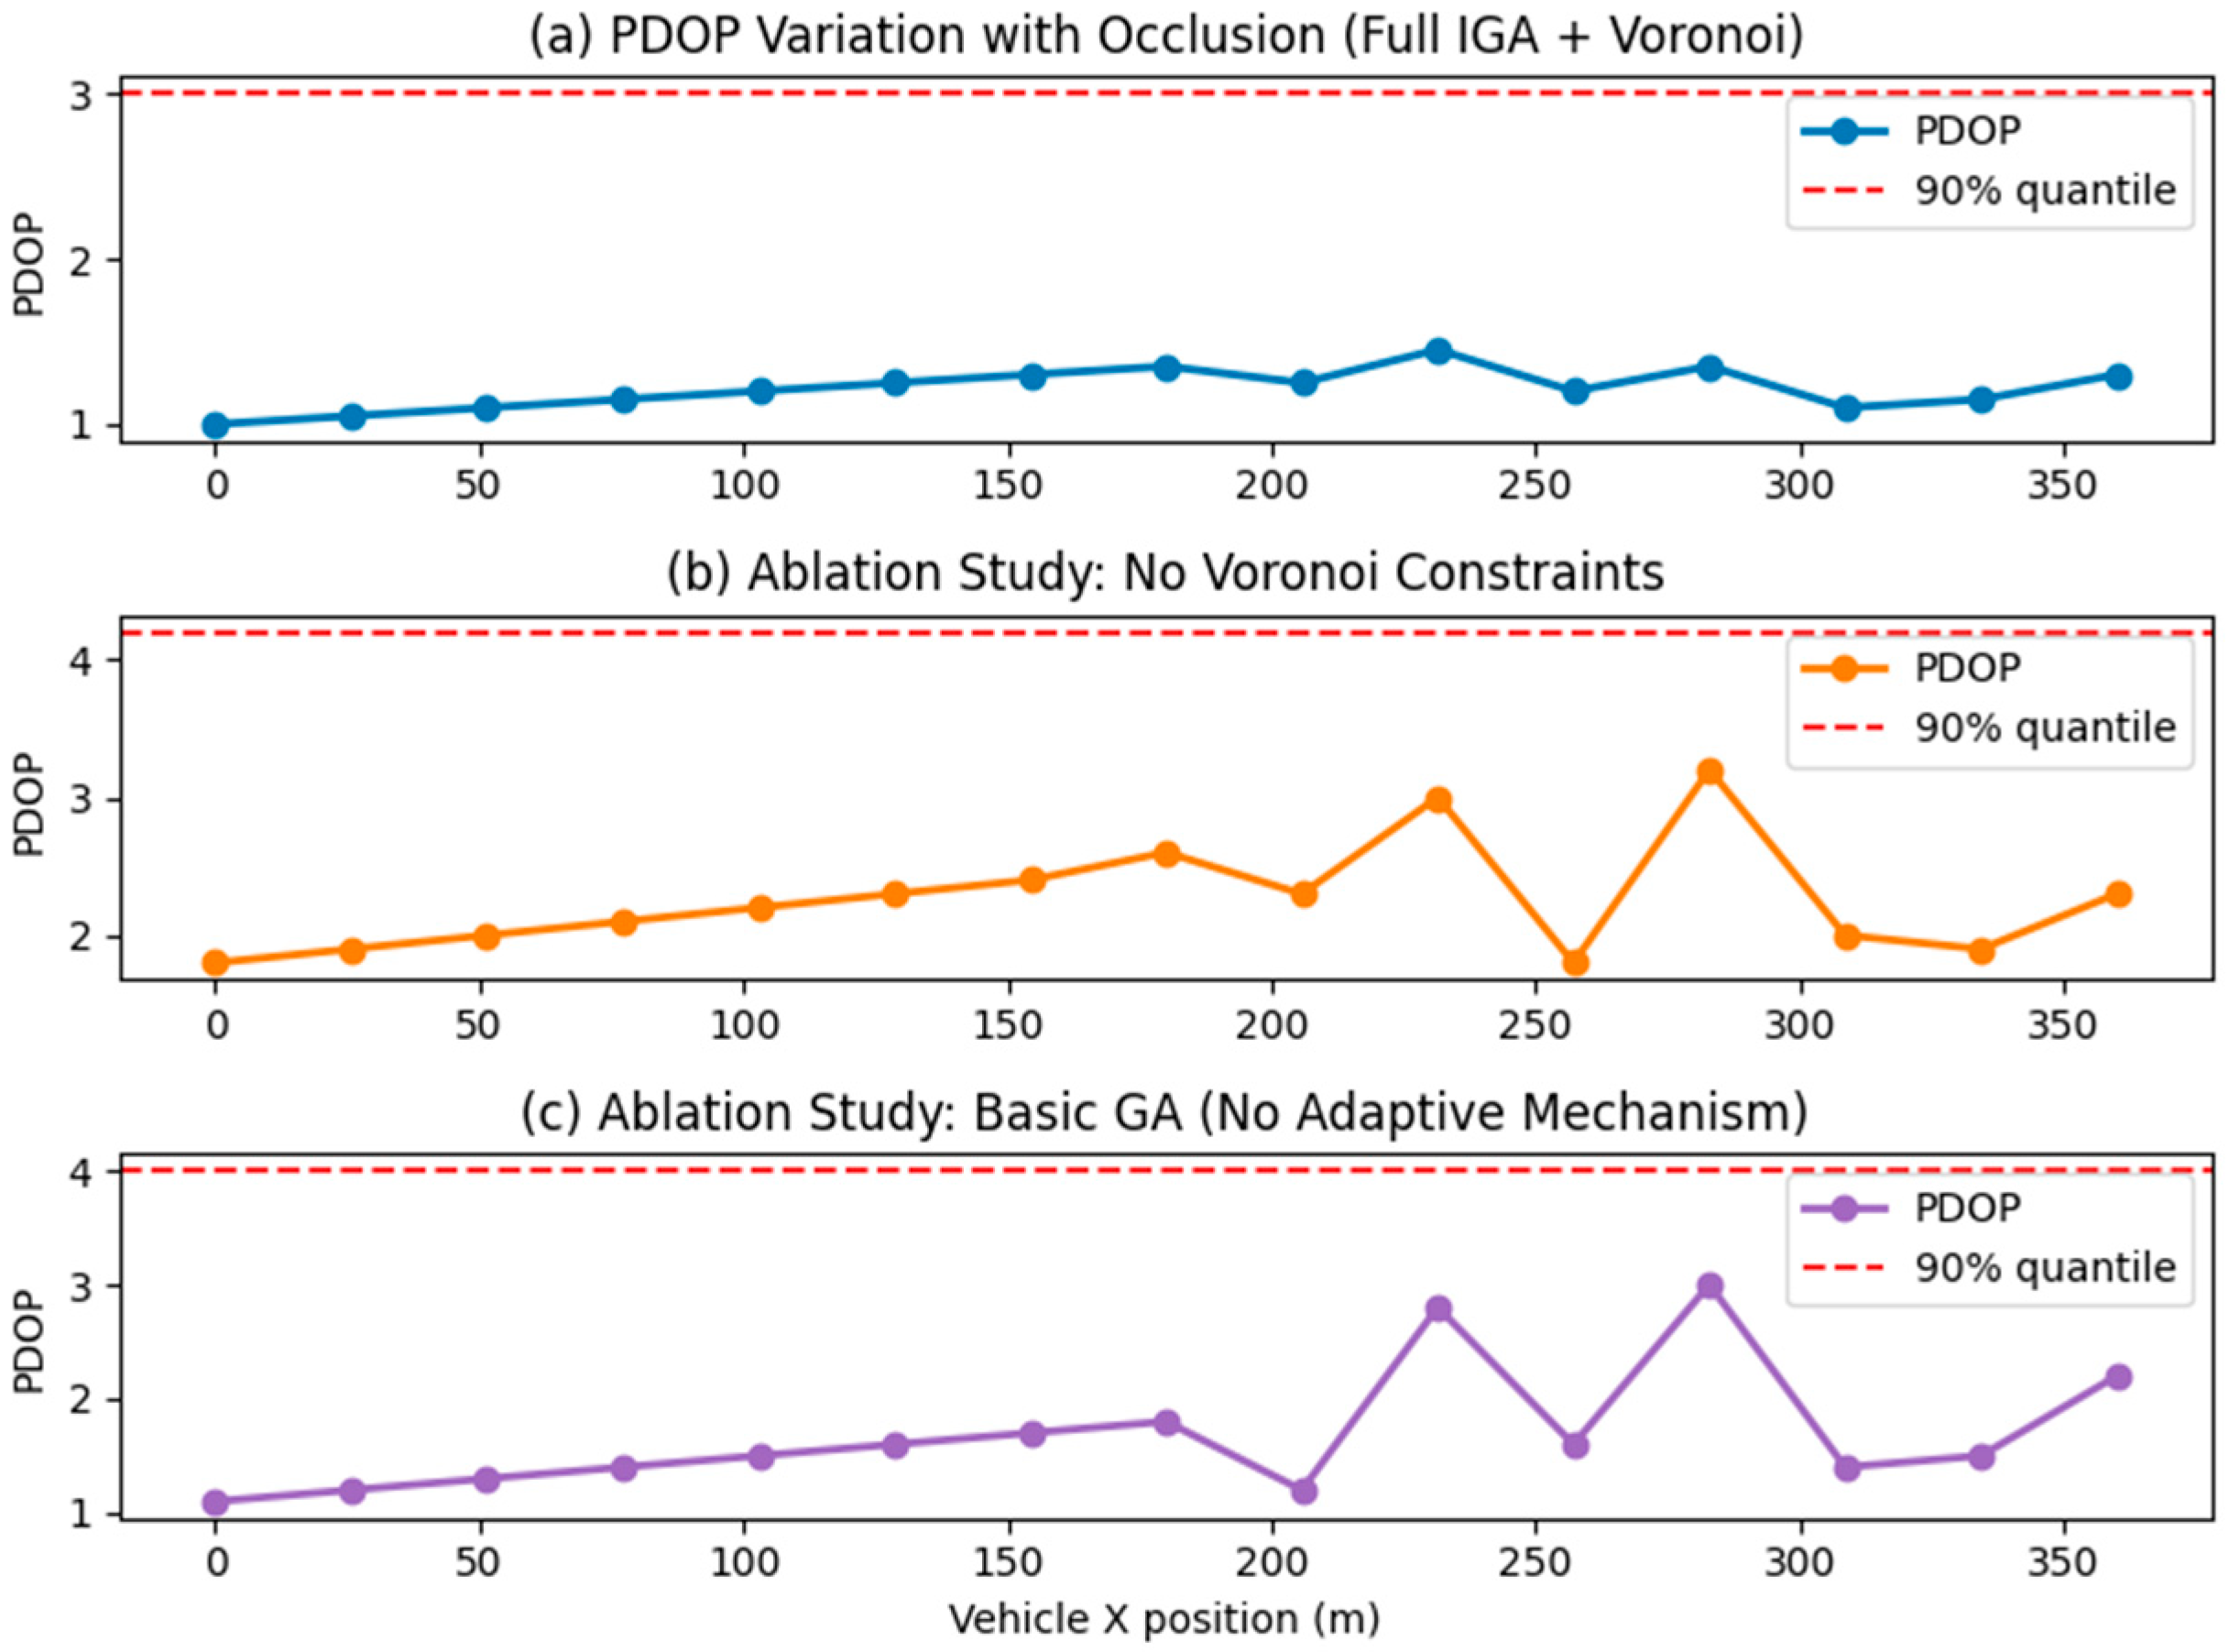
As shown in
Figure 6, the Full IGA + Voronoi-constrained optimization strategy demonstrates significant superiority in tunnel positioning. When the vehicle travels along the 0–360 m trajectory, the PDOP value remains consistently stable within the optimal range of 1.0–2.0, with no noticeable sudden spikes throughout the entire journey. This is attributable to the Voronoi partitioning, which mandates at least one pseudo-satellite in each sub-region, eliminating coverage blind spots through spatial layout. It also benefits from the synergistic effect of the IGA dynamically adjusting the crossover/mutation probability and flexible exploration of optimal geometric configurations in obstructed segments. In ablation experiments without Voronoi constraints, the PDOP curve exhibited severe fluctuations, highlighting the drawbacks of pseudo-satellite over-clustering and the resulting local coverage deficiencies when partitioning constraints are absent. When using a basic GA without adaptive mechanisms, multiple sharp PDOP peaks appeared, further validating the value of IGA’s adaptive mechanism in adapting to scene changes. The core rationale for selecting the 90th percentile PDOP lies in tunnel positioning being a safety-critical application where the top 10% “tail conditions” represent high-risk scenarios. This metric precisely targets such critical scenarios, preventing the average PDOP from masking localized degradation issues. It also demonstrates strong robustness against anomalies like instantaneous spikes caused by obstructions. Furthermore, it directly aligns with the engineering reliability standard of “over 90% of scenarios meeting requirements,” where numerical differences more intuitively quantify the indispensable role of Voronoi constraints and the IGA adaptive mechanism in the improvement strategy.
The 3D diagram of the tunnel PDOP distribution when the group size is 100 is shown in
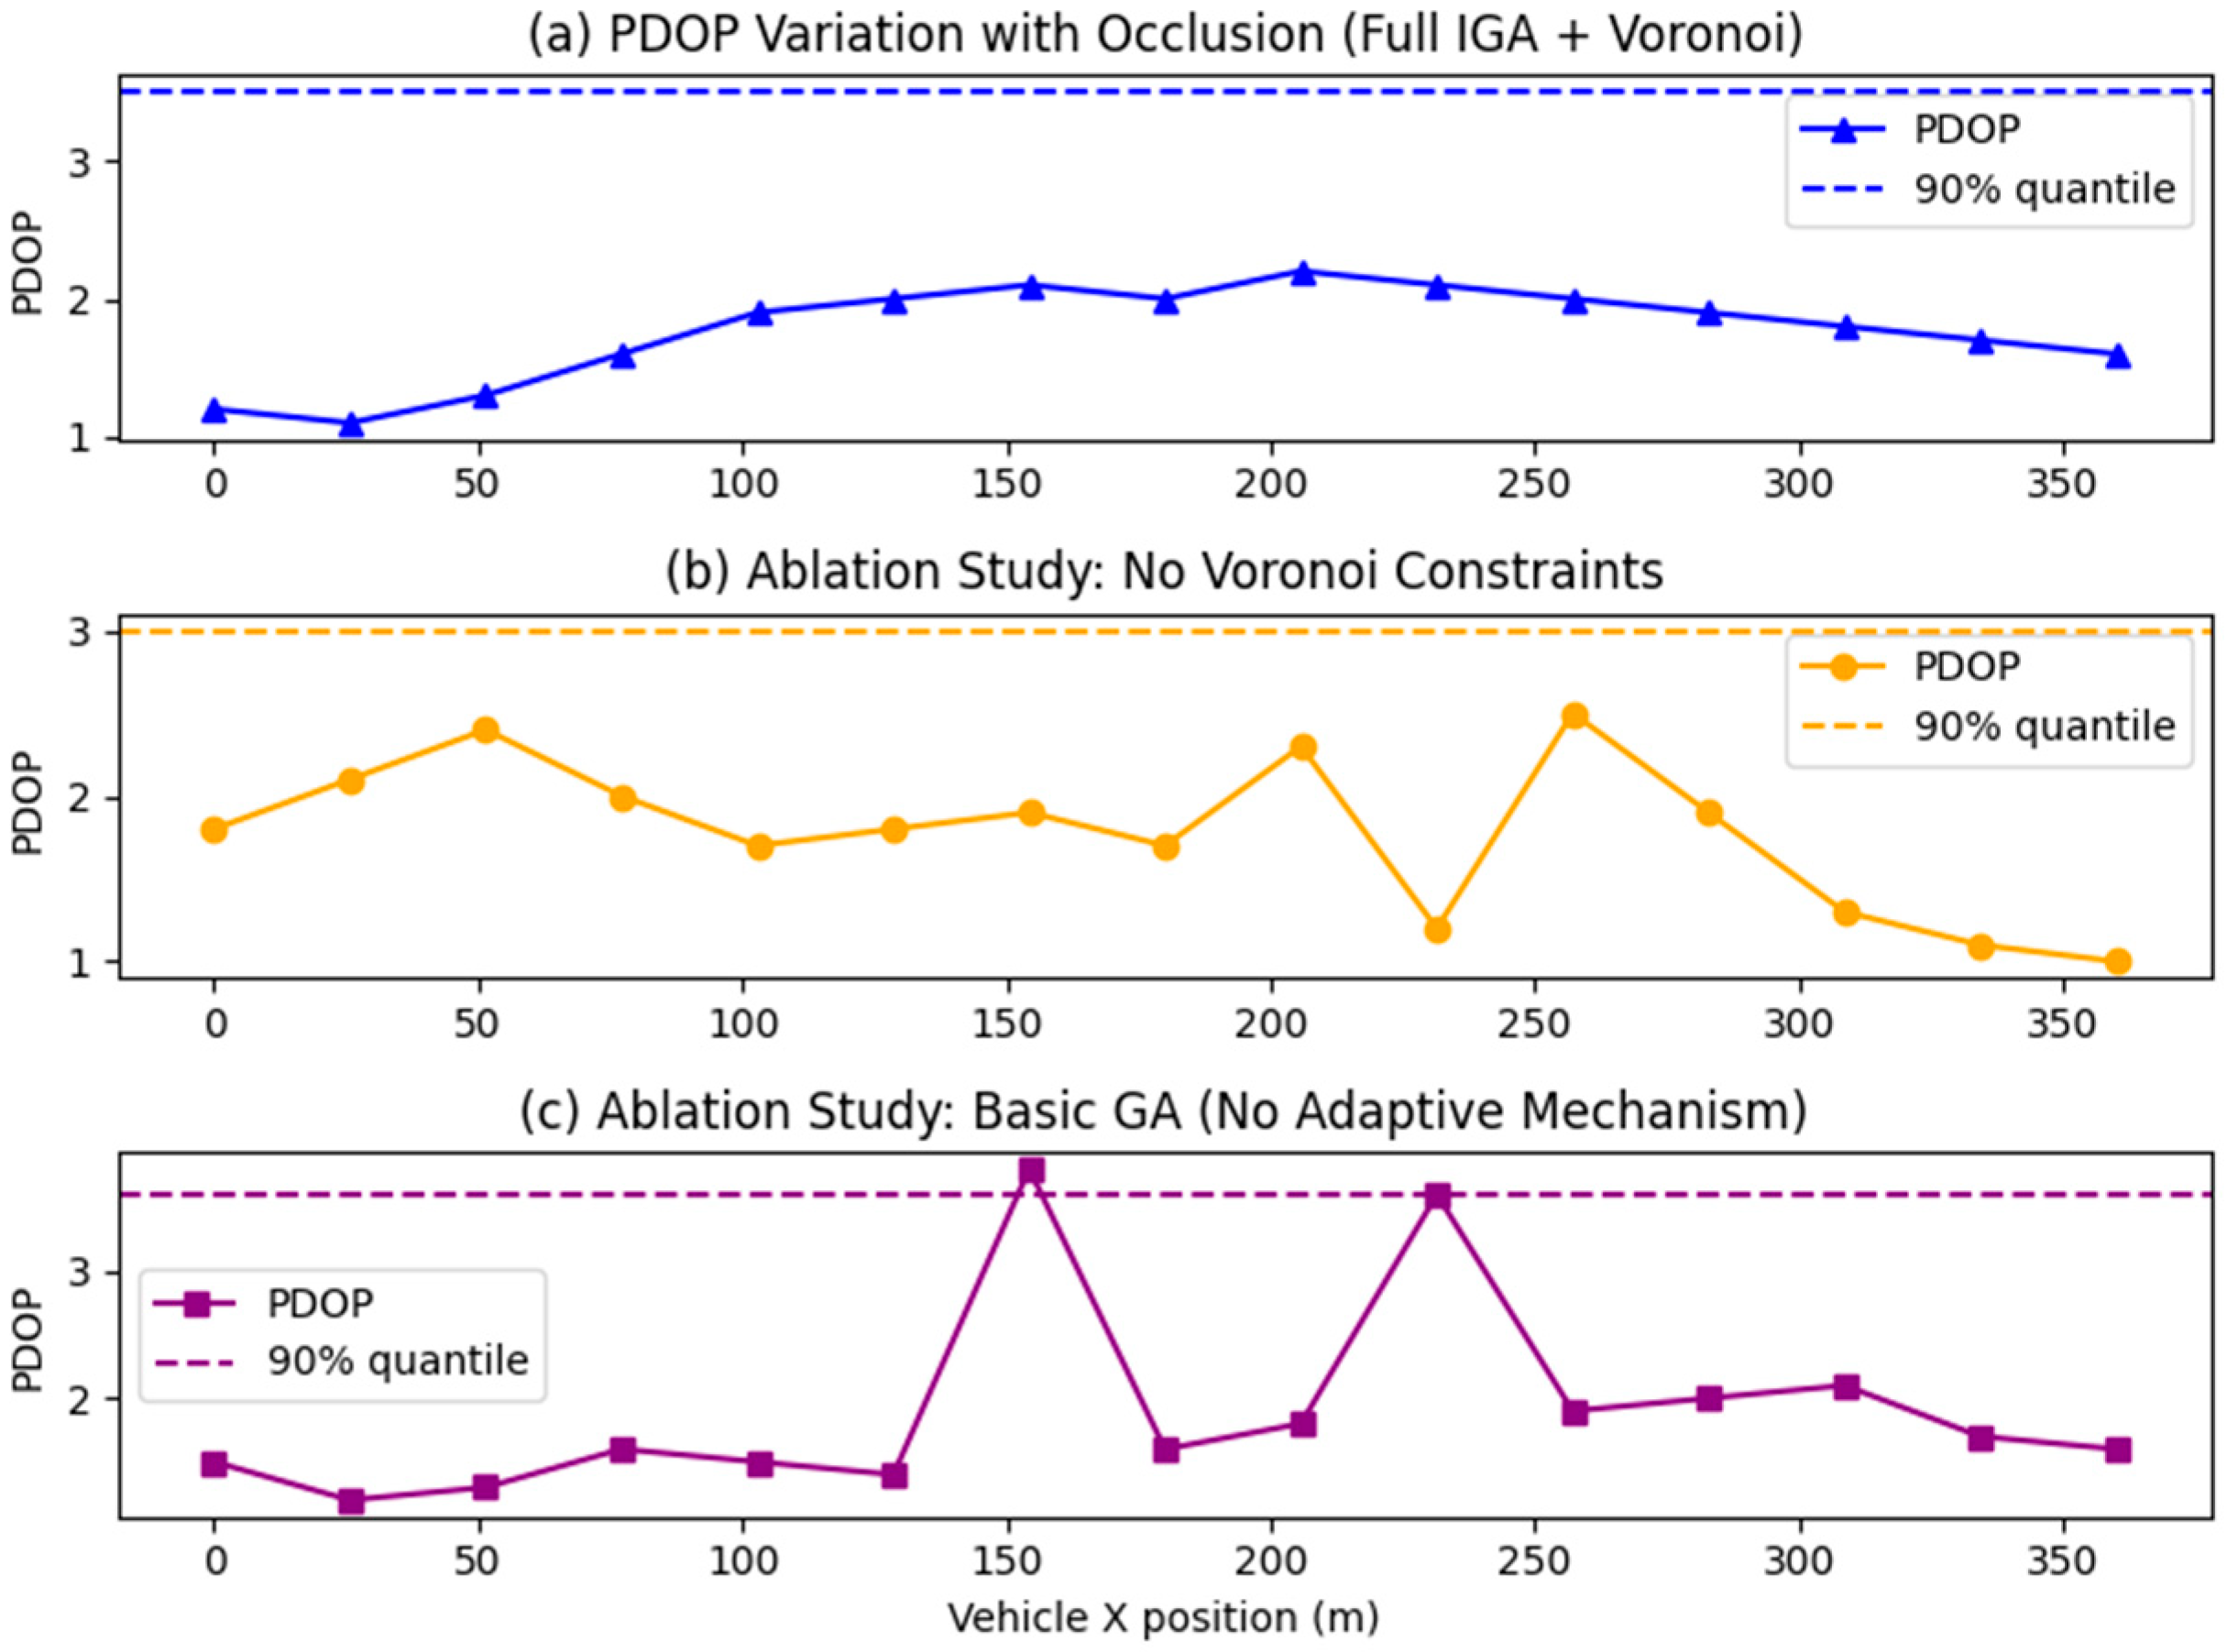
Figure 7. This experiment validated the core advantages of the combined strategy “Improved genetic algorithm + Voronoi Partition Constraint” by comparing the tunnel PDOP performance of three pseudo-satellite layout optimization strategies: In
Figure 7a, the PDOP curve under this combined strategy remains stable overall without pronounced sharp peaks, with a 90th percentile PDOP of 3.55. This is achieved through the synergistic effect of two mechanisms: the Voronoi partition constraint, which mandates at least one pseudo-satellite deployment in each sub-region to eliminate coverage blind spots, and the IGA, which dynamically adjusts crossover mutation probabilities to adapt to the tunnel’s obstructed environment. In
Figure 7b, the ablation experiment without Voronoi constraints shows significantly increased PDOP fluctuations, with abrupt PDOP spikes in later local segments. Although the 90th percentile PDOP is slightly lower, pseudo-satellites tend to cluster in geometrically advantageous areas, leading to local coverage deficiencies and a substantial decline in system positioning stability. In contrast,
Figure 7c, employing a basic GA without adaptive mechanisms, exhibits multiple sharp peaks in the PDOP curve. Although the 90th percentile PDOP aligns with
Figure 7a, peak degradation is more severe. This stems from the fixed parameters of the basic GA failing to dynamically adapt to tunnel scenario changes. In summary, the core advantage of the “Full IGA + Voronoi” combination strategy lies in its full-trajectory stability. While the latter two approaches exhibit local advantages in 90th percentile values, both carry safety risks due to sudden local PDOP spikes. Selecting the 90th percentile PDOP as the evaluation metric is justified because tunnel positioning is a safety-critical application. allowing precise focus on the high-risk tail 10% of operating conditions and preventing average values from masking local defects. It also aligns with the reliability standard of “meeting requirements in over 90% of scenarios” in engineering practice. The numerical differences more intuitively quantify the indispensability of the dual mechanisms within the combined strategy.
4.2. Convergence Time Test
To further compare the iterative convergence efficiency and optimization rate of different intelligent optimization algorithms under the same task, this paper details iterative experiments for comparison. The experiment was conducted under a tunnel/trajectory evaluation framework consistent with the previous simulation: geometric evaluation was performed along a 200 m trajectory, and two typical deployment densities (20 m and 30 m spacing) were set to cover two operating conditions: “relatively sufficient” and “cost constrained sparse”. The algorithm goal remains consistent, that is, to minimize the 90th percentile PDOP (qPDOP) at the trajectory level under occlusion visibility filtering and engineering constraints (such as Voronoi partition coverage, installation surface balance, etc.), in order to demonstrate the ability to suppress the “tail risk” of local geometric degradation in tunnel scenes. Three types of algorithms were selected for comparison: the algorithm presented in this article, the traditional GA, and the CWOA. To ensure fairness, the three algorithms use the same candidate point set, the same constraints and penalty functions, the same fitness definition, and a unified hyperparameter budget: the population size is fixed at 50 and the maximum number of iterations is fixed at 100. If the termination condition is met during the iteration process (such as the fitness change being below the threshold or reaching the maximum number of iterations), it is stopped early. Considering the volatility of random algorithms, each algorithm undergoes multiple independent repeated experiments (with different random seeds) under the same operating conditions, and the statistical average results are used for comparison. All results are the mean ± standard deviation of 10 independent repeated experiments (n = 10), with different random seeds to eliminate the randomness of the genetic algorithm.
Table 1 presents the convergence performance of the CWOA, GA, and IGA under the same experimental conditions. It can be observed that the IGA achieves the shortest convergence time, with an average of 44.89 ± 1.56 generations, outperforming the GA (50.60 ± 1.89 generations) and the CWOA (54.32 ± 2.15 generations). In terms of average convergence rate, the IGA also shows the best performance, reaching 0.031968 ± 0.0025 PDOP/generation, while both the GA and CWOA remain at 0.013851 ± 0.0012 PDOP/generation. These results indicate that the IGA can reduce the optimization objective more efficiently and reach a stable solution in fewer iterations. This improvement demonstrates that the adaptive mechanism introduced in the IGA enhances the search efficiency and accelerates convergence, making it more suitable for the tunnel pseudolite deployment optimization problem considered in this study.
4.4. Pseudolite Layout Experiment Under Different Deployment Spacings
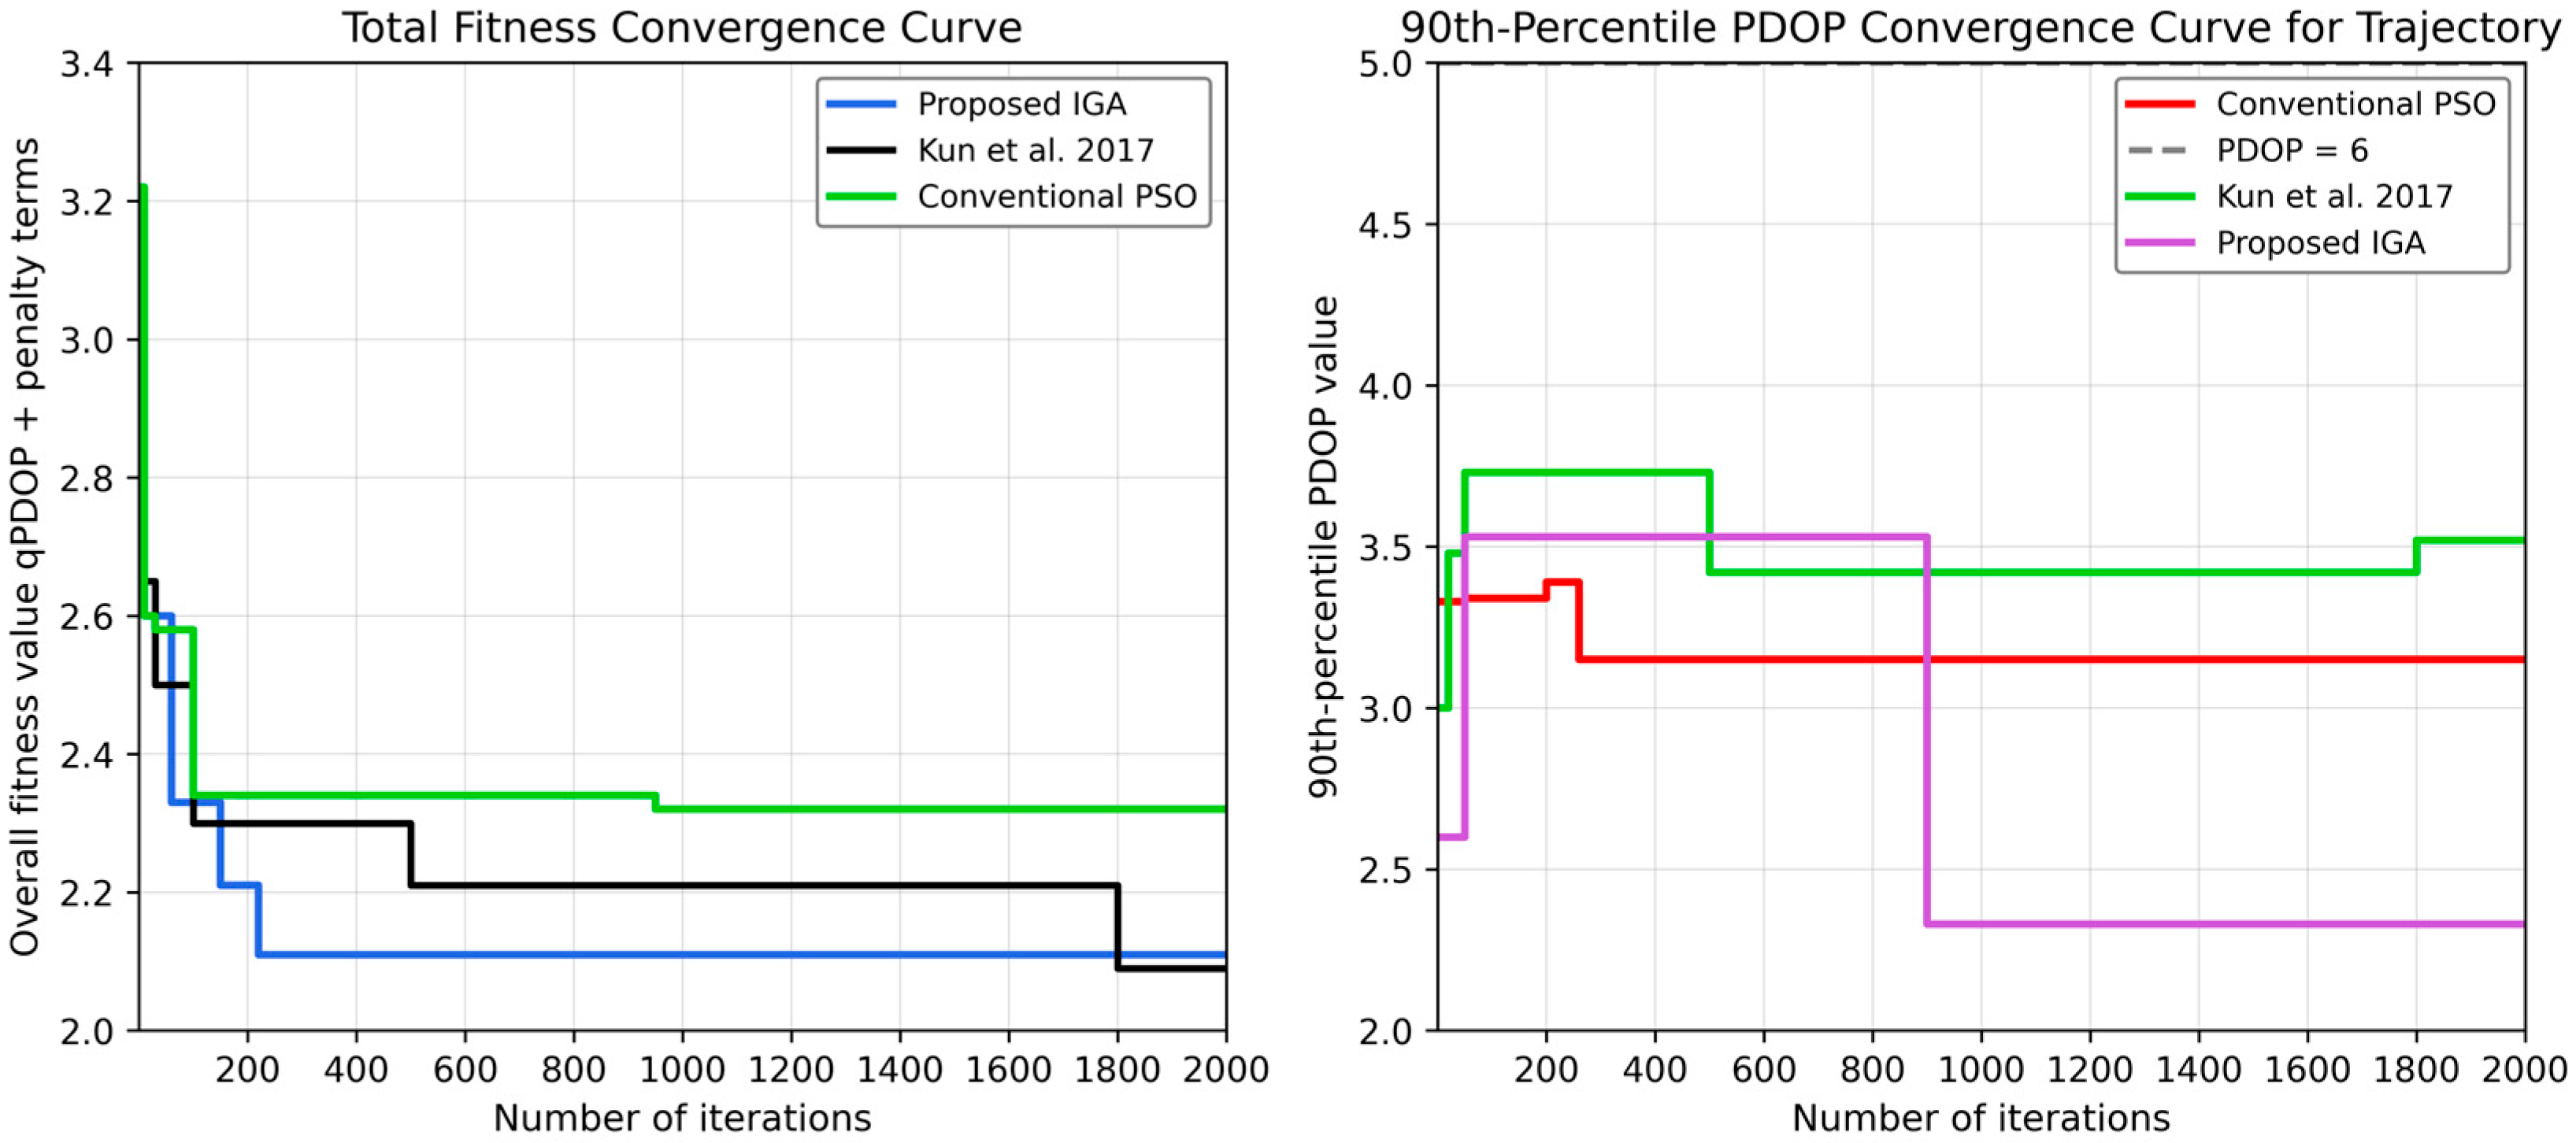
From the perspective of the trajectory 90th-percentile PDOP, the advantage of IGA is more evident. The proposed method reaches the lowest qPDOP value and maintains a stable convergence state, which means that it can more effectively reduce the upper-tail geometric risk along the train trajectory. Since qPDOP emphasizes the suppression of local deterioration rather than only the average geometric level, the result confirms that the proposed IGA is more suitable for tunnel pseudolite layout optimization where visibility interruption and local occlusion frequently occur.
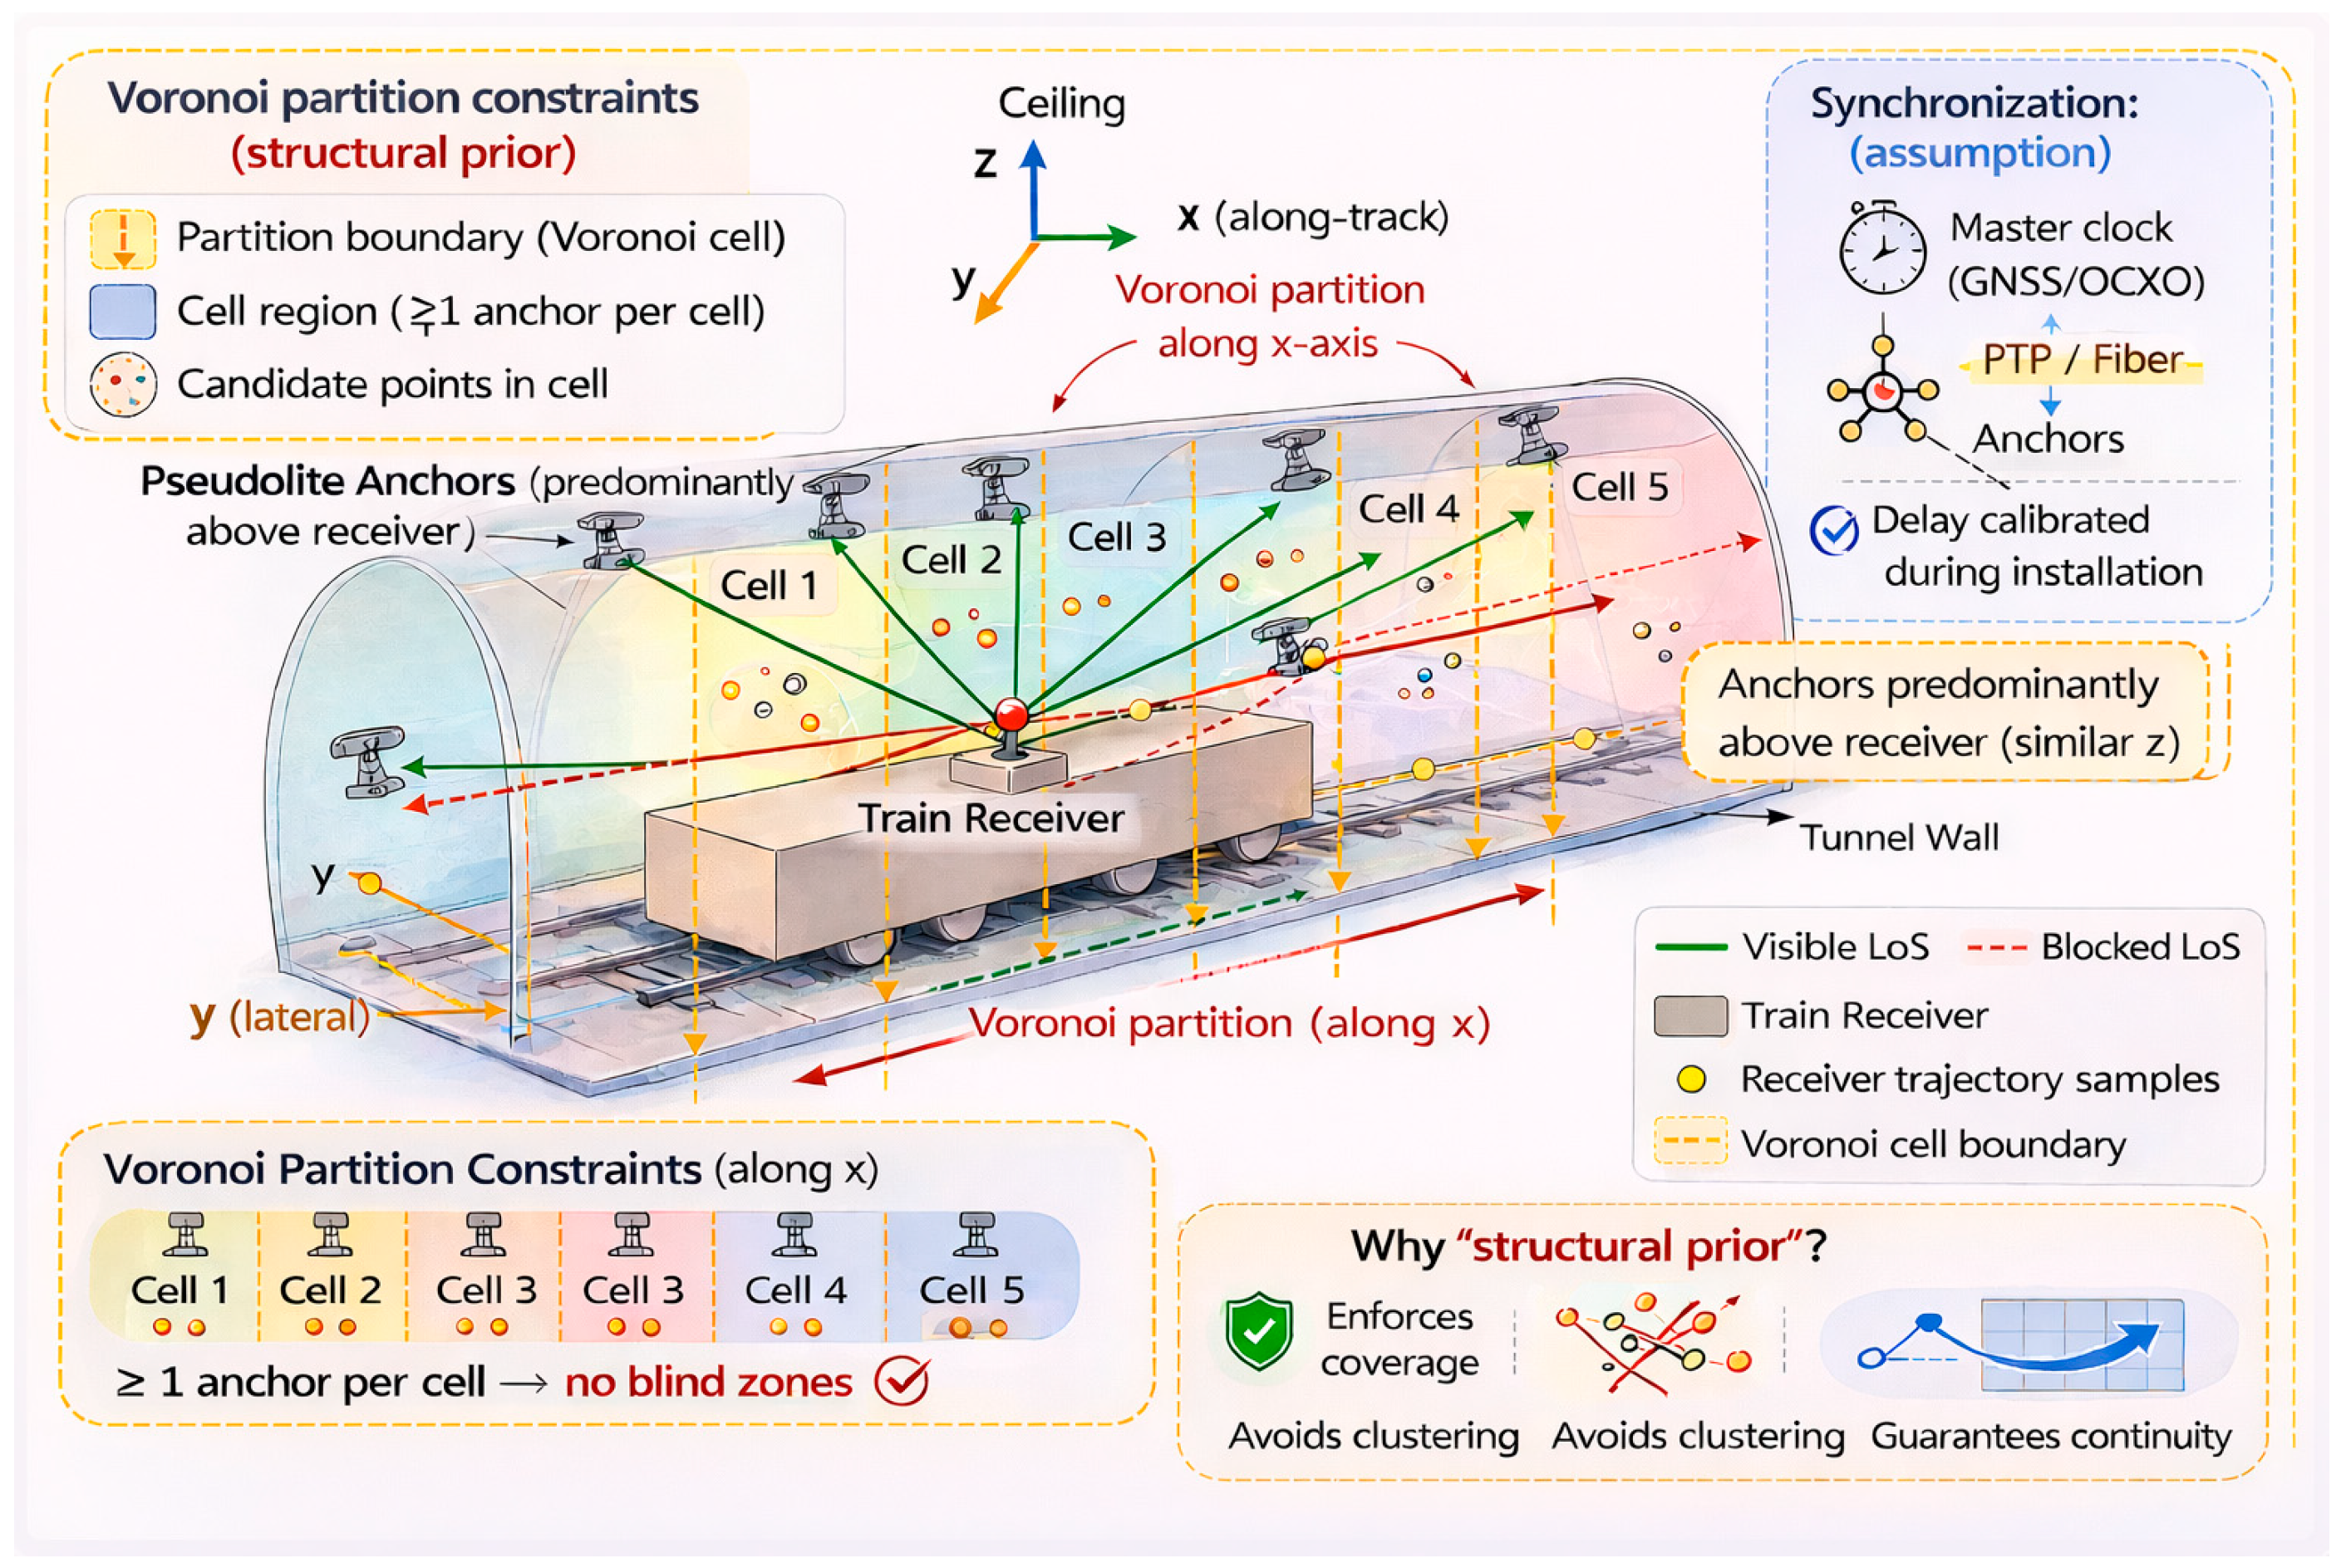
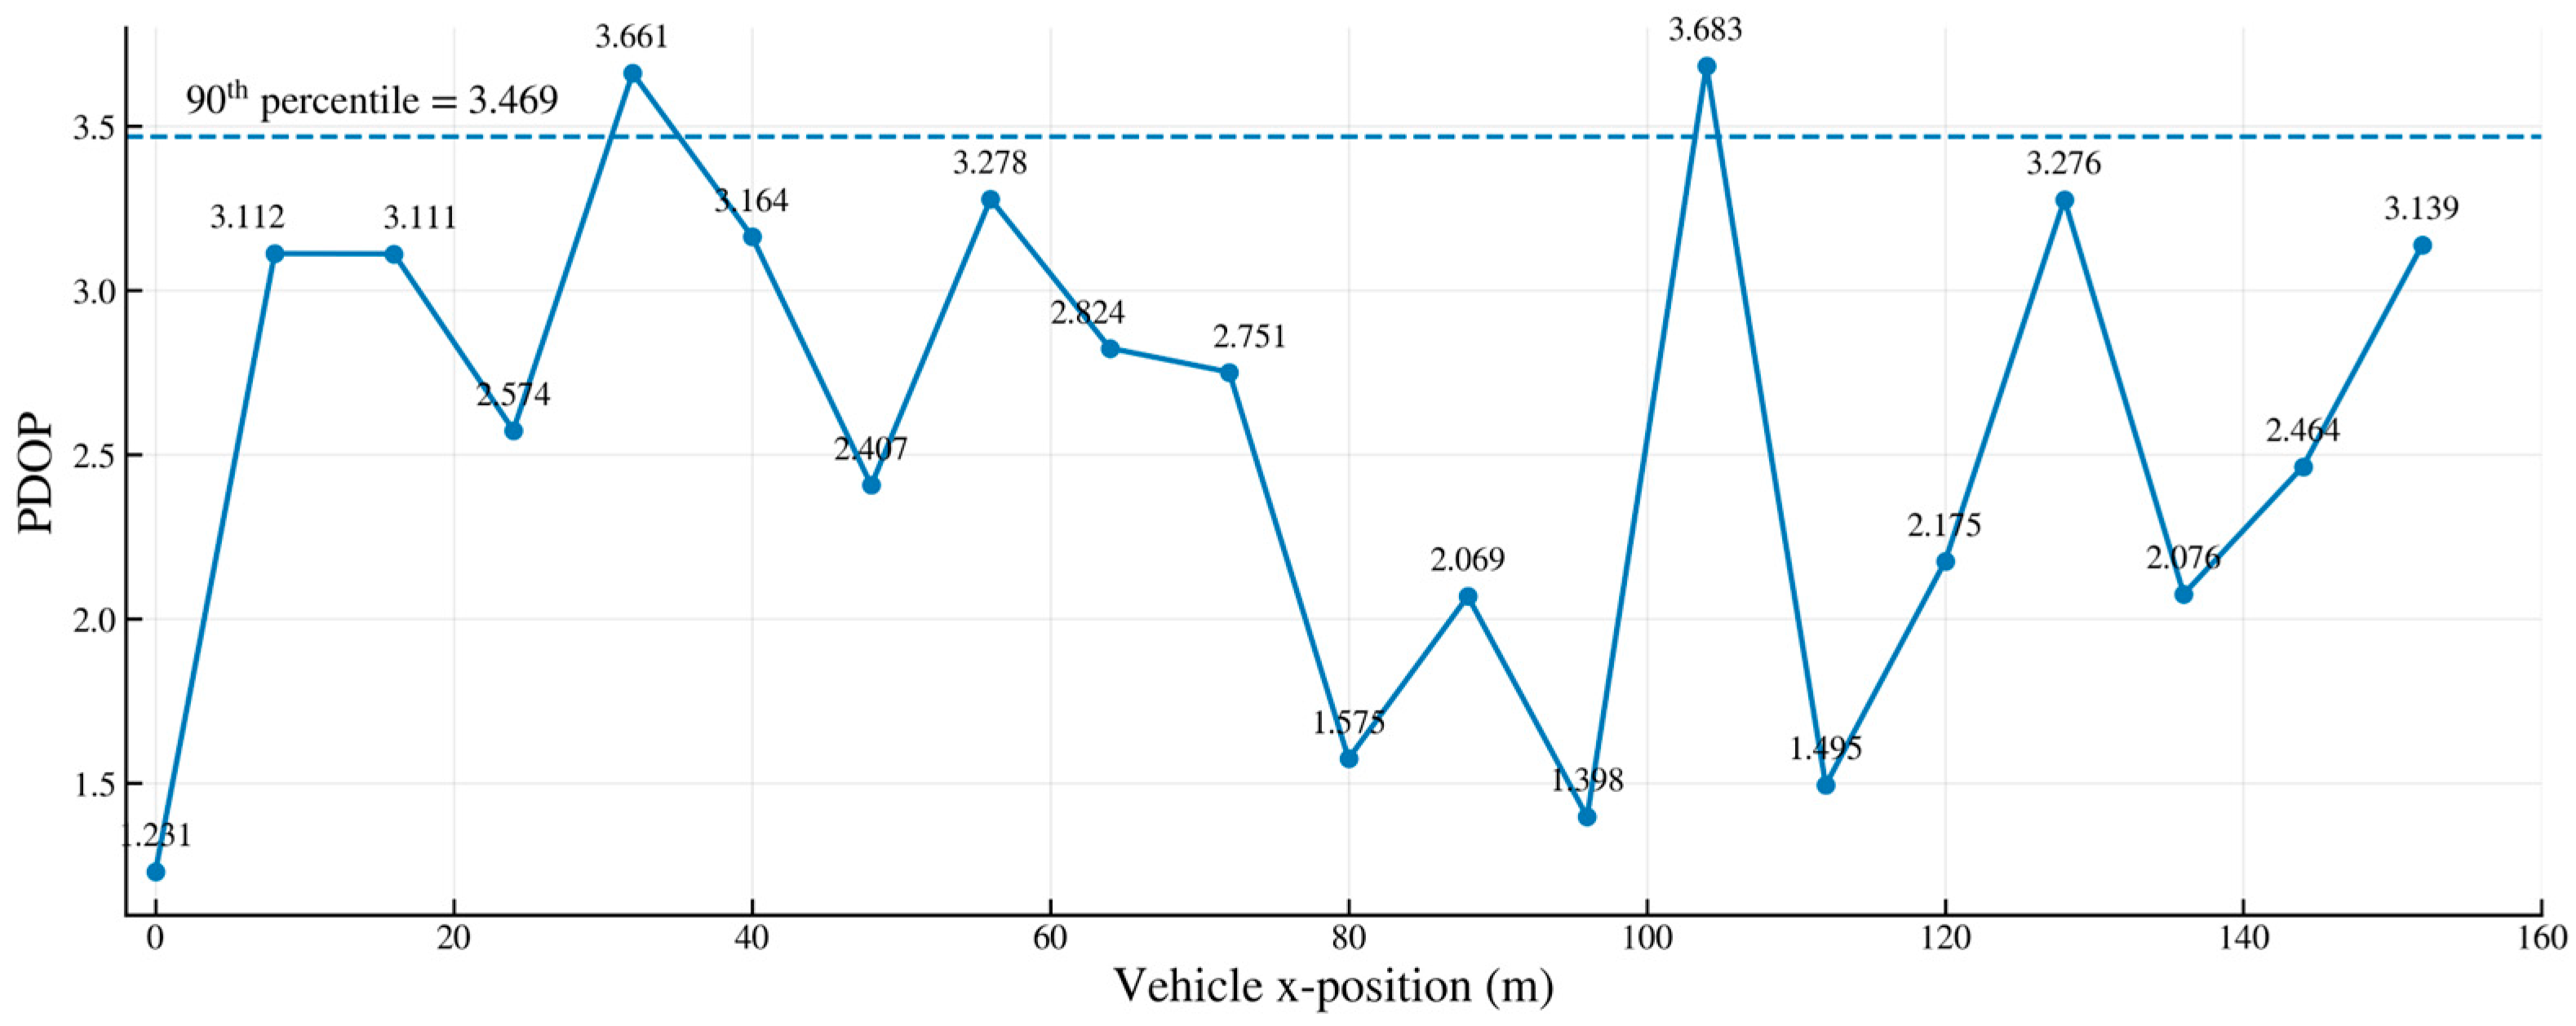
For short-range scenarios with a 200 m track and 20 m spacing, we performed optimization using an adaptive constrained genetic algorithm with a population size of 50 and 100 iterations. The objective was to minimize qPDOP while incorporating constraints such as Voronoi “one cell per antenna” and mounting surface balance.
Figure 9 shows that most PDOP values along the trajectory fall within the 2–3.3 range, with a 90th percentile of 3.469, meeting the design target of “>90% positions PDOP < 3.5.” A single spike of ≈3.683 occurred only at approximately 100 m, caused by a temporary reduction in visible base stations and near-collinear geometry due to combined vehicle–wall obstruction. This result validates the qPDOP target’s effective suppression of tail-end risks and demonstrates how zone/surface-specific constraints enhance coverage uniformity.
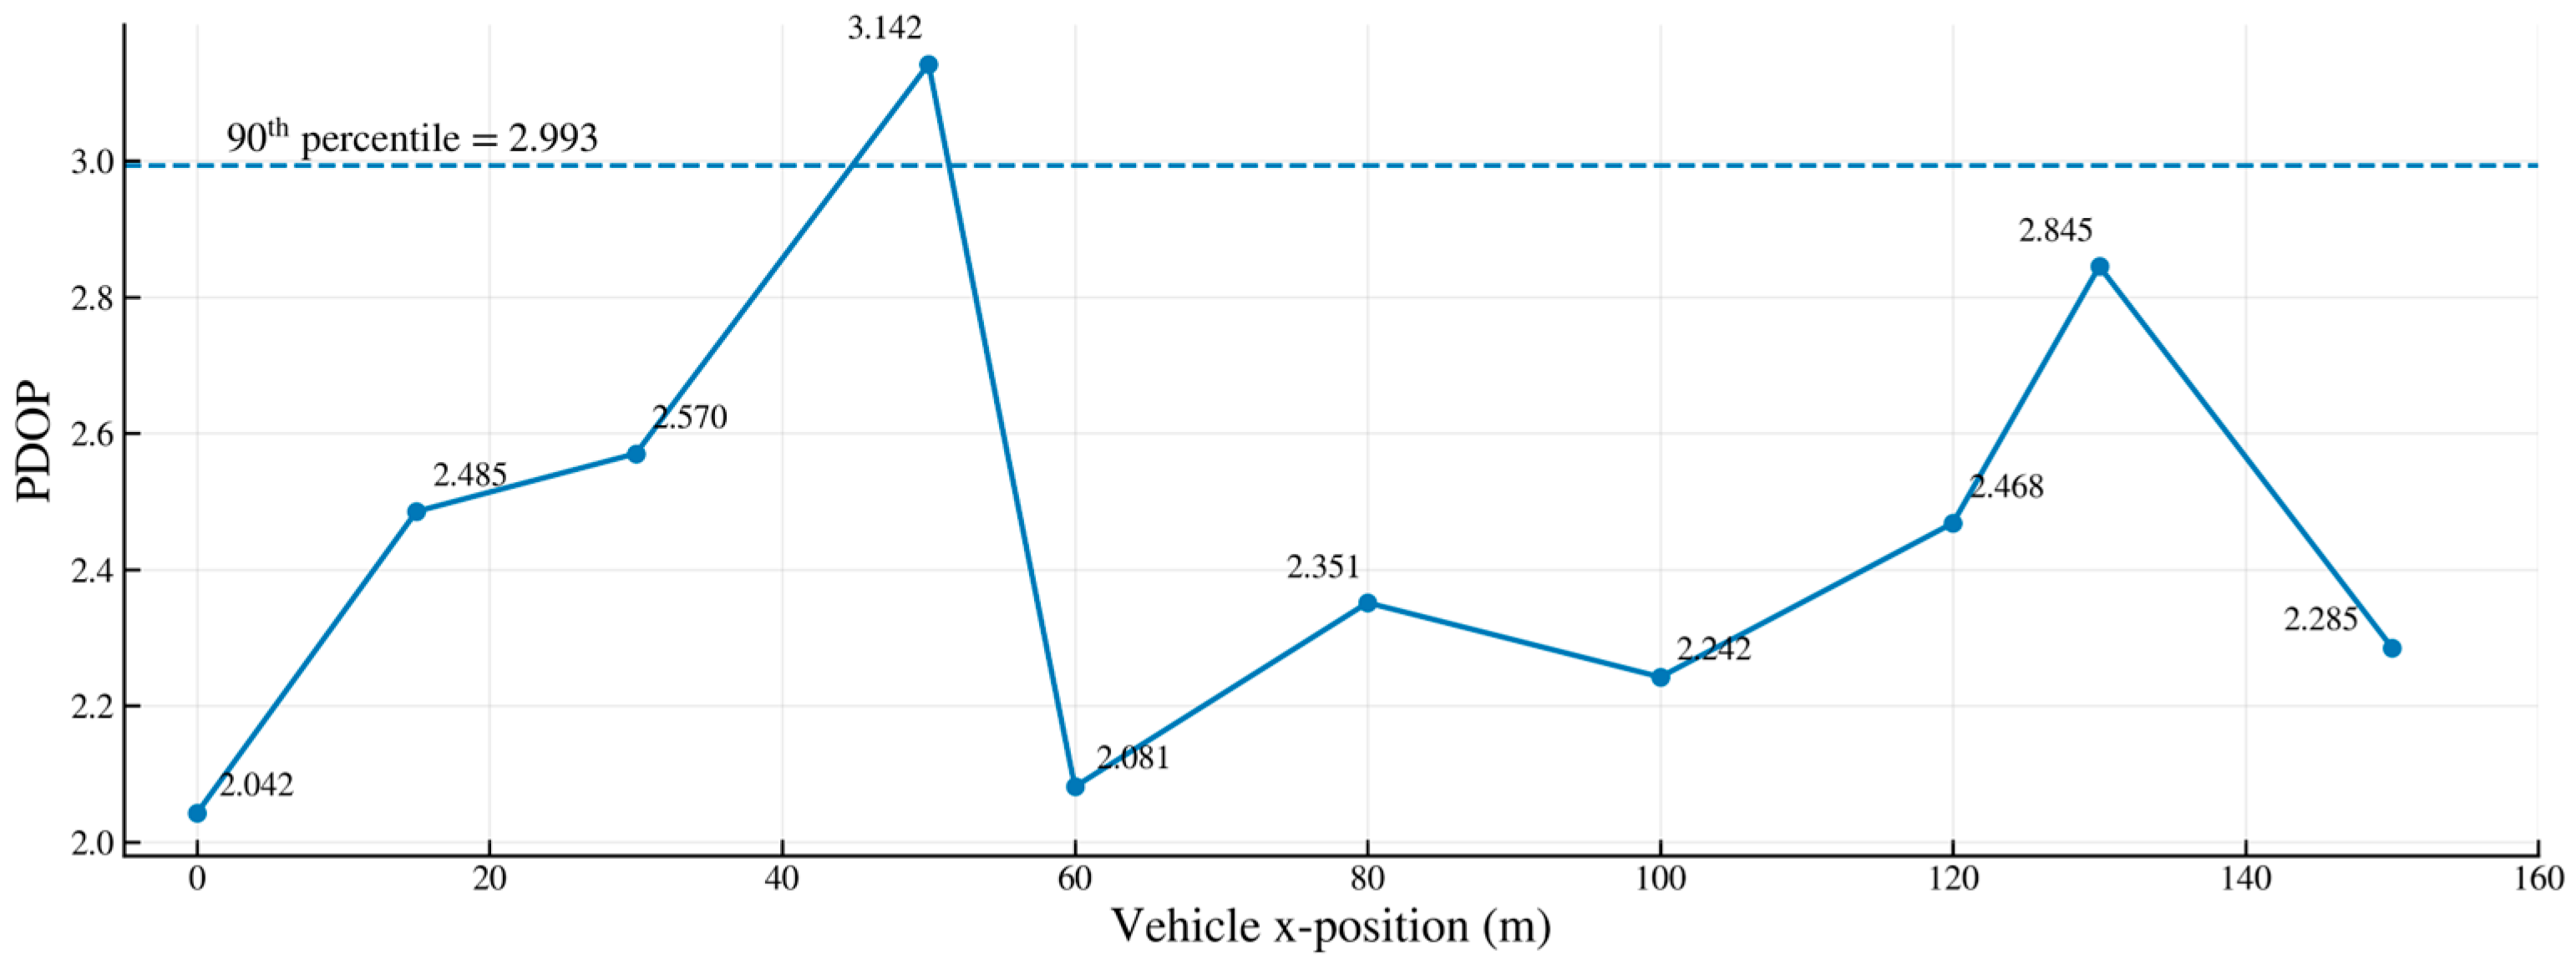
In practical deployments, due to cost considerations, pseudolites are typically deployed at long intervals. Therefore, this paper selected a 30 m interval deployment within a 200 m tunnel, with only seven pseudolites deployed inside the tunnel. The PDOP diagram is shown below.
In
Figure 10 under cost-constrained conditions with only seven units deployed within a 200 m tunnel (≈30 m spacing), the PDOP curve exhibits an overall pattern of “moderate fluctuations with a few isolated peaks”: most locations fall below the 90th percentile dashed line in the figure, indicating that over 90% of driving positions maintain acceptable geometry. Individual peaks predominantly occur in the “semi-shadow zones/occlusion bottlenecks” near the tunnel midpoint and portals. This arises from periodic reductions in visible station counts coupled with near-collinear line-of-sight conditions. However, in adjacent sections where stations are alternately deployed on opposite walls/ceiling surfaces, elevation–azimuth separation is restored, causing PDOP to rapidly decline. Compared to the 20 m high-density scheme, the 30 m spacing shows a slight increase in average and tail PDOP but does not form a continuous plateau exceeding the threshold. This indicates that qPDOP-driven positioning and Voronoi/surface-based constraints can still maintain uniform coverage and controlled tail risk under low-density conditions. Although a few isolated PDOP peaks still appear under the 30 m sparse deployment, no sustained plateau above the design threshold is observed along the trajectory.
Sensitivity analysis of deployment spacing shows that compared to 20 m high-density deployment, qPDOP only slightly increases by 13.7% in 30 m cost-constrained sparse deployment, with no significant decrease in visibility satisfaction rate and no significant PDOP peak over the entire trajectory. The algorithm has excellent robustness within the commonly used spacing range of 20–30 m in engineering.
4.5. Indoor Pseudo-Satellite Layout Experiment
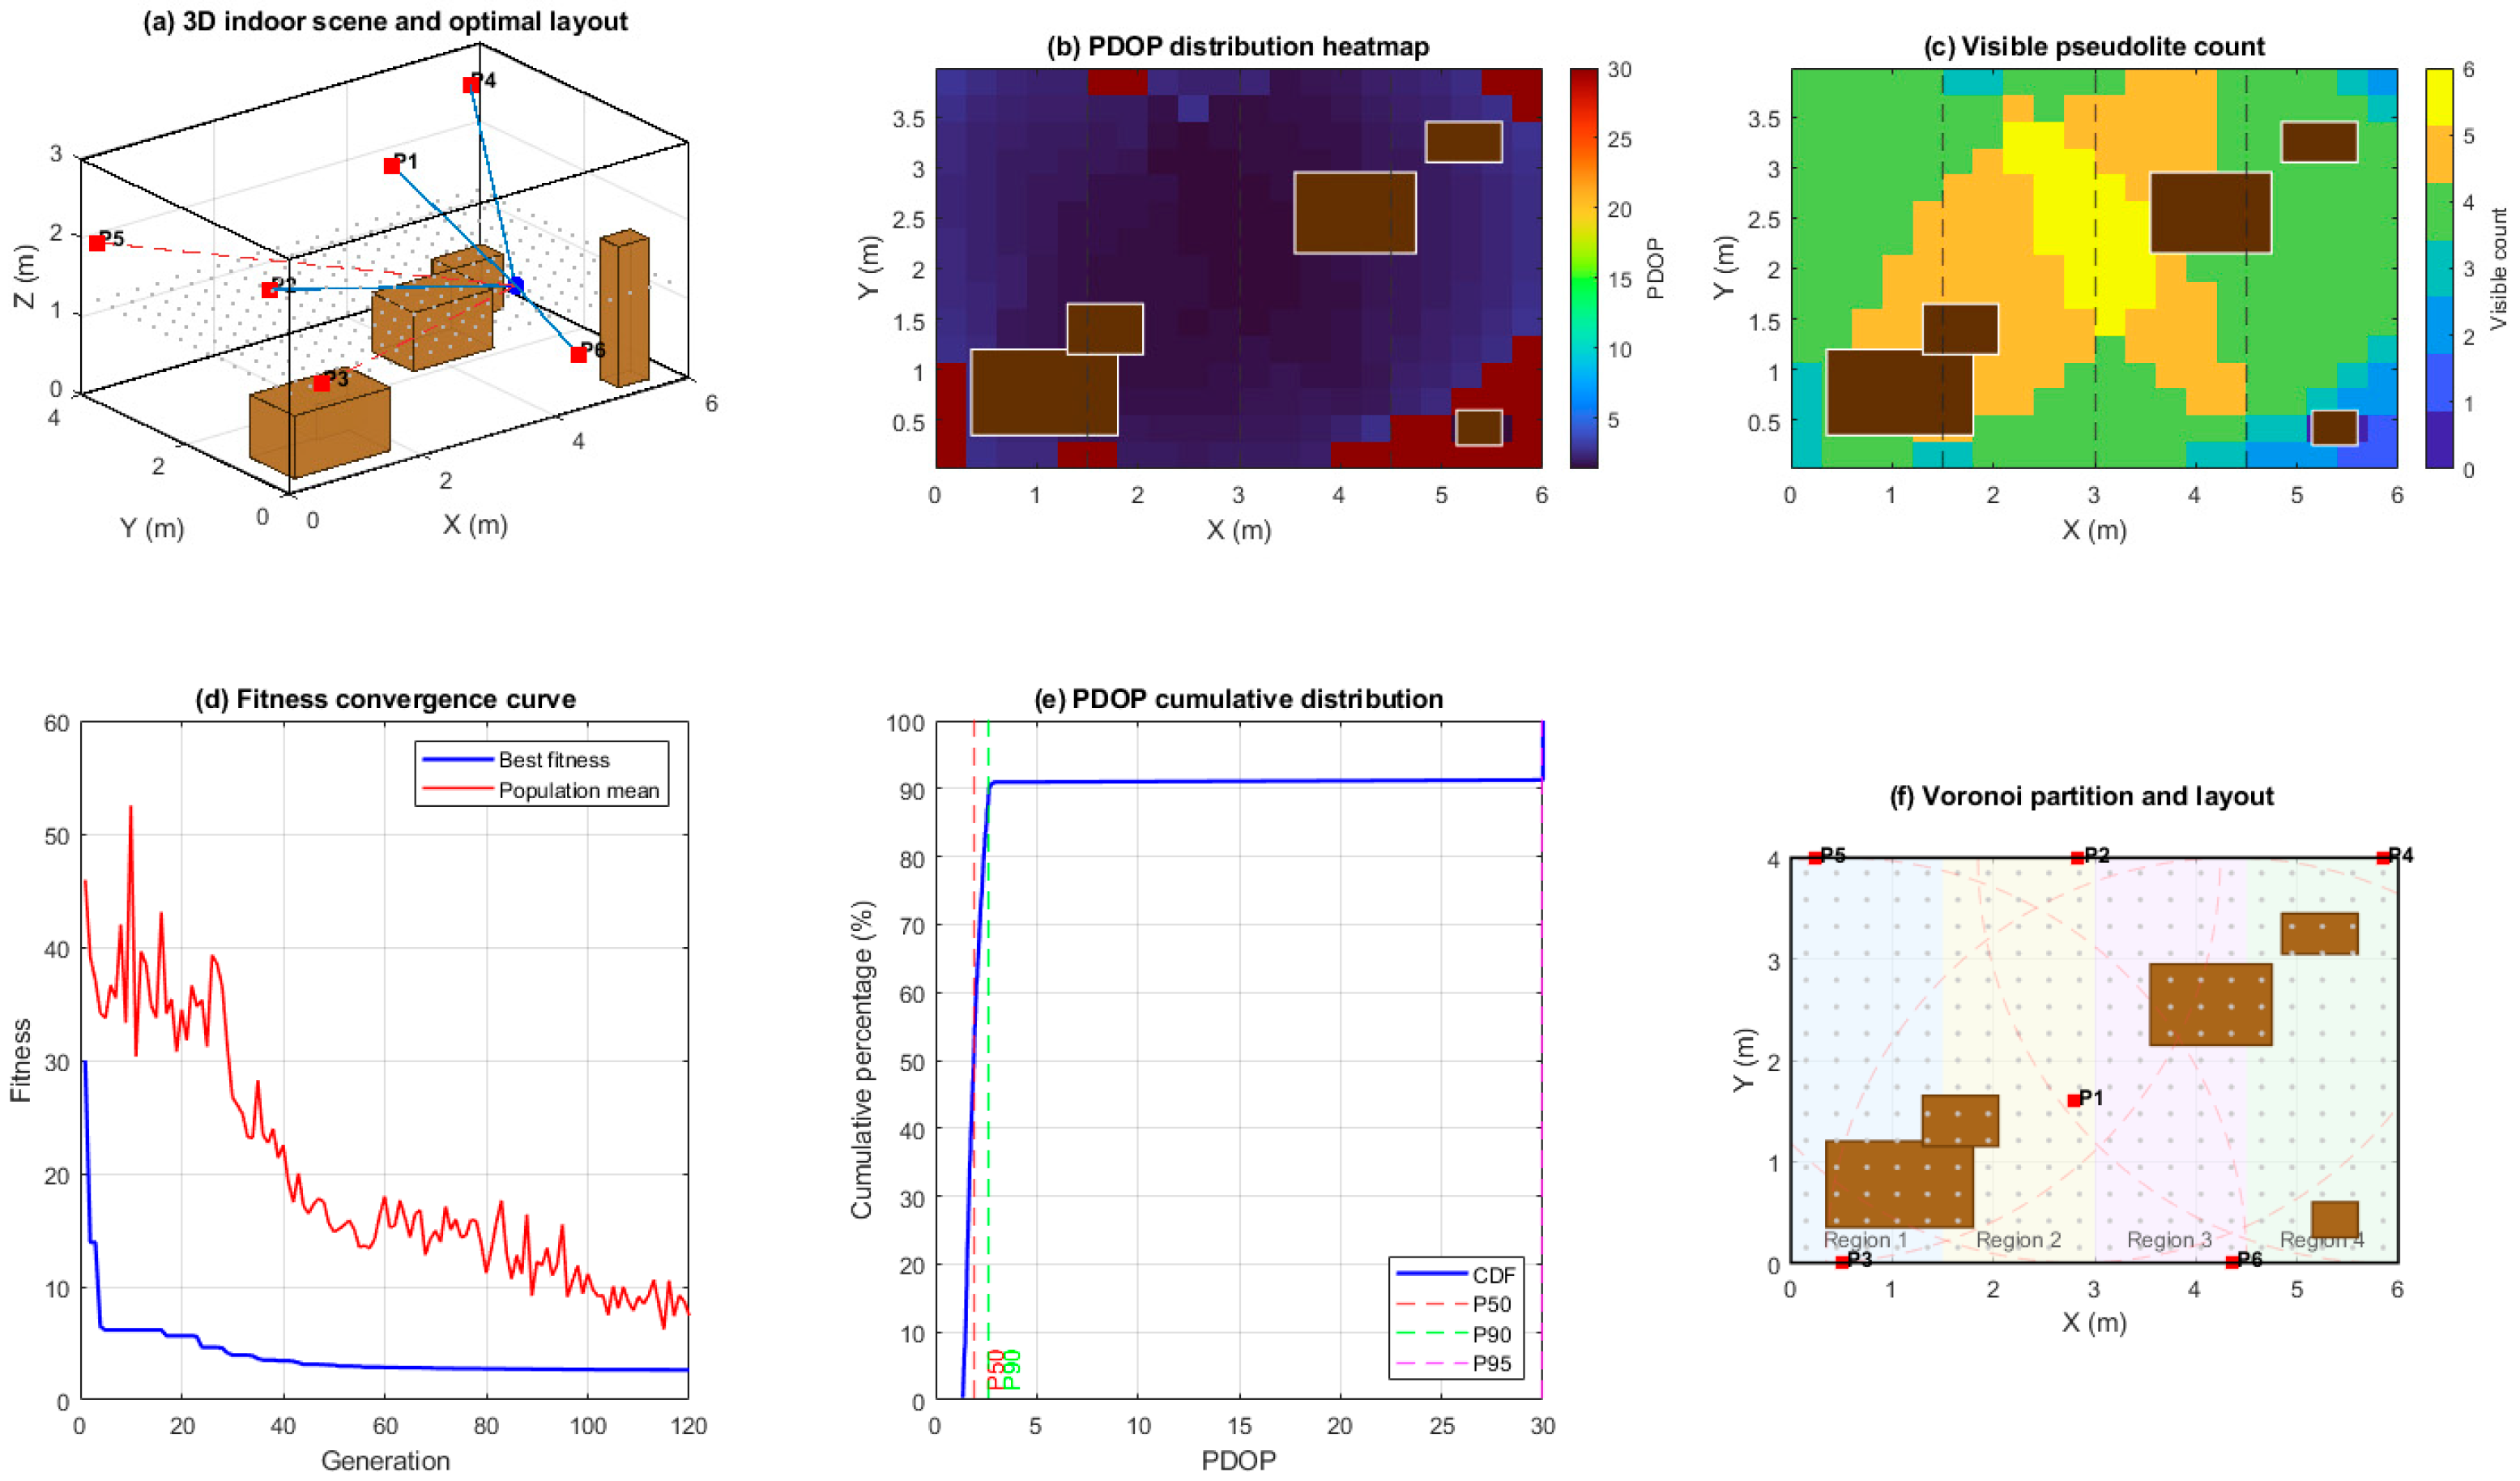
The indoor experiment was carried out in a typical living–dining scenario modeled as a rectangular room with geometric dimensions of 6 m (length), 4 m (width), and 3 m (height). Furniture such as a sofa, coffee table, dining table, bookshelf, and TV stand was explicitly modeled as 3D rectangular obstacles, which block line-of-sight propagation between pseudolites and the receiver. The receiver is assumed to be rigidly mounted on an indoor positioning device (e.g., a fixed terminal or movable equipment platform) at a height of 1.2 m above the floor. Within the room, a 20 × 15 regular grid is generated in the horizontal plane at z = 1.2 m, and grid points falling inside obstacle volumes are removed, yielding a set of valid test locations for performance evaluation. A total of six pseudolites are to be deployed on the ceiling and walls, with a communication radius of 4 m and a minimum separation distance of 0.5 m between any two devices. To encode spatial balance, the room length is partitioned into four Voronoi regions along the
x-axis, and each region is required to contain at least one pseudolite. For each candidate layout, the visibility of pseudolites at every valid test point is determined under obstacle blocking, and the corresponding PDOP values are computed; the primary optimization objective is to minimize the 90th-percentile PDOP while ensuring that most of the indoor area maintains at least four visible pseudolites. The schematic diagram of the indoor environment, obstacles, Voronoi partitions, and pseudolite deployment objective is shown in
Figure 11.
Figure 11 shows the optimization results and performance evaluation of the indoor pseudo-satellite layout based on the Voronoi partition-improved genetic algorithm. As shown in
Figure 11a, the indoor space of 6 m × 4 m × 3 m is modeled as a three-dimensional scene containing obstacles such as sofas, coffee tables, dining tables, bookshelves, and TV cabinets. Pseudo-satellites are deployed at high positions on the ceiling or walls, avoiding direct obstruction from high-volume furniture as much as possible. The PDOP heatmap shown in
Figure 11b indicates that under the optimal layout, the PDOP of most effective sampling areas remains at a low level, with only local high-value bands appearing near furniture edges and room corners, indicating that the optimization results can effectively suppress geometric degradation caused by occlusion.
Figure 11c shows the spatial distribution of the number of visible pseudo-satellites. In most indoor locations, four or more pseudo-satellites can be observed simultaneously. The number of visible satellites is highly consistent with the low-PDOP-value area, verifying the synergistic improvement effect of optimized layout on visibility and geometric accuracy.
Figure 11d shows the fitness convergence process of the improved genetic algorithm, where the fitness value rapidly decreases in the first few generations and gradually stabilizes, indicating that through adaptive crossover/mutation probability and dynamic penalty factor settings, the algorithm can converge to a better solution within a limited number of iterations without significant premature convergence.
Figure 11e shows the cumulative distribution function of the optimized PDOP, with a steep rise in the low PDOP range. The coverage ratios of PDOP < 3 and PDOP < 5 are significant, indicating that the overall geometric accuracy distribution is concentrated and has good robustness.
Figure 11f shows the Voronoi partition and pseudo-satellite mounting positions from a planar perspective, with each partition containing at least one pseudo-satellite, avoiding the “geometric void” caused by excessive aggregation of pseudo-satellites in local areas. From
Figure 11a–f, it can be seen that the proposed Voronoi partition constraint and adaptive genetic optimization strategy can still achieve good PDOP performance and visibility coverage in complex furniture occlusion environments, providing effective engineering reference for indoor pseudo-satellite deployment.