1. Introduction
The aero-engine wake, due to its distinct infrared spectral features that differ markedly from other aircraft components and the surrounding environment, has become a key “fingerprint” for infrared detection, tracking, and identification of aircraft [
1,
2,
3]. Its spectral features—including line peak intensity, broadening, shape, and position—are directly determined by the internal combustion chemical reactions within the plume and the external atmospheric absorption effects. In this process, the fuel–air ratio, as the core input parameter of the combustion system, directly determines combustion completeness and the concentration of characteristic gas components. The exhaust temperature, serving as the initial thermodynamic condition, significantly influences fluid properties and molecular transition probabilities. Furthermore, the selective absorption of atmospheric gases such as H
2O, CO
2, and O
3 further alters the spectral structure and intensity distribution of the wake radiation [
4,
5,
6]. These three factors result in complex band selectivity and parameter sensitivity in the infrared spectrum of the exhaust plume, necessitating systematic single-factor analysis to reveal their individual influence mechanisms.
Early pioneering studies on exhaust plume infrared radiation date back to the 1980s. Decher [
7] numerically investigated the infrared emission from turbofan engines with high aspect ratio nozzles, revealing the influence of nozzle geometry on the plume infrared signature. Nelson [
8] analyzed the influence of particulates on the infrared emission from tactical rocket exhausts. Heland and Schäfer [
9] first applied Fourier-transform infrared (FTIR) emission spectroscopy to the analysis of aircraft exhausts, and subsequently determined the major combustion products in aircraft exhausts by FTIR emission spectroscopy [
10]. Surzhikov [
11] developed a three-dimensional model of the spectral emissivity of light-scattering exhaust plumes. Buzykin et al. [
12] reported the spectroscopic detection of sulfur oxides in the aircraft wake, and Dix et al. [
13] conducted an infrared signature reduction study on a small-scale jet engine. These early works laid the experimental and modeling foundations for the wake infrared spectral analysis presented in this study.
Regarding the influence of component concentration, Wang et al. [
14] conducted ground static tests comparing the radiation intensity of wakes from dual-base propellants with different energy characteristics. They demonstrated that fuel composition and fuel–air specific energy alter characteristic gas concentrations, thereby regulating radiation signals in the 2.2–10 μm band. Niu et al. [
15] developed an IRSAT model to investigate the effect of HTPB/AP ratio on rocket exhaust infrared radiation, finding that a 3% increase in HTPB mass fraction could elevate radiation intensity by up to 50% in certain bands. They attributed this variation primarily to changes in exhaust gas concentrations of H
2O, CO
2, and other components. Cai et al. [
16] demonstrated that elevated concentrations of radiative components like H
2O and CO
2 in the exhaust plume during reignition reactions cause radiation intensity in the 2–5 μm band to increase by 50–100% under single-step reactions and 150–170% under multi-step reactions; Bao et al. [
17] validated through a 17-step chemical reaction mechanism model combined with ground test data that elevated rocket engine exit temperatures significantly enhance flame re-ignition effects. This increases the concentration of radiatively active components like H
2O and CO
2 in the wake, leading to substantial increases in infrared radiation intensity at wavelengths such as 2.7 μm and 4.3 μm. Zhou et al. [
18] simulated infrared radiation from typical aero-engine exhaust systems using a multi-scale narrow-band-correlated k-distribution model. They found that CO
2 contributes significantly more to wake infrared radiation intensity than water vapor in both the 3–5 μm and 8–14 μm bands, and that lower carbon content in fuel correlates with reduced wake infrared radiation intensity.
Regarding temperature effects, Sun et al. [
19] analyzed exhaust temperature uncertainty using polynomial chaotic expansion, concluding that elevated temperatures increase the probability of radiation transitions in H
2O characteristic bands and cause peak redshifts. Jiang et al. [
20] investigated changes in CO
2 molecular vibrational–rotational energy levels at different temperatures, discovering that elevated temperatures alter the peak intensity and fine structure of CO
2 radiation in the 4.3 μm characteristic band, thereby influencing the infrared radiation characteristics of the wake in this band. Zhang et al. [
21] investigated the combined infrared radiation characteristics of aircraft skin and exhaust plumes, finding that the radiation intensity of the exhaust plume in the 3–5 μm band increased exponentially by 5.1 times as the nozzle inlet temperature rose from 700 K to 1000 K, with the nozzle base exhibiting significantly enhanced backward radiation. Pan et al. [
22] observed that when helicopter exhaust temperature increased from 900 K to 1200 K, plume radiation intensity in the 3–5 μm band rose by approximately 100%, while its impact on skin radiation was only 5%. The effect on total infrared radiation was primarily concentrated in the plume. Bonchan et al. [
23] experimentally measured the infrared spectral radiation intensity of the wake from a microturbine engine at different measurement positions and with circular and square nozzle configurations. They found that as the distance from the nozzle outlet increased, the mixing of the wake with ambient air caused a temperature decrease, with the largest reduction in radiation intensity occurring in the 2100–2500 cm
−1 band.
In studies of atmospheric absorption effects, researchers have focused on the attenuation of tail radiation transport by atmospheric gases such as H
2O, CO
2, and O
3. For ground-based detection scenarios, Stowe et al. [
24] observed through Fourier-transform infrared spectrometer (FTIR) experiments that H
2O absorption at 3756 cm
−1 (O-H stretching vibration) and 1590 cm
−1 (H
2O bending vibration) in the atmosphere reduces the spectral peak intensity of ground-detected wakes by 15–20%. For space-based detection scenarios, Zhou et al. [
25] numerically simulated atmospheric conditions at different altitudes. They found that as altitude increases, atmospheric density decreases, weakening the absorption effects of H
2O and CO
2. Consequently, the effective transmission distance of wake radiation can be extended by 30–50%. Li et al. [
3] constructed a simulation model of the infrared characteristics of space-based observation aircraft. Through data validation and analysis of the interaction between wake radiation and atmospheric components in the 2.5–13 μm wavelength band, they found that H
2O and CO
2 are the primary components causing atmospheric attenuation. These gases strongly absorb wake radiation at wavelengths such as 2.7 μm and 4.3 μm, leading to significant attenuation and energy loss, which is detrimental to signal acquisition by space-based sensors. Arvind et al. [
26] modeled atmospheric infrared characteristics using the LOWTRAN code, concluding that atmospheric absorption attenuation causes most infrared radiation from aircraft wakes to be absorbed. Only radiation in bands such as 4.15–4.20 μm transmits through the atmosphere to reach detectors.
Regarding key factors influencing wake infrared spectral radiation, existing studies predominantly focus on single-parameter analyses. Moreover, investigations into atmospheric absorption effects are largely confined to ground-based scenarios, lacking systematic research on spectral characteristic variations under complex conditions such as space-based detection [
27,
28]. Additionally, aviation engine testing is costly, and full-scale ground tests and flight tests struggle to cover multi-parameter coupled conditions. Therefore, establishing correlation models between wake infrared spectral features and key parameters such as fuel–air ratio, exhaust temperature, and atmospheric conditions through numerical simulation has become an efficient approach for studying wake characteristics [
29,
30,
31]. This paper aims to systematically investigate, from the perspective of spectral feature extraction, the influence patterns of fuel–air ratio, exhaust temperature, and atmospheric absorption effects on the peak intensity, broadening, shape, and position of infrared radiation spectral lines in the wake. This research not only contributes to refining the theoretical framework of aircraft engine wake radiation but also provides critical technical support for aircraft infrared stealth design and detection system optimization.
This study systematically investigates the individual influence mechanisms of fuel–air ratio, exhaust temperature, and atmospheric absorption effects on the infrared spectral features of aero-engine wake for the first time. The main contents can be summarized as follows:
In summary, this study develops an integrated simulation–experiment framework, combining single-step combustion modeling, k-ε wake flow-field simulation, statistical narrow-band radiation calculation, line-of-sight radiative transfer solution, and FTIR field experiments, to systematically investigate the influence of fuel–air ratio, exhaust temperature, and atmospheric absorption effects on wake infrared spectral features.
2. Model
2.1. Geometric Model
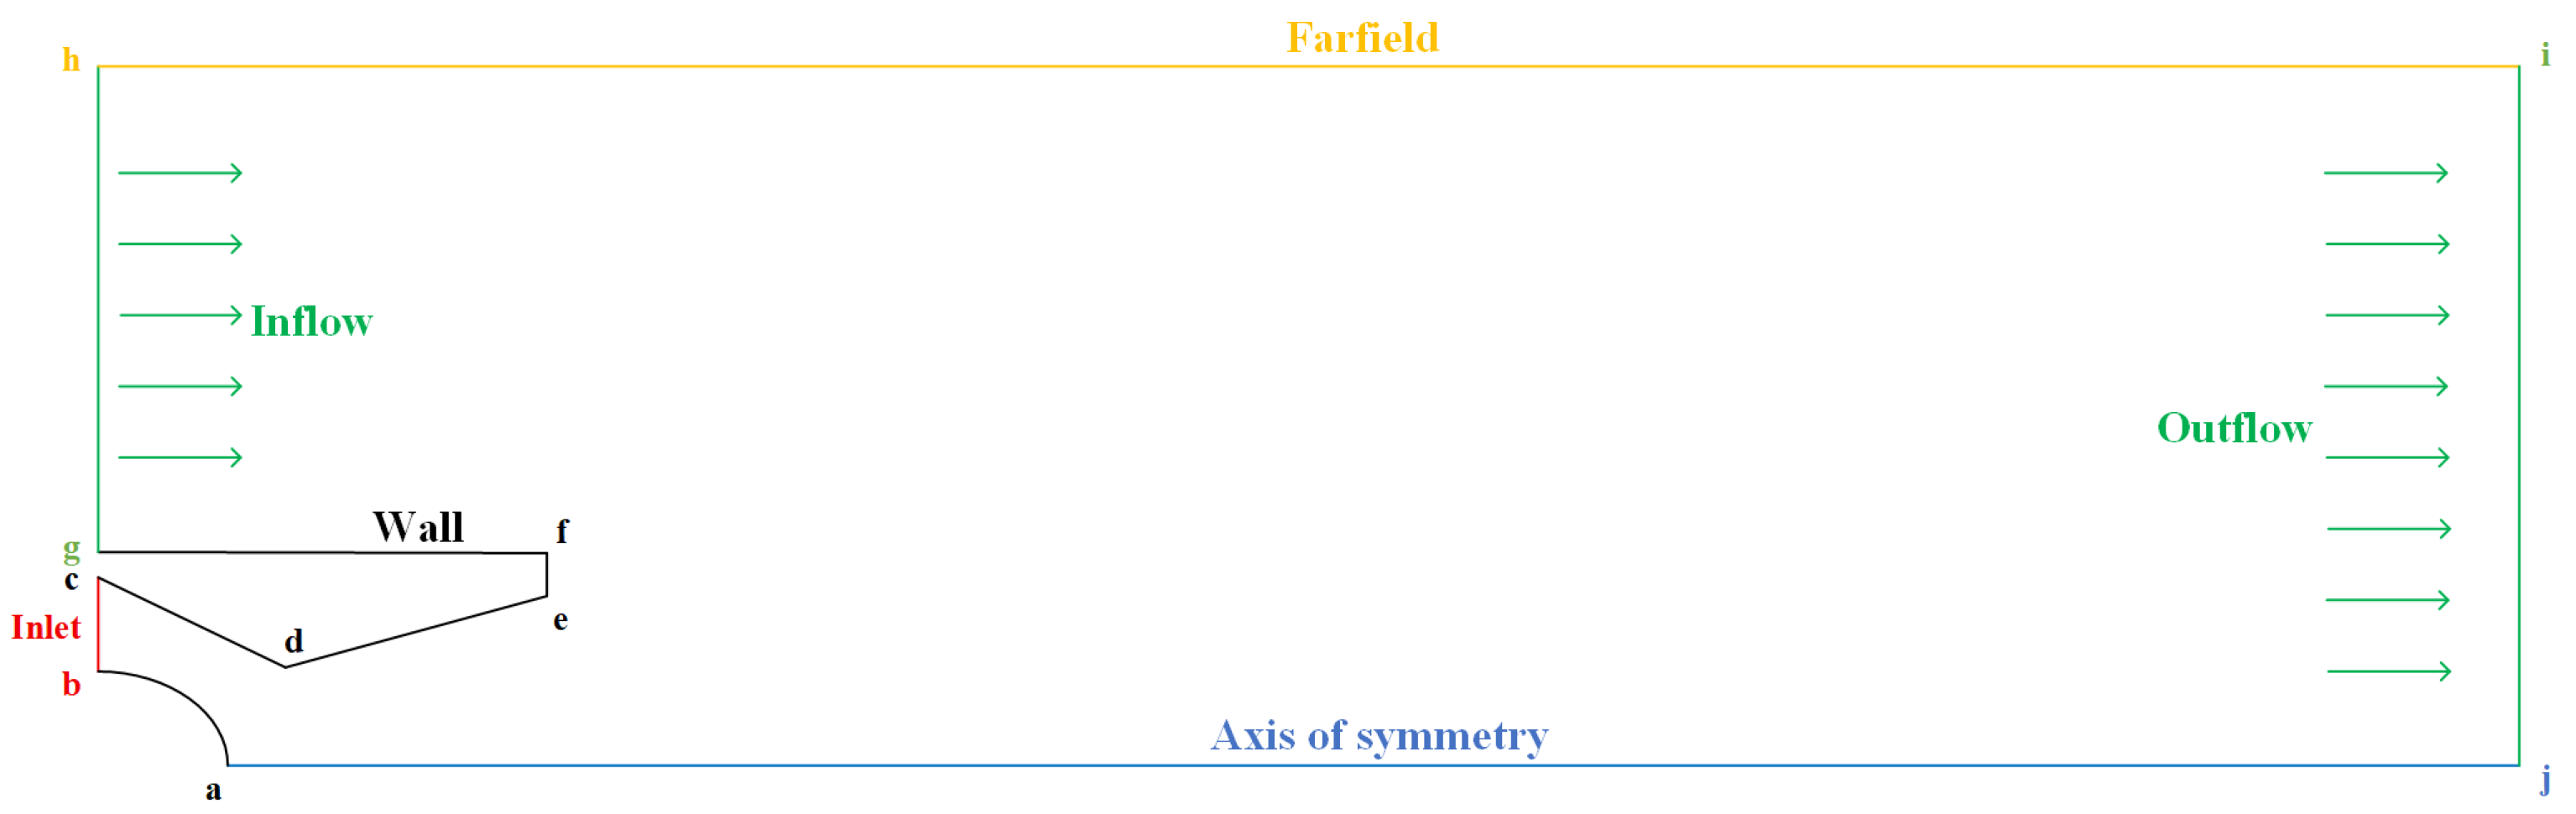
In the absence of buoyancy, crosswinds, angle of attack, and other external disturbances, the thermal jet from a single engine nozzle can be treated as an axisymmetric structure. The boundary conditions and schematic of the two-dimensional axisymmetric computational domain are shown in
Figure 1. The nozzle axis (a–j) is considered an axisymmetric condition. The far-field boundary, inflow boundary, and outflow boundary impose uniform temperature and pressure conditions consistent with free-stream conditions.
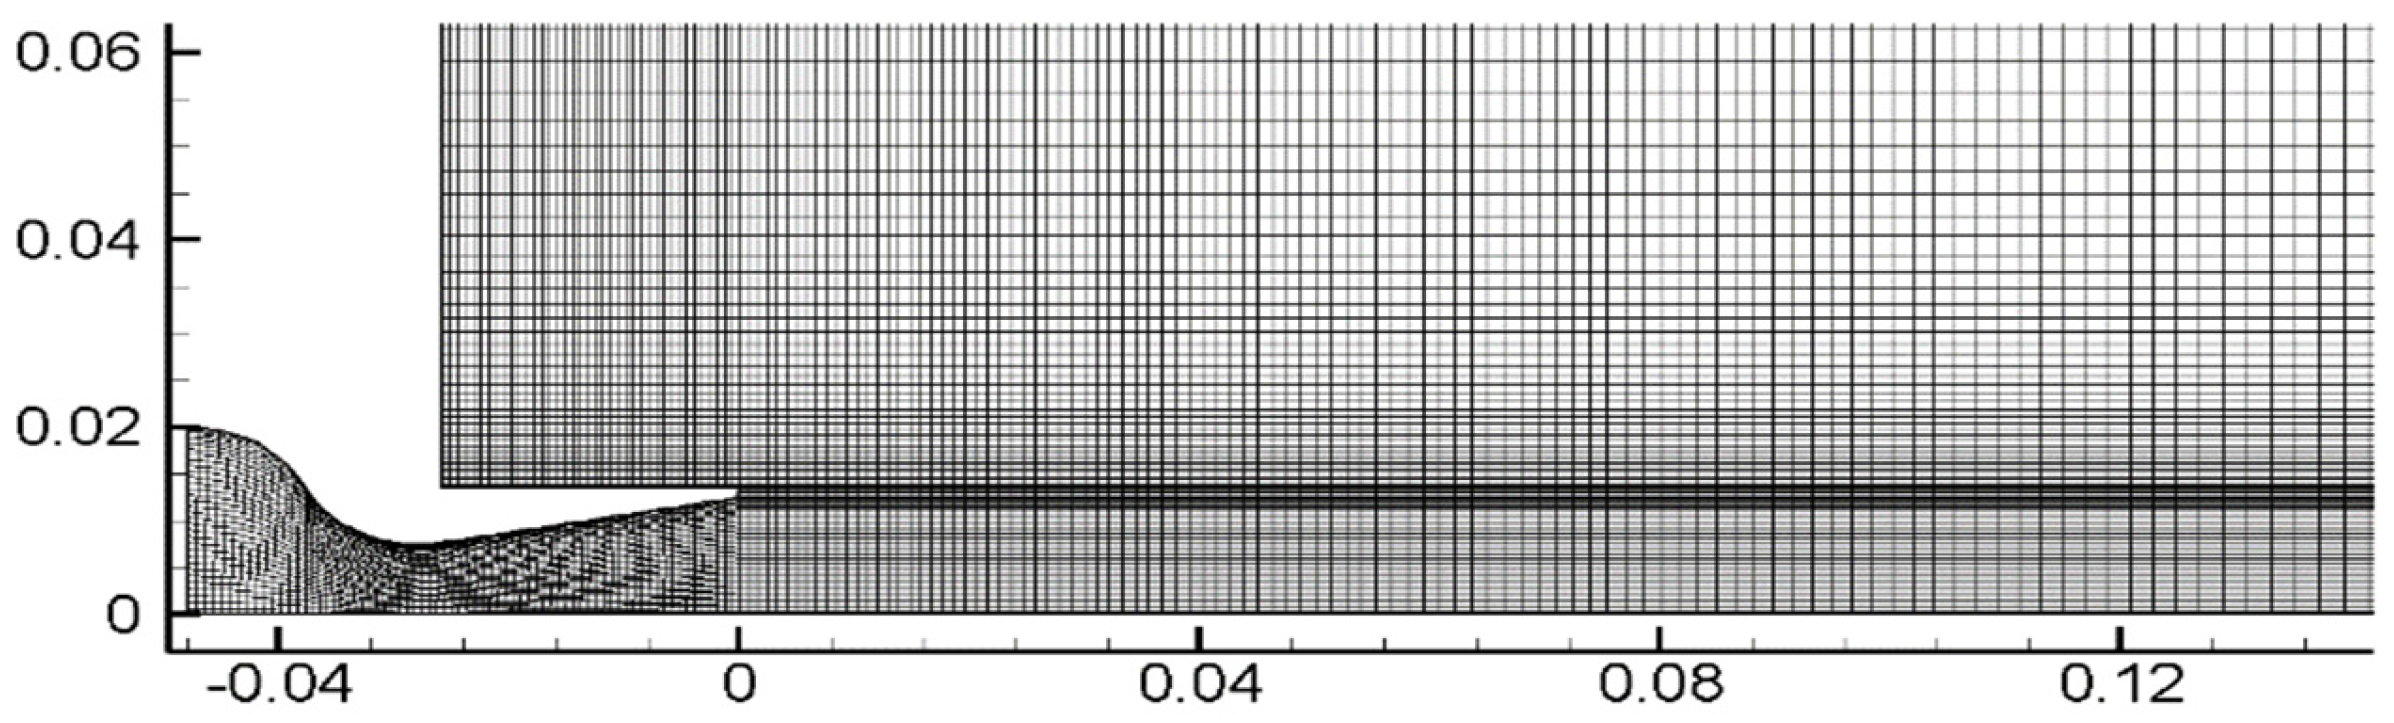
The numerical model employs a structured grid. Since the expansion characteristics of the wake vary with temperature and fuel–air ratio, the computational domain and grid must be partitioned based on these parameters. To minimize the impact of grid size on computational results, this study performed mesh independence verification for two sets of conditions: different fuel–air ratios at the same temperature, and different temperatures at the same fuel–air ratio. This resulted in two meshes comprising 200,000 and 220,000 cells, respectively.
2.2. Combustion Reaction Kinetic Model
This study primarily focuses on the macroscopic characteristics of the wake’s far field, which exhibits lower sensitivity to nozzle initial conditions compared to detailed chemical reaction pathways. Therefore, to significantly reduce computational complexity, a global single-step reaction model based on equivalence ratios was employed to simulate the combustion of RP-3 aviation kerosene.
C
12H
23 was selected as the single-component substitute fuel for RP-3 jet fuel [
32]. The combustion products within the engine were modeled and analyzed, with the products of complete combustion being CO
2 and H
2O. The specific chemical reaction equations are as follows:
This model assumes complete combustion with no formation of incomplete combustion products such as CO or carbon soot. Thus, the complete combustion of one mole of fuel consumes 17.75 moles of O2, producing 12 moles of CO2 and 11.5 moles of H2O. Nitrogen, as an inert gas, does not participate in combustion. It is evident that the molar quantities of fuel and air directly influence the molar quantities of combustion products. The fuel–air ratio is the core input parameter of this model. Defined as the ratio of fuel mass flow rate to air mass flow rate, it directly determines the completeness of fuel combustion and the distribution of product components in the wake field. Later, we will discuss the influence of this parameter on the gas concentration distribution at the nozzle boundary. For C12H23/air combustion, the stoichiometric fuel–air ratio is fst = 167.304/(17.75 × 4.76 × 28.97) ≈ 0.068. The fuel–air ratio range investigated in this study (0.025–0.031, i.e., f/fst = 0.37–0.45) lies entirely within the fuel-lean regime, where the assumptions of complete combustion and negligible formation of intermediate species such as CO and soot are physically justified.
2.3. Wake Flow Field Model
2.3.1. Fundamental Equations of Fluid Mechanics
This study assumes that the hot jet from an aircraft tail nozzle is a multicomponent, non-uniform ideal gas. The LaminarSMOKE code [
33] solves for mass, momentum, component, and energy conservation, assuming the fluid is a Newtonian fluid
where
t is time,
ρ is the mixture density,
p is pressure,
v is the mixture velocity,
T is the fluid stress tensor,
g is the gravitational acceleration vector,
Yj is the mass fraction of component
j,
Vj is the diffusion velocity of component
j,
is the generation rate of component
j,
T is the temperature,
CP and
CP,j are the specific heat capacities at constant pressure for the mixture and component
j, respectively,
q is the heat flux vector,
hj is the enthalpy of a single component, and
NC is the total number of species in the kinetic scheme.
The ideal gas equation of state is used to calculate the density of the mixture. The heat flux vector accounts for conduction and radiation
Among these,
λ is the thermal conductivity of the mixture, and
is the radiative heat flux. The diffusion rate is calculated by considering Fickian diffusion and thermal diffusion (the Soret effect)
Here,
Xj denotes the molar fraction of component
j,
represents the thermal diffusivity ratio of component
j, and
Dj is the average diffusion coefficient of the mixture for a single component. This is related to the binary diffusion coefficient
Dj and is given by the following expression:
In all simulations analyzed in this paper, the contribution of pressure gradient diffusion to transport is neglected. As proposed by Coffee et al. [
34], a forced mass conservation approach is adopted for this topic. This method is based on the so-called mass diffusion velocity
, which replaces
Vj in Equations (3) and (4) and is defined as follows:
where
VC is a constant correction factor independent of components but varying with space and time. This correction factor is introduced to satisfy the law of mass conservation and is calculated as follows:
2.3.2. Turbulence Model
Turbulence is the core driving force behind the evolution of jet engine wakes, influencing the entire process of wake formation, dispersion, and energy transfer. Crucially, the interaction between the high-temperature wake and the surrounding atmospheric boundary layer determines the scale of the wake and whether secondary combustion effects occur. In the near-field region of the wake, the influence of turbulence fluctuations is negligible due to its supersonic nature; however, in the far-field region, the effects of turbulence become highly significant. Turbulence models exhibit measurement accuracy within 5–10% for radiation, significantly outperforming laminar models with discrepancies reaching up to 20% [
35]. Durbin [
36] explicitly states that turbulence lies at the core of extensive CFD applications. Consequently, this study employs an implementable two-equation k-ε turbulence model to predict wake features and corresponding flow field distributions.
2.4. Statistical Narrow Band Model
The narrow spectral band model relates the arrangement and overlapping properties of spectral lines within a given wavenumber interval Δ
η (typically 5–50 cm
−1) to the properties of individual spectral lines. However, it does not require detailed knowledge of the shape, intensity, or position of each line within the spectral band. Instead, it assumes spectral line shapes and posits that their intensity and position distributions follow specific patterns. Depending on the assumed spectral line intensity distribution pattern, statistical spectral band models can be categorized as follows: equal-intensity distribution (random spacing), exponential line intensity distribution (Goody), and exponential tail with inverse line intensity distribution (Malkmus). The most widely applied statistical model is the exponential tail with inverse line intensity distribution, all of which are designed for Lorentzian-broadened spectral lines.
The average transmittance within the narrow spectral range Δ
η can be calculated using the following formula:
In the equation, is the spectral band fine-structure parameter, is the average line width, is the average line spacing; is the average absorption coefficient within the spectral band; X(L) is the pressure-stroke length, which is extrapolated to standard conditions during use, i.e., X(L) = PL(296/T), where P and T represent the gas pressure and temperature, respectively.
Based on existing spectral line parameters within the spectral band, the three parameters above can also be determined theoretically. Young [
37] provided a numerical averaging method for calculating spectral band model parameters, namely
In the equation, represents the intensity of the mth spectral line within the ith spectral region; denotes the half-width of the mth spectral line within the ith spectral region; M indicates the total number of spectral lines within the ith spectrum; defines the wavenumber range of the ith spectral region, cm−1. The required spectral parameters—line intensity and line half-width—must be referenced from the HITEMP database.
2.5. Infrared Radiation Transfer Model
2.5.1. General Form
According to radiation transfer theory, when considering absorption, emission, and scattering within a medium, the radiation transfer equation can be expressed as follows:
In the equation,
and
represent spectral radiance and source function, respectively;
and
denote the absorption coefficient and scattering coefficient of the medium, respectively, with the subscript
representing the wavenumber and
j denoting the gas type. When an aero-engine operates in non-afterburner mode with complete combustion, the gas scattering effect can be neglected. Furthermore, if the medium is in local thermal equilibrium, based on Kirchhoff’s law and Planck’s law, the source function becomes the blackbody radiation function
. Expressing the absorption coefficient as
, the general form of the radiative transfer equation is
Solving the above differential form readily yields its integral form solution, namely
Among these, is the spectral radiation measured at s = L, where the lower integration limit “0” denotes the boundary. represents the external radiation contribution entering the transmission, corresponding to the blackbody radiation constant at ambient temperature.
2.5.2. Narrow Band Radiation Transmission Equation
The exponent factor in Equation (18) can be replaced by spectral transmittance to simplify the expression of the radiative transfer equation (RTE).
Therefore, by deriving the transmittance, Equation (18) can be simplified into a concise form.
In the spectral band model, the spectral range is subdivided into bands of width Δ
η, where the wavenumber interval (5–25 cm
−1) is sufficiently narrow to assume that the blackbody intensity remains essentially constant within each band, yet sufficiently broad to encompass a substantial number of absorption lines, enabling their statistical treatment. We obtained the narrow-band average transmittance.
Substituting (21) into (20) yields the narrow band formE.
3. Numerical Methods
3.1. Nozzle Parameter Solution Method
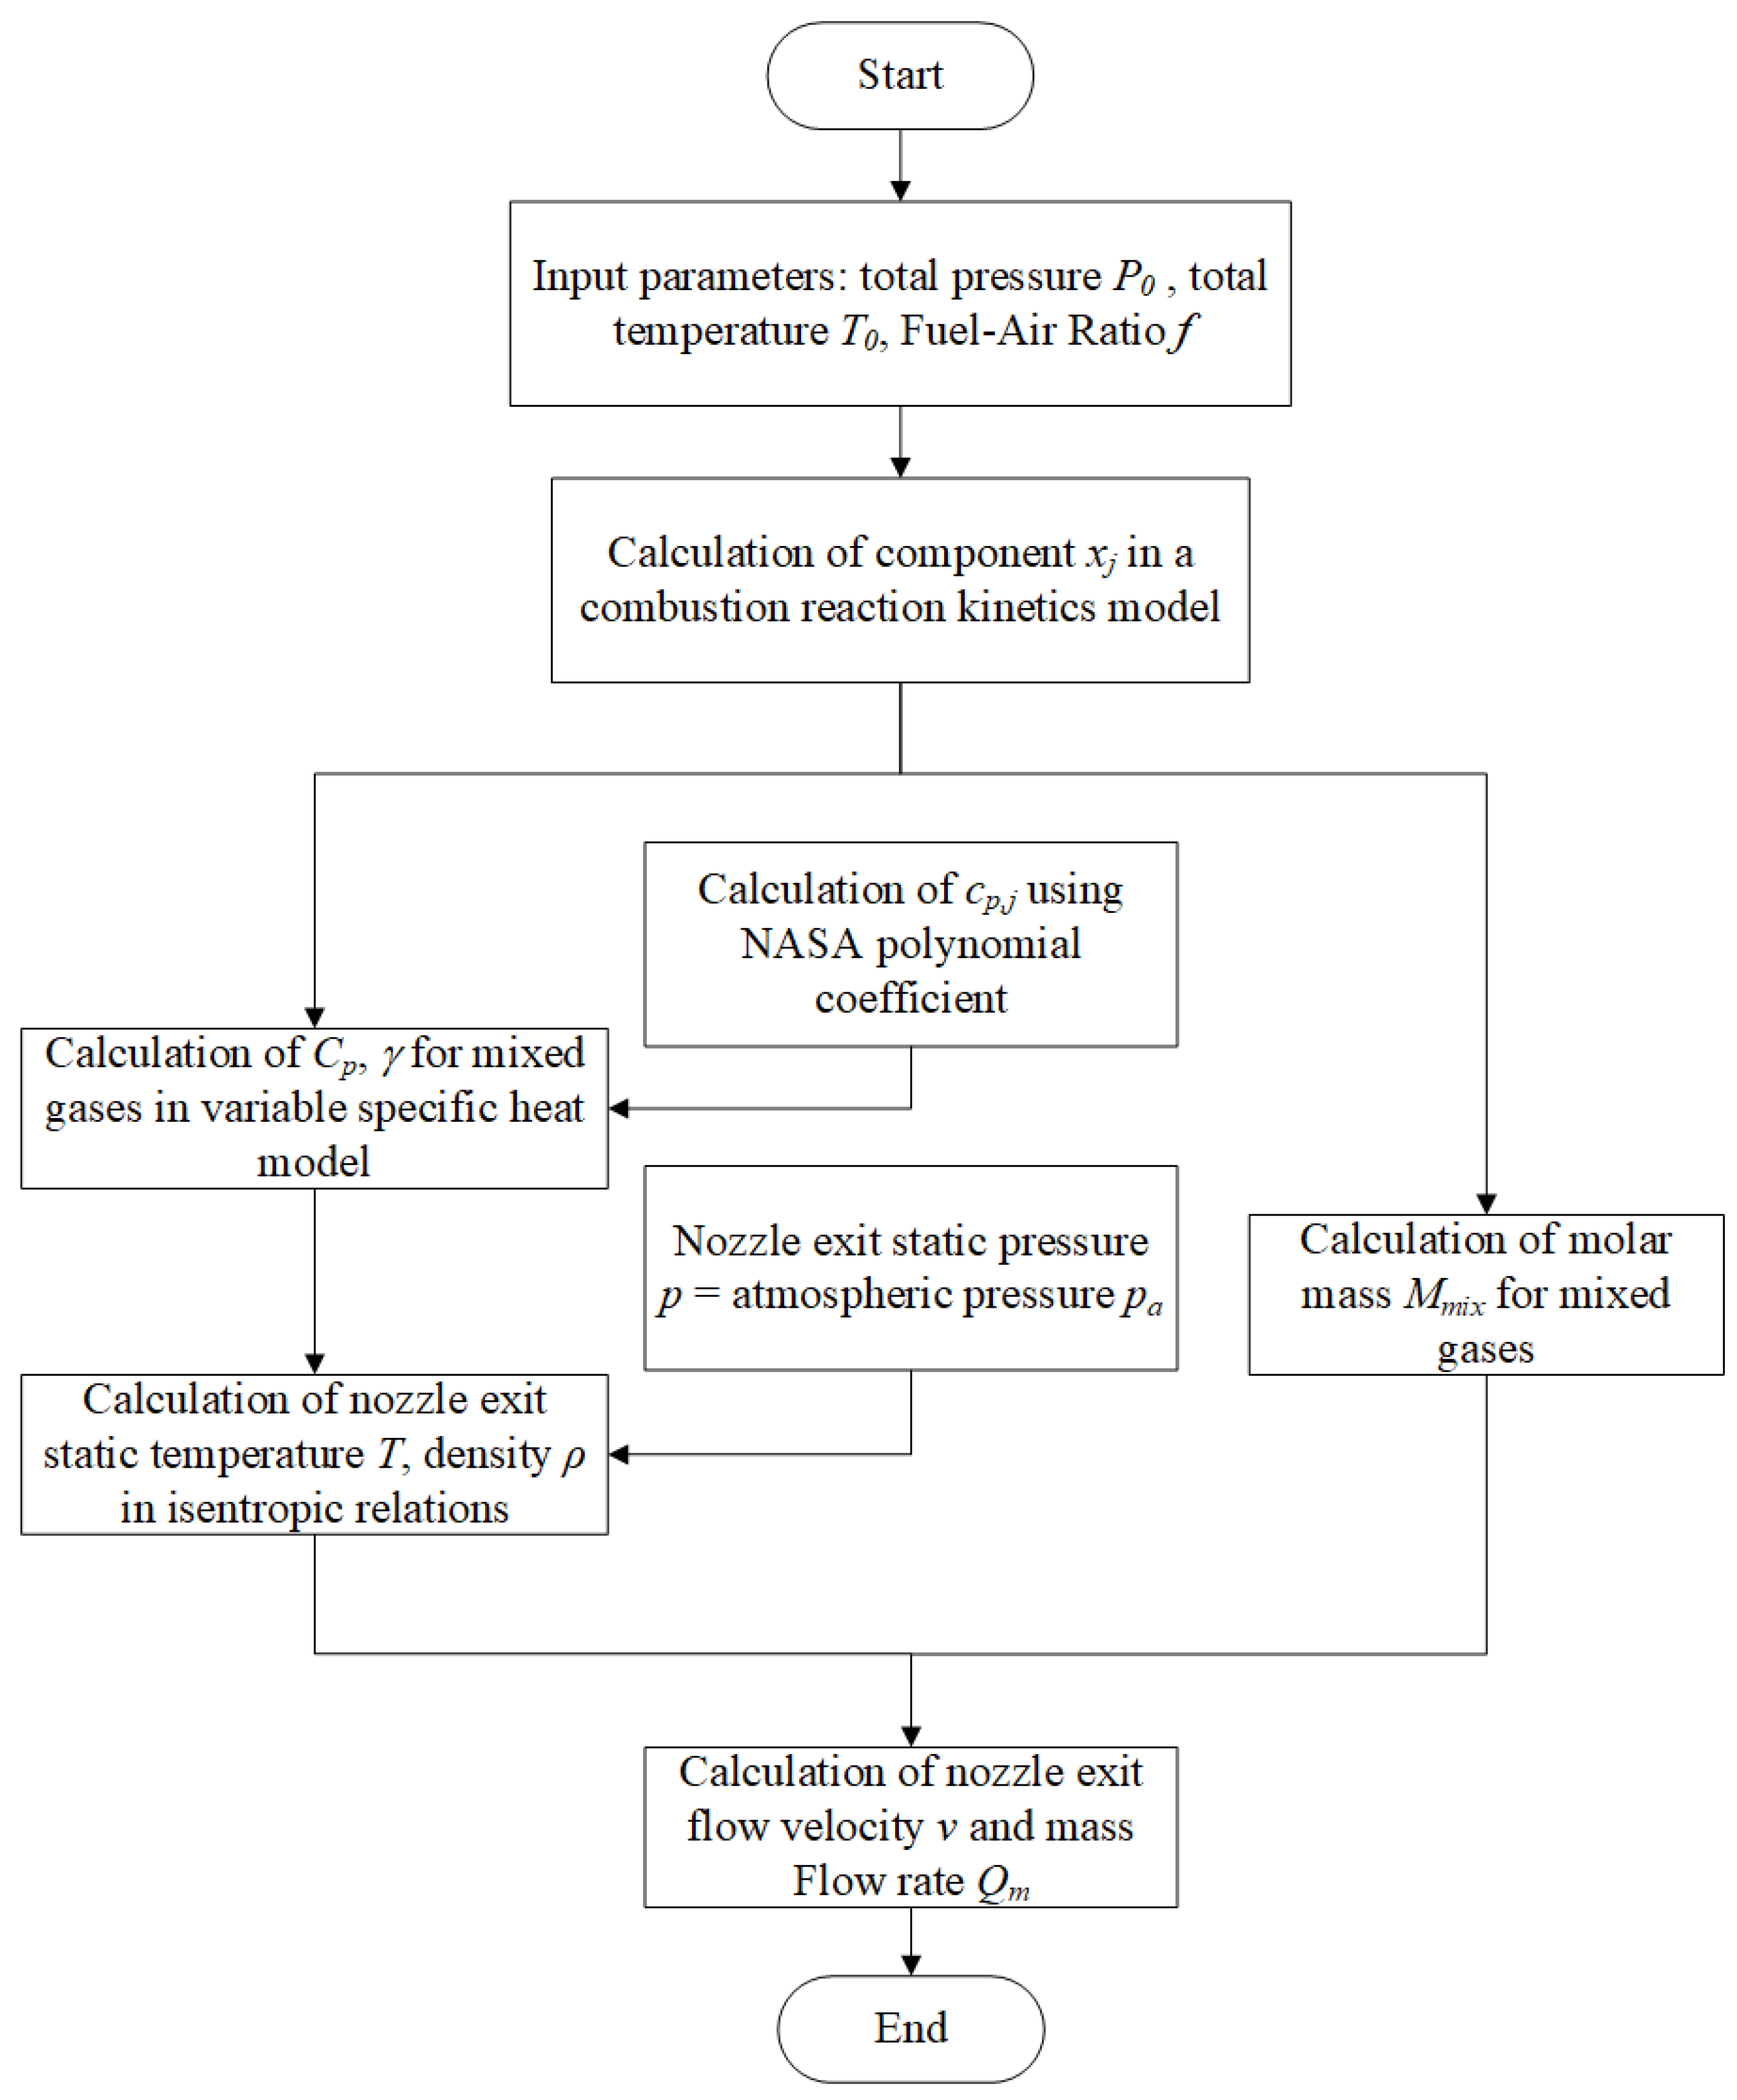
In this section, we describe the numerical methods applied for solving the nozzle parameters. The overall flowchart of nozzle parameter solution process is shown in
Figure 2. Using the aforementioned combustion reaction kinetics model, based on the single-step chemical reaction between aviation kerosene (C
12H
23) and air, assuming the number of moles of fuel entering the aero-engine is
nf and the number of moles of air participating in combustion is
na, with fuel combustion being sufficiently complete, the fuel–air ratio
f can be expressed as follows:
Here,
mf denotes the mass flow rate of fuel,
ma denotes the mass flow rate of air, M
f represents the molar mass of fuel (167.304 g/mol), and
Ma represents the molar mass of air (28.97 g/mol). The fuel–air ratio for an aero-engine typically ranges from 0.025 to 0.031 [
38].
The stoichiometric fuel–air ratio for C
12H
23/air combustion is approximately 0.068 (Equation (1)); the studied range 0.025–0.031 therefore corresponds to f/f
st = 0.37–0.45, i.e., fuel-lean combustion. Consistently, the O
2 mole fraction in
Table 1 remains positive (0.115–0.155) over the entire studied range, confirming oxygen-surplus (fuel-lean) operation and clearly defining the lean/rich boundary of the single-step model. The proportions of nitrogen and oxygen in the air are 0.79 and 0.21, respectively [
39]. Under ideal conditions of complete combustion of aviation fuel (C
12H
23), the molar number and molar fraction of the hot exhaust jet gas can be expressed as shown in
Table 1.
The ideal gas assumption posits that gas molecules exhibit no intermolecular forces and occupy no volume themselves. This idealized gas model describes the relationship among its macroscopic state parameters—static pressure
P, density
ρ, static temperature
T, and molar mass of the mixture
—via the following equation of state:
where R is the molar gas constant, taken as 8.314
, and the molar mass of the mixture
, specific heat ratio of mixture
, specific heat capacity of a mixture
, The specific heat capacity at constant pressure for each gas
is expressed as a polynomial function of temperature, employing the polynomial coefficients from NASA Technical Report [
40], where
is the molar fraction of component
j,
,
is the molar mass of component
j (g/mol). The mass flow rate
Qm is the mass of fluid passing through the cross-sectional area per unit time (kg/s), which can be expressed as follows:
Here,
S denotes the tail nozzle cross-sectional area, and
v represents the exit exhaust gas velocity, which can be calculated using the isentropic expansion model [
41]. The atmospheric inlet conditions are set to standard atmospheric conditions, assuming the expansion process within the nozzle is isentropic, with the exit static pressure
P equal to the ambient atmospheric pressure.
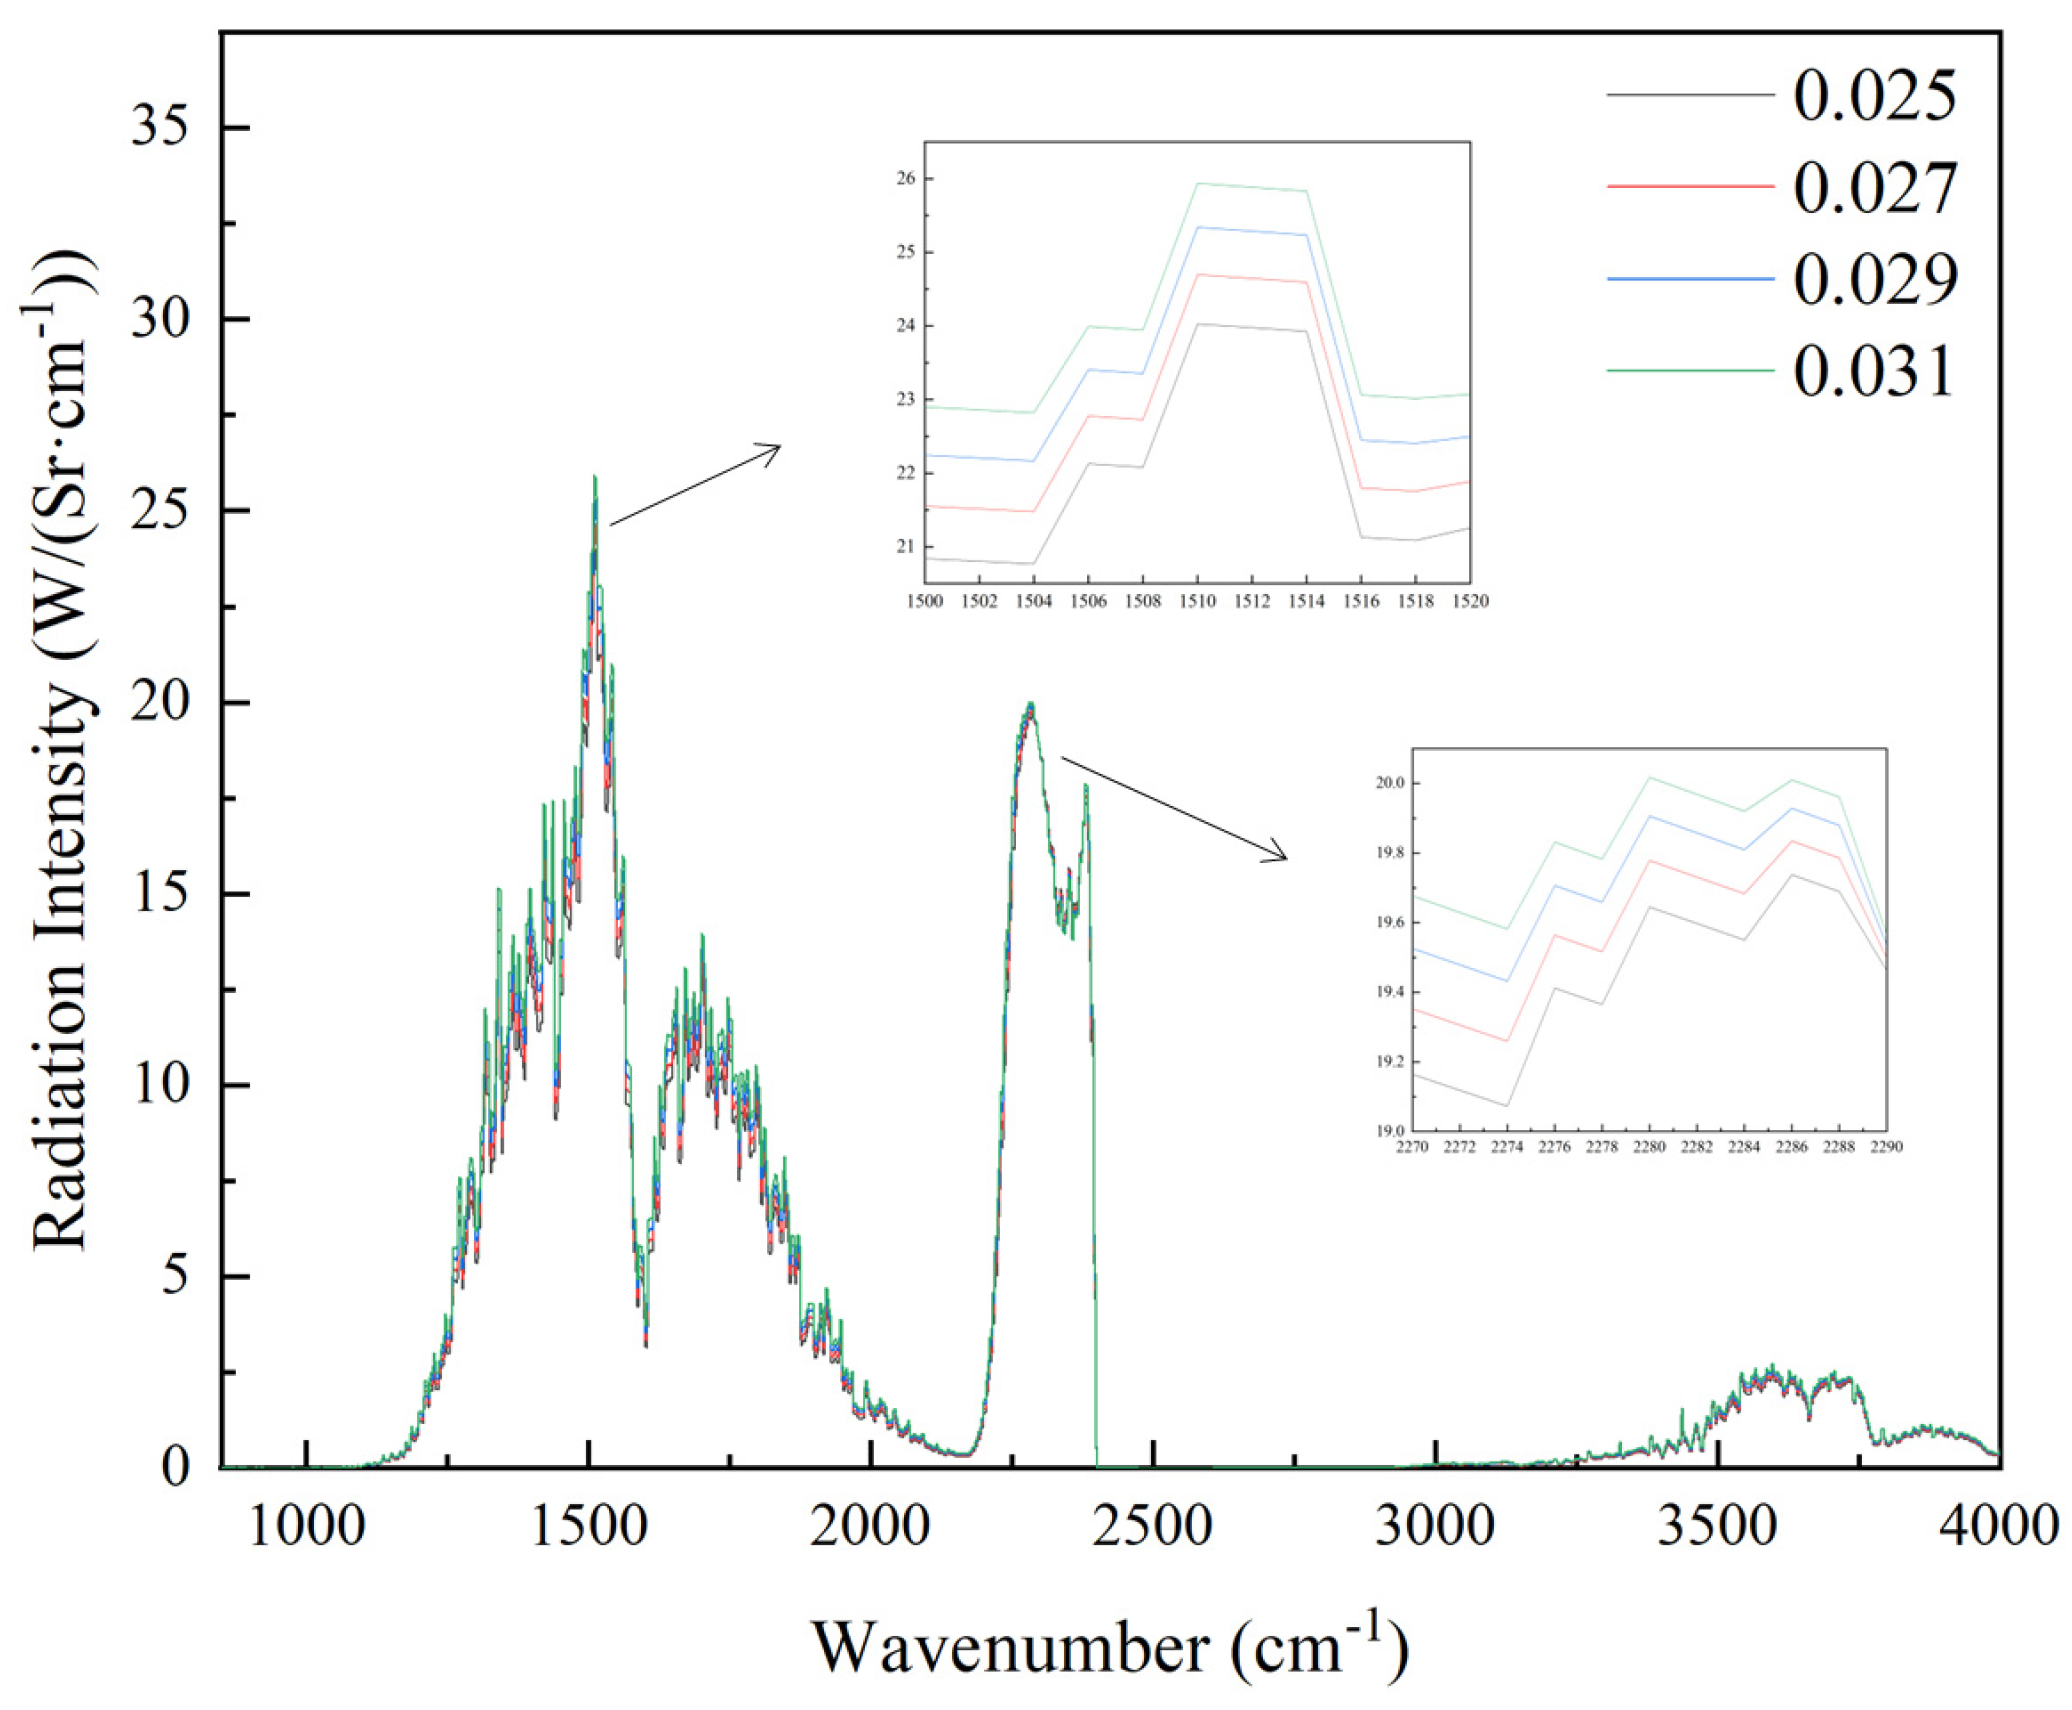
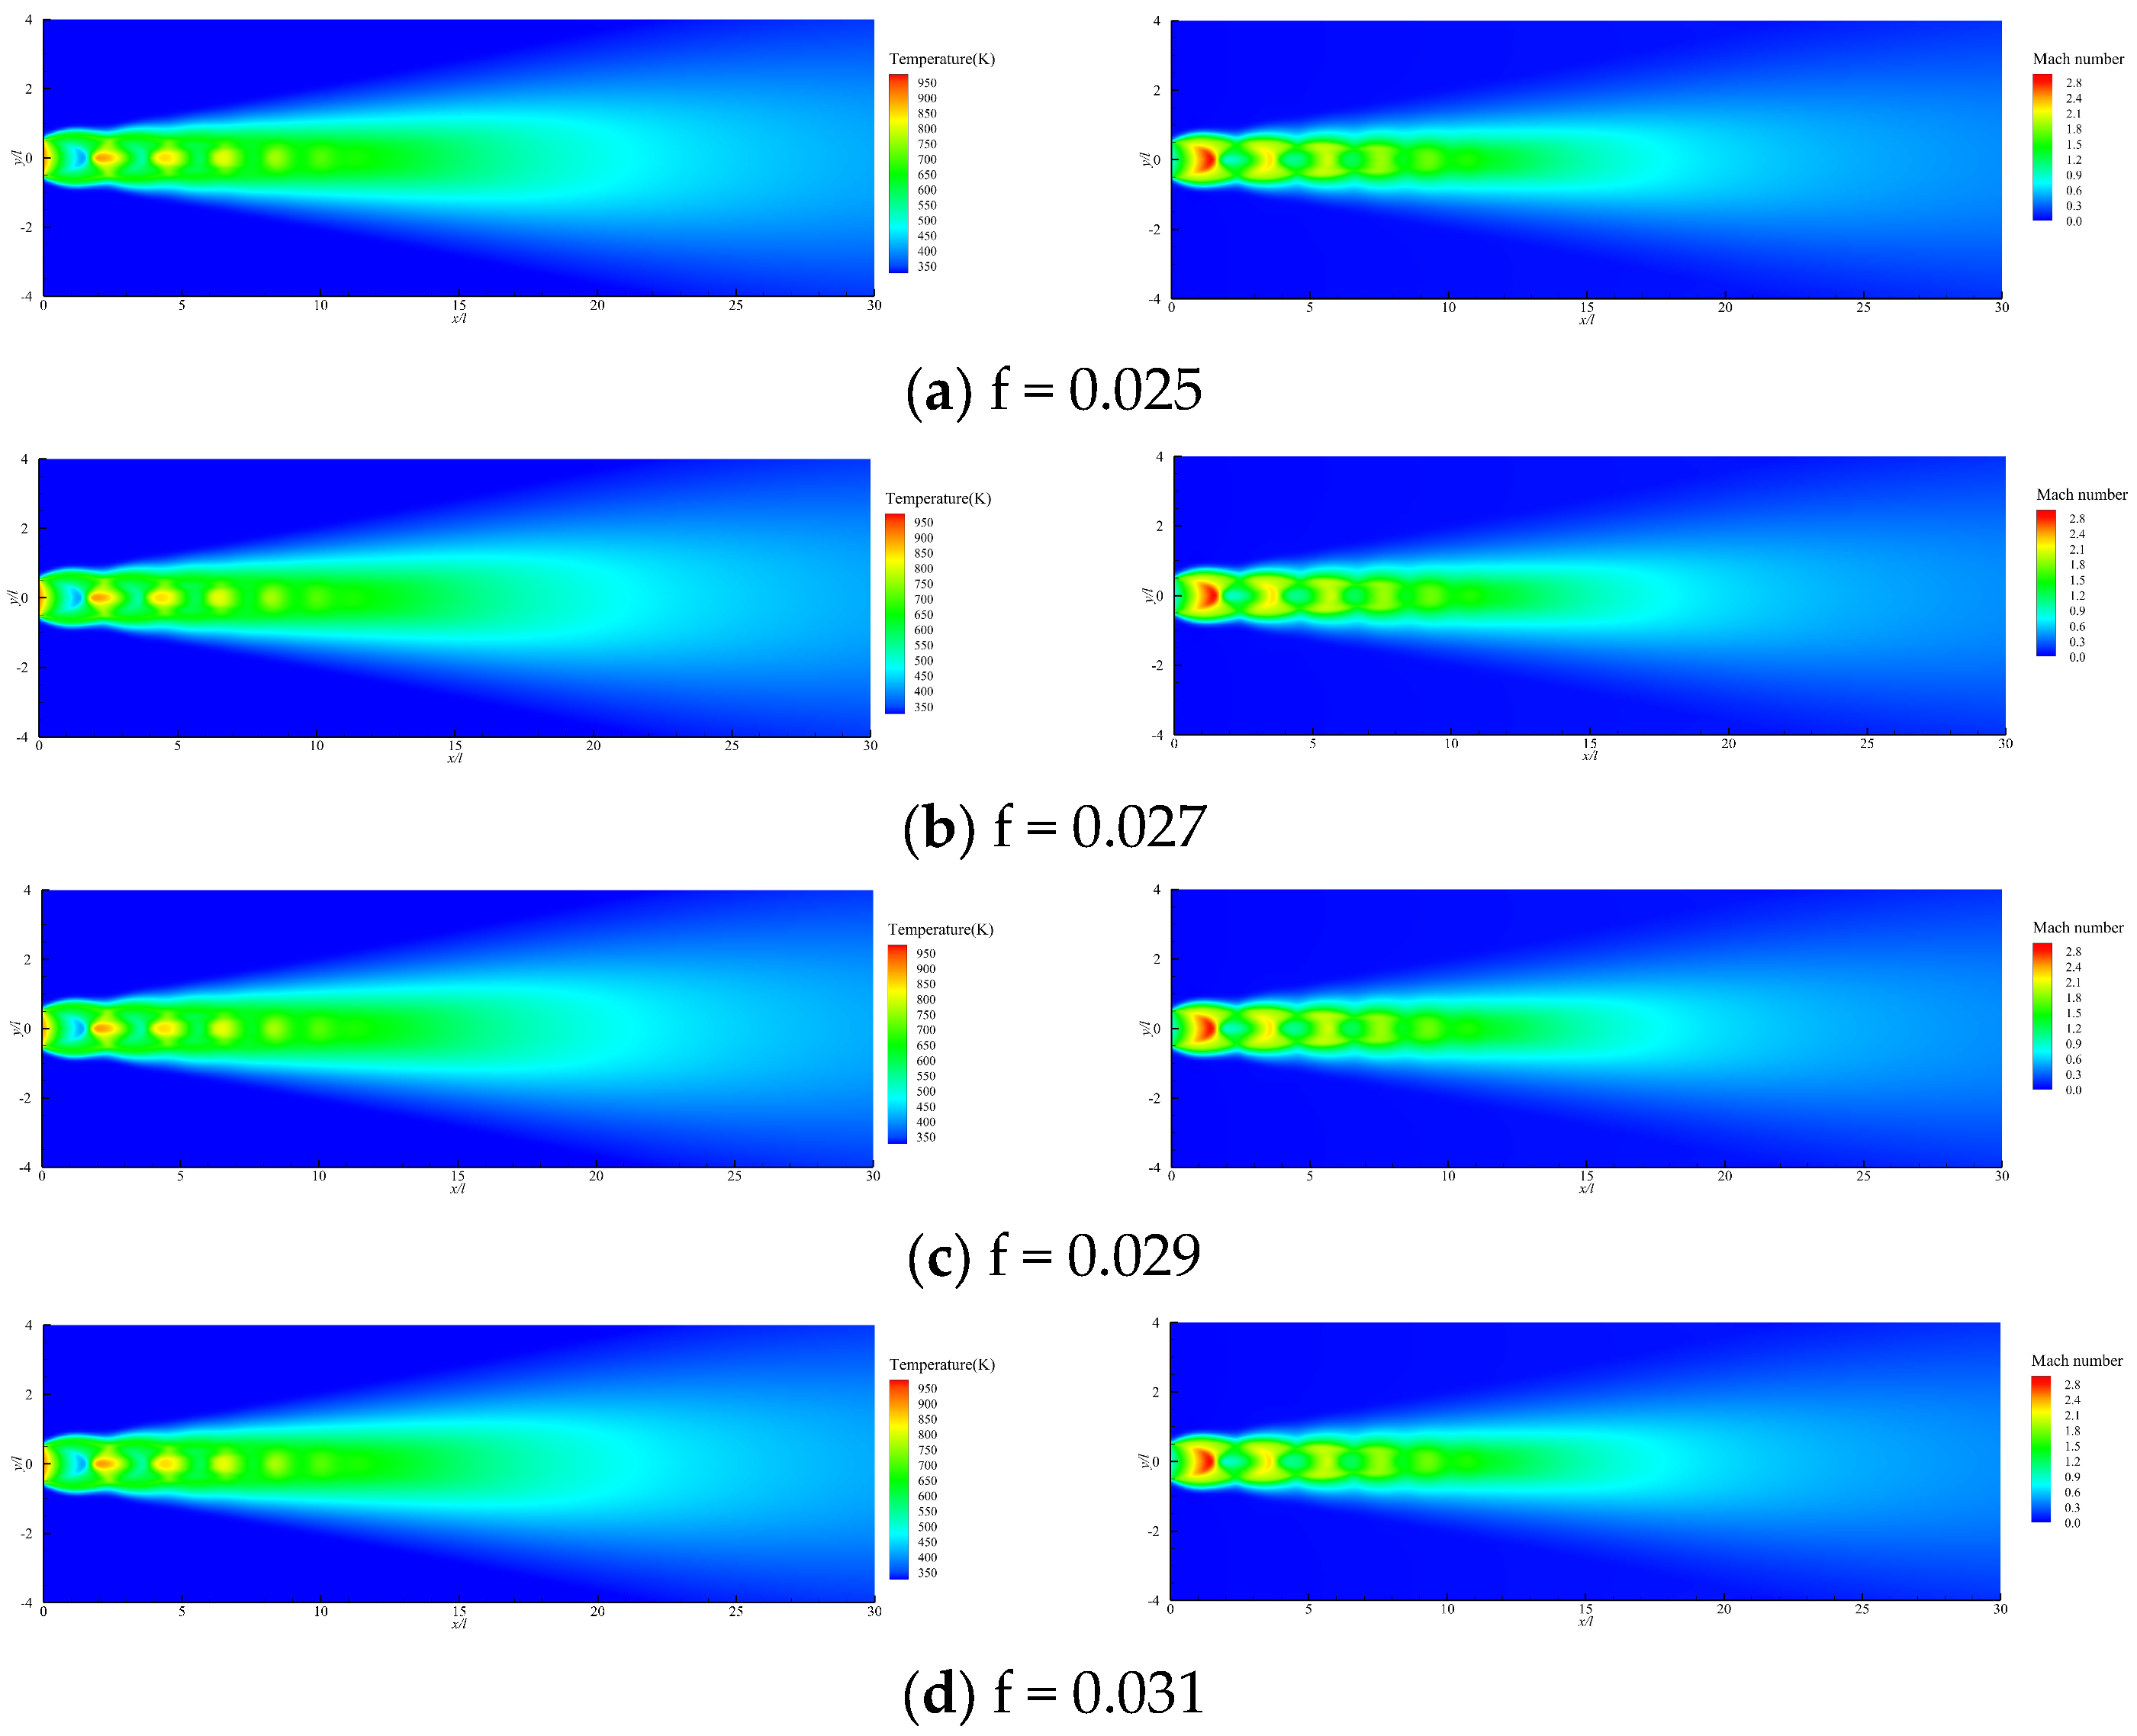
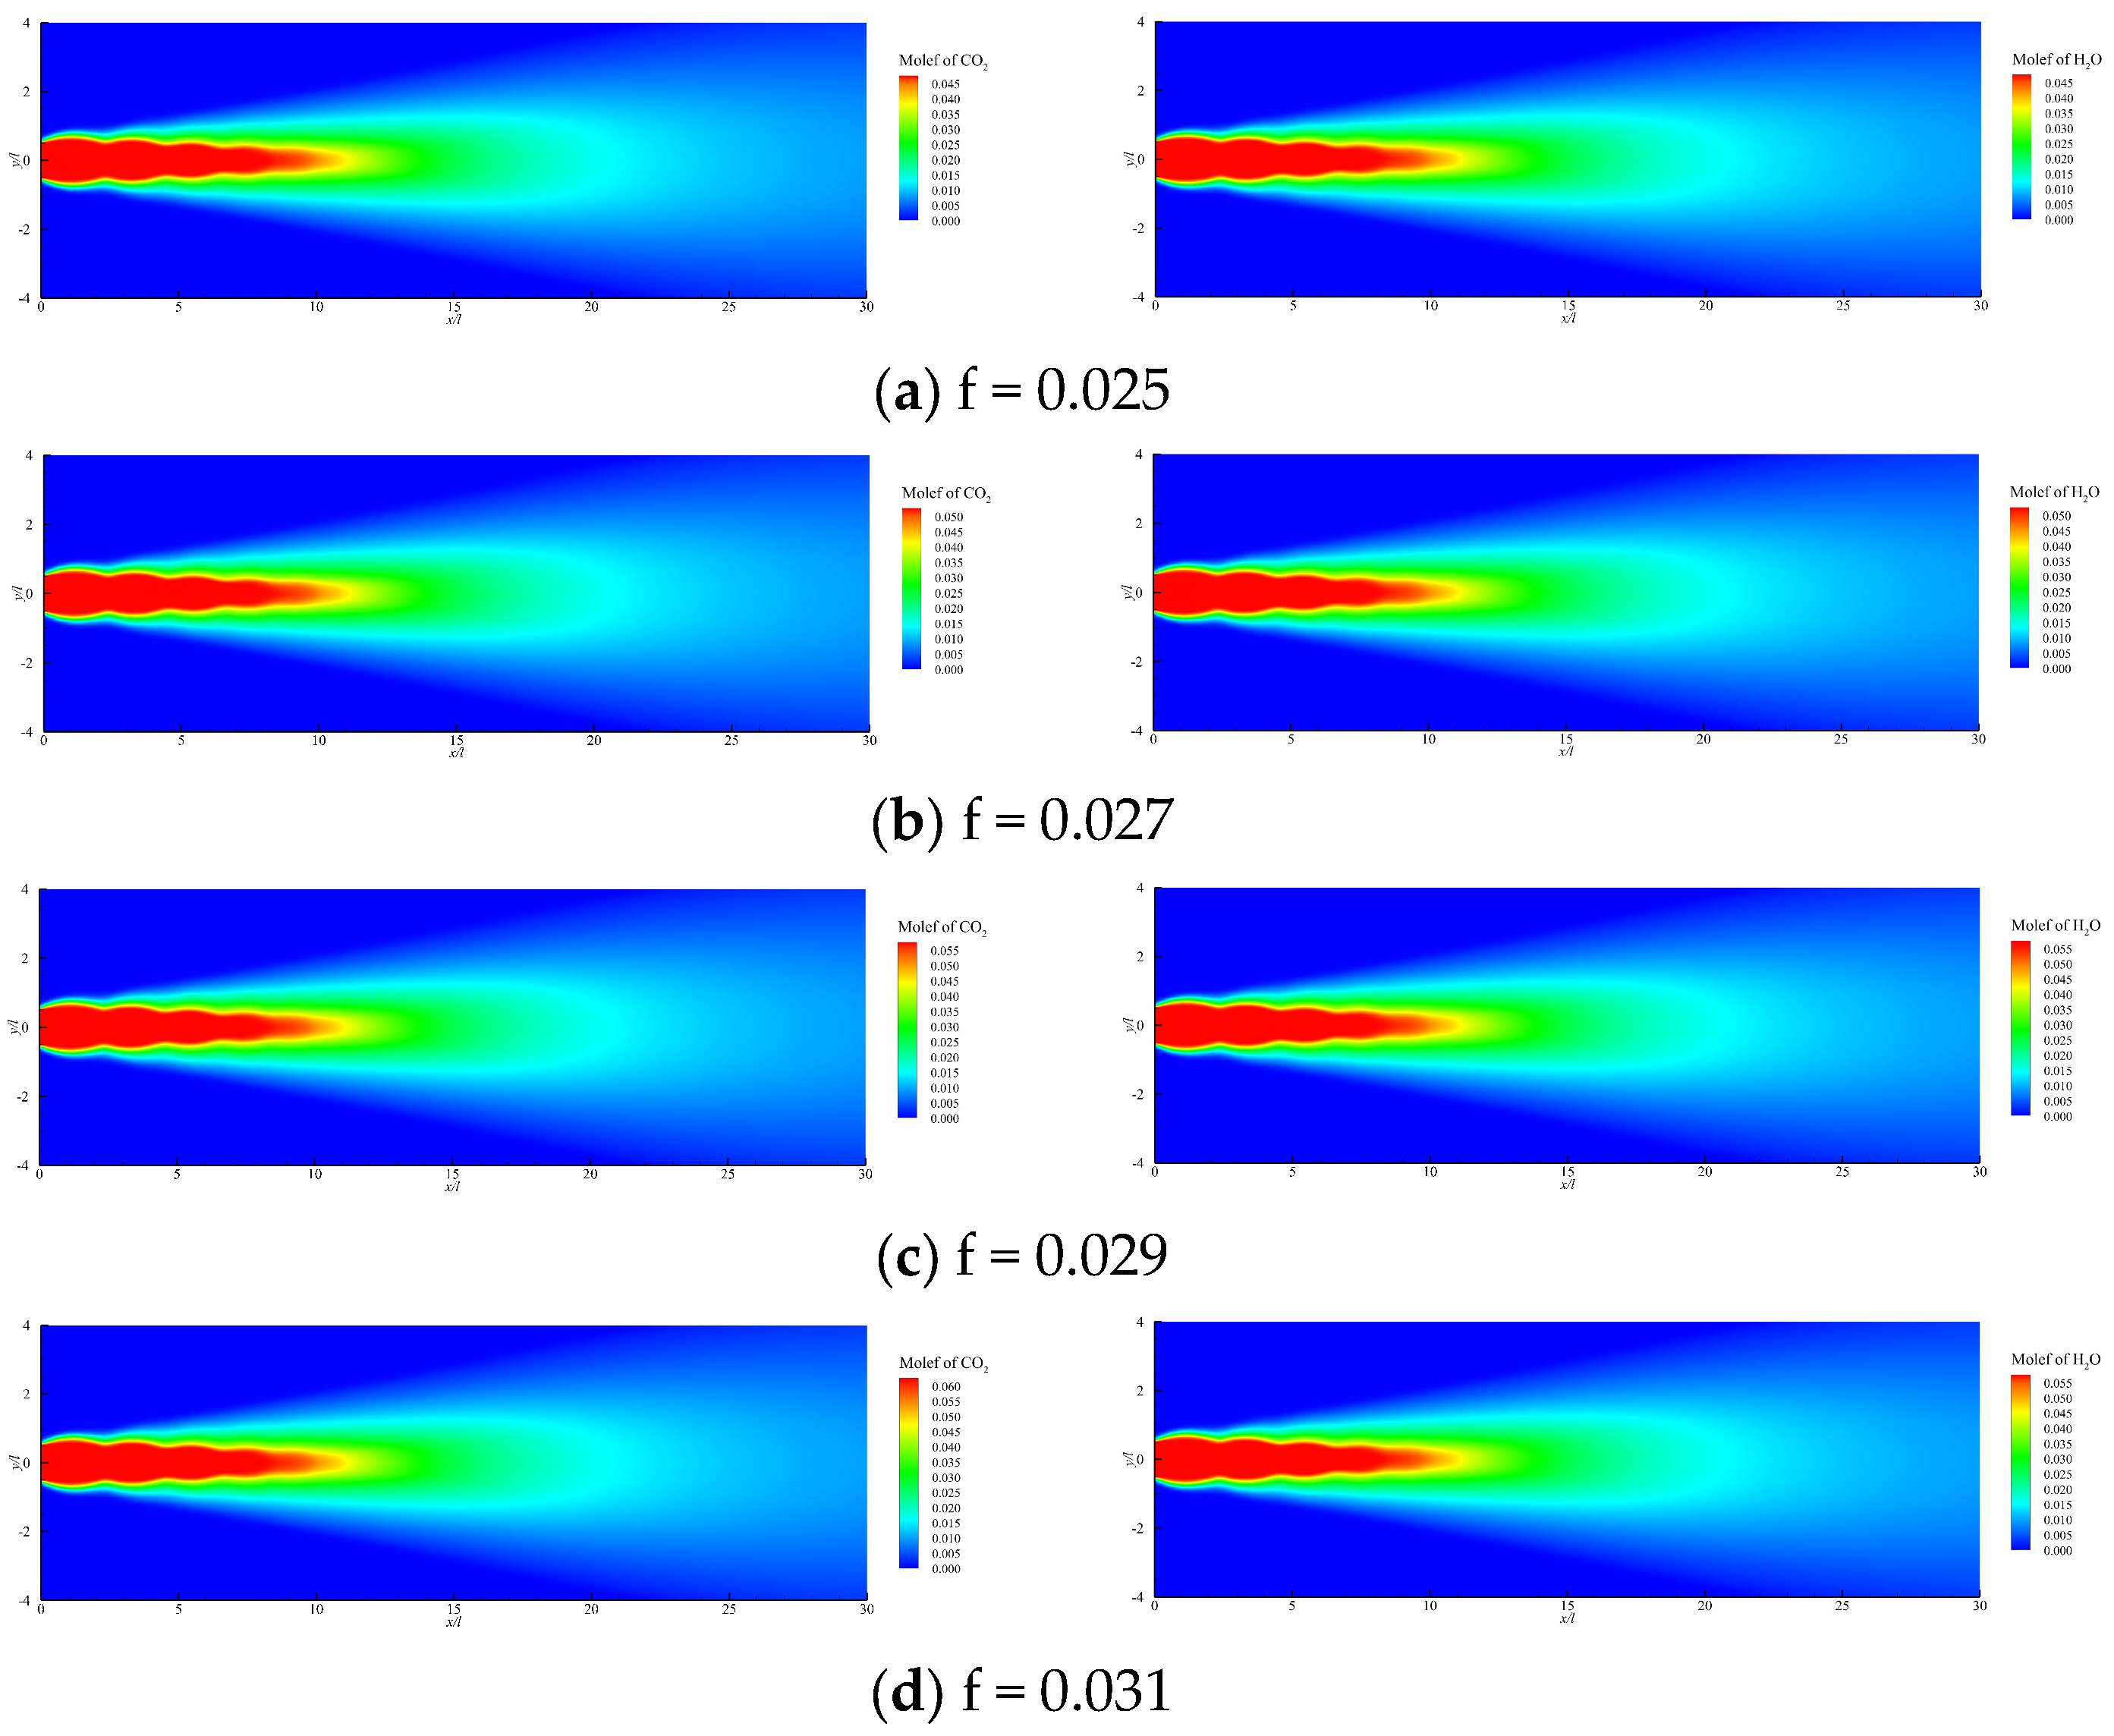
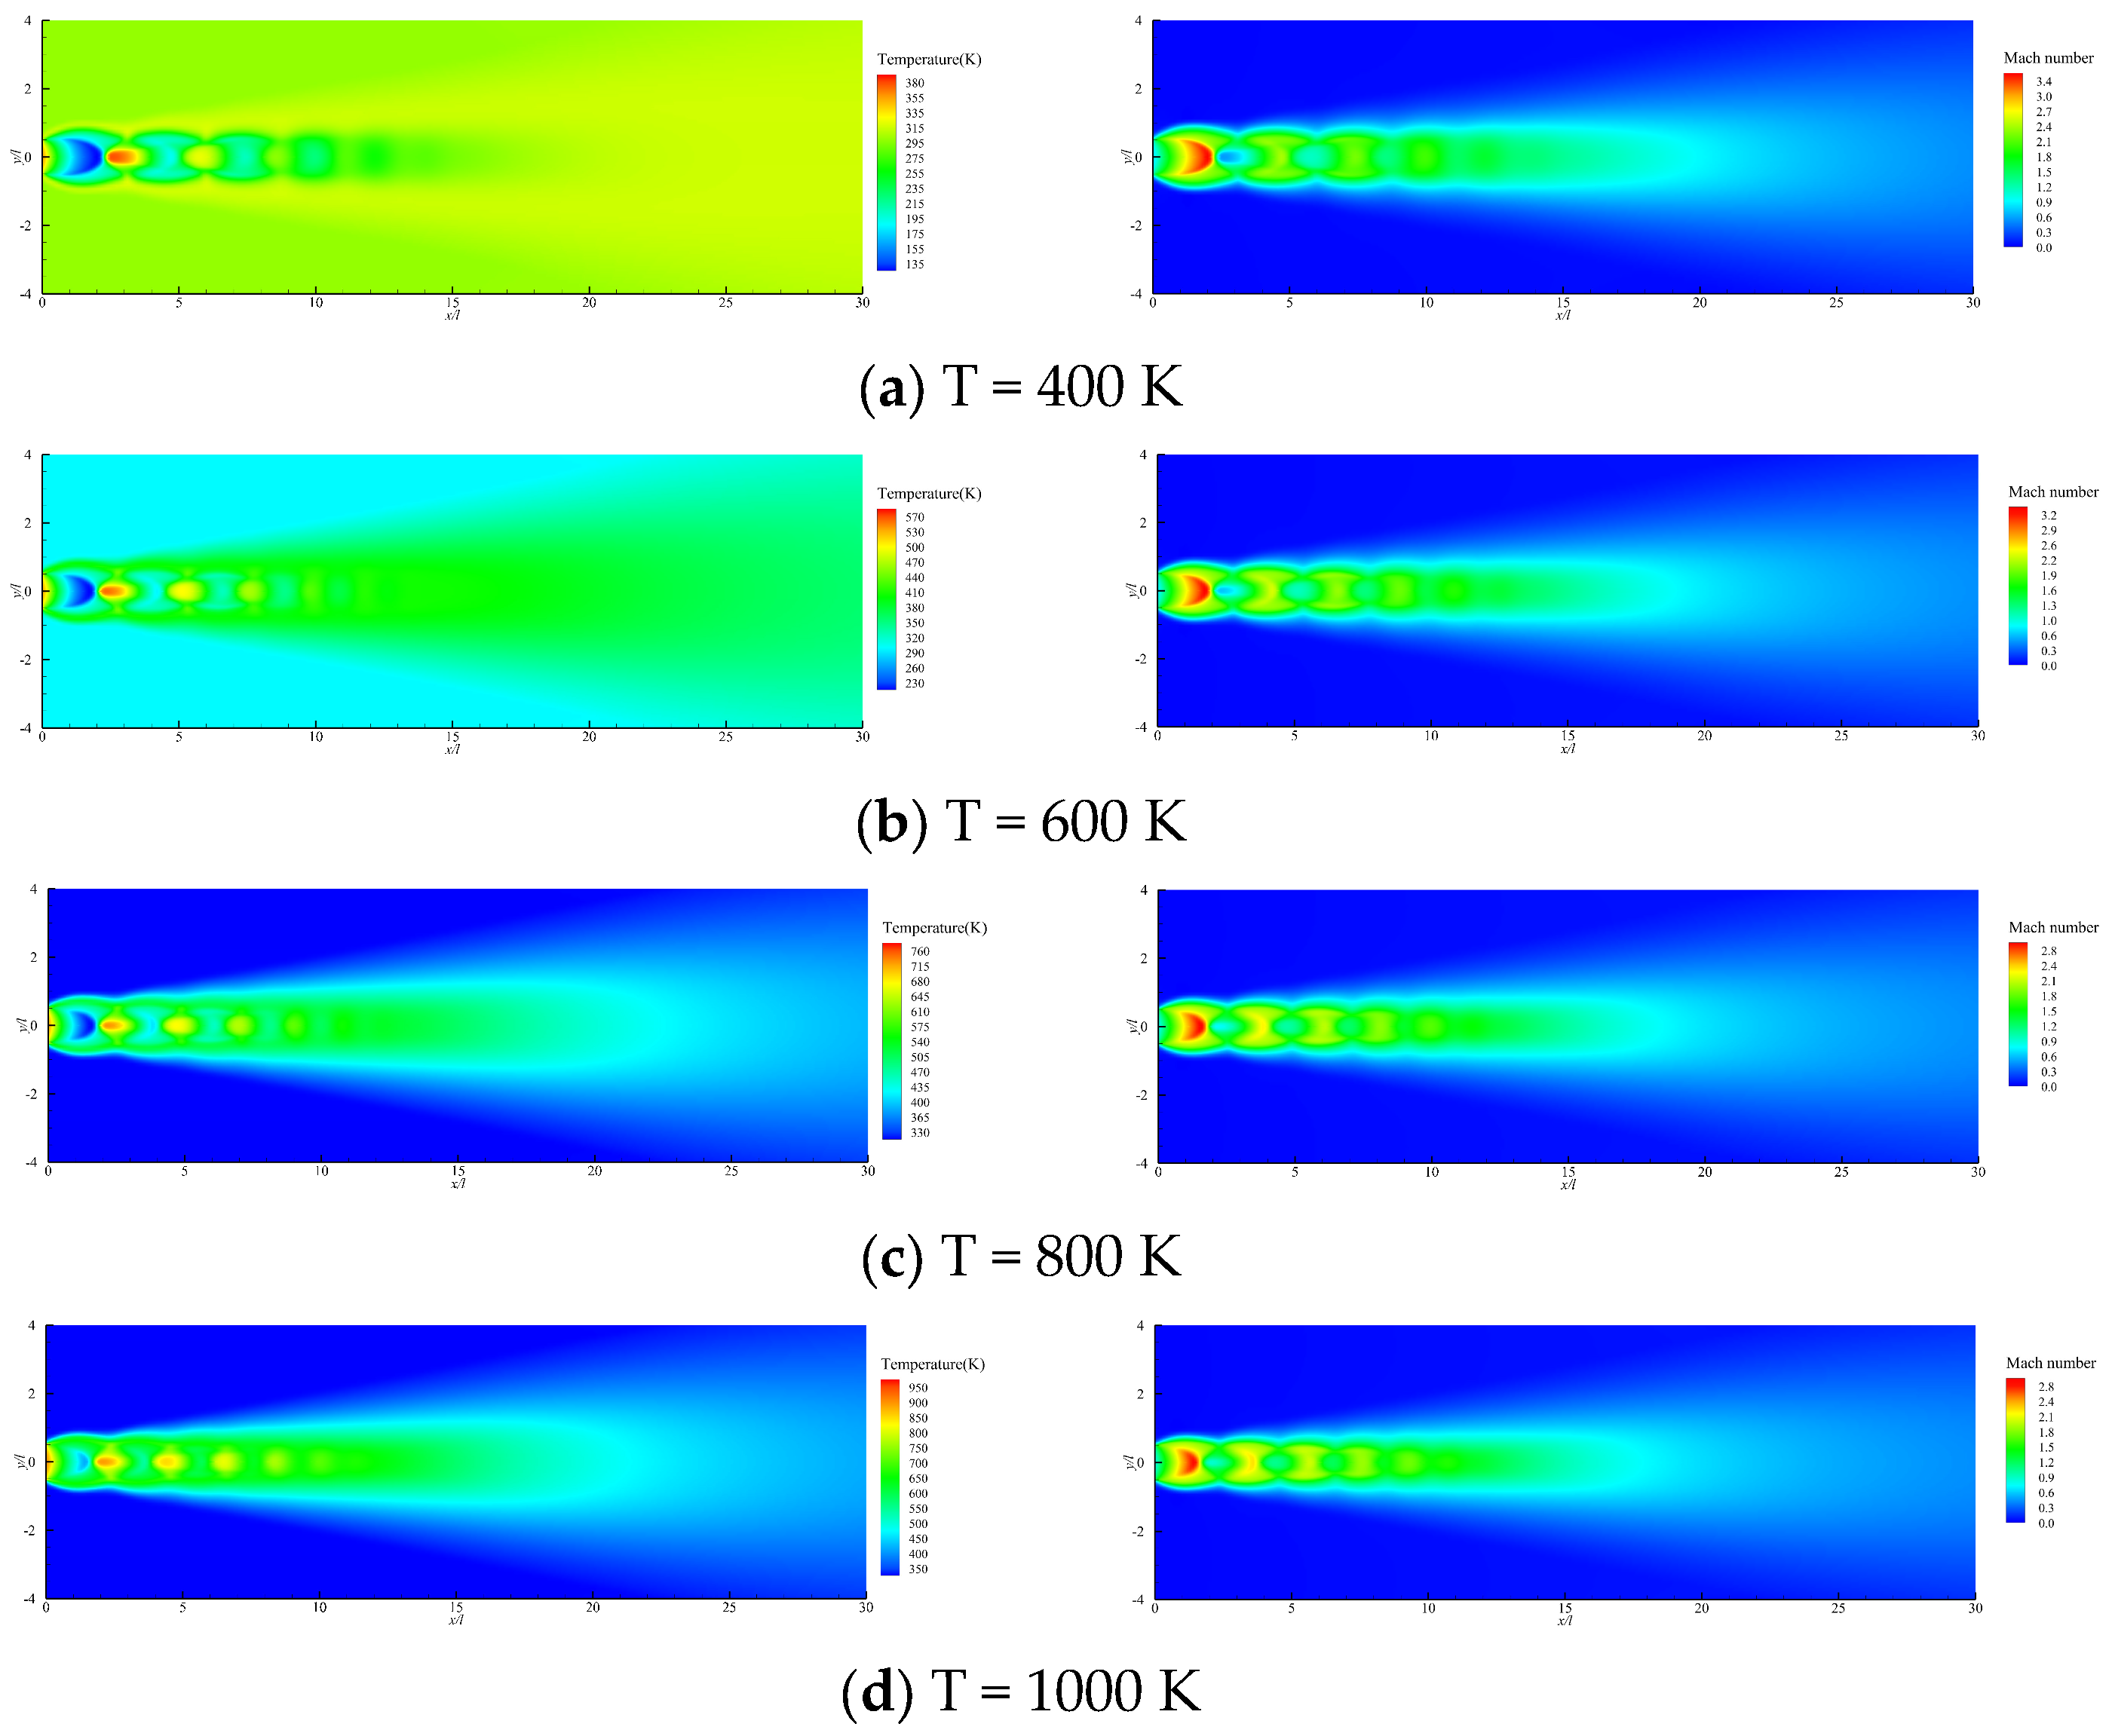
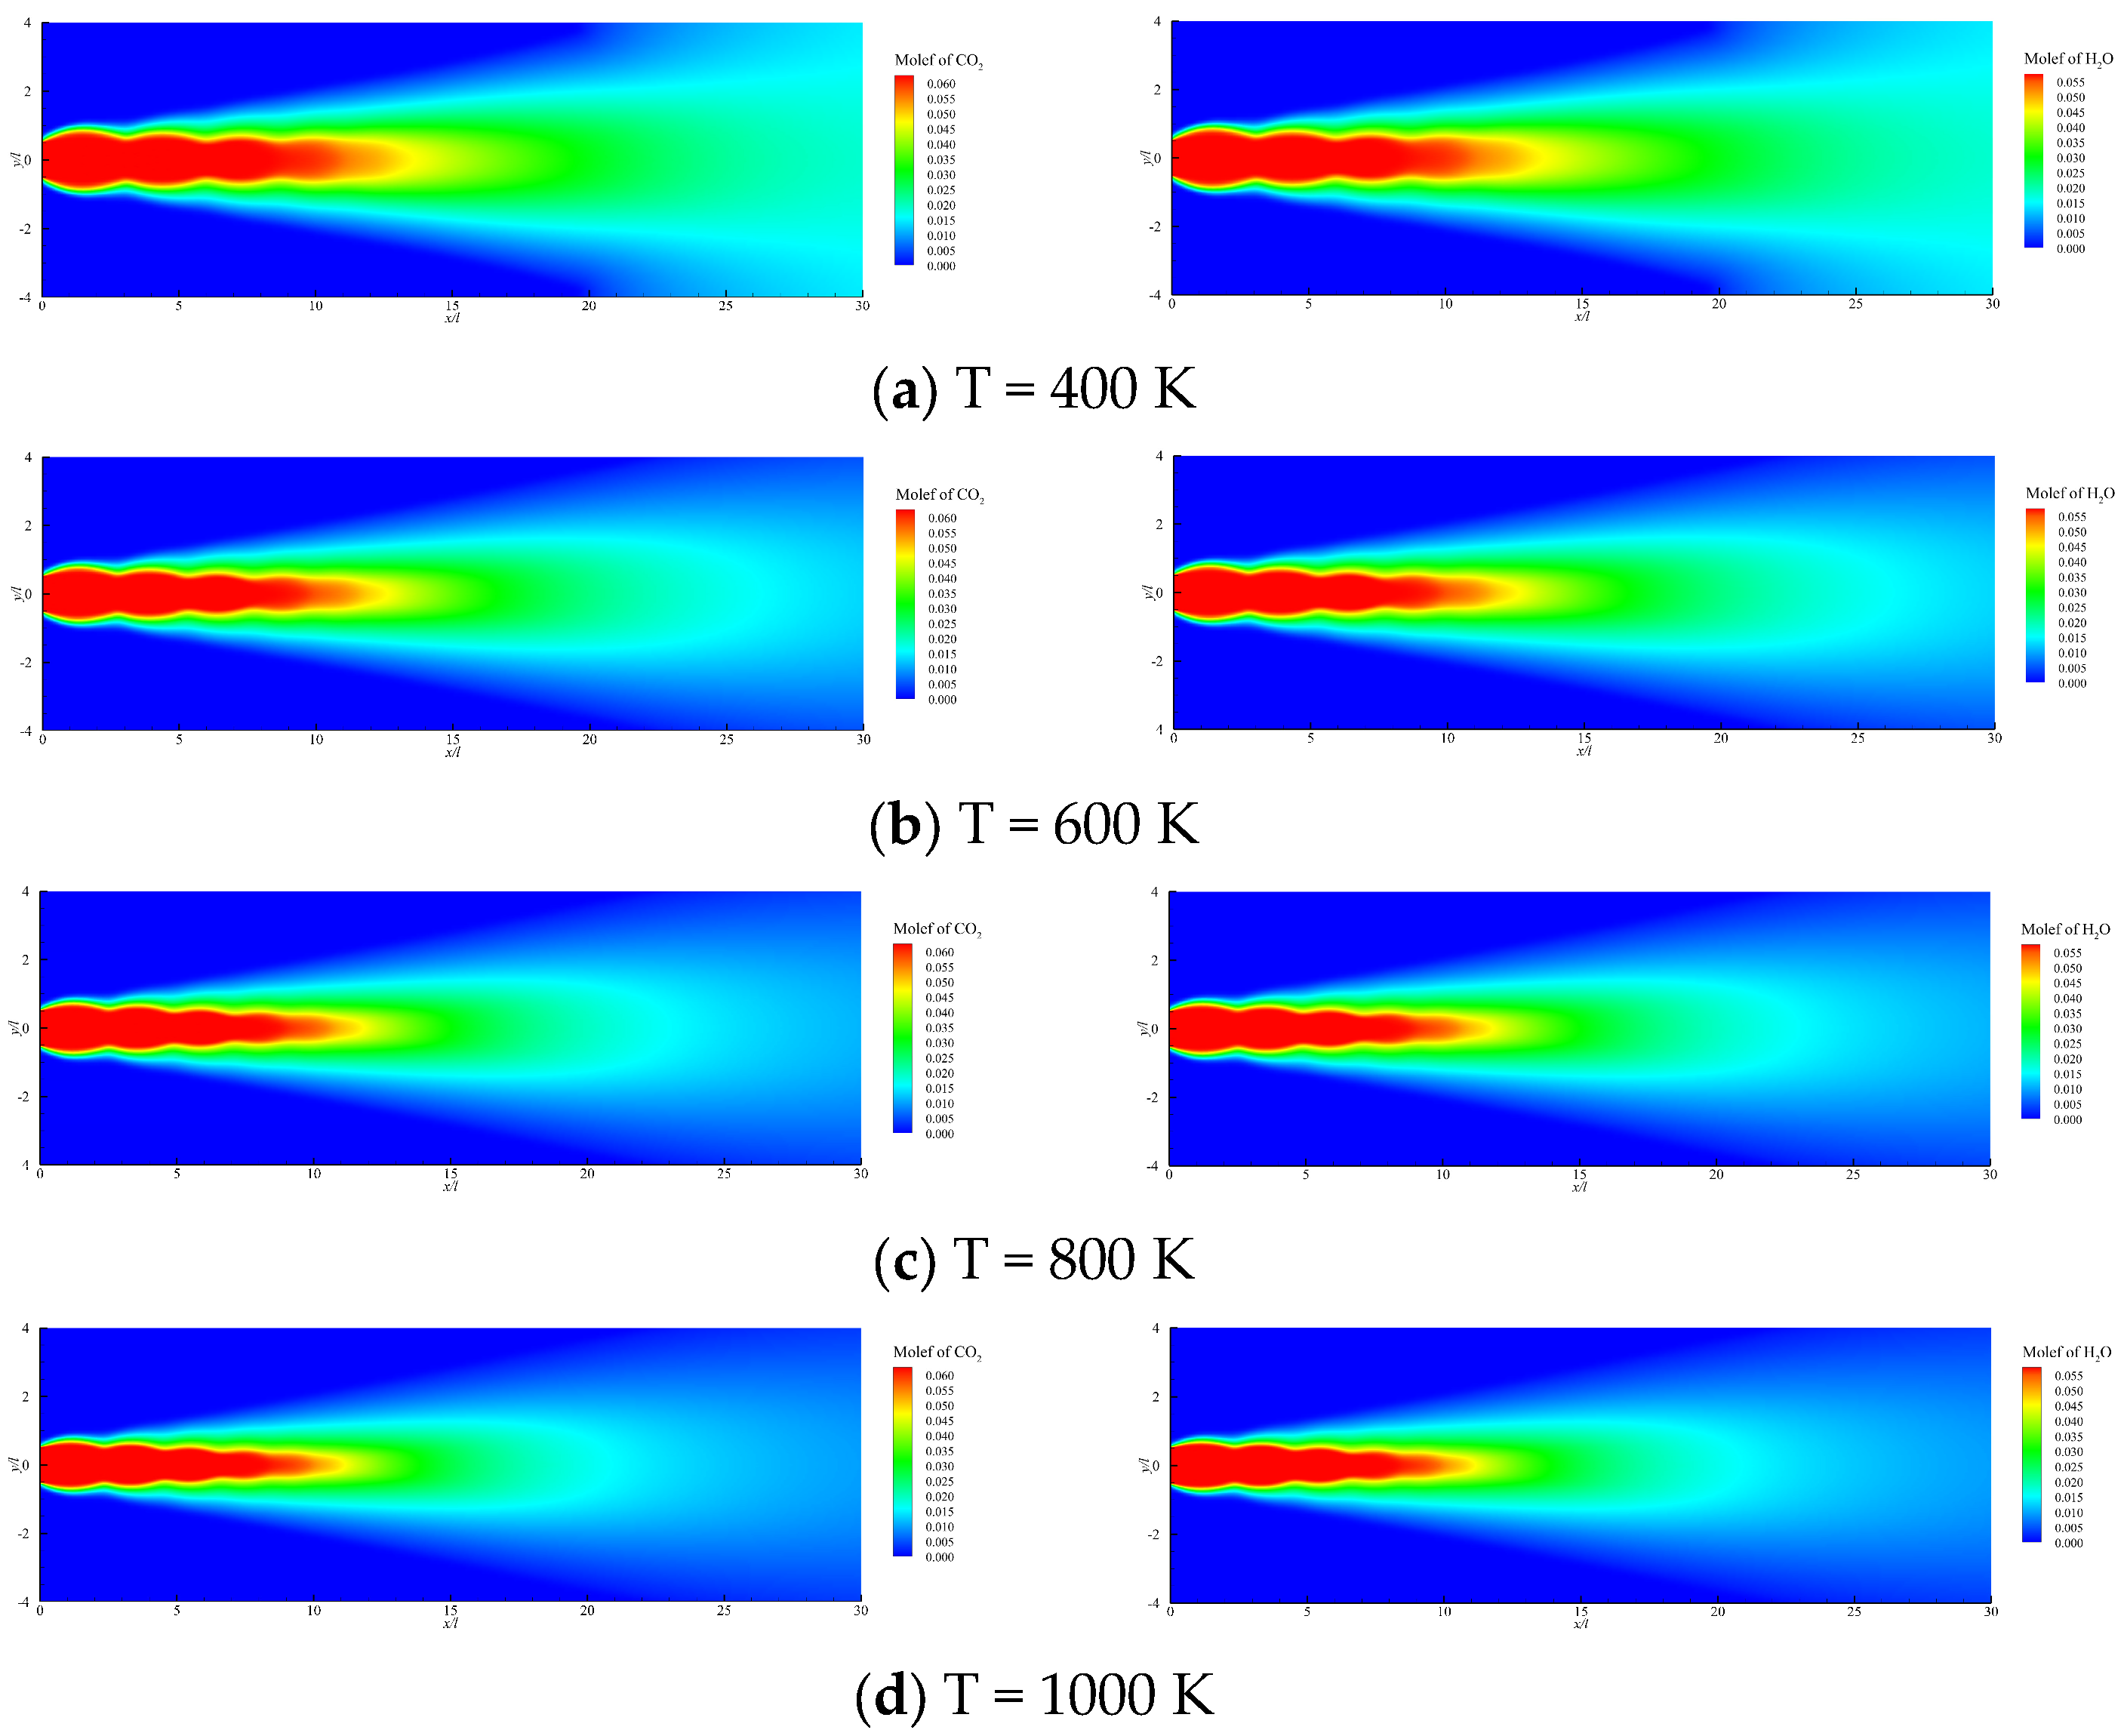
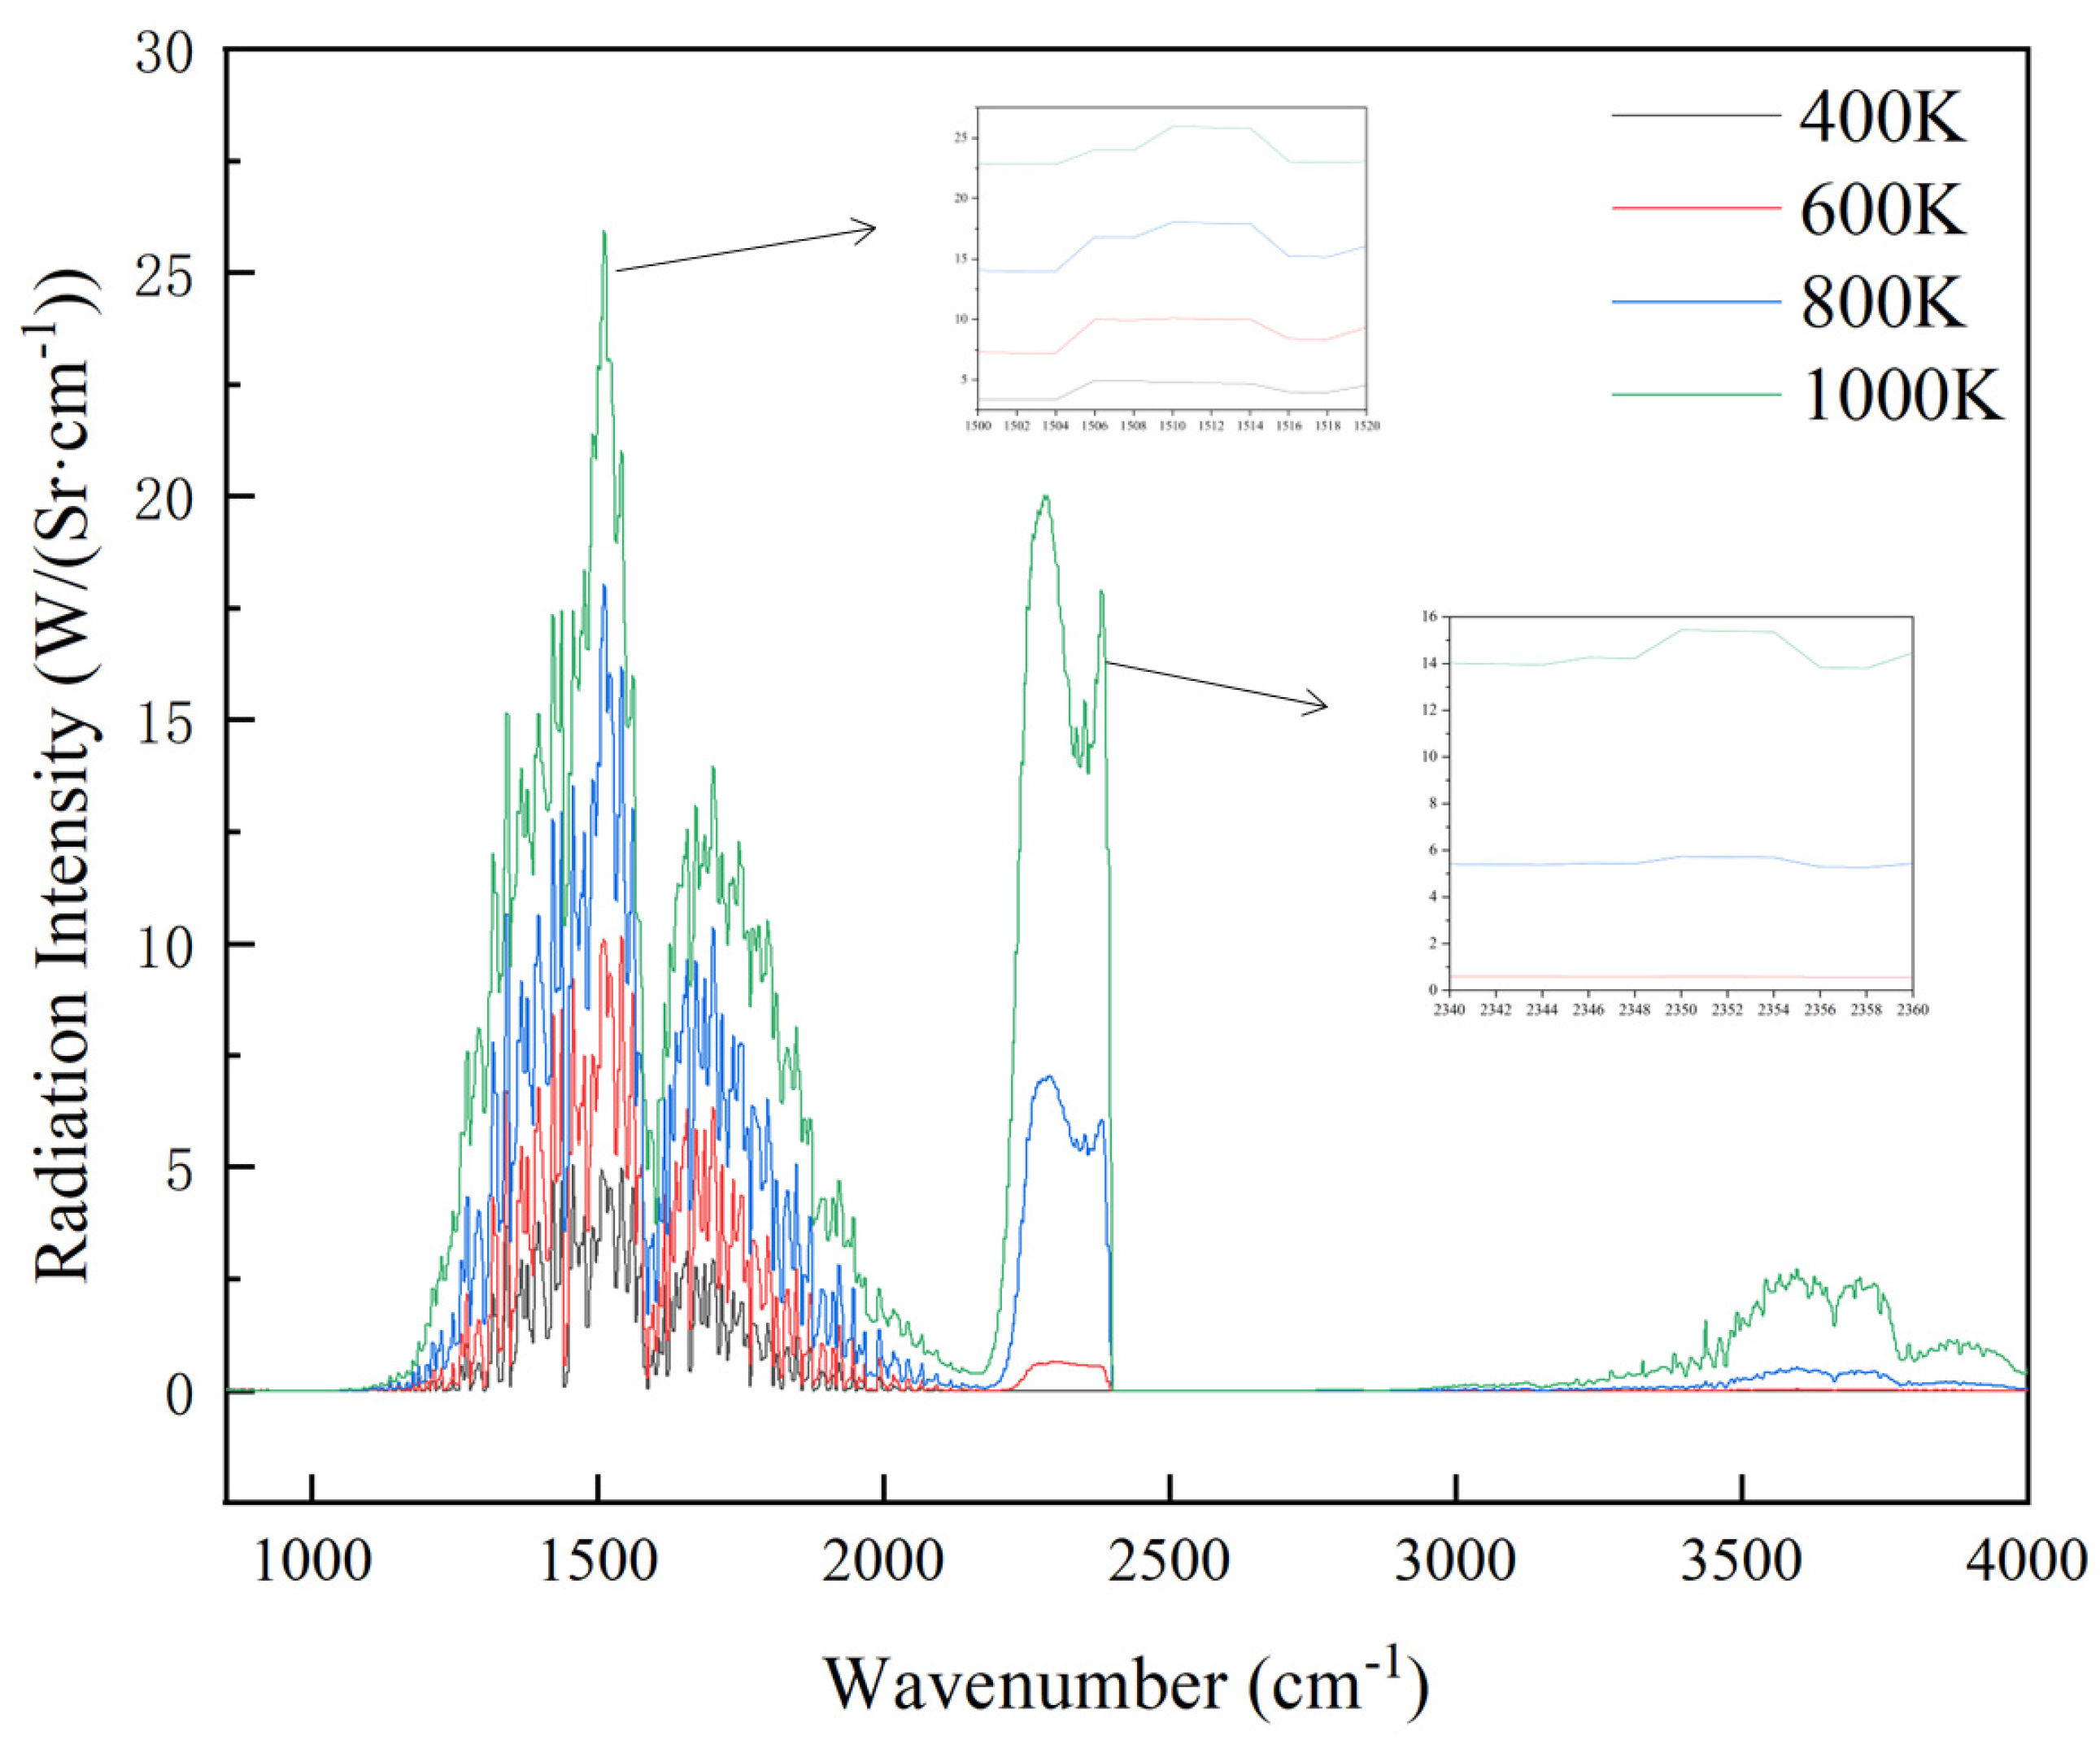
The computational domain in this study begins at the nozzle exit plane. The molar fraction and mass flow rate at the nozzle exit plane were determined using the aforementioned computational method. When investigating the influence of the fuel–air ratio, the total temperature was set to 1000 K, and the fuel–air ratio was varied in increments of 0.002 to obtain values of 0.025, 0.027, 0.029, and 0.031. To investigate the effect of total temperature, the fuel–air ratio was fixed at 0.031, and the total temperature was varied in 200 K increments to 400 K, 600 K, 800 K, and 1000 K. The total pressure was set to a constant value of 303.975 kPa.
3.2. Methods for Solving Wake Flow Field
This study employs the Finite Volume Method (FVM) to solve fluid control equations, utilizing a time-stepping approach to obtain steady-state solutions. All computations were conducted on structured meshes comprising 200,000 and 220,000 elements, verifying the solution’s mesh independence. Spatial discretization employed a second-order accurate scheme, where diffusion flux was discretized using central differencing and advection flux was handled via the upwind-biased form. Standard wall functions were applied near wall boundaries. For the inviscid flux vector, a high-order discretization technique based on the Total Variation Decrease (TVD) principle was adopted. Turbulence was set at 2%, with a turbulence length scale of 0.001 m.
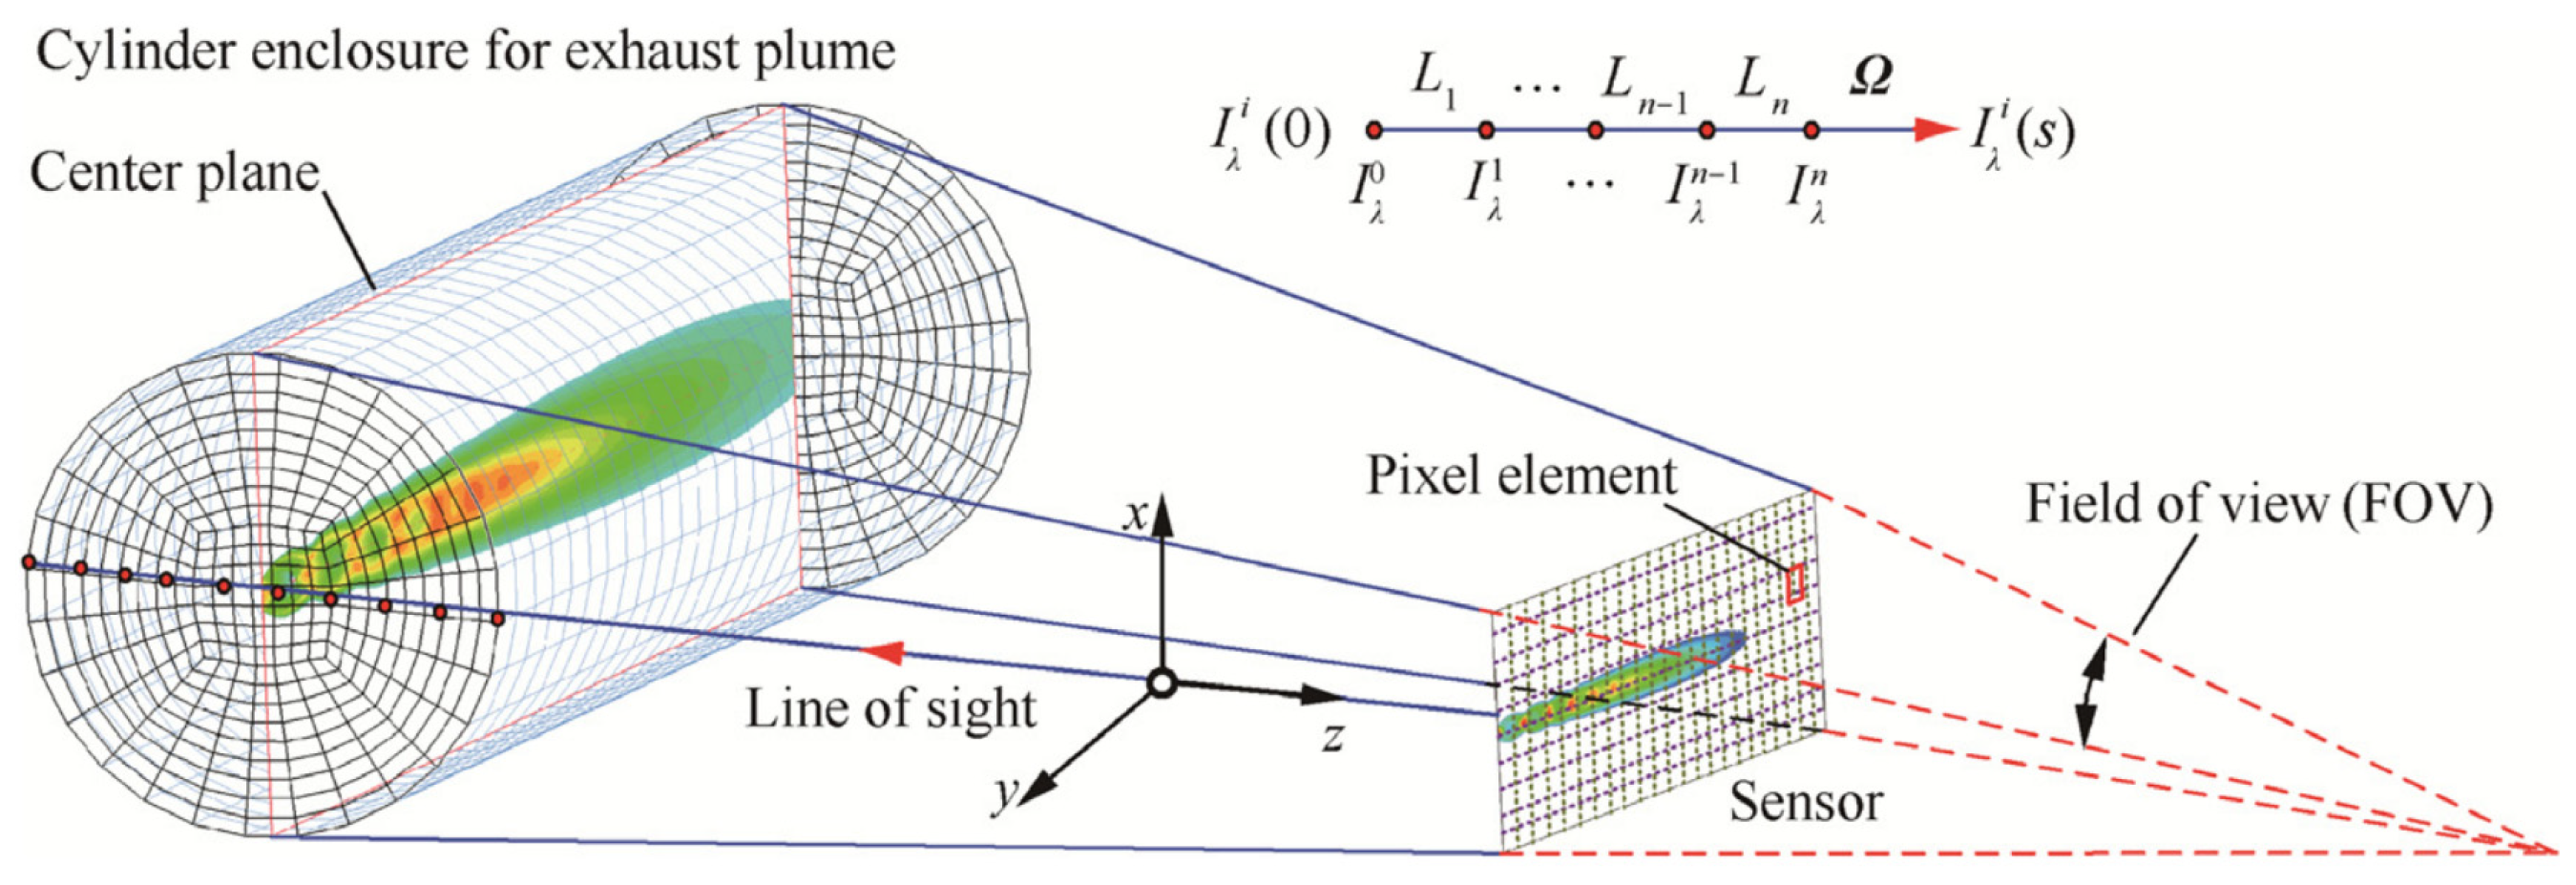
3.3. Methods for Solving the Radiative Transfer Equation
The analytical solution of the radiative transfer equation is highly complex. Currently, numerical computation is widely employed to solve radiative transfer problems in engine wakes. Since engine wakes consist of gases and the influence of scattering media on radiative transfer is negligible, LOS [
42] can be used to solve the radiative transfer equation. Its fundamental principle simplifies radiative transfer in three-dimensional non-uniform media to one-dimensional multi-layer media. Each LOS is discretized into m layers that coincide with the CFD grid cells intersected by the LOS, with the layer thickness ranging from 0.5 mm near the nozzle exit to 5 mm in the far field. A layer is treated as a homogeneous, isothermal medium when the intra-layer temperature variation is less than 1% of the local temperature and the species mole-fraction variation is less than 1%; this criterion is automatically satisfied in the near-nozzle region due to the fine grid and was verified a posteriori for the far-field cells. A line of sight parallel to the detector direction penetrates the entire wake computational domain. Each line of sight is divided into m layers. Assuming each layer contains a homogeneous, isothermal medium, the spectral distribution with a resolution of 2 cm
−1 is computed at each grid point along the LOS line in the reverse direction. Its discrete form is expressed as follows:
Here,
and
denote the radiation intensity and transmittance at the
kth layer of the medium with spectral band length
. The recursive solution procedure is summarized as follows: (i) input the flow-field data (
T,
P,
xj) obtained from the k-ε simulation; (ii) define the LOS grid according to the detector geometry; (iii) compute the SNB parameters (
,
,
) from the HITEMP database using Equations (13)–(15); (iv) compute the layer transmittance using the Malkmus model (Equation (12)); (v) march along the LOS in the reverse direction, applying the recursive discrete form (Equation (26)) layer by layer; and (vi) output the spectral radiation intensity at a resolution of 2 cm
−1. The flowchart of LOS radiation transfer solution is shown in
Figure 3.
3.4. Numerical Method Validation
In 2001, the Advanced Research and Development Center, where Avital [
35] worked, conducted ground-based infrared radiation measurements on the BEM-2 engine. This engine featured a nozzle diameter of 25 mm and utilized an AP/HTPB propellant formulation without aluminum powder additives. During measurements, both the spectrometer and imager were positioned 9.4 m from the axial cross-section of the exhaust plume. Both instruments were calibrated using a blackbody, and radiation measurements were corrected by subtracting background grayscale values. The measurements ultimately yielded infrared radiation intensity distributions within the 1.372–1.516 μm wavelength band and spectral intensity curves within the 1.5–5.5 μm band. Given the propellant formulation, nozzle dimensions, and gas composition at the nozzle exit, an appropriate computational model must be selected for validation. The structure and boundary conditions of the computational domain are shown in
Figure 4.
Selection of nozzle calculation parameters, including temperature, pressure, Mach number, and gas composition fractions, is shown in
Table 2.
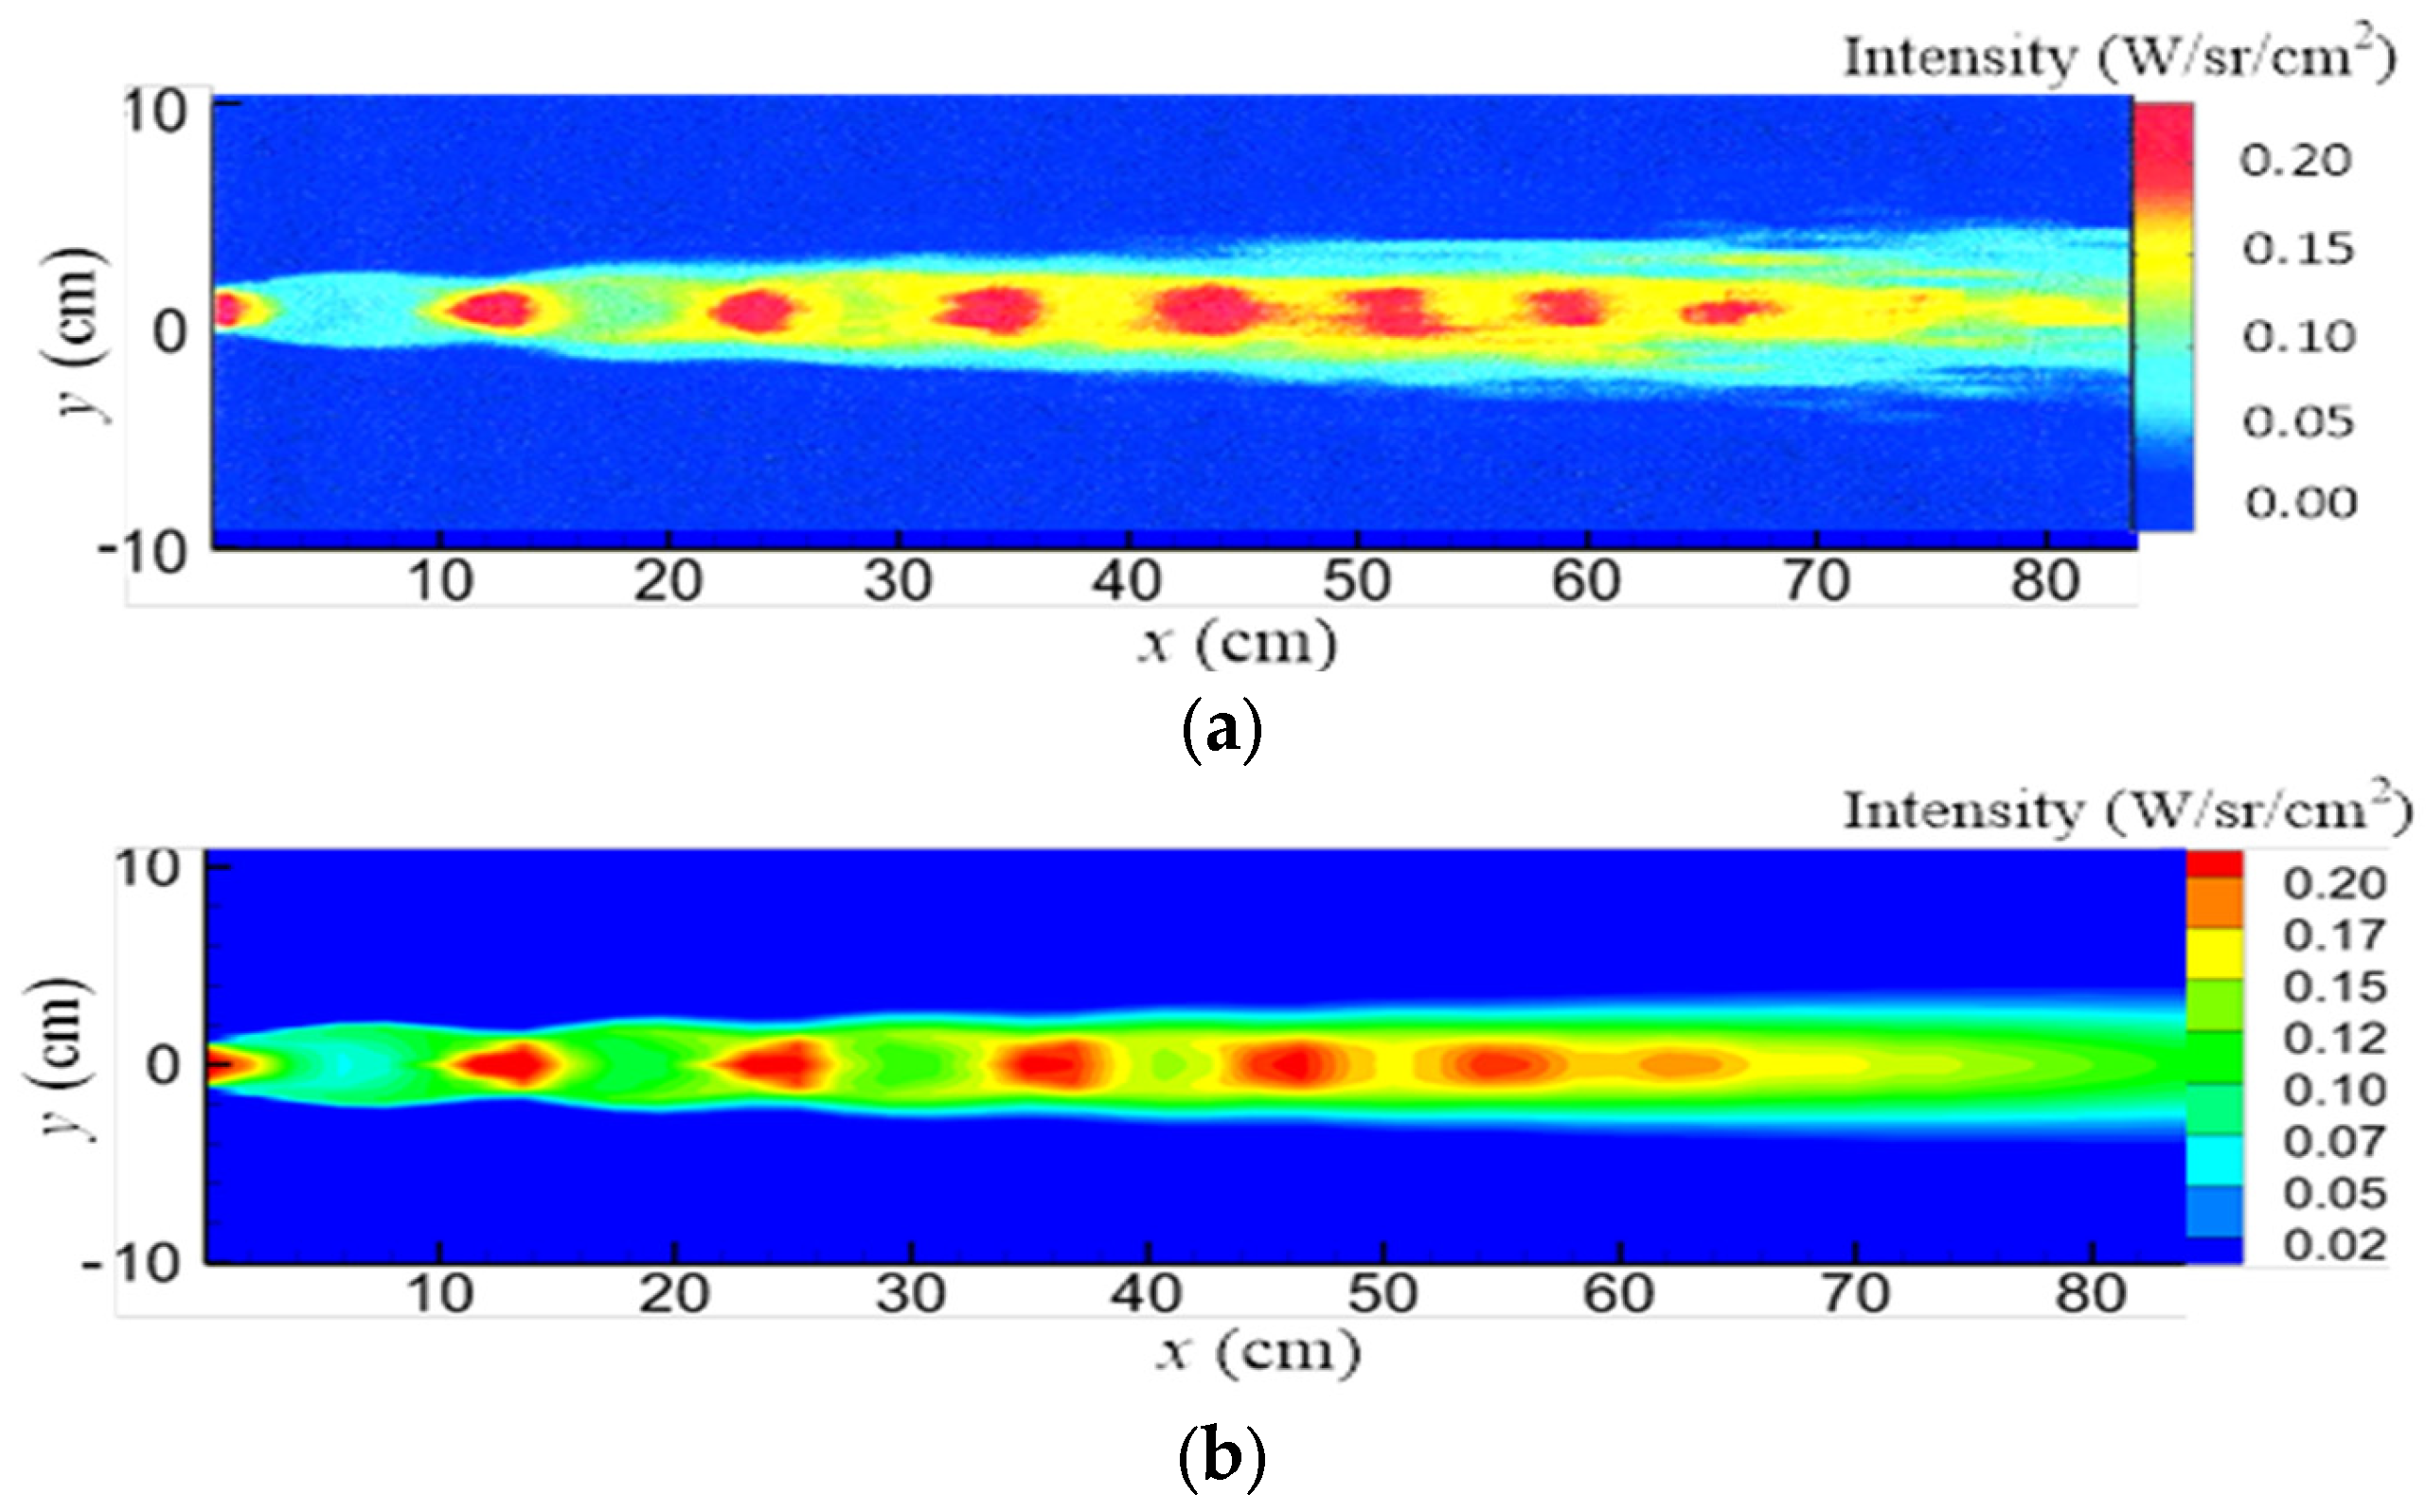
Figure 5 presents a comparison between experimentally measured and computationally derived infrared radiation intensity distributions within the 1.372–1.516 μm wavelength band. The number of Mach node locations captured in the computational image, their corresponding positions, and radiation intensities all exhibit good agreement with measured values.
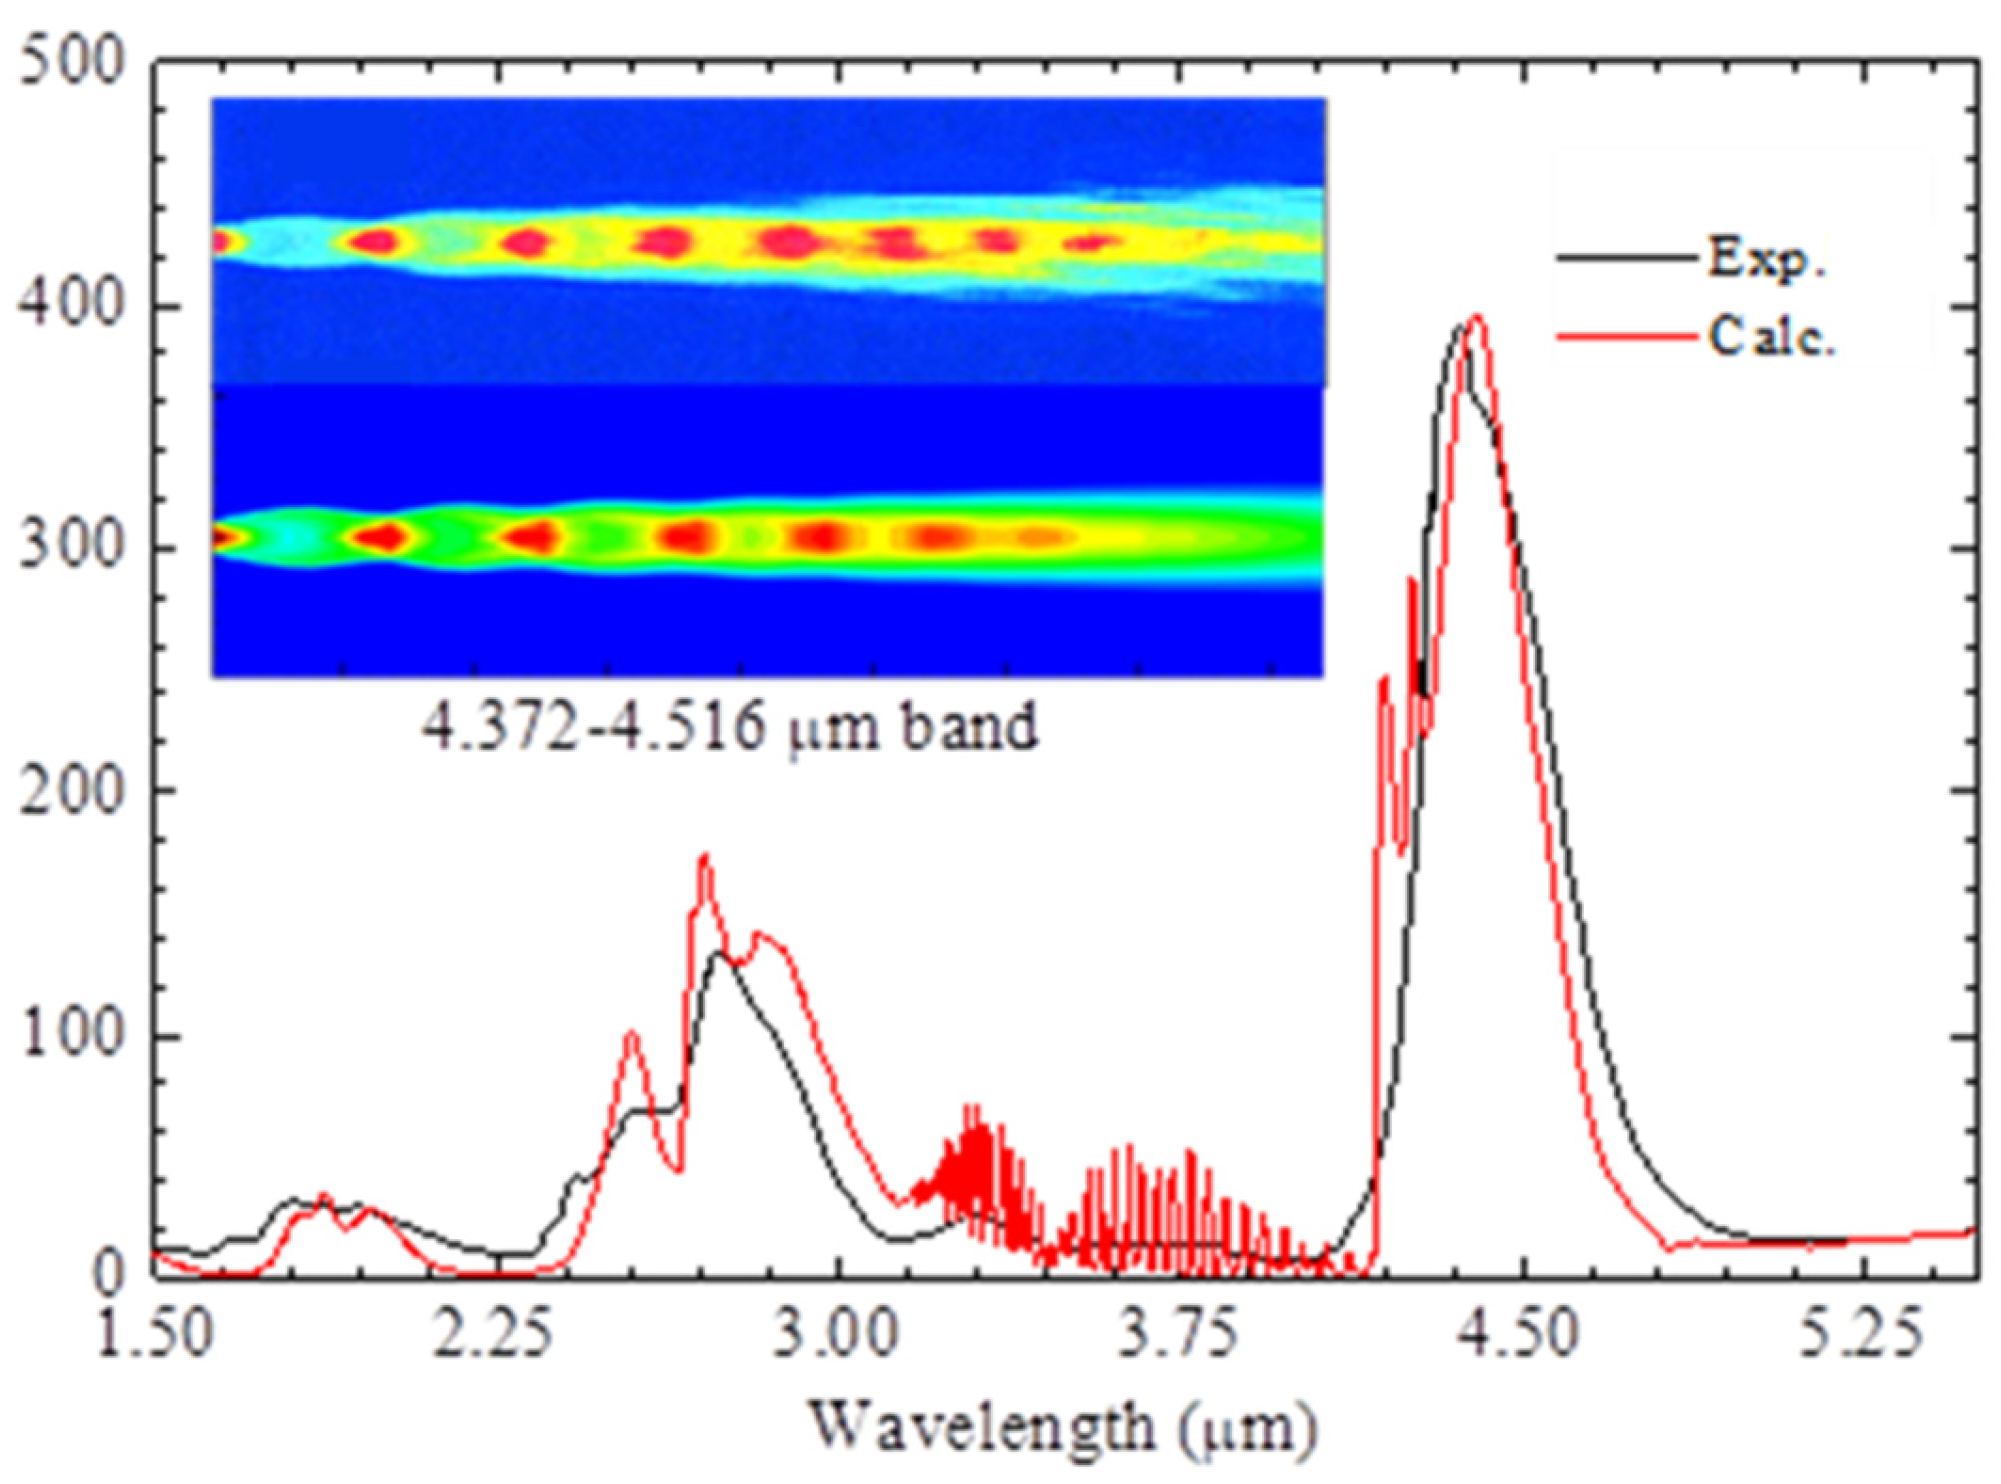
Figure 6 displays the comparison results between experimentally measured and computationally derived spectral radiation intensity curves within the 1–6 μm wavelength range. As shown, the error range between predicted and measured values is controlled within 10%. Detailed data are provided in
Table 3.
It should be noted that the BEM-2 engine employs AP/HTPB solid propellant, whose exhaust products include species such as HCl that are absent from RP-3 kerosene combustion, where CO2 and H2O are the dominant infrared-active species. Therefore, while the present validation demonstrates the model’s capability to handle high-temperature underexpanded jets in a general sense, it does not directly validate the single-step combustion model and the corresponding radiative properties specifically for RP-3 kerosene. A sensitivity analysis of the CO2/H2O concentrations was performed to confirm that the simplified single-step model yields reasonable spectral radiative intensity predictions under the operating conditions considered, with the results indicating that concentration variations within the fuel–air ratio range of 0.025–0.031 produce proportional changes in peak intensities without altering the fundamental spectral structure. In addition, a sensitivity analysis of intermediate combustion products was performed by injecting small CO mole fractions (0.1–1%, representative of fuel-lean combustion equilibrium at the nozzle exit) into the SNB–LOS calculation and quantifying the resulting variation in the peak intensity at 2143 cm−1 (CO fundamental band) and 2349 cm−1 (CO2 band). The results show that, within the studied fuel-lean regime, the contribution of intermediate products is below 2% of the total band-integrated intensity, confirming that the single-step model is adequate for the operating range considered.
3.5. Atmospheric Absorption Effects of Wake Spectra in the Infrared Band
Atmospheric absorption in the infrared spectrum refers to the phenomenon where primary atmospheric gases absorb infrared radiation, thereby attenuating radiant energy. Water vapor (H2O) constitutes a significant proportion of the atmosphere, with its concentration varying substantially across regions and weather conditions. In humid environments, its absorption of infrared radiation from exhaust plumes becomes more pronounced. Multiple absorption bands exist in the near- and mid-infrared regions, such as the O-H stretching vibration centered near 3756 cm−1 and the bending vibration of the H2O molecule centered around 1590 cm−1. Atmospheric CO2 levels are relatively stable, with its primary absorption band centered near 2349 cm−1, caused by its asymmetric stretching vibration. O3 molecules in the atmosphere are primarily concentrated in the ozone layer and have a relatively minor impact on aircraft wake spectrum absorption compared to H2O and CO2, with its main absorption band centered near 1041 cm−1.
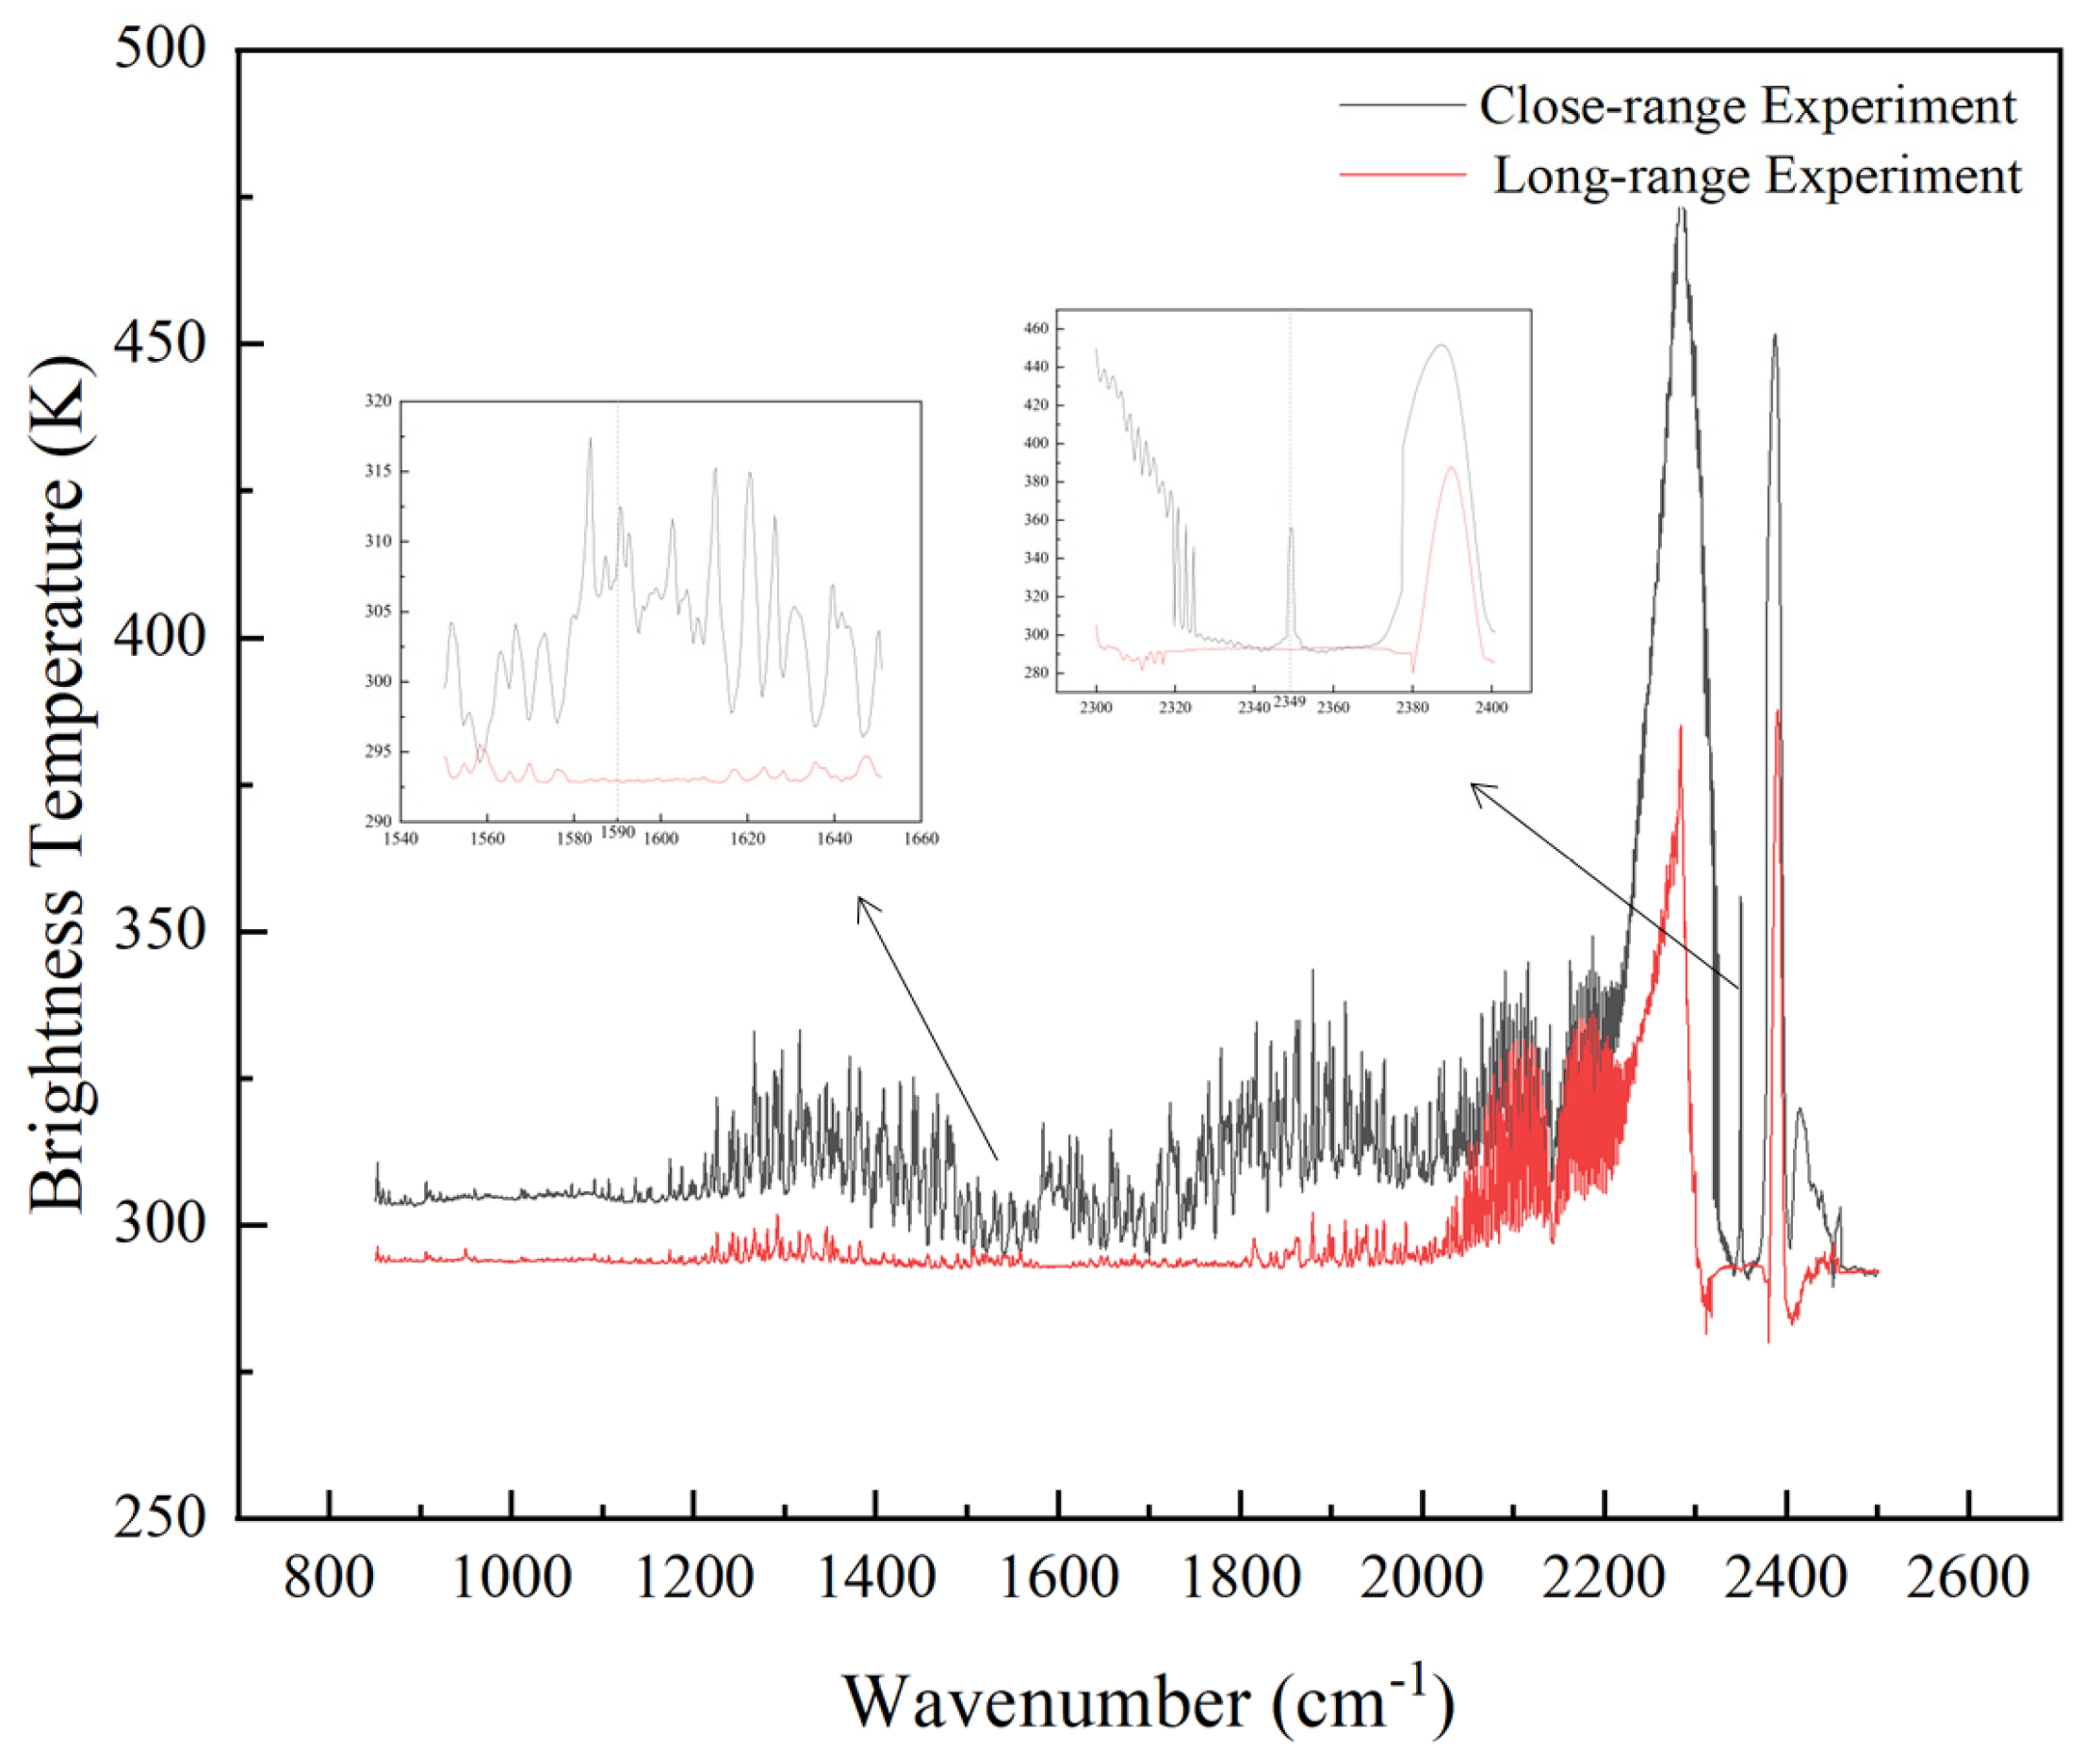
Our team conducted measurement experiments on the spectra of multiple aircraft types’ wakes using an FTIR. We analyzed ground-based aircraft wake spectra at different detection distances from a ground-based platform and numerically simulated atmospheric transmittance under various atmospheric models from a space-based platform. This research investigates the absorption effects of the atmosphere on wake spectra under different scenarios.
3.5.1. Experimental Data (Ground-Based Platform Detecting Surface Aircraft)
Infrared spectroscopy measurements were performed using an EM27 FTIR (Bruker Corporation). The spectrometer covers a measurement range of 2.5–12 μm, with a spectral resolution of 0.5 cm
−1, wavenumber accuracy of 0.05 cm
−1 @ 2000 cm
−1, operating in passive mode with 8 stacked scans. Research is currently underway in the 2–15 μm wavelength range with a resolution exceeding 0.25 cm
−1. Within the studied field of view (FOV) of 30 mrad, the focal length is 2000 mm, the optical aperture is 1000 mm, and the noise-equivalent spectral radiance is 6 × 10
−8 W·cm
−2·sr
−1·cm
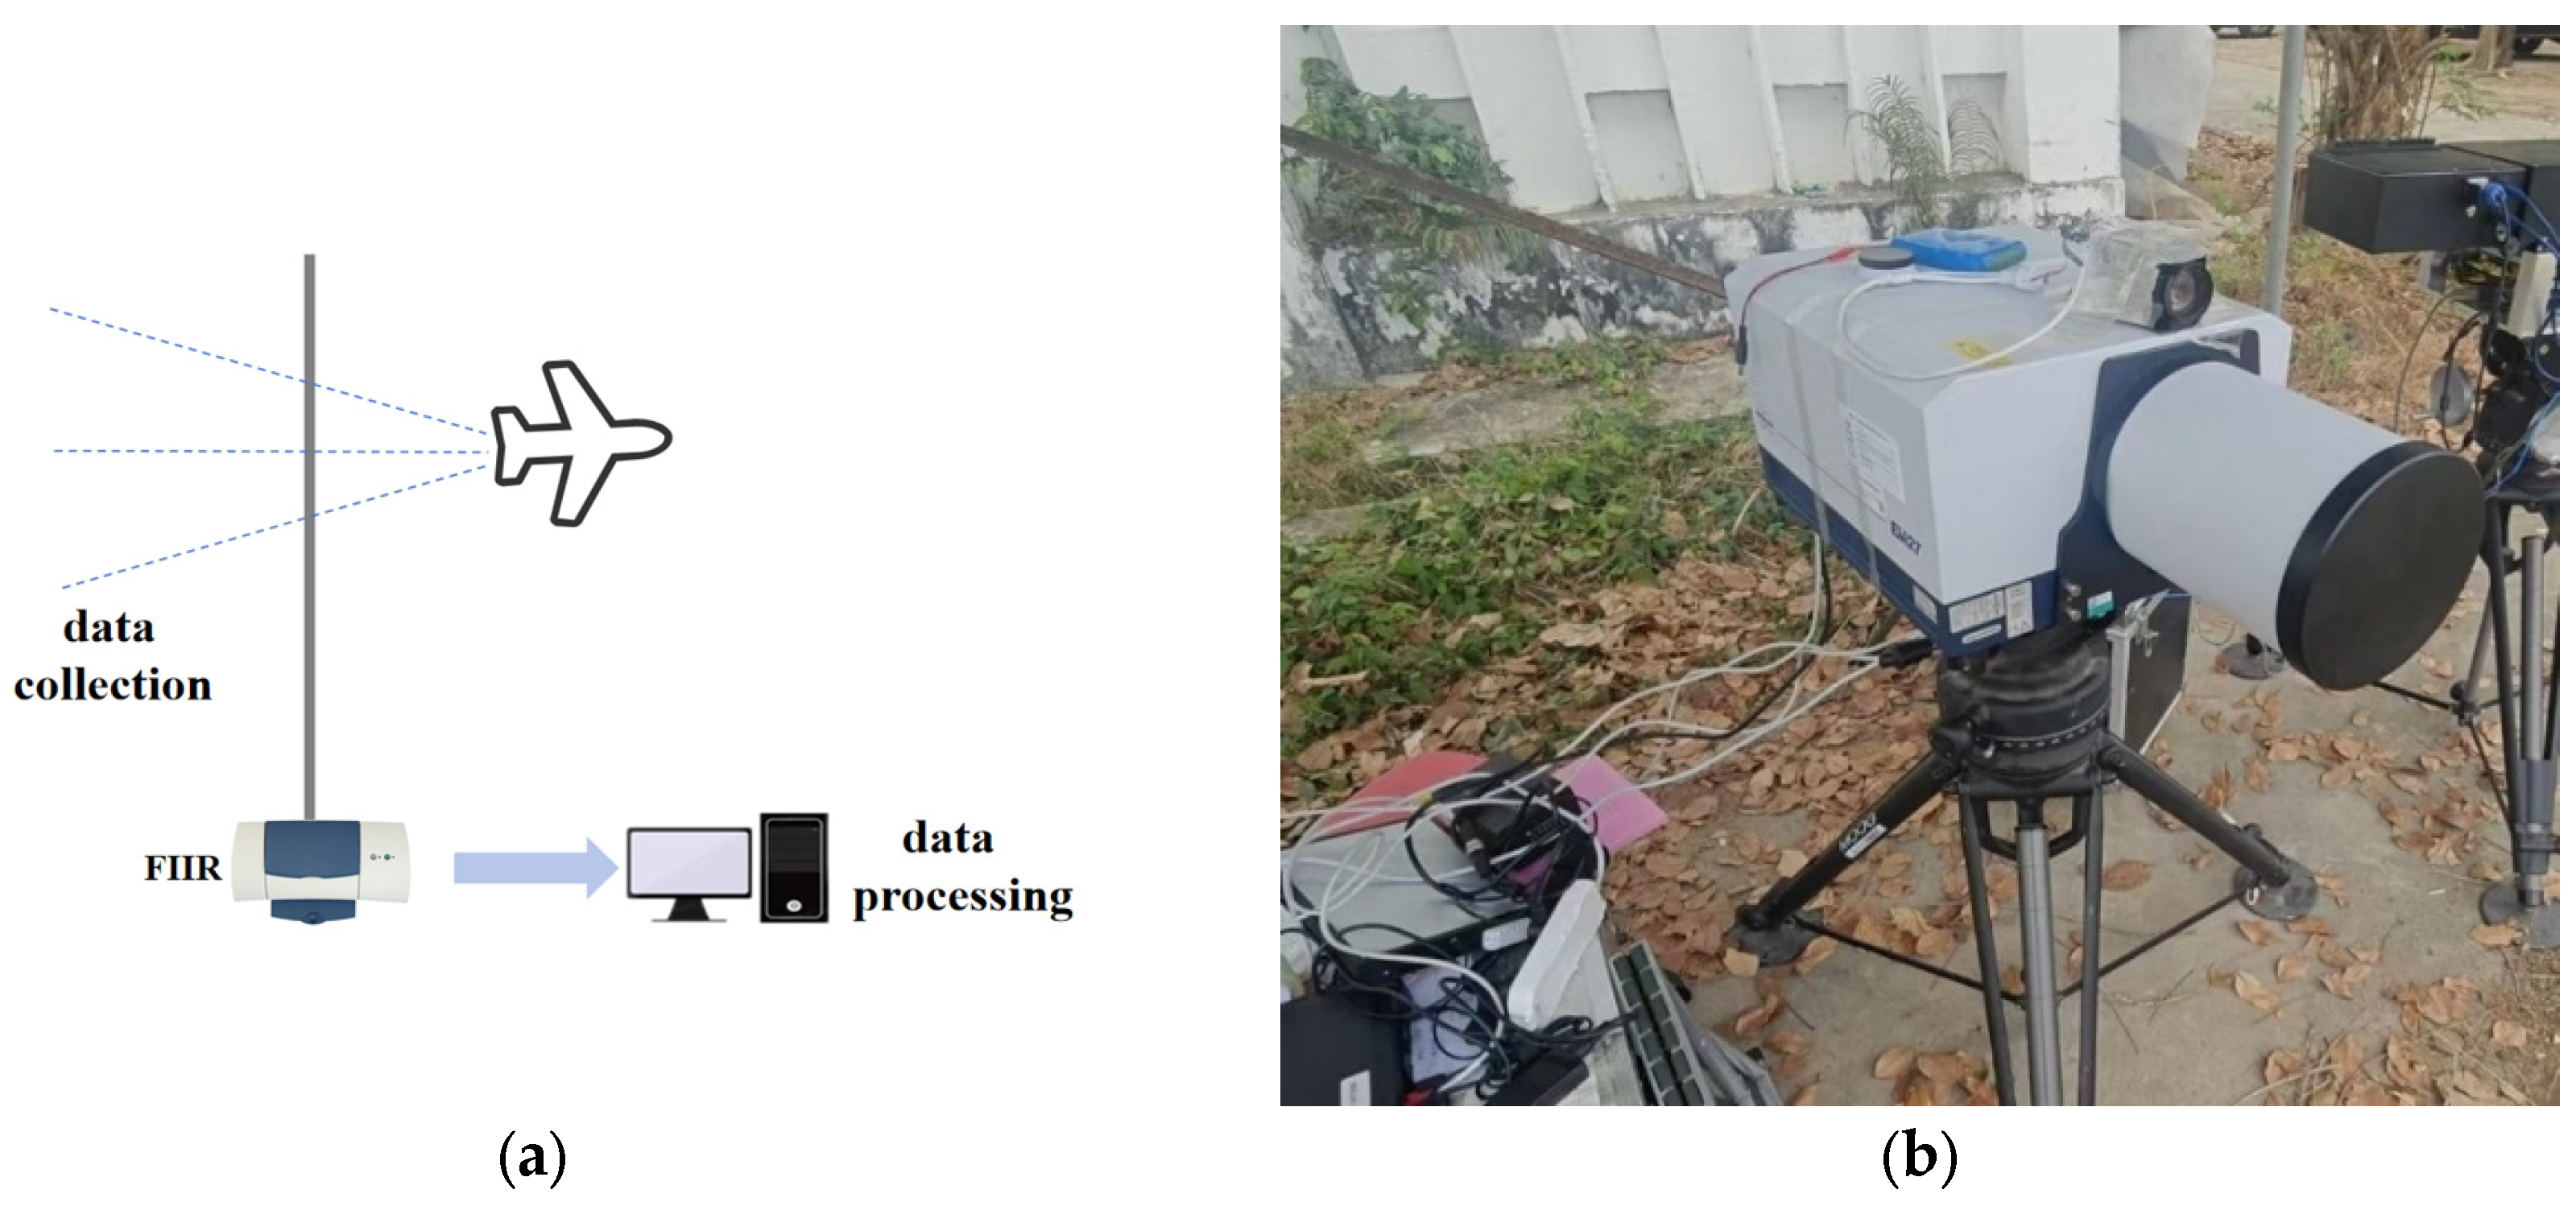
−1. The field experiment scene for data acquisition is shown in
Figure 7.
During close-range testing, the instrument was positioned 5 m from the wake. For long-range testing, it was placed 400 m away. The field-of-view axis was perpendicular to the wake axis to maximize received radiation intensity. Ambient conditions were 18 °C and 78% relative humidity. Instrument calibration was performed using a blackbody. Experimental data is presented in
Figure 8.
3.5.2. Simulated Data (Space-Based Platform Detecting Aircraft in Flight)
Researchers, including Wei Heli from the Institute of Optics and Precision Mechanics, Chinese Academy of Sciences, developed the Combined Atmospheric Radiative Transfer (CART) software [
43,
44,
45,
46], which incorporates atmospheric parameters for typical regions across China. Compared to international models like MODTRAN, CART integrates parameter profiles from numerous domestic locations, enabling more accurate simulation of atmospheric transmission patterns across various Chinese regions. It employs line-by-line integration and parameterized atmospheric molecular concentrations to calculate the mean atmospheric transmittance within a 0.1 cm
−1 bandwidth. The mean atmospheric transmittance is modeled using a fourth-order nonlinear exponential equation
where
denotes the average transmittance of a given atmospheric molecule at a specific wavenumber
v ± 0.5 cm
−1 under atmospheric temperature
t, atmospheric pressure
p, and molecular absorption content
u;
ci(
t,
p) represents the fitting coefficients corresponding to
i = 0, 1, 2, 3, 4.
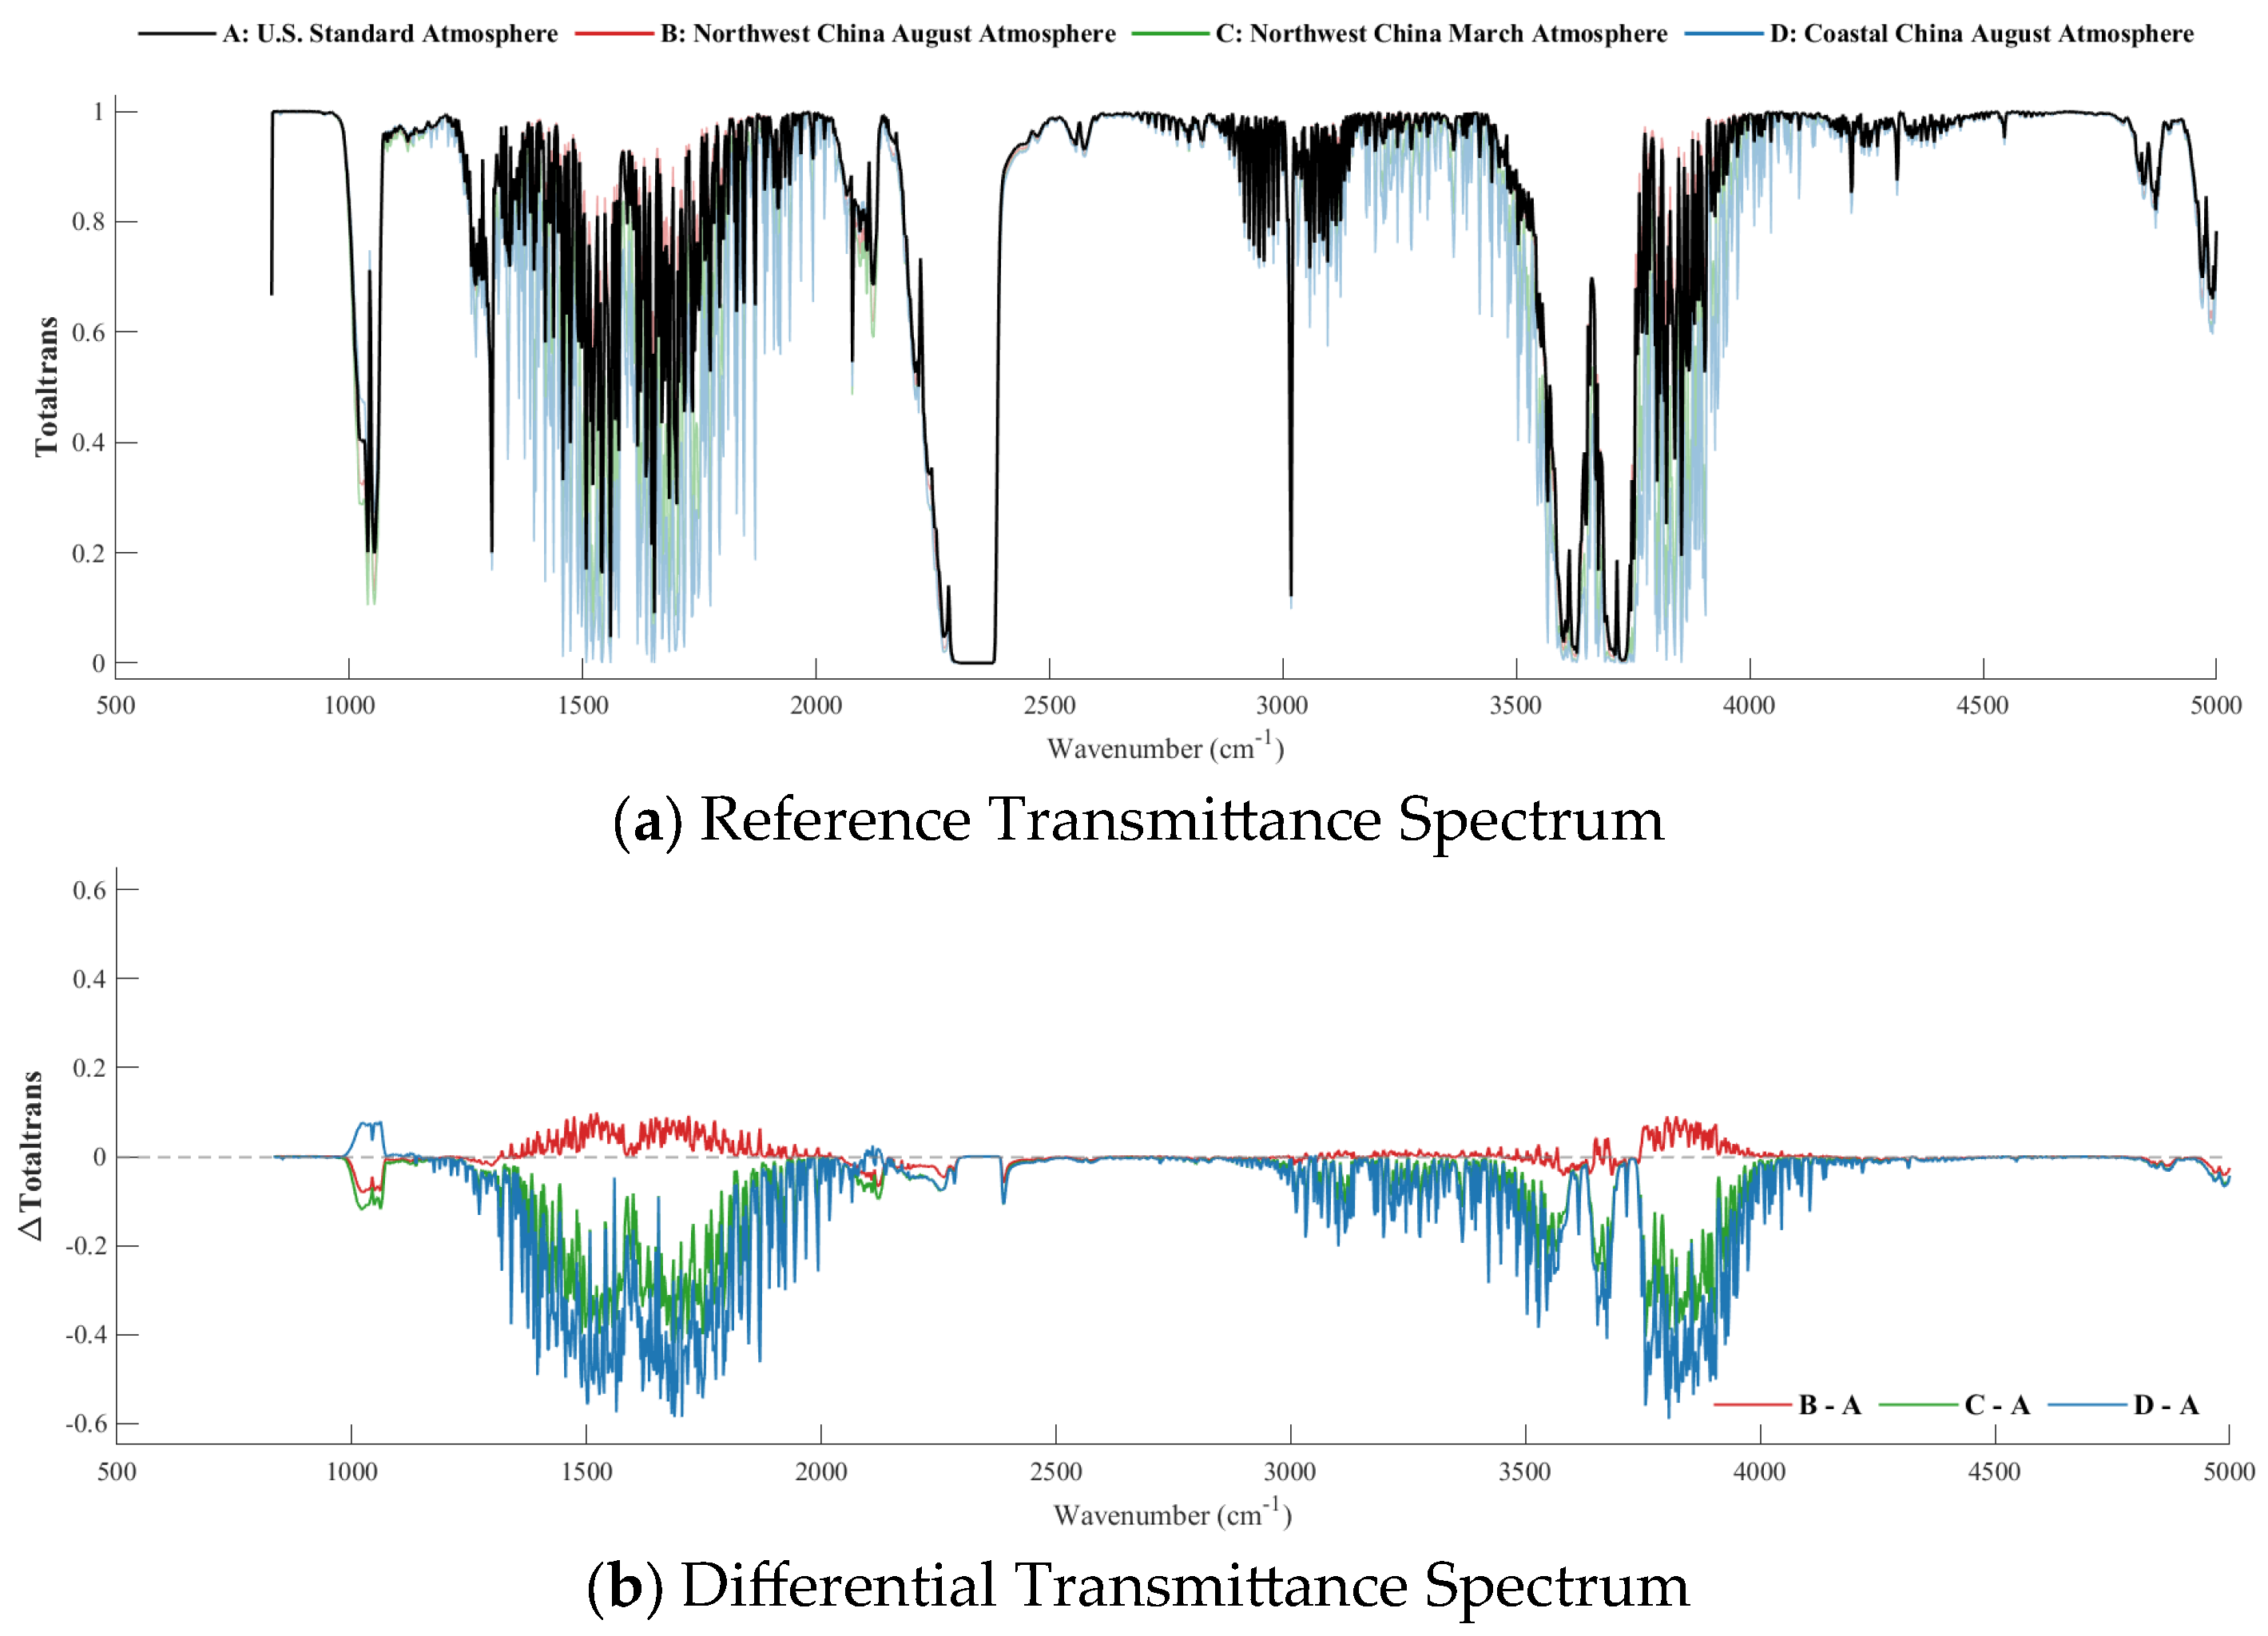
The energy radiated from aircraft wakes undergoes atmospheric absorption and attenuation during its propagation to space-based platform detectors. The selected conditions are the U.S. Standard Atmosphere model, the March atmospheric model for the Northwest region, the August atmospheric model for the Northwest region, and the August atmospheric model for coastal areas; observation altitude: 500 km; target altitude: 10 km; observation zenith angle: 135 degrees; wavelength range: 833 cm
−1 to 5000 cm
−1 (2 μm to 12 μm); spectral resolution: 2 cm
−1. The atmospheric spectral transmittance is shown in
Figure 9 below.