1. Introduction
The digital transformation associated with Industry 4.0 has deeply changed the organization of industrial automation systems. Cyber–physical systems (CPSs), the Industrial Internet of Things (IIoT), data analytics, and distributed computing have increased the need for interoperability between field devices, control systems, supervisory platforms, and management applications. In this context, supervisory control and data acquisition (SCADA) systems have evolved from predominantly centralized and monolithic solutions toward architectures that support distributed components, web technologies, and standardized communication interfaces [
1,
2].
This revolution has also affected water-treatment systems, which require continuous and simultaneous monitoring of hydraulic, physicochemical, and operational variables [
3,
4]. In reverse osmosis (RO), variables such as pressure, flow rate, temperature, pH, and electrical conductivity (EC) are used to follow process operation and the condition of the produced water [
4,
5]. Although periodic laboratory analyses and local measurements remain relevant, their discontinuous nature limits the immediate identification of operational changes. Continuous supervision allows process conditions and operational events to be recorded, supporting historical analysis, operation, and decision making [
6].
Previous studies have demonstrated the feasibility of open and distributed technologies for the supervision of reverse-osmosis and desalination systems [
5,
7,
8,
9,
10,
11]. However, the examined implementations report different combinations of acquisition, communication, historical storage, alarm management, human–machine interaction, operational diagnosis, and remote configuration. The research gap addressed in this work is the absence, among the reviewed publications, of an open SCADA-based supervisory architecture that reports the integration and functional validation of this complete set of services within a single platform. This observation concerns the functions and validation evidence documented in the reviewed publications and does not imply that the corresponding architectures are technically incapable of incorporating additional services. Therefore, the aim of this study is to develop and validate an open SCADA-based supervisory architecture for an experimental RO system that integrates the services required for process monitoring, supervision, and operational management. To achieve this goal, the functional and architectural requirements of the platform were defined, the proposed architecture was designed, and mechanisms for distributed data acquisition and communication between the field devices and the supervisory platform were developed. The monitoring, historical data persistence, alarm management, human–machine interface, operational diagnosis, and remote-configuration modules were then implemented and integrated into a single platform.
The specific contribution of this study is the integrated implementation and functional validation, under defined test conditions, of this set of supervisory services within a single open four-layer architecture. The contribution concerns the reported combination of functions and validation evidence rather than the isolated use of the selected hardware, protocols, or software components. The scope is supervisory: the architecture acquires, processes, stores, diagnoses, and presents process information and supports remote configuration of measurement parameters, but it does not execute automatic closed-loop control of pumps, valves, pressure, or flow rate.
The resulting architecture was evaluated through complementary evidence obtained from the instrumented experimental RO system and through a controlled set of software tests of the implemented supervisory functions. The validation verified compliance with the established functional requirements and whether the implemented modules operated coherently as parts of the proposed architecture.
3. Materials and Methods
3.1. Experimental Reverse Osmosis System
The proposed supervisory architecture was implemented and validated in an experimental reverse osmosis (RO) system developed within the Água Dura Project at the Federal University of Mato Grosso do Sul (UFMS) [
28]. The system was originally designed to treat groundwater with elevated hardness and salinity toward potable-water production, particularly for small communities affected by limited access to suitable drinking water. In this study, the experimental unit constituted the physical process connected to the supervisory architecture, providing the process measurements and operating states used in its functional validation.
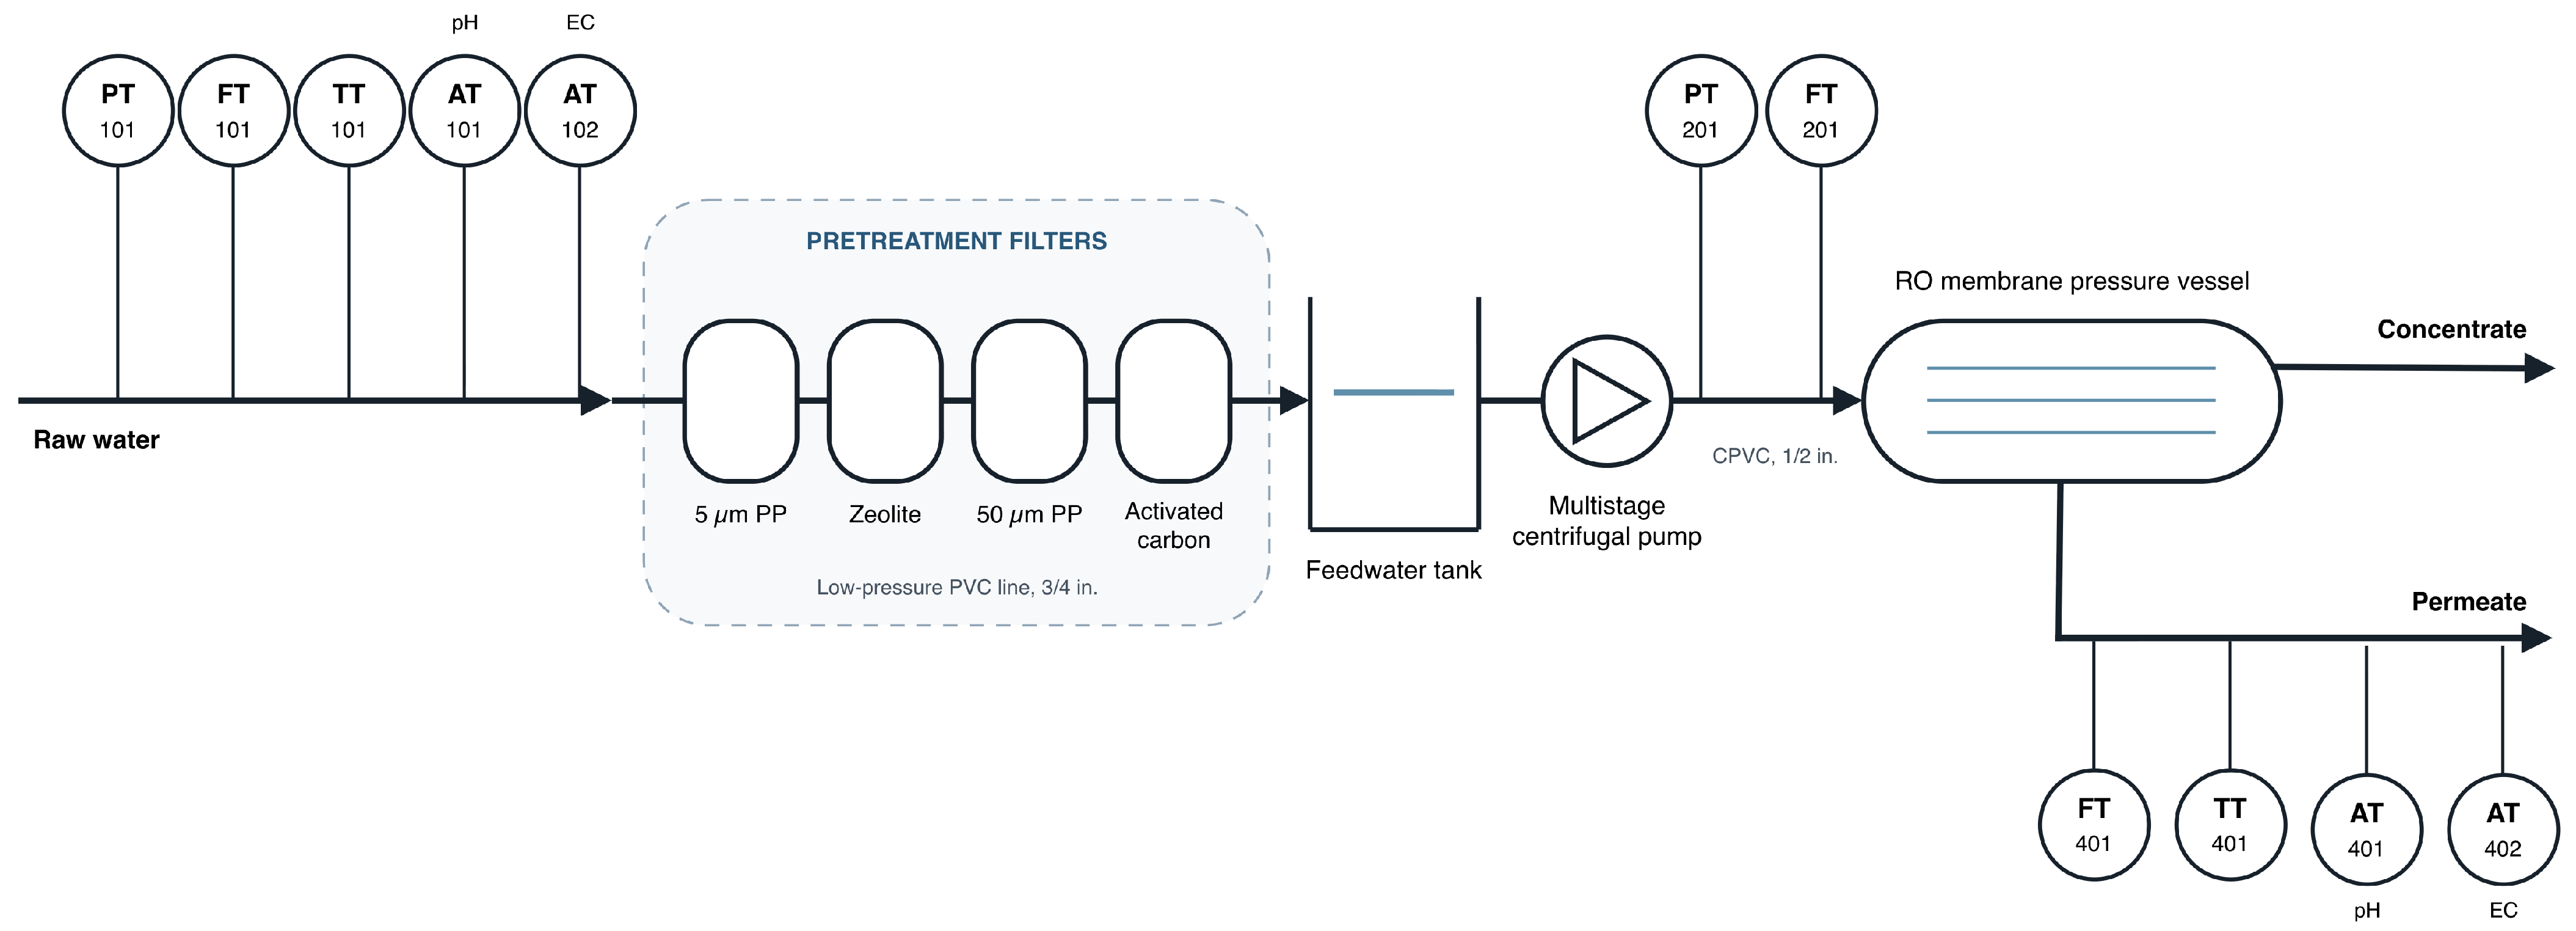
The hydraulic system comprised a pretreatment train, a feedwater tank, a multistage centrifugal pump, an RO separation unit and interconnecting piping. Raw water passed through four filters connected in series: a 5 μm polypropylene cartridge, a zeolite filter, a 50 μm pleated polypropylene cartridge, and an activated-carbon block cartridge. After pretreatment, the water was stored in the feedwater tank and subsequently supplied to the RO separation unit by the centrifugal pump. The low-pressure sections were constructed using 3/4 in PVC piping, whereas the pressurized line connecting the pump to the RO unit used 1/2 in CPVC piping. The pump had a nominal power rating of 3 kW and a maximum flow rate of approximately 1546 L h
−1. The RO separation unit contained a 4 in × 40 in polyamide/polysulfone membrane element with a maximum rated operating pressure of 42 bar and a nominal permeate flow rate of 441 L h
−1. The pressurized feedwater was separated by the membrane into permeate and concentrate streams. The hydraulic arrangement of the experimental system and the locations of the measurement channels are shown in
Figure 1.
Eleven measurement channels, covering five measured quantities, were distributed along three monitored process sections. The upstream process section, identified by the 1xx numerical series, comprised pressure, flow rate, temperature, pH, and EC measurements. The membrane-feed line, represented by the 2xx series, comprised pressure and flow-rate measurements. The permeate line, represented by the 4xx series, included flow rate, temperature, pH, and EC measurements. The concentrate line was not directly instrumented.
The instrument letter codes followed ANSI/ISA-5.1-2024 guidelines [
29]. The first letters P, F, T, and A denoted pressure, flow, temperature, and analysis as the measured variables, respectively. The succeeding letter T denoted the transmitter function.
Table 1 summarizes the measurement channels and their roles in process supervision.
The measurement channels were implemented using commercial off-the-shelf (COTS) devices: Water Pressure Sensor G1/4 transducers, YF-S201 flow sensors, DS18B20 temperature sensors, PH-4502C pH modules, and Keystudio TDS Meter V1.0 modules, which were employed for EC measurement. These devices, which were experimentally calibrated before the supervisory validation, were selected according to their measurement ranges, commercial availability and electrical and signal-interface compatibility with the ESP32. Low-cost sensors are recurrent in IoT-based water-quality monitoring literature. However, their accuracy and reliability remain application dependent [
30]. For this reason, the devices were used as process-data sources for the functional validation of the supervisory architecture rather than as reference-grade instruments. The temperature channels were used both for direct process monitoring and for temperature compensation of the pH and electrical-conductivity measurements.
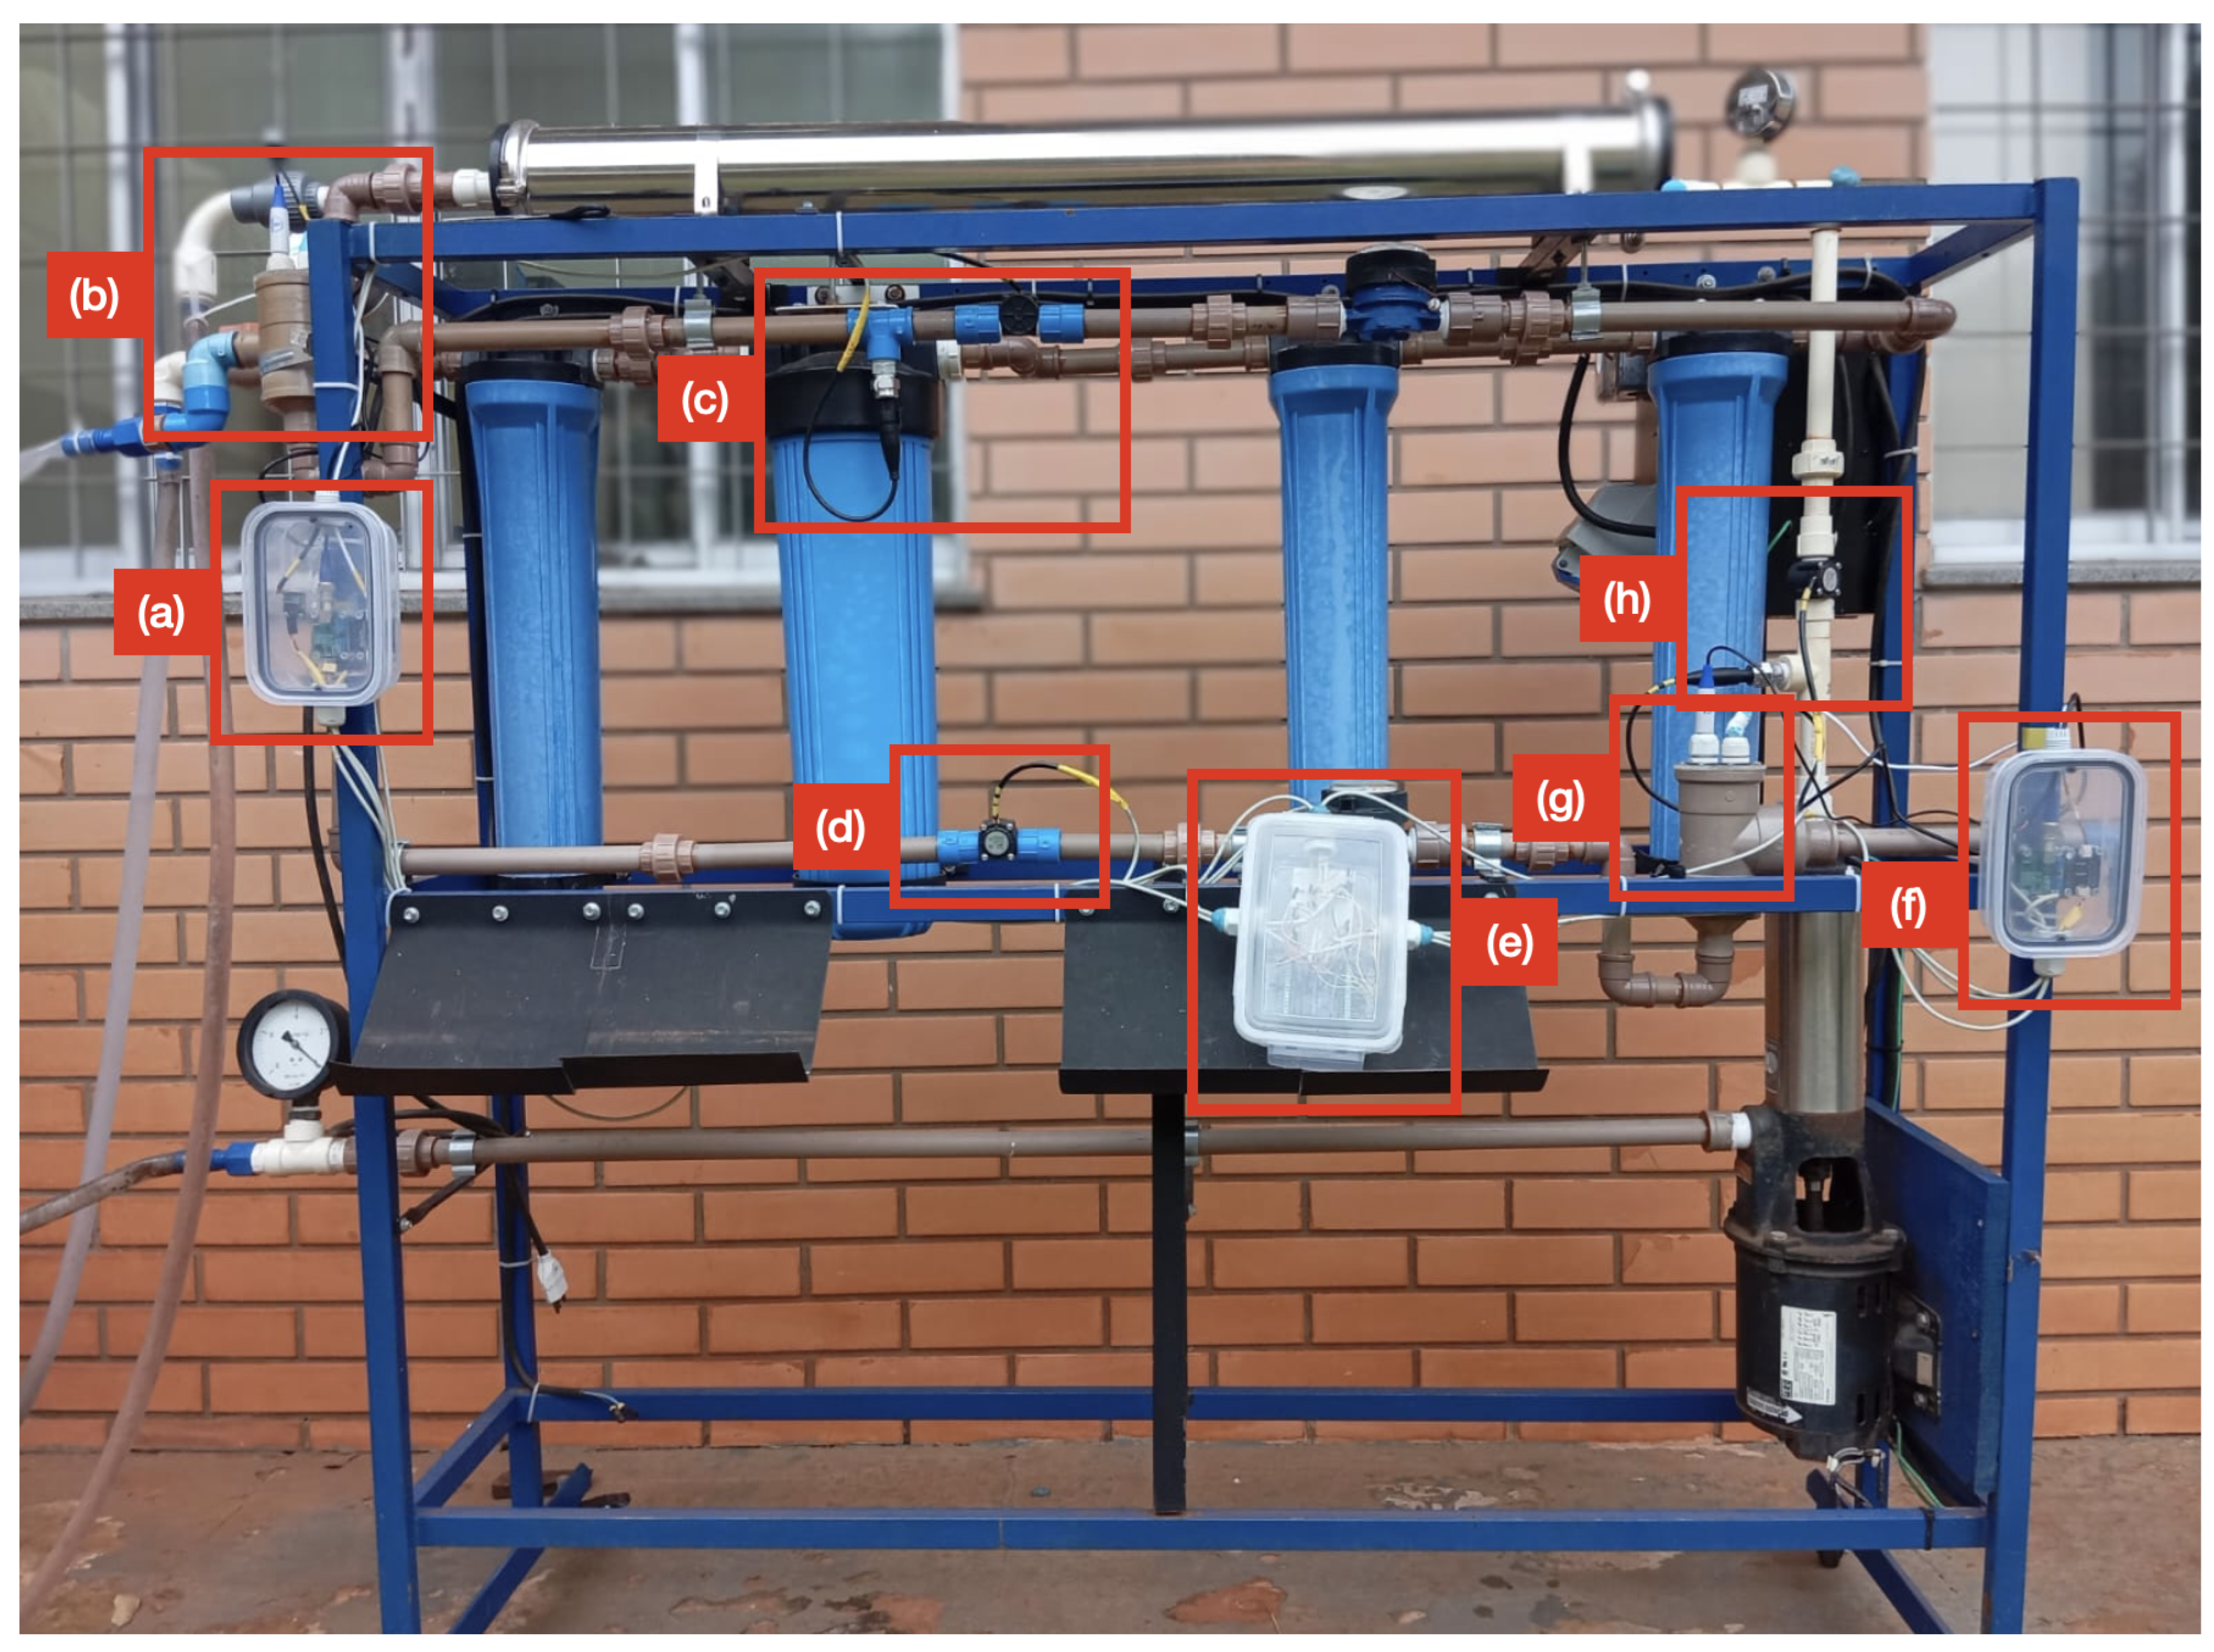
The physical implementation of the measurement channels is shown in
Figure 2. The photograph identifies the instrument groups, signal-conditioning interfaces, and ESP32-based acquisition node installed in the experimental system.
The experimental installation provided the physical process and measurement channels used for data acquisition and historical-data assessment. The scope of the implemented architecture was supervisory: it comprised measurement acquisition, data communication, visualization, alarm management, historical persistence, diagnostic presentation, and remote configuration of sensor parameters. The system did not implement automatic closed-loop control of the pump, valves, pressure, or flow rate. Accordingly, the validation addressed the integration and functional behavior of the supervisory services rather than the regulatory-control performance of the reverse-osmosis process.
3.2. Functional and Architectural Requirements
The supervisory platform specification considered the research objective, the operational characteristics of the experimental RO system, and principles identified in the literature on distributed and open SCADA architectures [
1,
2,
5,
10,
11]. The requirements were established before implementation. To distinguish architectural verification from functional validation, the seven architectural requirements were assigned the identifiers AR1–AR7, whereas the three functional requirements were assigned FR1–FR3. The ARs constrained the allocation of responsibilities, component organization, and interfaces. They were assessed primarily by inspection of the implemented architecture. The FRs defined services whose operation could be evaluated experimentally.
Table 2 lists the ten system-level requirements and their main design implications.
AR1–AR3 and AR5–AR7 were verified by inspecting the implemented allocation of responsibilities, module interfaces, communication mechanisms, technology stack, and four-layer organization. AR4 expressed the intended extensibility of the architecture but was not experimentally evaluated by adding new tags, field devices, or supervisory modules; consequently, no quantitative scalability claim is made. FR1, FR2, and FR3 were mapped, respectively, to the historian-persistence analysis, the controlled functional scenarios, and the bidirectional-configuration tests. Operational-recovery and edge-resource tests provided complementary evidence regarding the behavior of the implemented architecture.
3.3. Supervisory Architecture and Implementation
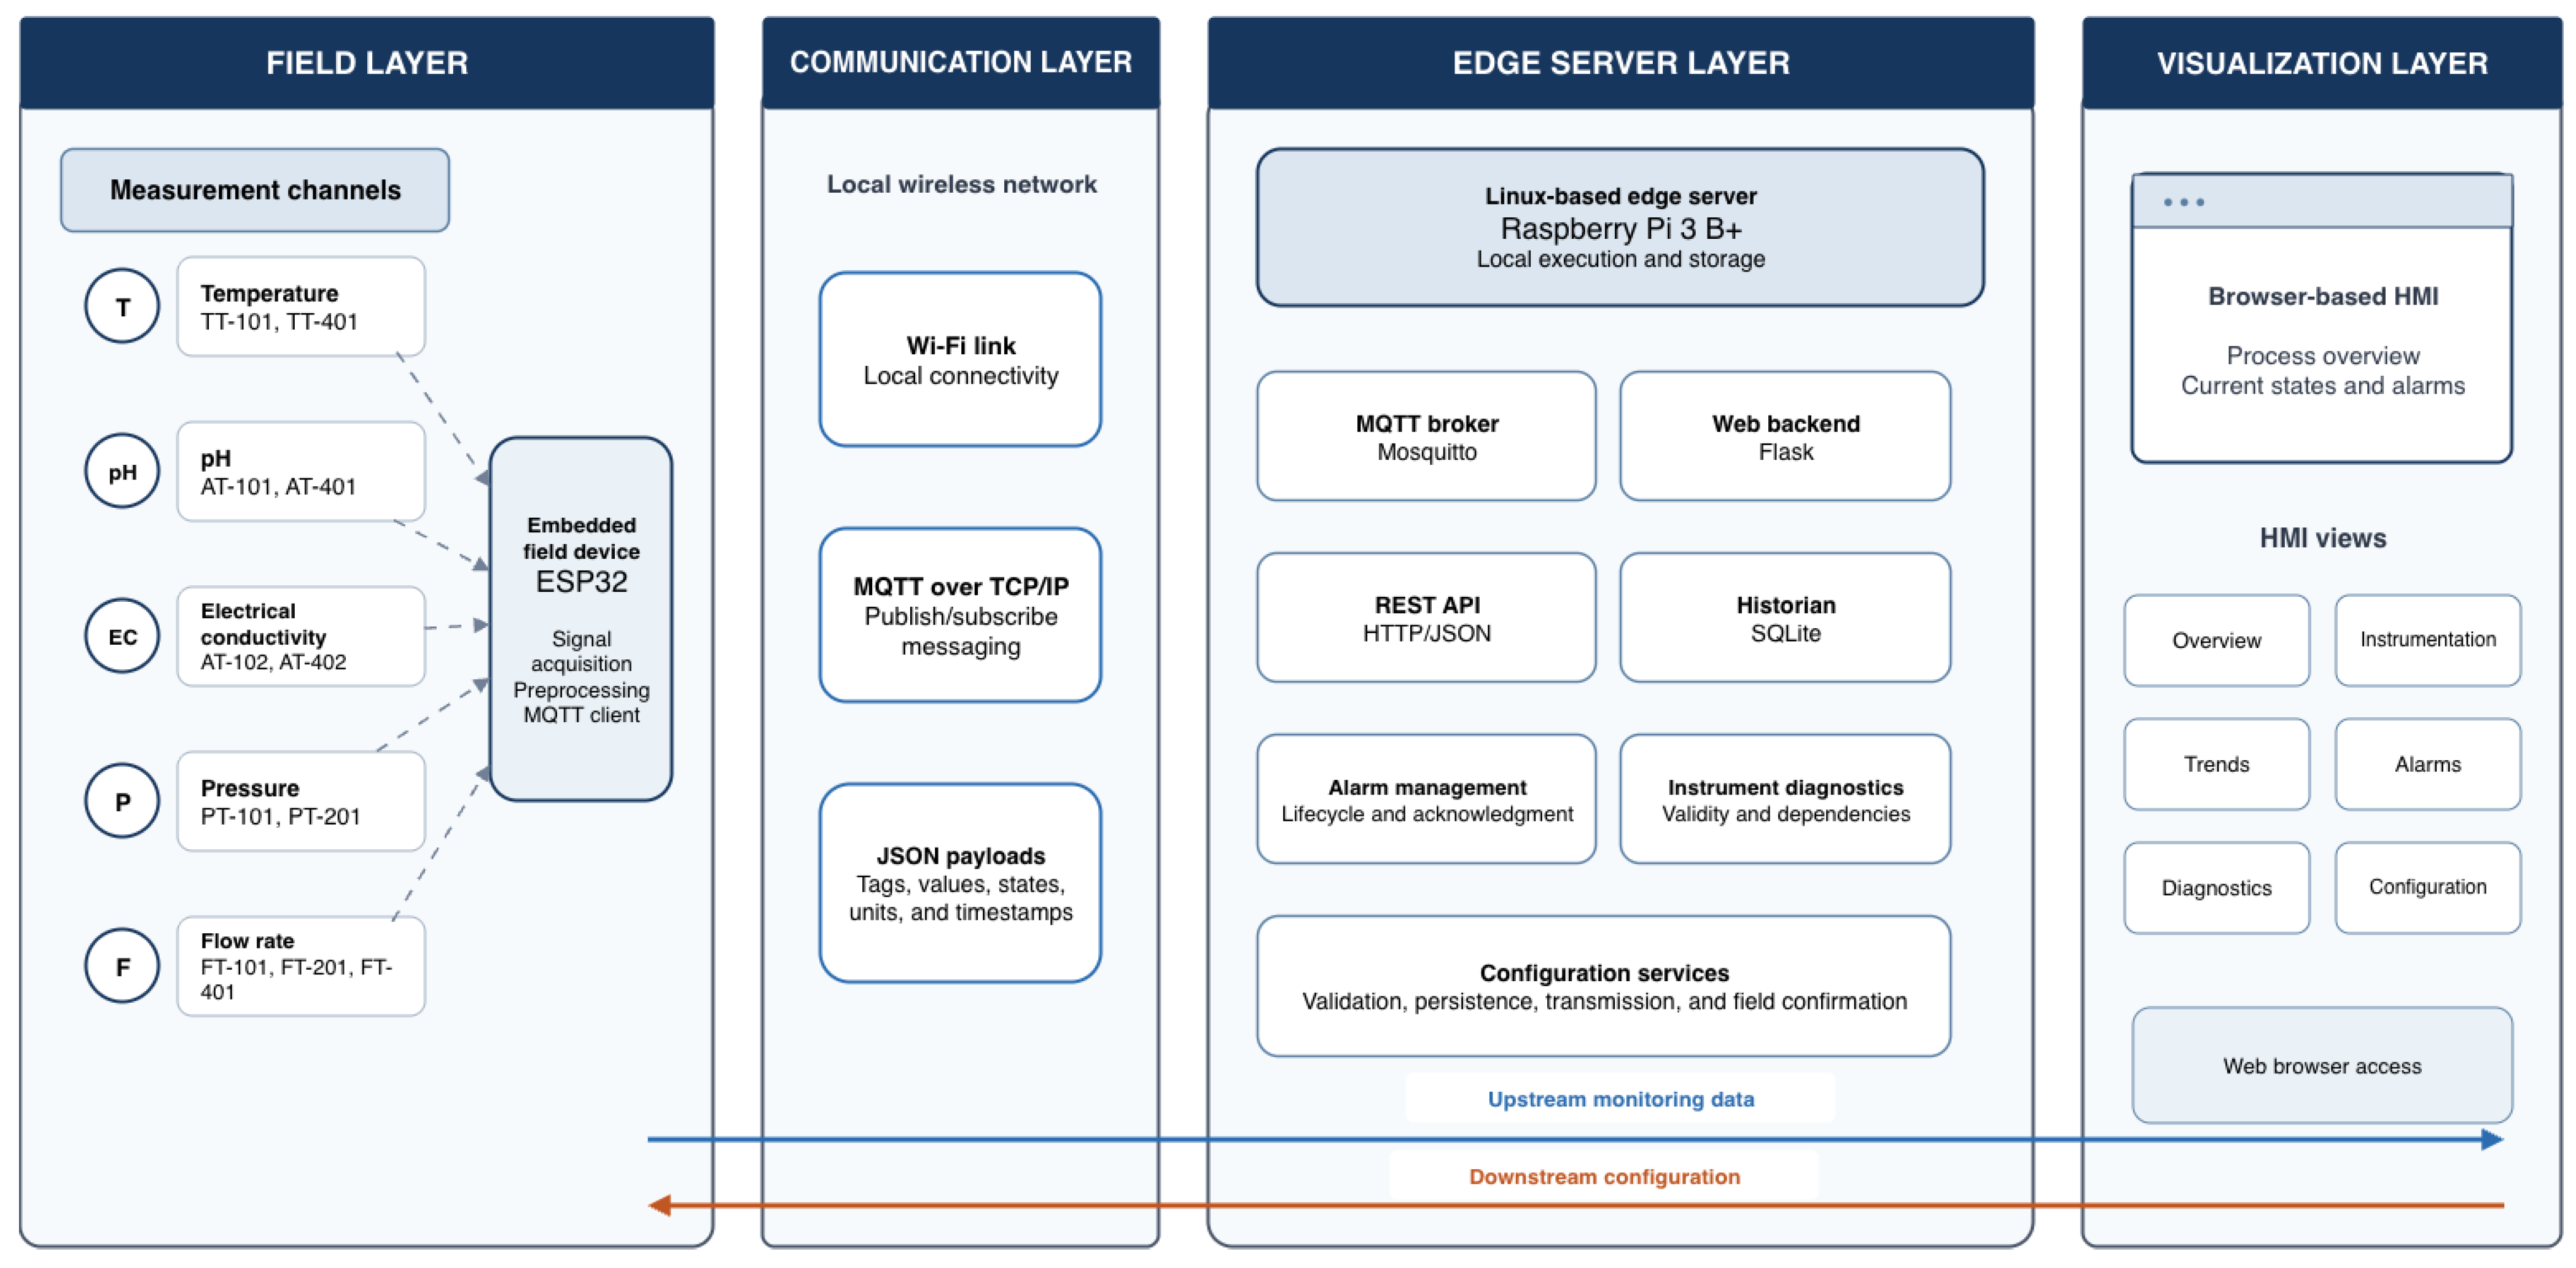
The implemented architecture was organized into four layers: field, communication, edge server, and visualization, as shown in
Figure 3. These layers delimited the allocation of computational responsibilities and the interfaces between the physical process, embedded acquisition, supervisory processing, and human–machine interaction. Process data followed the forward path from the field layer to the human–machine interface (HMI), whereas configuration commands and their acknowledgments followed the reverse path. This organization provided the implementation mechanisms for the separation between acquisition and supervision (AR1) and for the four-layer modular structure (AR7).
The field layer included the eleven measurement channels, their signal-conditioning circuits, and an ESP32 microcontroller. Pressure, pH, and electrical-conductivity signals were acquired through ADC1 analog inputs, while flow-meter pulses were processed asynchronously through digital interrupts. The temperature sensors used independent 1-Wire buses. The firmware converted the acquired signals into engineering units using the experimentally determined calibration coefficients, applied the required filtering and temperature compensation, and produced auxiliary flow-meter information, including accumulated volume and signal-failure indicators. The process variables and auxiliary states were delivered to the communication layer at a nominal publication rate of 1 Hz. Acquisition and primary signal processing remained operationally detached from the supervisory server, as specified by AR1.
The communication layer used a local Wi-Fi network and MQTT over TCP/IP. The ESP32 and the supervisory backend connected to a Mosquitto broker through the PubSubClient and Paho MQTT libraries, respectively. Each process variable was published in an individual topic under the common hierarchy planta/agua/esp32_01/sensores/. Periodic measurements were transmitted as scalar payloads using QoS 0 without broker retention, and their timestamps were assigned by the backend upon receipt. Configuration messages used JSON payloads, QoS 1, and broker retention, and were exchanged through separate set and status topics. This publish–subscribe arrangement implemented communication decoupling (AR3), while the topic hierarchy and standardized MQTT, TCP/IP, and JSON interfaces provided an architectural basis for extensibility (AR4) and supported interoperability (AR5).
The edge-server layer was deployed on a Raspberry Pi 3B+ and comprised the Mosquitto broker, a Python 3.11.2 backend implemented with Flask, and a local SQLite database. The backend was executed continuously as a systemd service and maintained a central configuration structure for the eleven tags. For each one, this structure associated the instrument description, engineering unit, MQTT topic, physical-validity criteria, operating limits, alarm criticality, functional dependencies, and participation in the determination of the global process state. This configuration served as the common source for state processing, alarm evaluation, historical persistence, diagnosis, and the REST resources consumed by the HMI.
After receiving an MQTT message, the backend identified the tag from its topic, converted the payload to the expected numerical type, assigned the reception timestamp, and updated the current measurement state. Each channel was evaluated for communication timeout, physical validity, operating range, local failure, and, where applicable, temperature dependency. The resulting supervisory states comprised NORMAL, OFFLINE, FAILURE, INVALID, HELD, HIGH, and LOW. The global process state provided additional context for this classification: range-based high and low conditions were suppressed while the RO system was stopped, whereas communication, validity, local-failure, and temperature-dependency evaluations remained active. Thus, the backend processed measurements together with their operational context rather than treating them as isolated numerical values.
Alarm management was based on transitions between consecutive supervisory states. When a new abnormal condition was detected, the previous occurrence, if present, was closed and a new alarm instance was created with its own priority, start time, and acknowledgment (ACK) state. Operator acknowledgment was received through an HTTP POST request and persisted without clearing the underlying condition. Only after a subsequent state transition was an alarm closed. SQLite operated in write-ahead logging mode (WAL) and stored sensor history, alarm occurrences, internal system states, sensor coefficients, and operational events. Measurements were persisted when a configured maximum interval elapsed, when their variation exceeded the corresponding threshold, or when their supervisory state changed. Sensor records were subject to a 90-day retention period, whereas alarm, coefficient, and system-event records were retained until operator intervention. These mechanisms implemented historical storage (FR1).
The visualization layer was implemented as a browser-based multipage HMI using HTML, CSS, and JavaScript. Overview, instrumentation, alarm, trend, diagnostic, and configuration functions were provided by the pages and their corresponding tabs. The browser accessed current values, historical data, alarms, diagnostics, and configuration resources exclusively through the Flask REST API. At no time did it connect directly to either the MQTT broker or SQLite. HTTP responses used JSON, whereas selected historical and alarm records could be exported as CSV files. Interface polling was separated from field acquisition and backend processing: current process information was updated every 2 s, alarm and trend information every 5 s, and infrastructure and configuration information every 10 s. This interface separation supported low coupling (AR2), while the aggregation of supervisory services in a single HMI implemented integrated supervision (FR2).
Remote configuration followed a complete bidirectional sequence. A parameter submitted through the HMI was first validated by the backend against its permitted domain, versioned, marked as pending, and published to the ESP32 as part of a complete set of 21 calibration coefficients. The firmware verified the presence and type of all required parameters and applied the package only when the complete validation succeeded. It then published a status message indicating success or failure, and the backend updated the persistent application state accordingly. Consequently, publication of a configuration message was not interpreted as evidence that the parameters had been applied at the field device. This confirmation mechanism implemented remote configuration (FR3). The use of Mosquitto, Python 3.11.2/Flask, SQLite, and standard web technologies provided the central supervisory functions without a proprietary SCADA runtime, supporting AR6.
3.4. Functional Validation Procedure
The validation addressed the supervisory architecture rather than the metrological performance of the individual COTS sensors. Three complementary procedures were used: architectural inspection, retrospective analysis of operational records, and controlled functional testing. This combination allowed structural properties and observable supervisory functions to be evaluated against the system-level requirements defined in
Table 2; the correspondence between validation procedures and requirements is summarized in
Table 3.
Architectural inspection examined the ESP32 firmware, MQTT clients and topics, Mosquitto configuration, supervisory backend, systemd service, SQLite schema, REST API, and HMI. The allocation of responsibilities and the interfaces between components were compared with AR1–AR7. Extensibility was assessed qualitatively by examining whether additional tags, field devices, and supervisory functions could be incorporated through the existing interfaces and configuration structures. Because no new tag or device was added specifically for this assessment, AR4 was supported by architectural inspection but was not experimentally validated.
Operational records from the eleven measurement channels, covering experimental sessions conducted from 28 May to 23 June 2026, were used to evaluate historical persistence. Because acquisition was discontinuous, a new session was defined whenever the interval between consecutive records exceeded 10 min. The analysis verified tag coverage, the presence of values, states, units, and timestamps, as well as temporal ordering, missing and duplicate records, and variable–unit consistency. Within each session, the median, 95th percentile, and maximum inter-record intervals were determined and compared with the historian configuration.
Functional validation combined four evidence layers: scripted MQTT input, REST API state, SQLite persistence, and HMI screenshots. Controlled scenarios covered normal operation, invalid values, operating-limit violations, communication loss, simultaneous thermal-dependency loss, normalization, alarm ACK, stopped-state behavior, and valid and invalid configuration changes. For each test, the initial condition, applied input, expected response, observed response, and timestamps were recorded. The six HMI pages were also examined for data updating and consistency among values, units, states, and timestamps. Alarm acknowledgment, historical retrieval and export, trends, diagnostics, and controlled parameter modification were also inspected.
The abnormal scenarios were generated as deterministic software inputs at the MQTT communication boundary. They evaluated the response of the supervisory software to defined values and loss of publications; they did not reproduce physical sensor disconnection, sensor drift, hardware degradation, hydraulic disturbances, or automatic closed-loop process control.
Operational recovery was evaluated by terminating the backend service 10 times, interrupting the Mosquitto broker 10 times, blocking ESP32 communication for 60 s in 10 repetitions, and completely restarting the Raspberry Pi three times. A recovery repetition was considered successful when the affected service or data path was restored and the applicable HTTP, MQTT, historian-progression, service-state, and SQLite integrity checks were satisfied.
Edge-resource utilization was measured at 1 s intervals during a controlled 600 s workload comprising 11 MQTT publications per second, requests to /api/dados every 2 s, requests to /api/alarmes every 5 s, and requests to /overview every 10 s. The recorded metrics included recovery time, CPU utilization, RAM utilization, backend resident set size, storage variation, HTTP and MQTT error counts, historian growth, and SQLite integrity. CPU and memory measurements were treated descriptively because no a priori capacity thresholds were defined. These complementary tests characterized implementation recovery and resource use but did not constitute additional architectural requirements.
Each requirement was classified as met when all predefined criteria and supporting evidence were obtained, partially met when only part of the criterion was demonstrated, or not demonstrated when the available evidence was insufficient. Cybersecurity assessment, formal usability testing, ergonomic evaluation, and scalability benchmarking were not considered in the validation scope.
Generative AI tools were used during manuscript preparation to assist with language revision, structural organization, drafting refinement, and consistency checks. These tools were not used to generate experimental data, execute validation tests, or calculate the reported results. All AI-assisted content was critically reviewed, technically verified, and edited by the authors.
4. Results
4.1. Integrated Operation and Historical Persistence
The historian contained 190,840 measurement records acquired from the eleven configured tags between 28 May and 23 June 2026. The interval between the first and last records was 616.6 h. However, this period included interruptions and was not interpreted as continuous RO-system operation. Using a gap greater than 10 min to delimit sessions, 60 aggregated acquisition sessions were identified. The longest session lasted 9 h 8 min 20 s and contained 25,973 records.
All configured measurement channels were represented in the retrieved data. The observed persistence intervals remained close to the historian configuration, as summarized in
Table 4. Pressure records presented a median interval of 6 s, whereas the analytical variables presented medians between 15 and 16 s. Flow-rate and temperature records presented medians between 30 and 31 s. In all groups, the 95th percentile exceeded the corresponding median by no more than 2 s. These intervals characterize the persistence behavior of the historian rather than the ESP32 publication period because storage could also be triggered by value variation or measurement-state changes.
Of the 190,840 measurement records, 119,075 (62.40%) were stored with a normal condition, 41,265 (21.62%) with an operational-limit violation, 27,910 (14.62%) as invalid, and 2590 (1.36%) as offline. Twelve records contained no numerical value, all of which were associated with the offline condition. No invalid timestamps or variable–unit inconsistencies were identified.
A total of 982 same-tag records occurred within the same one-second timestamp resolution. Among them, 941 differed in value or state and were consistent with independent persistence triggers, whereas 41 were exact duplicates, corresponding to 0.02% of the measurement dataset. The alarm history contained 11,142 records covering all eleven tags, including 90 records marked as acknowledged. No required alarm fields were missing.
4.2. Controlled Functional Validation
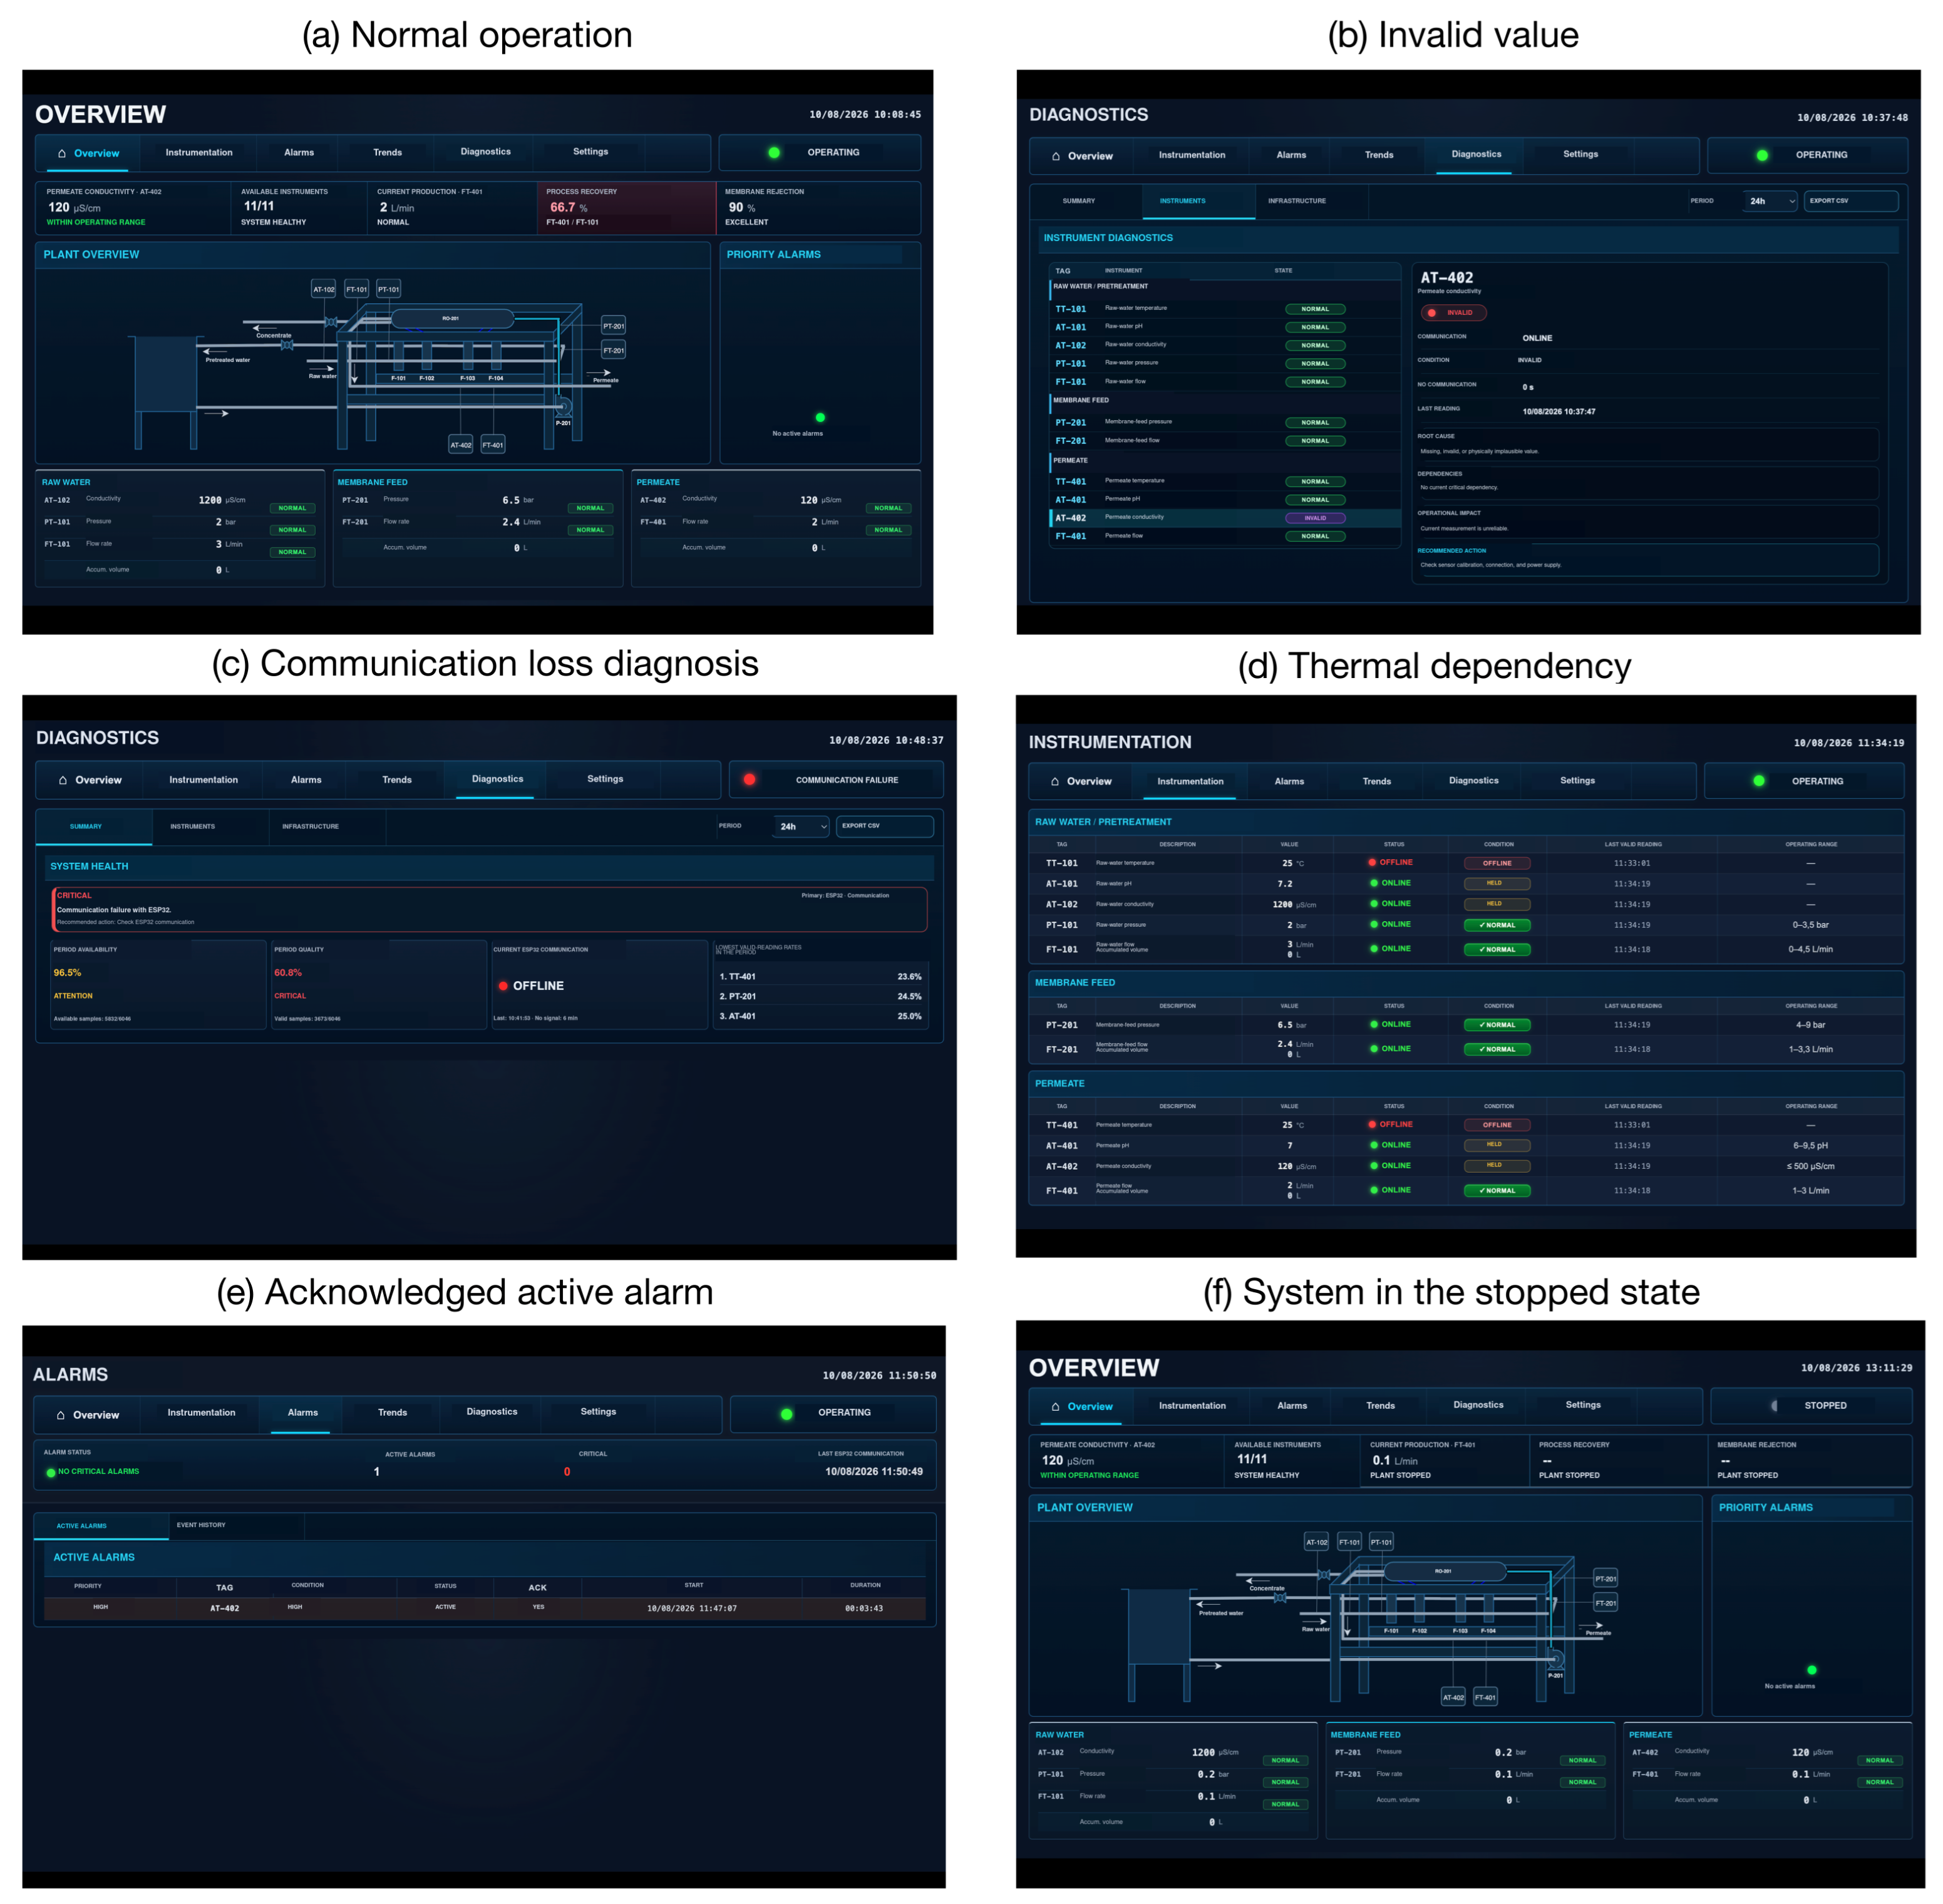
Normal-operation input produced 11/11 online and normal tags, classified the RO system as OPERATING, and produced no publication errors over 3036 MQTT messages. The controlled tests subsequently exercised invalid-value, operating-limit, communication-loss, thermal-dependency, normalization, alarm-acknowledgment, and stopped-state conditions. The verified responses comprised instrument-state assignment, alarm generation and persistence, dependency handling, diagnostic reporting, and system-state classification.
Figure 4 presents the normal-operation baseline and representative HMI responses for five of the controlled scenarios. The operating-limit and normalization tests, which are not included as figure panels, are reported in
Table 5 together with the remaining validation results.
The thermal-dependency and alarm-acknowledgment batch completed 1406 publication cycles and 14,686 MQTT messages without a publication error. During the stopped-state test, the accumulated-volume fields were neither published nor modified.
4.3. Bidirectional Configuration Validation
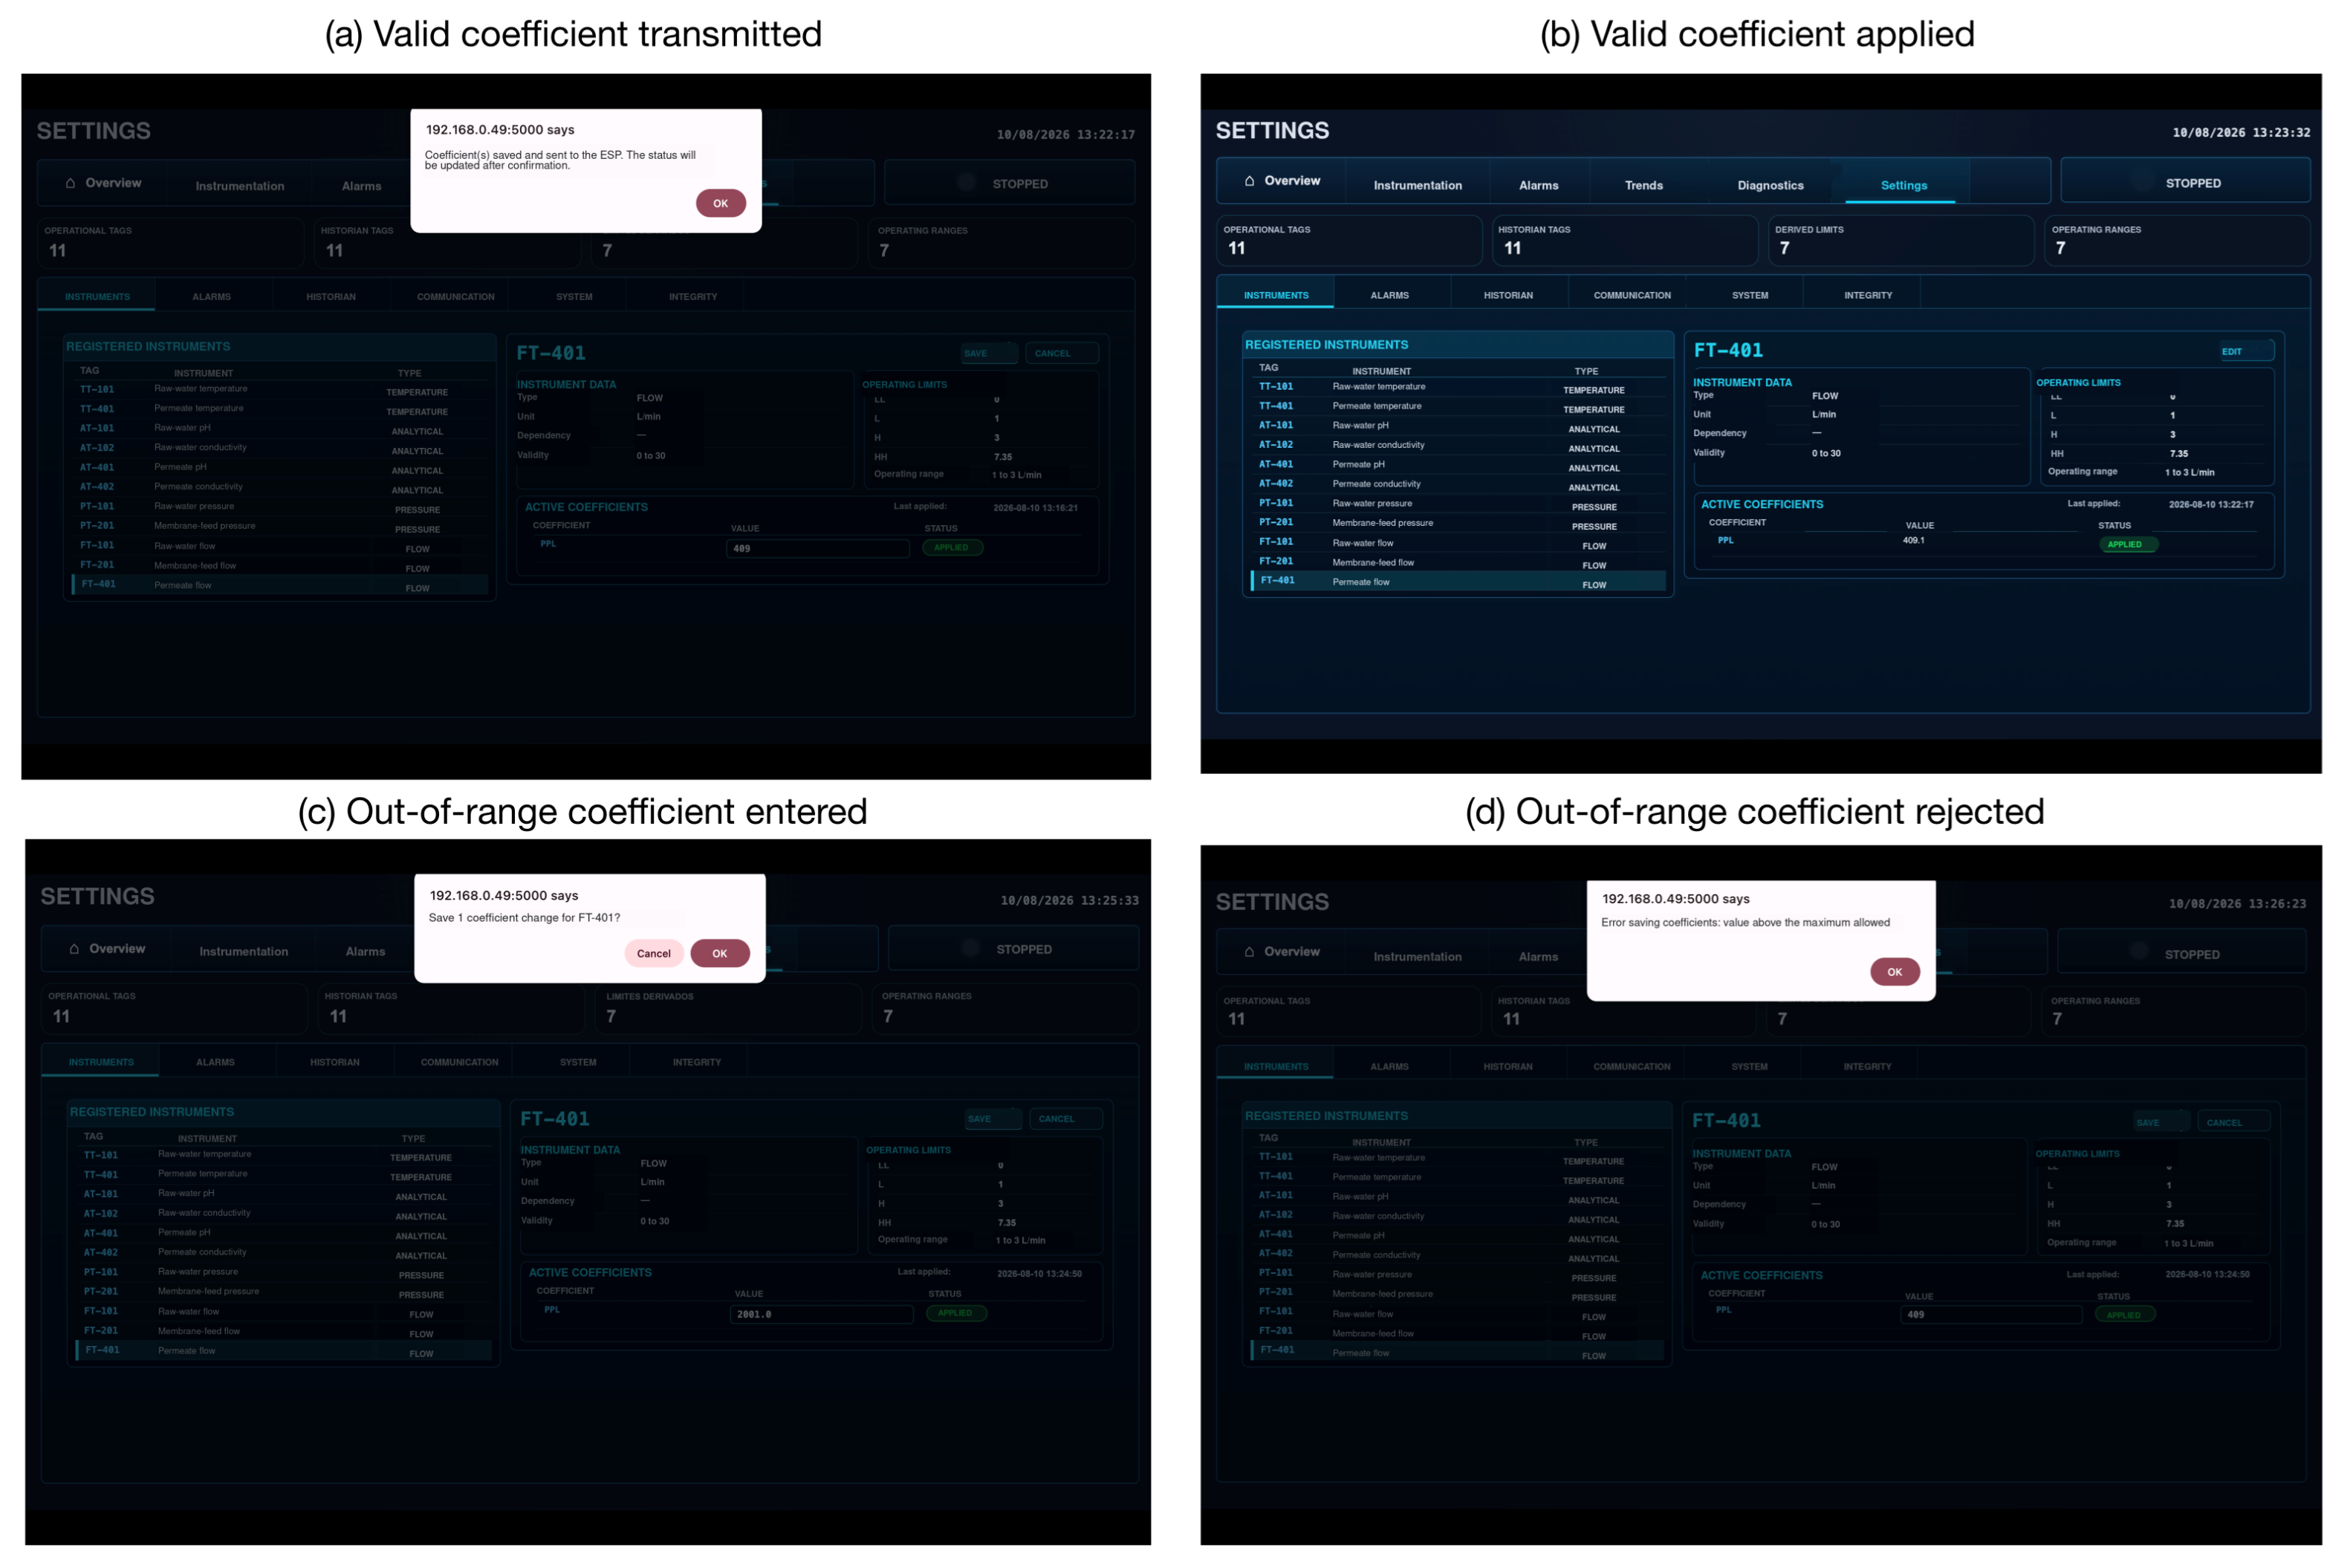
Bidirectional configuration was evaluated using the pulses-per-liter (PPL) coefficient of FT-401. The active value was changed from 409.0 to 409.1 pulses L
−1 through the HMI. After the request was validated by the backend, the updated coefficient was stored with an incremented version and the complete coefficient package was transmitted to the ESP32 via MQTT. The update remained pending until the ESP32 returned a status message confirming its application. Afterwards, the coefficient was marked as
APPLIED, as shown in
Figure 5a,b.
After the valid-update test, the FT-401 coefficient was restored to its initial value of 409.0 pulses L
−1, and the restoration was also confirmed by the ESP32. An out-of-range value of 2001.0 pulses L
−1 was then entered through the HMI. Because it exceeded the configured maximum of 2000.0 pulses L
−1, the update was rejected during validation and the active coefficient remained the same, as documented in
Figure 5c,d.
These results verified both the bidirectional application of valid parameters and the preservation of the active configuration when an invalid update was requested.
4.4. Operational Recovery and Edge-Server Resource Utilization
Controlled interruption tests were used to characterize the recovery of the backend service, MQTT broker, ESP32 communication path, and complete edge server. All repetitions satisfied their applicable recovery criteria.
Table 6 summarizes the observed times. Broker-service recovery and restoration of the complete data path to the REST API are reported separately because they represent different stages of the supervisory communication chain. Similarly, communication-loss detection and data-flow recovery after removal of the ESP32 traffic block are presented as distinct measurements.
During the ten controlled interruptions of the ESP32–broker communication path, all eleven measurement tags were classified as OFFLINE, while the REST API and HMI remained available. The median detection time of 9.863 s was consistent with the configured 10 s communication timeout. After the traffic block was removed, measurement updates and historical persistence resumed in all repetitions, with a median recovery time of 1.517 s. Backend and broker interruptions also resulted in automatic service recovery in all ten repetitions. Following the three complete Raspberry Pi restarts, the backend and Mosquitto services were active, MQTT communication was restored, the API and HMI returned HTTP status 200, and the SQLite integrity check returned ok. The comparatively wide 40.035–111.404 s restart range is reported descriptively because only three complete restarts were performed.
During the 600 s controlled resource-utilization test, 600 system samples were collected while 6600 MQTT messages and 480 HTTP requests were processed. No MQTT or HTTP errors were recorded. The historian increased by 471 records, and the SQLite integrity check returned ok. Mean, 95th-percentile, and maximum system CPU utilization were 8.425%, 10.445%, and 27.525%, respectively. For the backend process, the corresponding CPU values were 7.055%, 10.000%, and 21.963%. Mean RAM utilization was 51.925%, with a maximum of 52.783%, whereas the backend resident set size remained between a mean of 39,867.6 KiB and a maximum of 39,976 KiB. Disk occupancy increased from 65.0085% to 65.0143%, and the total SQLite footprint increased by 12,392 bytes, attributable to the write-ahead log.
The workload was generated locally at the MQTT broker and therefore characterizes the computational behavior of the edge server under controlled supervisory load rather than the performance of the physical sensors, Wi-Fi link, or complete acquisition chain. As only one workload level was examined and no previous capacity thresholds were defined, these measurements constitute a descriptive resource assessment rather than a scalability benchmark or experimental validation of AR4.
Taken together, the historian analysis, controlled functional scenarios, and bidirectional-configuration tests provided experimental evidence for the three functional requirements defined in the methodology: historical storage (FR1), integrated supervision (FR2), and remote configuration (FR3). The recovery and resource-utilization tests supplied complementary evidence about the implemented architecture but were not treated as additional system-level requirements. No inconsistencies were observed across the REST API, SQLite, alarm, diagnostic, and HMI evidence in the controlled scenarios in which these layers were jointly evaluated.
5. Discussion
The results demonstrate that an open edge-based supervisory architecture can integrate a set of functions commonly associated with SCADA platforms. The evidence obtained supports the three functional requirements: historical storage (FR1), integrated supervision (FR2), and remote configuration (FR3). AR1–AR3 and AR5–AR7 were supported primarily by inspection of the implemented allocation of responsibilities, interfaces, communication mechanisms, and layer organization. AR4 was supported only as an intended architectural property and was not experimentally validated through the addition of new tags, field devices, or supervisory modules.
The historian results indicate that the implemented persistence mechanism preserved the information required to reconstruct the monitored conditions. All eleven tags were represented among the 190,840 retrieved records, with their values, states, units, and timestamps available for analysis. The observed inter-record intervals remained close to the configured time-trigger thresholds, although these intervals do not represent the ESP32 acquisition or MQTT publication rate because persistence could also be initiated by value variation or supervisory-state transitions. The 41 exact duplicates represented only 0.02% of the dataset and did not compromise tag coverage or temporal analysis. Nevertheless, their presence shows that simultaneous persistence triggers can generate redundant records. These duplicates could be addressed by transaction-level deduplication if stricter storage efficiency were required.
The distribution of historical states should not be interpreted as an estimate of the normal availability or performance of the RO system. The dataset included records from interrupted experimental sessions and deliberately imposed abnormal conditions. In particular, the proportions of invalid, offline, and operating-limit records partly reflect the validation procedures themselves. The relevant result is therefore the preservation of the state associated with each measurement rather than the relative frequency of each one. This treatment is consistent with the view that industrial data quality depends on contextual information, traceability, and lifecycle management and cannot be inferred from numerical availability alone [
22,
31].
The controlled scenarios demonstrated that the architecture preserved the distinction between communication availability, physical validity, operating range, thermal dependency, and global system state. These distinctions prevented unavailable or physically invalid measurements from being represented as valid process values. They also allowed range-based alarms to be suppressed when the RO system was stopped while communication, validity, and dependency diagnoses remained active. This behavior is consistent with lifecycle-based alarm management, in which the originating condition, operator acknowledgment, and return to normal are treated as distinct elements [
21,
32]. Alarm acknowledgment was persisted without removing the underlying cause, and the alarm occurrence was closed only after its normalization. This separation between condition, acknowledgment, and closure is operationally relevant because an operator action does not imply that the originating condition has ceased. This behavior provided information that may support operator situational awareness in a dynamic process [
33].
Bidirectional configuration provided an additional form of cross-layer traceability. A coefficient was classified as APPLIED only after the ESP32 confirmed application of the transmitted package. Therefore, successful validation and MQTT publication by the backend were not treated as sufficient evidence of execution at the field device. Conversely, the out-of-range coefficient was rejected before transmission, and the active value remained unchanged. This sequence distinguishes a requested configuration, a transmitted configuration, and a physically confirmed configuration, reducing the risk of inconsistencies between the supervisory database and the embedded device.
The present results complement previous open supervisory implementations by extending the validation scope beyond technological feasibility. Uddin et al. demonstrated accessible local supervision of a community RO system [
5]. Kafrashi et al. emphasized local availability and bidirectional control under intermittent Internet connectivity [
10], while Poyatos-Bakker et al. addressed modularity and interoperability in a demonstrative-scale desalination system [
11]. The additional evidence provided here concerns cross-layer coherence: measurement states, alarm occurrences, diagnostics, historical records, HMI information, and configuration acknowledgments were verified across the field, communication, edge-server, and visualization layers. This difference concerns the scope of integration and validation reported in each study and should not be interpreted as evidence of technological superiority.
The recovery tests indicate that the main services resumed operation automatically after controlled interruptions. Median recovery times were 6.384 s for the backend API, 1.312 s for restoration of the MQTT data path to the REST API, and 1.517 s for measurement updates after removal of the ESP32–broker communication block. Recovery after a complete Raspberry Pi restart exhibited greater variation, with a median of 90.604 s and an observed range of 40.035–111.404 s. All tested repetitions satisfied the applicable service, communication, persistence, and database-integrity checks. However, these results characterize recovery under controlled local conditions and should not be converted into availability or reliability estimates.
The edge-server resource measurements show that the imposed workload was processed without MQTT or HTTP errors and without database-integrity failure. System CPU utilization remained below 27.525%, backend CPU utilization remained below 21.963%, and RAM utilization had a mean of 51.925% and a maximum of 52.783%. These results indicate that the tested Raspberry Pi configuration accommodated the specific workload of 11 MQTT publications per second and 480 HTTP requests over 600 s. They do not demonstrate capacity under larger numbers of devices, higher publication rates, concurrent users, or prolonged operation. Because the workload was generated locally at the broker, it also excluded the physical sensors and Wi-Fi acquisition path. The resource test must be interpreted solely as a bounded implementation check rather than a scalability benchmark.
The principal limitations arise from the experimental scope. The architecture was evaluated on a single RO system, one edge-server configuration, and one local network. The COTS sensors were used as process-data sources and were not evaluated as reference-grade instruments; consequently, the study does not establish metrological performance or improvements in RO separation efficiency. Cybersecurity, formal operator usability, alarm rationalization with operating personnel, and ergonomic conformity were also outside the validation scope. Future work should therefore evaluate sustained operation, authenticated and encrypted communication, multiple concurrent field devices, increased tag and user loads, and the addition of new modules to provide direct experimental evidence for AR4. Formal usability studies and comparison with reference instrumentation would address limitations that cannot be resolved through software testing alone.
6. Conclusions
This study developed and functionally validated a four-layer open supervisory architecture for an experimental RO system, integrating field acquisition, MQTT-based communication, supervisory processing, historical persistence, and a browser-based HMI. Its main contribution lies in the integrated implementation and cross-layer validation of these services rather than in the isolated use of its hardware, communication protocols, or software components.
The historian contained 190,840 records covering all eleven configured tags and preserved the values, states, units, and timestamps required for historical analysis. Controlled functional scenarios (including normal operation, invalid values, operating-limit violations, communication loss, and alarm acknowledgment) demonstrated the system’s coherent responses across layers. Bidirectional configuration distinguished parameter validation, transmission, embedded application, and ESP32 confirmation.
The validation provided evidence that the functional requirements for historical storage (FR1), integrated supervision (FR2), and remote configuration (FR3) were met under the examined conditions. AR1–AR3 and AR5–AR7 were supported by inspection of the implemented architecture, including role allocation, interfaces, communication mechanisms, and the underlying technology stack. AR4, interpreted as extensibility, was supported only as an intended architectural property and was not experimentally validated through the addition of new tags, devices, or supervisory modules. Although the recovery and resource-utilization tests supplied complementary implementation evidence, they did not constitute a scalability benchmark.
The conclusions are limited to the experimental system, hardware configuration, network, controlled scenarios, and workload examined. The COTS sensors were used as process-data sources, and their metrological performance was not evaluated.
Collectively, these results support the feasibility of the proposed architecture for integrated supervision of small-scale experimental RO systems under the tested conditions. This evaluation, however, did not address cybersecurity, ergonomic conformity, or performance under increasing numbers of devices. Future work should therefore focus on these aspects to establish the architecture’s readiness and robustness for broader deployment.




 ,
,