Corrosion Screening of Greenhouse Structural Steel Pipes Using Cold Infrared Thermography

 , , ,
, , ,
Abstract
1. Introduction
2. Materials and Methods
2.1. Specimens
2.2. Experimental Equipment and Environment
2.2.1. Infrared Thermal Imaging System
2.2.2. Thermographic Parameter Settings
2.2.3. Cooling-Stimulus Source
2.2.4. Experimental Conditions
2.3. Cold Infrared Thermography Measurement
2.3.1. Definition of Regions of Interest (ROIs)
2.3.2. Cooling-Stimulus Duration
2.3.3. Infrared Imaging and Data Acquisition
2.4. Thermal-Response Indicator Extraction and Statistical Analysis
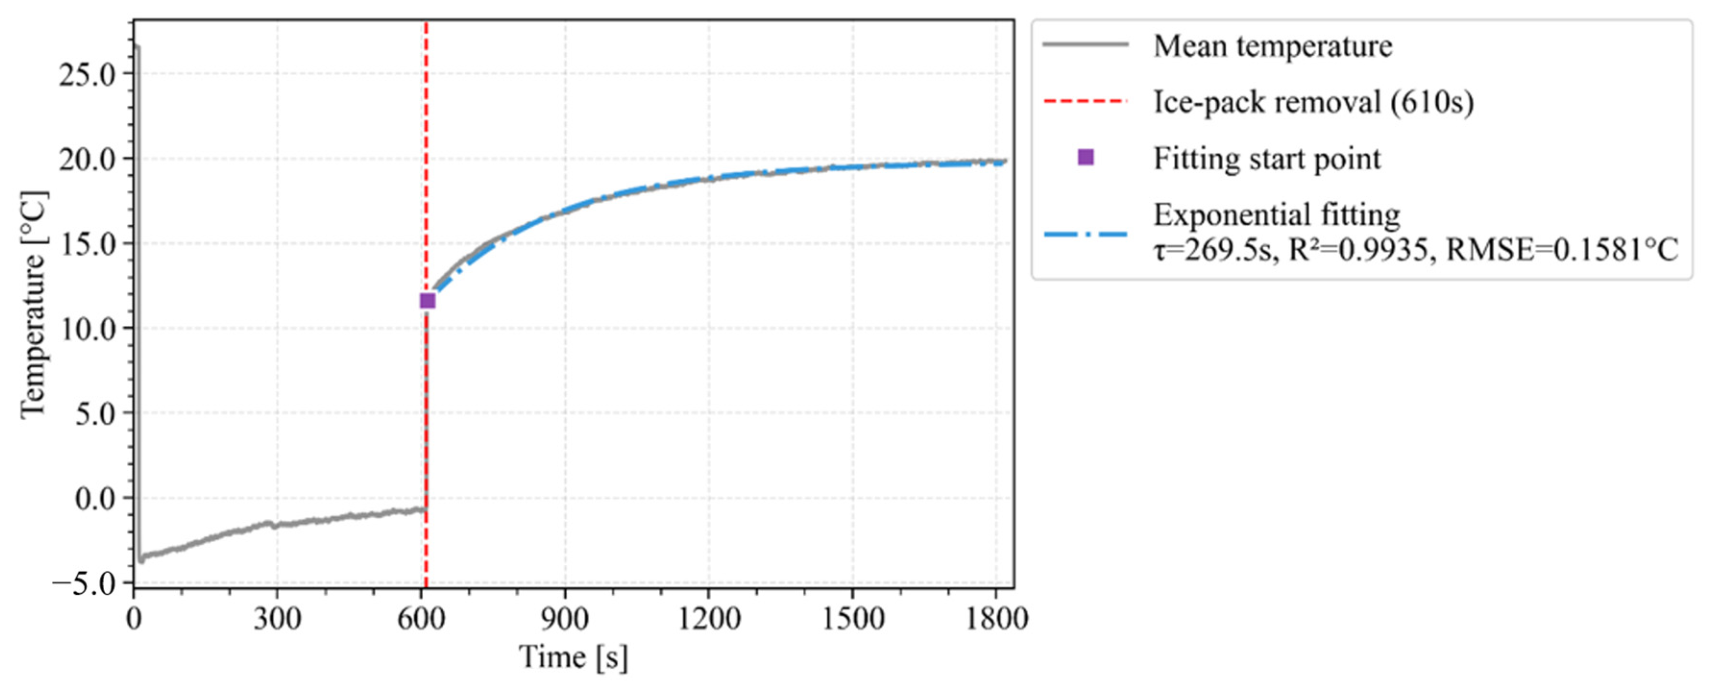
2.4.1. Estimation of the Recovery Time Constant τ in the Direct Cooling Region
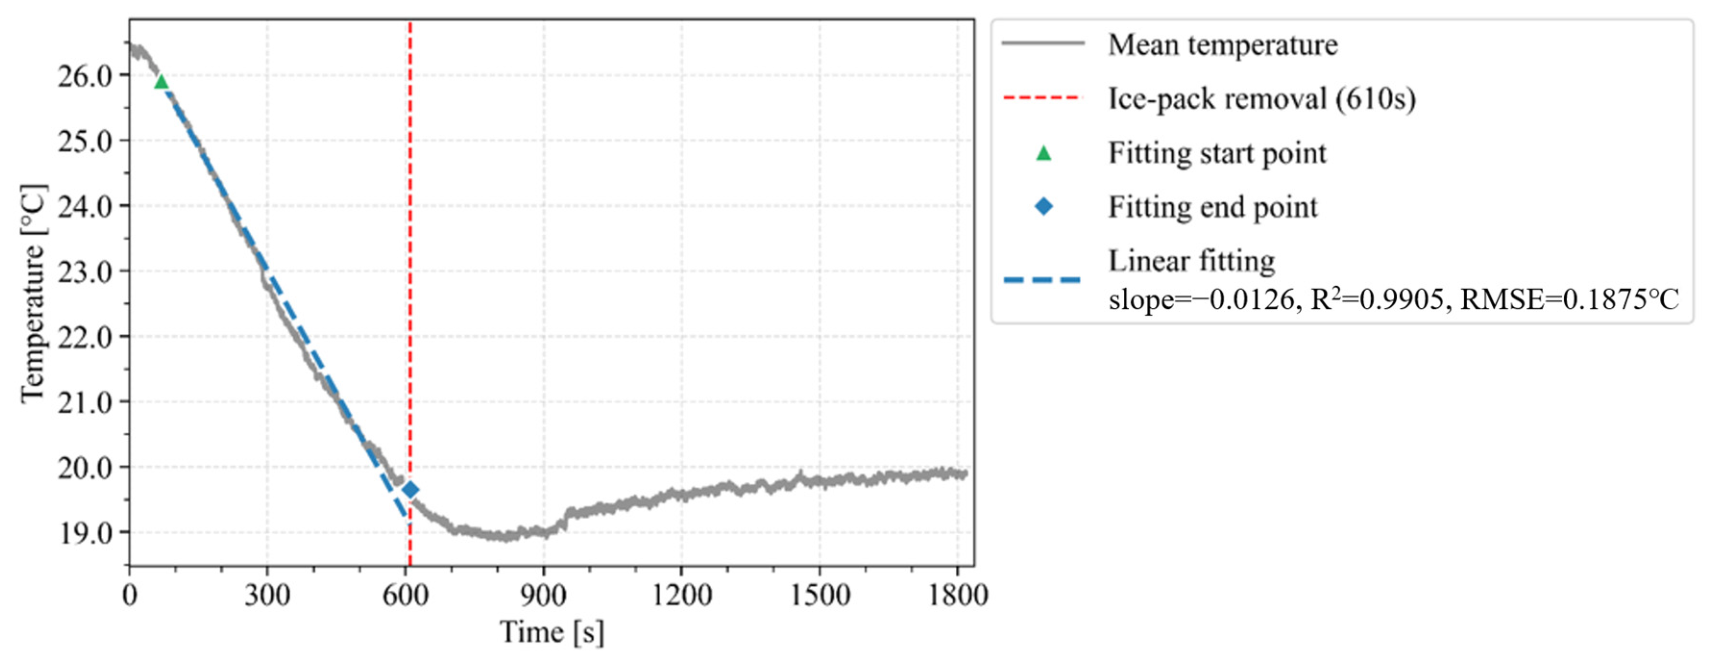
2.4.2. Calculation of the Linearity Indices (R2 and RMSE) for the Cooling Phase in the Indirect Cooling Region
2.4.3. Statistical Analysis
3. Results and Discussion
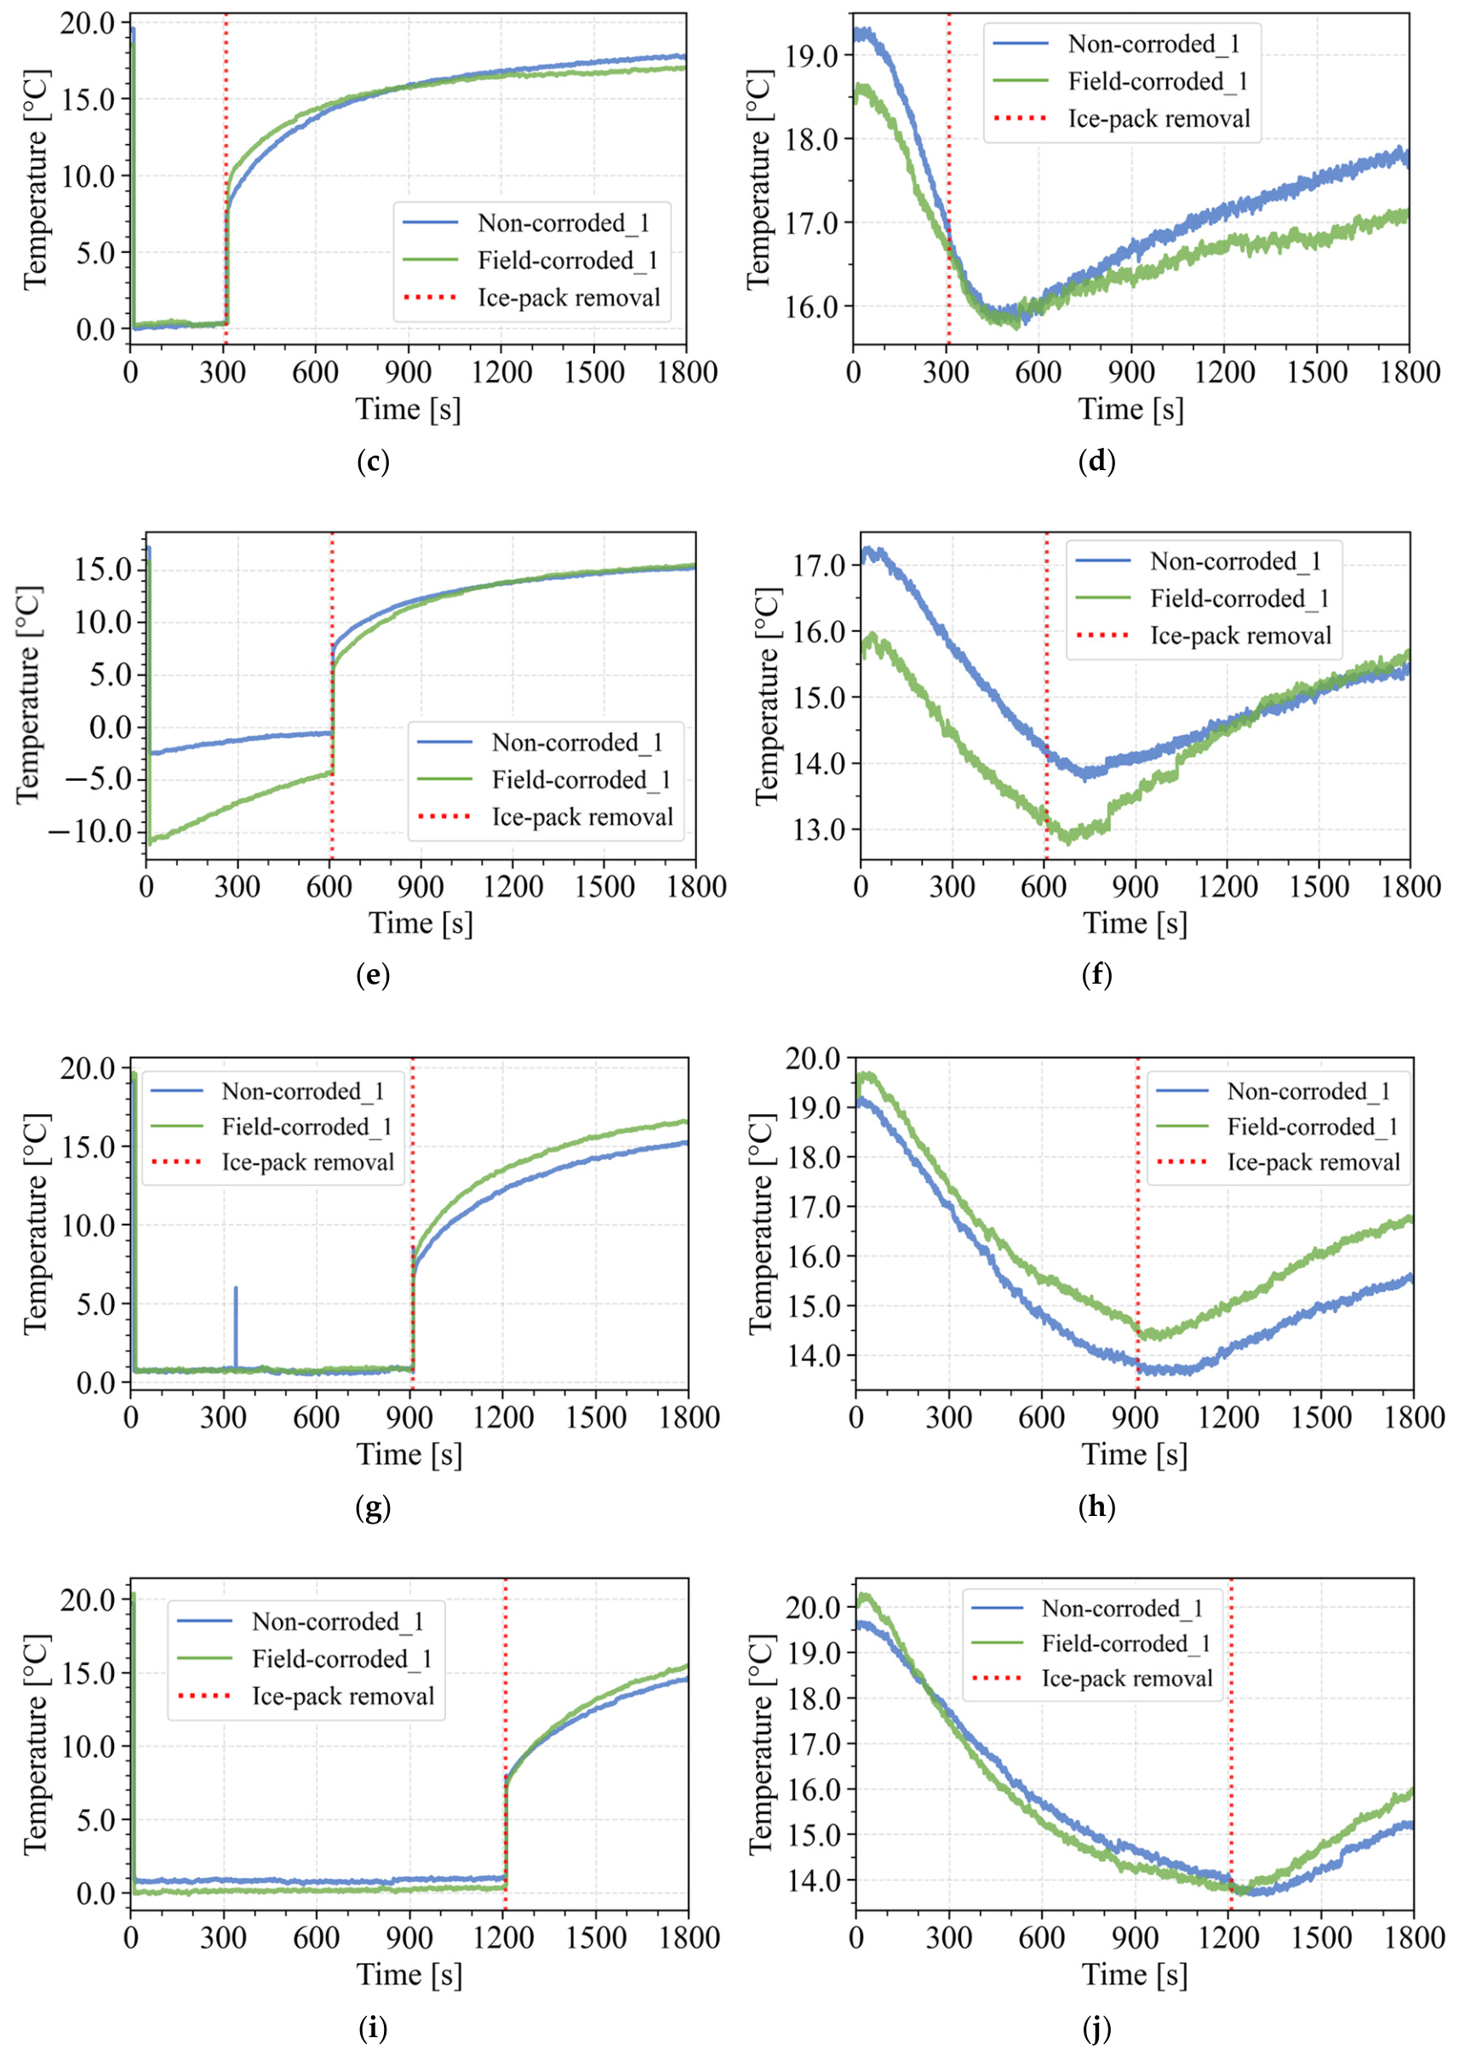
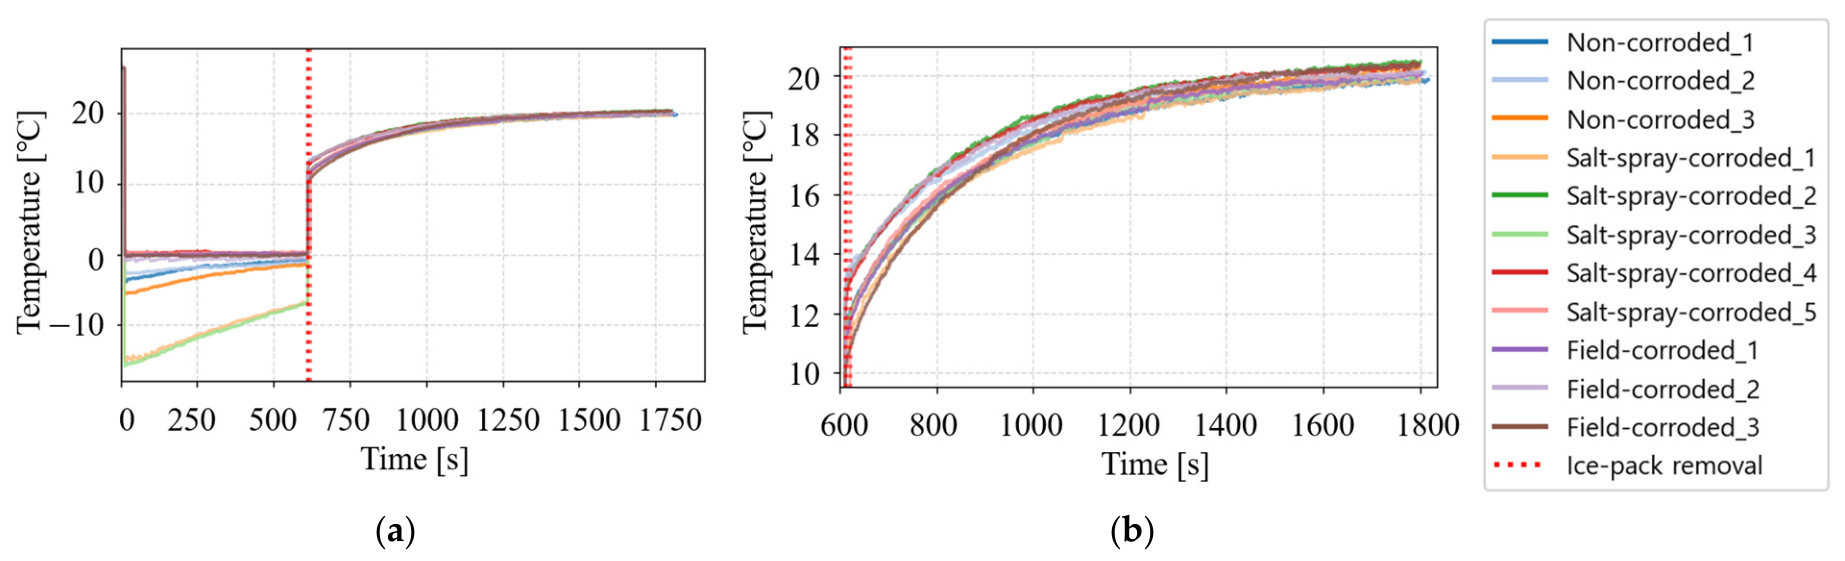
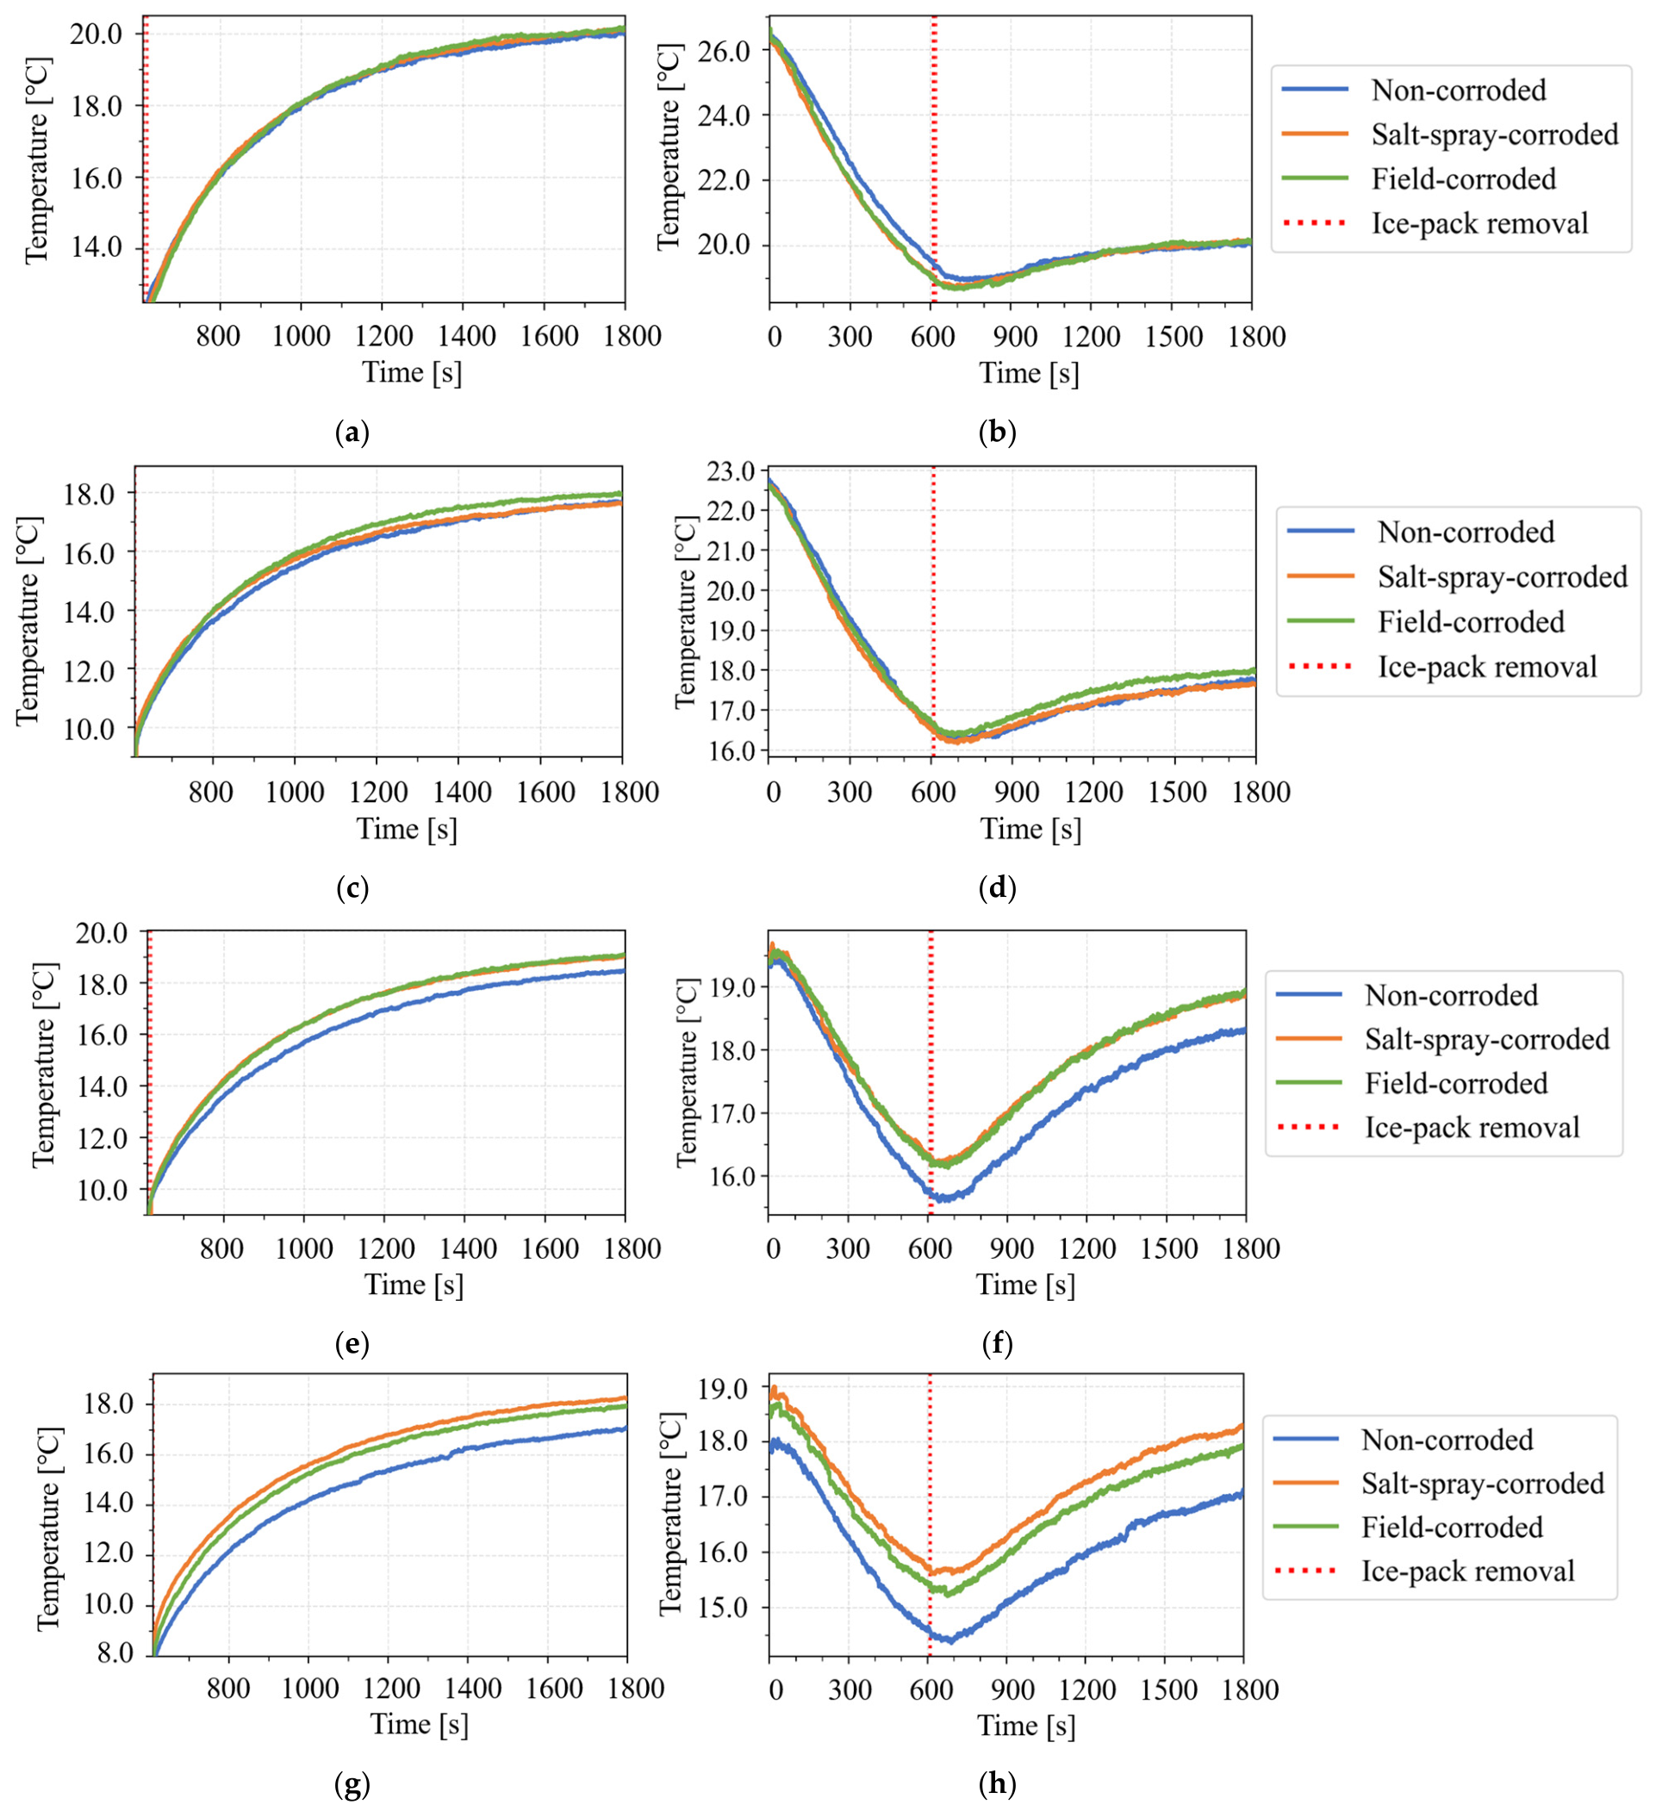
3.1. Qualitative Evaluation of Mean Surface-Temperature Trajectories
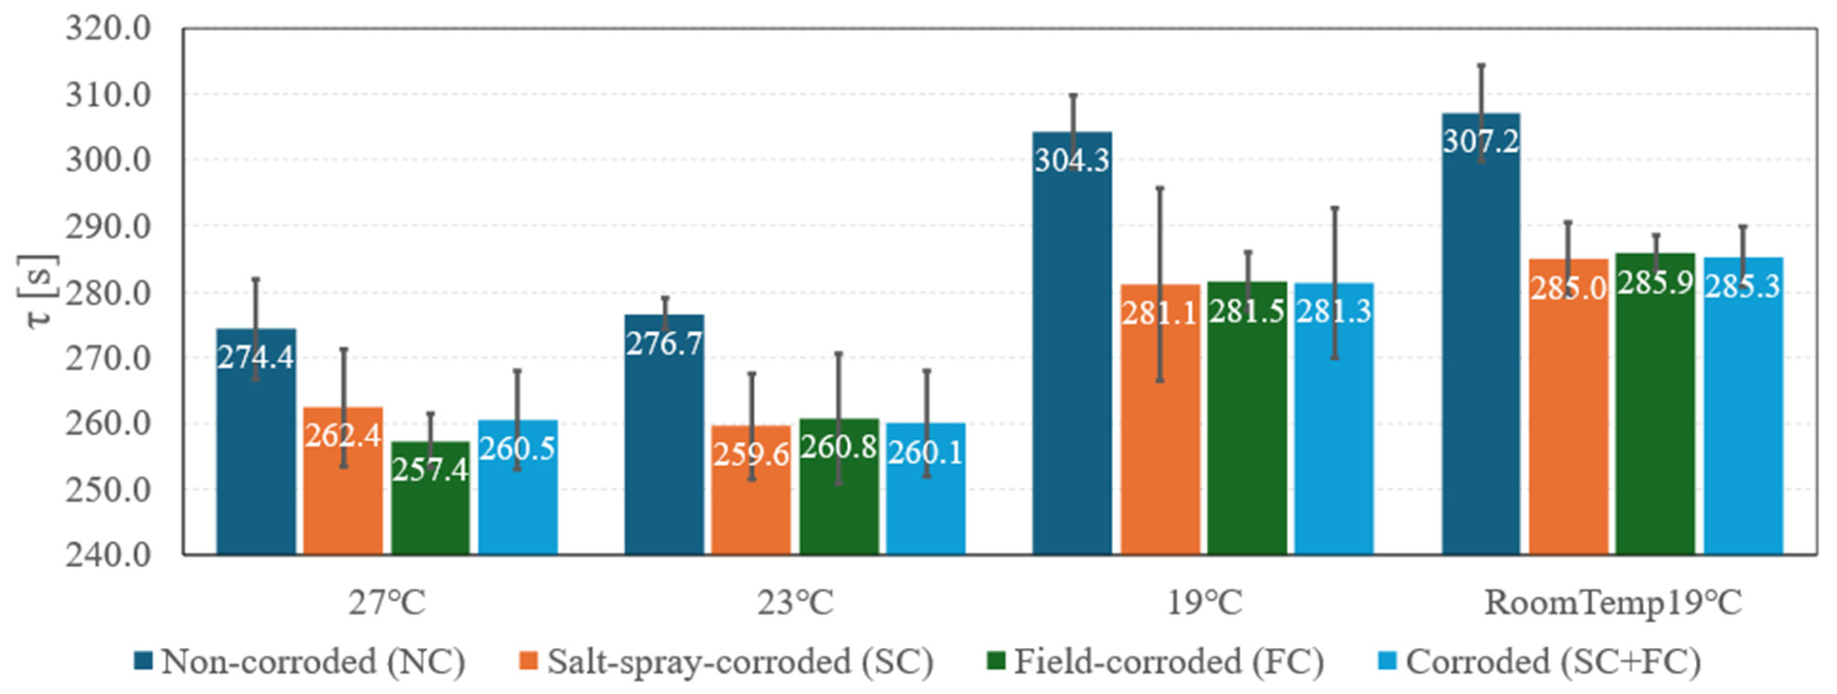
3.2. Recovery Time Constant τ in the Direct Cooling Region
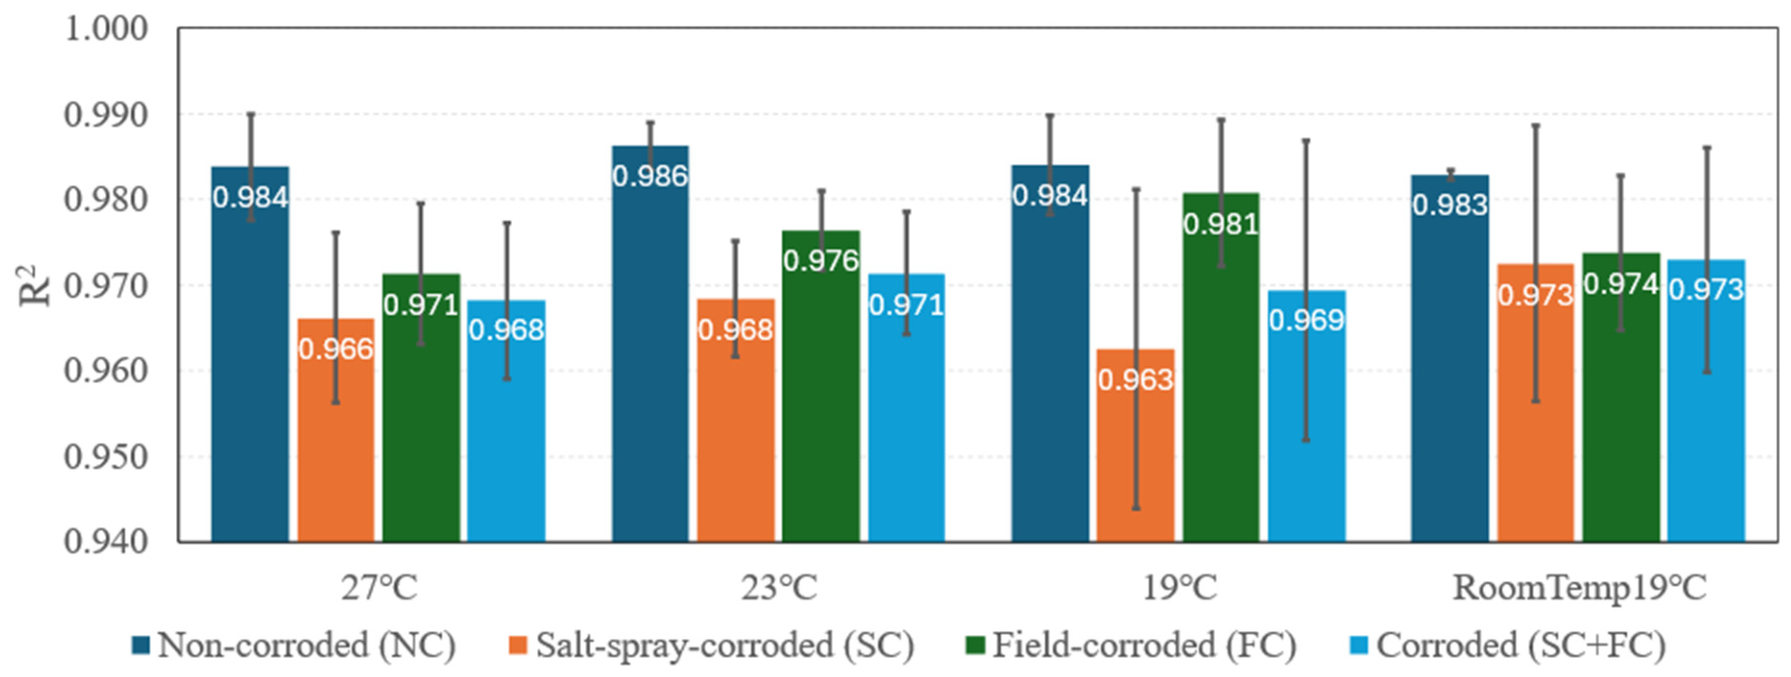
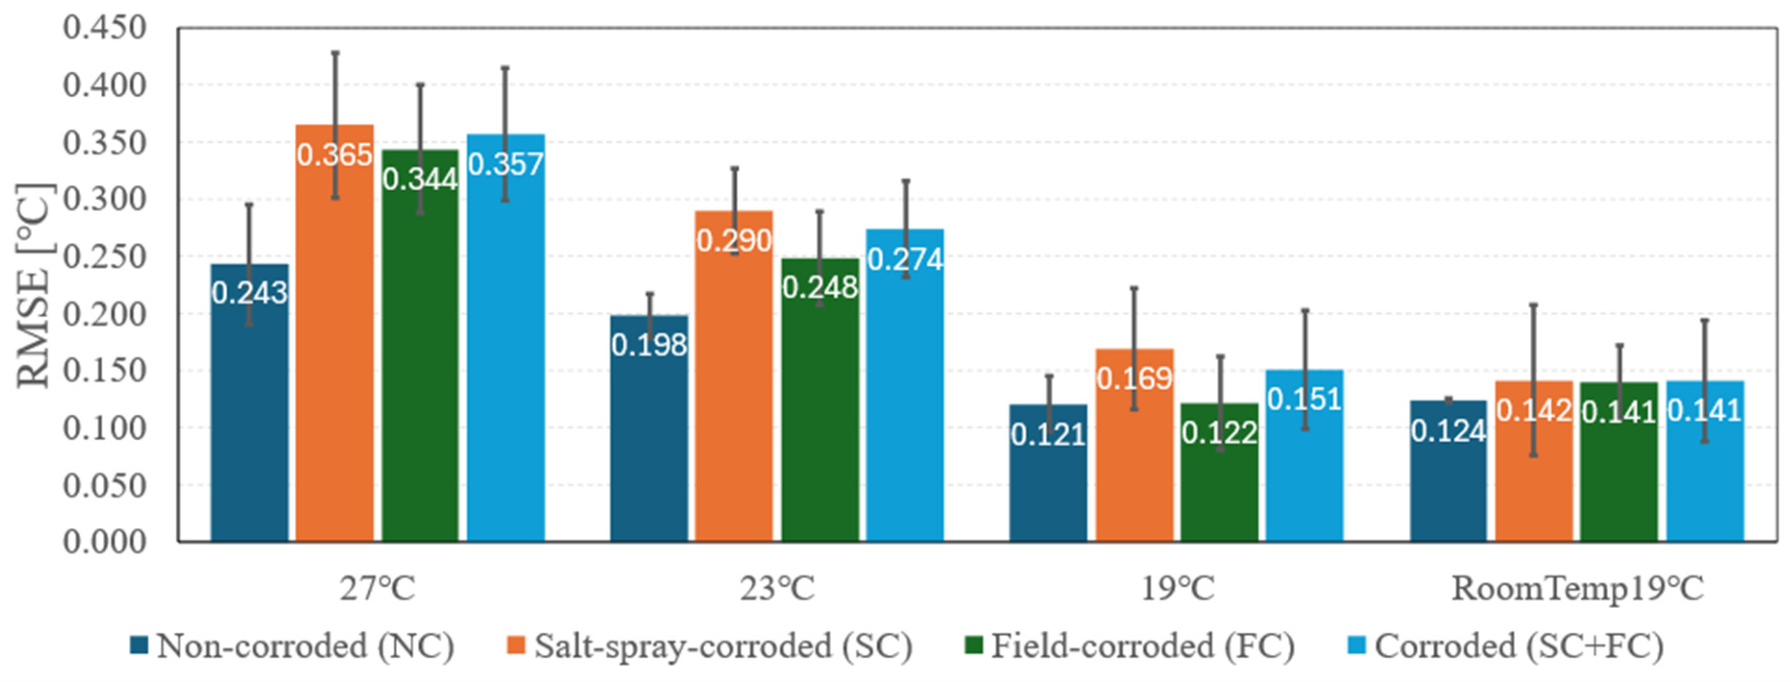
3.3. Linearity Indices (R2 and RMSE) for the Cooling Phase in the Indirect Cooling Region
3.4. Statistical Comparison of Thermal-Response Indicators
4. Conclusions
4.1. Design of the Cold Infrared Thermography Method
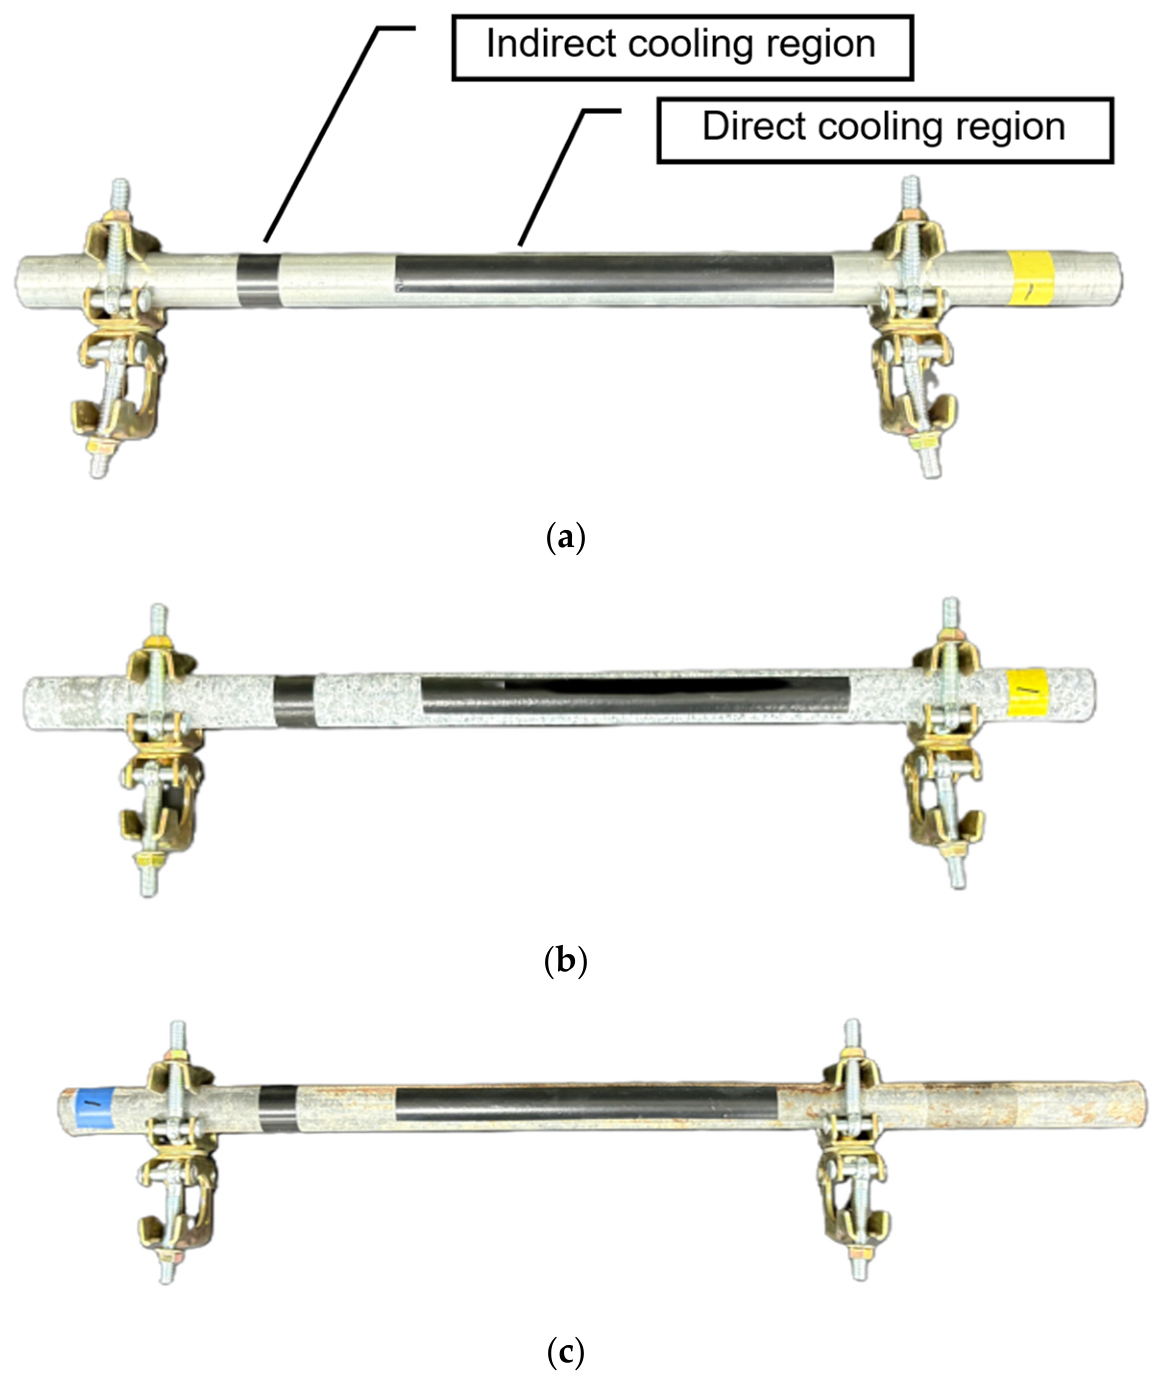
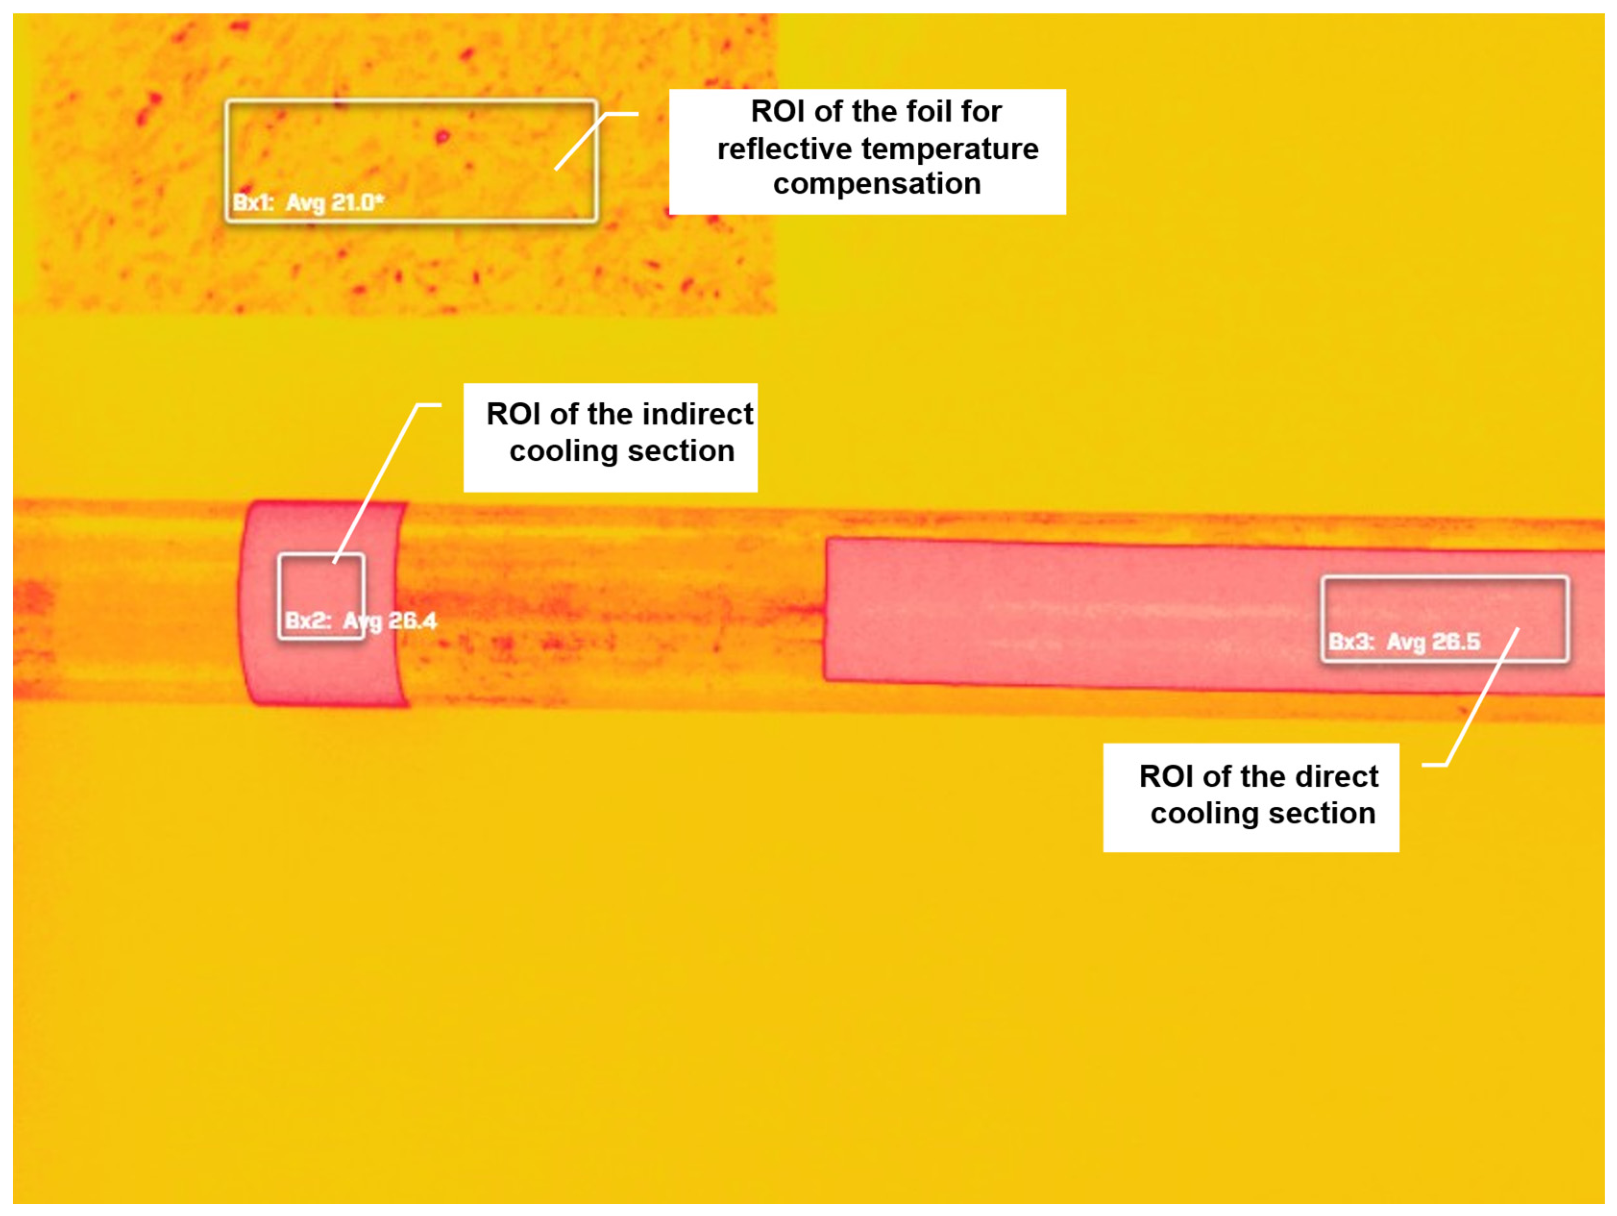
- A high-emissivity reference surface should be used to reduce emissivity-related error on metallic surfaces. In this study, high-emissivity insulation tape was applied to each specimen ROI to equalize emissivity.
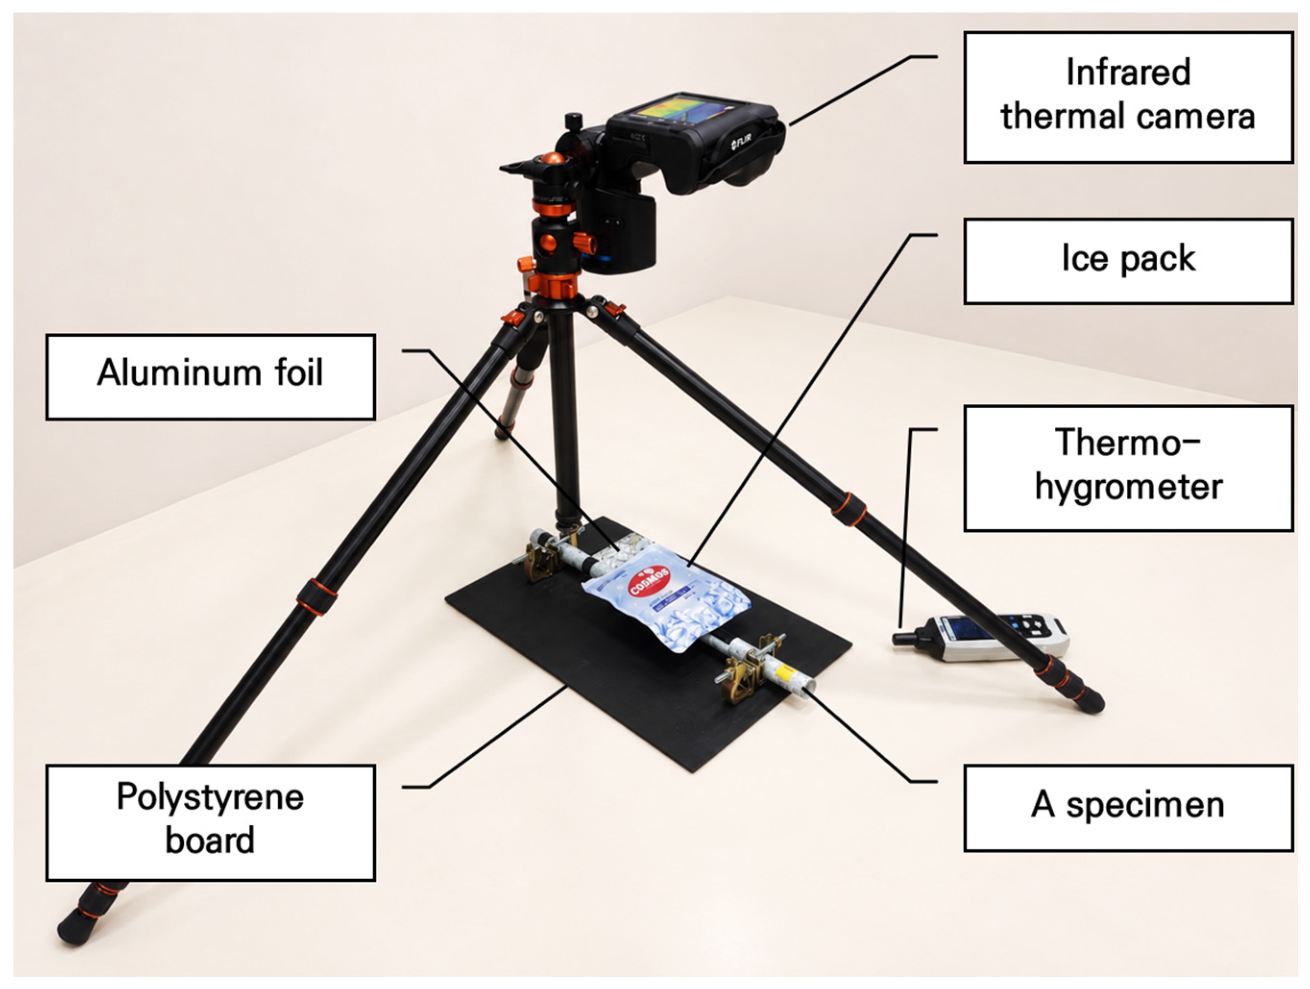
- A specimen fixture should be selected to minimize temperature disturbance caused by external contact.
- The cooling-source material and surface treatment should be selected to minimize condensation, and appropriate handling and storage procedures should be established.
- The total acquisition time and cooling-stimulus duration should be selected by considering both the need to capture stable cooling and recovery phases and the practical constraints of field measurement.
4.2. Thermal-Response Indicators for Corrosion Screening
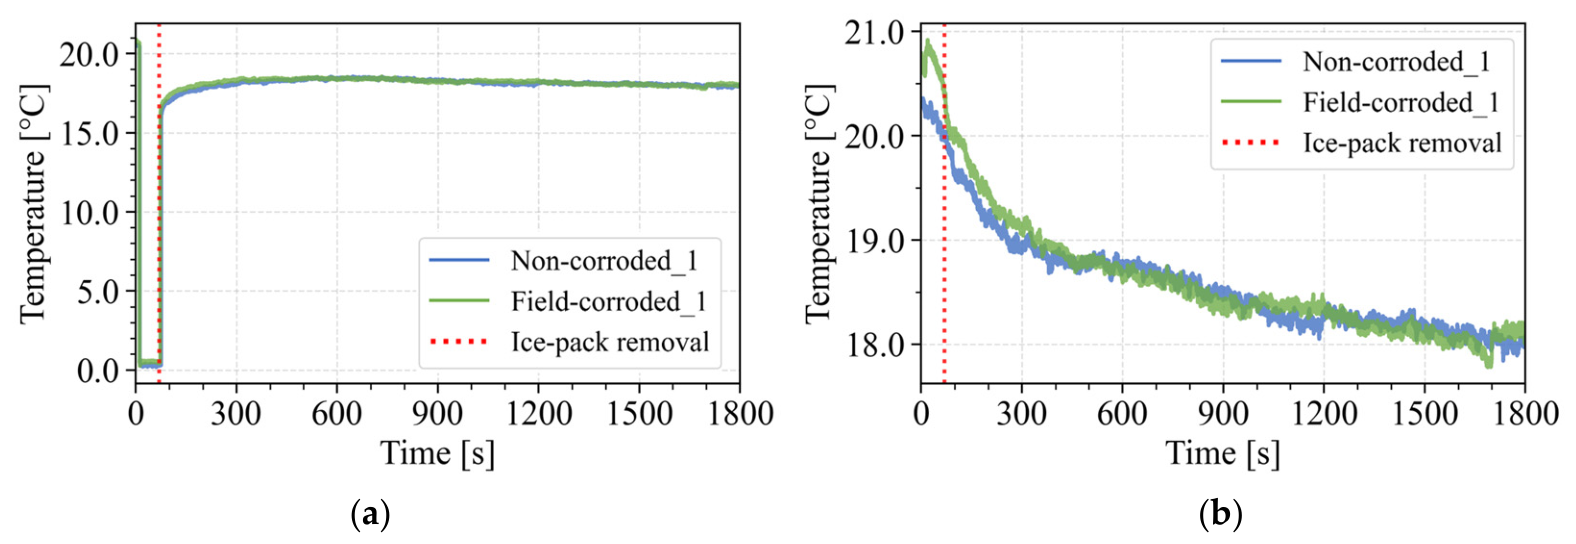
- The recovery-phase time constant τ in the direct cooling region was larger in the NC group than in the corroded group, indicating that corroded specimens recovered more rapidly. After applying the Holm procedure across all 48 comparisons, the group difference remained statistically significant only under the 23 °C condition.
- The indirect-region linearity indices showed condition-dependent directional differences between the NC and combined corroded groups. The direction of the R2 difference was consistent across the tested interval-selection criteria, but its statistical strength depended on the interval definition. None of the R2 or RMSE comparisons remained statistically significant after applying the Holm procedure; these indices were therefore regarded as exploratory and procedure-dependent indicators requiring further validation.
- Discrimination among the detailed specimen groups, other than the comparison between the NC and combined corroded groups, was limited at the present sample size.
4.3. Limitations and Future Work
Author Contributions
Funding
Informed Consent Statement
Data Availability Statement
Acknowledgments
Conflicts of Interest
Abbreviations
| RMSE | Root mean square error |
| NC | Non-corroded |
| SC | Salt-spray-corroded |
| FC | Field-corroded |
| IRT | Infrared thermography |
| ROI | Region of interest |
| RH | Relative humidity |
| CSQ | Compressed Sequence |
| DRR | Dynamic reference reconstruction |
| DTW | Dynamic time warping |
| PCM | Phase-change material |
| SD | Standard deviation |
References
- Maraveas, C. Durability Issues and Corrosion of Structural Materials and Systems in Farm Environment. Appl. Sci. 2020, 10, 990. [Google Scholar] [CrossRef] [Scilit]
- Wei, H.; Tang, Y.; Liu, Y.-P.; Chan, S.-L. Research on durability and mechanical properties of high strength steel in corrosive environment: A review. Structures 2025, 78, 109324. [Google Scholar] [CrossRef] [Scilit]
- Yun, S.W.; Choi, M.K.; Lee, S.Y.; Moon, S.D.; Yoon, Y.C. Corrosion Rate of Structural Pipes for Greenhouse. J. Bio-Environ. Control 2015, 24, 333–340. [Google Scholar] [CrossRef] [Scilit]
- Morgan, J.; Rubaiyat, A.; Judd, K.; Thai, D.; Tagert, J.; Rohde, G. Corrosion detection from IR thermal images in signed cumulative distribution transform domain. NDT E Int. 2025, 154, 103390. [Google Scholar] [CrossRef] [Scilit]
- Wicker, M.; Alduse, B.; Jung, S. Detection of hidden corrosion in metal roofing shingles utilizing infrared thermography. J. Build. Eng. 2018, 20, 201–207. [Google Scholar] [CrossRef] [Scilit]
- Nam, S.W.; Ryu, H.R.; Choi, M.K.; Shin, H.H. Corrosion and Strength Changes of Agricultural Steel Pipes Elapsed 20 Years under the Greenhouse Environment. J. Bio-Environ. Control 2020, 29, 196–201. [Google Scholar] [CrossRef] [Scilit]
- Zou, Z.; Li, W.; Li, Q.; Jia, S.; Zhou, Y. Machine Learning-Assisted Early-Corrosion Detection System for Pipeline Coatings. IEEE Sens. J. 2025, 25, 23460–23470. [Google Scholar] [CrossRef] [Scilit]
- Egodawela, S.; Gostar, A.; Buddika, H.; Harischandra, W.; Dhammika, A.; Mahmoodian, M. Metal loss defect detection and depth estimation using multi-spectral image analysis of cooling excited steel specimen with corrosion. Sci. Rep. 2025, 15, 23894. [Google Scholar] [CrossRef] [Scilit] [PubMed]
- Vasagar, V.; Hassan, M.K.; Abdullah, A.M.; Karre, A.V.; Chen, B.; Kim, K.; Al-Qahtani, N.; Cai, T. Non-destructive techniques for corrosion detection: A review. Corros. Eng. Sci. Technol. 2024, 59, 56–85. [Google Scholar] [CrossRef] [Scilit]
- Usamentiaga, R.; Venegas, P.; Guerediaga, J.; Vega, L.; Molleda, J.; Bulnes, F.G. Infrared Thermography for Temperature Measurement and Non-Destructive Testing. Sensors 2014, 14, 12305–12348. [Google Scholar] [CrossRef] [Scilit] [PubMed]
- Doshvarpassand, S.; Wu, C.; Wang, X. An overview of corrosion defect characterization using active infrared thermography. Infrared Phys. Technol. 2019, 96, 366–389. [Google Scholar] [CrossRef] [Scilit]
- Elizalde, J.; Chiou, Y. Improving the detectability and confirmation of hidden surface corrosion on metal sheets using active infrared thermography. J. Build. Eng. 2023, 66, 105931. [Google Scholar] [CrossRef] [Scilit]
- Mulaveesala, R.; Arora, V.; Rani, A. Coded thermal wave imaging technique for infrared non-destructive testing and evaluation. Nondestruct. Test. Eval. 2019, 34, 243–253. [Google Scholar] [CrossRef] [Scilit]
- Rezayiye, R.; Ibarra-Castanedo, C.; Maldague, X. Methods for Corrosion Detection in Pipes Using Thermography: A Case Study on Synthetic Datasets. Algorithms 2024, 17, 439. [Google Scholar] [CrossRef] [Scilit]
- Doshvarpassand, S.; Wang, X.; Zhao, X. Sub-surface metal loss defect detection using cold thermography and dynamic reference reconstruction (DRR). Struct. Health Monit. 2022, 21, 354–369. [Google Scholar] [CrossRef] [Scilit]
- Doshvarpassand, S.; Wang, X. Sub-Surface Defect Depth Approximation in Cold Infrared Thermography. Sensors 2022, 22, 7098. [Google Scholar] [CrossRef] [Scilit] [PubMed]
- KS D 3760; Coated Steel Pipes for Vinyl Housing. Korean Agency for Technology and Standards: Eumseong, Republic of Korea, 2023.
- KS D 9502; Neutral, Acetic Acid and Copper-Accelerated Acetic Acid Salt Spray. Korean Agency for Technology and Standards: Eumseong, Republic of Korea, 2024.
- Teledyne FLIR. Use Low-Cost Materials to Increase Target Emissivity. Available online: https://www.flir.com/discover/rd-science/use-low-cost-materials-to-increase-target-emissivity/ (accessed on 26 August 2025).
- Avdelidis, N.P.; Moropoulou, A. Emissivity considerations in building thermography. Energy Build. 2003, 35, 663–667. [Google Scholar] [CrossRef] [Scilit]
- Cheng, C.; Chen, D.; Shao, S.; Na, R.; Cai, H.; Zhou, H.; Wu, B. Revealing the Impact of Depth and Surface Property Variations on Infrared Detection of Delamination in Concrete Structures Under Natural Environmental Conditions. Buildings 2025, 15, 10. [Google Scholar] [CrossRef] [Scilit]
- Giasin, K.; Ayvar-Soberanis, S. Evaluation of Workpiece Temperature During Drilling of GLARE Fiber Metal Laminates Using Infrared Techniques: Effect of Cutting Parameters, Fiber Orientation and Spray Mist Application. Materials 2016, 9, 622. [Google Scholar] [CrossRef] [Scilit] [PubMed]
- Mahmoodzadeh, M.; Gretka, V.; Lee, I.; Mukhopadhyaya, P. Infrared thermography for quantitative thermal performance assessment of wood-framed building envelopes in Canada. Energy Build. 2022, 258, 111807. [Google Scholar] [CrossRef] [Scilit]
- Sommer, K.; Plez, B.; Cohen-Tanugi, J.; Dagoret-Campagne, S.; Moniez, M.; Neveu, J.; Betoule, M.; Bongard, S.; Feinstein, F.; Le Guillou, L.; et al. StarDICE II: Calibration of an Uncooled Infrared Thermal Camera for Atmospheric Gray Extinction Characterization. Sensors 2024, 24, 4498. [Google Scholar] [CrossRef] [Scilit] [PubMed]
- Teledyne FLIR. Reference Documentation Thermography. Available online: https://support.flir.com/DSDownload/Assets/T810442-en-US_A4.pdf (accessed on 8 August 2025).
- ISO 554:1976; Standard Atmospheres for Conditioning and/or Testing—Specifications. International Organization for Standardization: Geneva, Switzerland, 1976.
- Xu, L.; Shi, S.; Huang, Y.; Yan, F.; Wang, X.; Wilson, R.; Zhang, D. Quantification and assessment of steel pitted corrosion using optical frequency domain reflectometry (OFDR)-based distributed fiber optic sensors. Measurement 2025, 256, 118519. [Google Scholar] [CrossRef] [Scilit]



| Group | Name | Thickness (mm) | Length (mm) | Source/Fabrication | Exposure Conditions |
|---|---|---|---|---|---|
| NC 1 | NC1 | 1.5 (nominal) | 500 | Cutting of new steel pipe | (Indoor storage after cutting) |
| NC2 | |||||
| NC3 | |||||
| SC 2 | SC1 | 1.5 (nominal, before salt-spray exposure) | 500 | KS D 9502 salt spray test | 24 h |
| SC2 | 48 h | ||||
| SC3 | 72 h | ||||
| SC4 | 96 h | ||||
| SC5 | 120 h | ||||
| FC 3 | FC1 | Unknown (not measured before field exposure) | 570 | Collected from discarded greenhouse steel pipes | Natural corrosion (over 10 years) |
| FC2 | 710 | ||||
| FC3 | 640 |
| Manufacturer | Product Name | IR Resolution | Thermal Sensitivity | Accuracy | Field of View |
|---|---|---|---|---|---|
| Teledyne FLIR | T560 | 640 × 480 pixels | <40 mK | ±2 °C (±3.6 °F) or ±2% of reading | 24° × 18° |
| Manufacturer | Product Name | Operating Temperature Range (°C) | Color | Width (mm) | Thickness (mm) |
|---|---|---|---|---|---|
| 3M Company | Scotch Super 88 | −18–105 | Black | 19 | 0.216 |
| Manufacturer | Product Name | Temperature (°C) | Relative Humidity (% RH) | ||||
|---|---|---|---|---|---|---|---|
| Range | Accuracy | Resolution | Range | Accuracy | Resolution | ||
| DOOSUNG | SH-LB-3 | 2–48 | ±0.1 | 0.01 | 25–95 | ±1.0 | 0.10 |
| Description | Environmental Conditions |
|---|---|
| 27 °C | 27 °C, 50% RH |
| 23 °C | 23 °C, 50% RH |
| 19 °C | 19 °C, 50% RH |
| RoomTemp 19 °C | 18–19 °C, 33–38% RH |
| Conditions | Comparison Group | n | Mean ± SD of τ (s) | Unadjusted Welch’s p-Value and Cohen’s d | Median [Range] of R2 | Unadjusted Exact Mann–Whitney U p-Value and Rank-Biserial Correlation (rrb) | Mean ± SD of RMSE (°C) | Unadjusted Welch’s p-Value and Cohen’s d |
|---|---|---|---|---|---|---|---|---|
| 27 °C | NC 1 vs. (SC 2 + FC 3) | 3 vs. 8 | 274.39 ± 7.58 vs. 260.55 ± 7.56 | p = 0.060, d = 1.83 | 0.983 [0.978–0.990] vs. 0.971 [0.954–0.978] | p = 0.012, rrb = 1.000 | 0.243 ± 0.053 vs. 0.357 ± 0.058 | p = 0.036, d = −2.02 |
| NC vs. SC | 3 vs. 5 | 274.39 ± 7.58 vs. 262.43 ± 8.93 | p = 0.100, d = 1.41 | 0.983 [0.978–0.990] vs. 0.970 [0.954–0.977] | p = 0.036, rrb = 1.000 | 0.243 ± 0.053 vs. 0.365 ± 0.063 | p = 0.032, d = −2.03 | |
| NC vs. FC | 3 vs. 3 | 274.39 ± 7.58 vs. 257.41 ± 4.09 | p = 0.040, d = 2.79 | 0.983 [0.978–0.990] vs. 0.974 [0.962–0.978] | p = 0.100, rrb = 1.000 | 0.243 ± 0.053 vs. 0.344 ± 0.056 | p = 0.086, d = −1.85 | |
| SC vs. FC | 5 vs. 3 | 262.43 ± 8.93 vs. 257.41 ± 4.09 | p = 0.321, d = 0.66 | 0.970 [0.954–0.977] vs. 0.974 [0.962–0.978] | p = 0.393, rrb = −0.467 | 0.365 ± 0.063 vs. 0.344 ± 0.056 | p = 0.646, d = 0.35 | |
| 23 °C | NC vs. (SC + FC) | 3 vs. 8 | 276.66 ± 2.45 vs. 260.07 ± 8.06 | p = 0.001, d = 2.31 | 0.985 [0.984–0.989] vs. 0.971 [0.959–0.981] | p = 0.012, rrb = 1.000 | 0.198 ± 0.020 vs. 0.274 ± 0.042 | p = 0.003, d = −2.01 |
| NC vs. SC | 3 vs. 5 | 276.66 ± 2.45 vs. 259.61 ± 8.02 | p = 0.007, d = 2.54 | 0.985 [0.984–0.989] vs. 0.969 [0.959–0.977] | p = 0.036, rrb = 1.000 | 0.198 ± 0.020 vs. 0.290 ± 0.037 | p = 0.004, d = −2.83 | |
| NC vs. FC | 3 vs. 3 | 276.66 ± 2.45 vs. 260.83 ± 9.85 | p = 0.100, d = 2.21 | 0.985 [0.984–0.989] vs. 0.977 [0.972–0.981] | p = 0.100, rrb = 1.000 | 0.198 ± 0.020 vs. 0.248 ± 0.041 | p = 0.154, d = −1.57 | |
| SC vs. FC | 5 vs. 3 | 259.61 ± 8.02 vs. 260.83 ± 9.85 | p = 0.097, d = −1.30 | 0.969 [0.959–0.977] vs. 0.977 [0.972–0.981] | p = 0.143, rrb = −0.733 | 0.290 ± 0.037 vs. 0.248 ± 0.041 | p = 0.220, d = 1.09 | |
| 19 °C | NC vs. (SC + FC) | 3 vs. 8 | 304.33 ± 5.49 vs. 281.25 ± 11.36 | p = 0.002, d = 2.23 | 0.986 [0.978–0.988] vs. 0.976 [0.942–0.990] | p = 0.194, rrb = 0.583 | 0.121 ± 0.024 vs. 0.151 ± 0.052 | p = 0.227, d = −0.65 |
| NC vs. SC | 3 vs. 5 | 304.33 ± 5.49 vs. 281.11 ± 14.69 | p = 0.022, d = 1.87 | 0.986 [0.978–0.988] vs. 0.955 [0.942–0.983] | p = 0.143, rrb = 0.733 | 0.121 ± 0.024 vs. 0.169 ± 0.053 | p = 0.135, d = −1.05 | |
| NC vs. FC | 3 vs. 3 | 304.33 ± 5.49 vs. 281.49 ± 4.46 | p = 0.006, d = 4.57 | 0.986 [0.978–0.988] vs. 0.976 [0.975–0.990] | p = 0.700, rrb = 0.333 | 0.121 ± 0.024 vs. 0.122 ± 0.040 | p = 0.984, d = −0.02 | |
| SC vs. FC | 5 vs. 3 | 281.11 ± 14.69 vs. 281.49 ± 4.46 | p = 0.959, d = −0.03 | 0.955 [0.942–0.983] vs. 0.976 [0.975–0.990] | p = 0.393, rrb = −0.467 | 0.169 ± 0.053 vs. 0.122 ± 0.040 | p = 0.210, d = 0.96 | |
| RoomTemp 19 °C | NC vs. (SC + FC) | 3 vs. 8 | 307.18 ± 7.29 vs. 285.30 ± 4.50 | p = 0.023, d = 4.17 | 0.983 [0.982–0.983] vs. 0.977 [0.953–0.989] | p = 0.133, rrb = 0.667 | 0.124 ± 0.002 vs. 0.141 ± 0.053 | p = 0.392, d = −0.37 |
| NC vs. SC | 3 vs. 5 | 307.18 ± 7.29 vs. 284.95 ± 5.59 | p = 0.015, d = 3.58 | 0.983 [0.982–0.983] vs. 0.981 [0.953–0.989] | p = 0.250, rrb = 0.600 | 0.124 ± 0.002 vs. 0.142 ± 0.066 | p = 0.585, d = −0.33 | |
| NC vs. FC | 3 vs. 3 | 307.18 ± 7.29 vs. 285.88 ± 2.78 | p = 0.025, d = 3.86 | 0.983 [0.982–0.983] vs. 0.973 [0.965–0.983] | p = 0.200, rrb = 0.778 | 0.124 ± 0.002 vs. 0.141 ± 0.032 | p = 0.472, d = −0.72 | |
| SC vs. FC | 5 vs. 3 | 284.95 ± 5.59 vs. 285.88 ± 2.78 | p = 0.767, d = −0.19 | 0.981 [0.953–0.989] vs. 0.973 [0.965–0.983] | p = 1.000, rrb = −0.067 | 0.142 ± 0.066 vs. 0.141 ± 0.032 | p = 0.971, d = 0.023 |
Disclaimer/Publisher’s Note: The statements, opinions and data contained in all publications are solely those of the individual author(s) and contributor(s) and not of MDPI and/or the editor(s). MDPI and/or the editor(s) disclaim responsibility for any injury to people or property resulting from any ideas, methods, instructions or products referred to in the content. |
© 2026 by the authors. Licensee MDPI, Basel, Switzerland. This article is an open access article distributed under the terms and conditions of the Creative Commons Attribution (CC BY) license.
Share and Cite
Park, J.; Lee, J.; Park, G.; Jung, E.; Yun, S.; Park, J. Corrosion Screening of Greenhouse Structural Steel Pipes Using Cold Infrared Thermography. Sensors 2026, 26, 5719. https://doi.org/10.3390/s26185719
Park J, Lee J, Park G, Jung E, Yun S, Park J. Corrosion Screening of Greenhouse Structural Steel Pipes Using Cold Infrared Thermography. Sensors. 2026; 26(18):5719. https://doi.org/10.3390/s26185719
Chicago/Turabian StylePark, Junghwa, Jaehun Lee, Gunhui Park, Eunji Jung, Sungwook Yun, and Jaesung Park. 2026. "Corrosion Screening of Greenhouse Structural Steel Pipes Using Cold Infrared Thermography" Sensors 26, no. 18: 5719. https://doi.org/10.3390/s26185719
APA StylePark, J., Lee, J., Park, G., Jung, E., Yun, S., & Park, J. (2026). Corrosion Screening of Greenhouse Structural Steel Pipes Using Cold Infrared Thermography. Sensors, 26(18), 5719. https://doi.org/10.3390/s26185719