Article

Micro-PEMS Based on OBD and MOX Sensors

by
Jordy Alexander Hernández
and
José Ignacio Huertas
*
Sustainable Energy Research Group, School of Engineering and Sciences, Tecnológico de Monterrey, Monterrey 64849, Mexico
*
Author to whom correspondence should be addressed.
Sensors 2026, 26(14), 4333; https://doi.org/10.3390/s26144333
Submission received: 21 May 2026 / Revised: 24 June 2026 / Accepted: 3 July 2026 / Published: 8 July 2026
(This article belongs to the Special Issue Sensor-Based Systems for Environmental Monitoring and Assessment)

Highlights

What are the main findings?
  • This work reports the development of a proof-of-concept µPEMS that continuously reports in real time the mass emissions of gas phase pollutants (CO, NOx) and greenhouse gases (CO2), highly correlated with the ones obtained with a 1065-compliant PEMS, when monitoring road vehicles working under normal conditions of use.
  • Metal oxide (MOX) sensors can be used for the direct measurement (without gas pre-treatment) of tailpipe air pollutants. Their cross-sensitivity problems can be resolved using a multilinear correlation with the factors influencing them. The signal drift in pollutant concentration can be mitigated by reporting cumulative mass emissions rather than emission rates.
What are the implications of the main findings?
  • The µPEMS can provide valuable data on the real vehicular emissions that could be used for improving vehicle technology and national emission inventories. It could also enable new alternatives to regulate vehicular emissions. However, additional work is required to explore the possibility of using other sensors and to evaluate the performance of the µPEMS after long hours of service. Low-cost, data drift, and cross-sensitivity are the main issues to be resolved.

Abstract

In response to the EURO 7 regulation, which mandates near-continuous monitoring of pollutant gas emissions from every vehicle during real driving conditions, this research reports the development of a micro portable emissions monitoring system (µPEMS) for monitoring tailpipe mass emissions of NOx, CO, and CO2. It consists of low-cost MOX sensors installed in the exhaust pipe to detect pollutant concentrations, complemented with engine operation data from the vehicle’s On-Board Diagnostics (OBD) system. Issues of sensor drift, cross-sensitivity, and varying sampling frequency were addressed. Readings from this µPEMS prototype exhibited high correlation (R2 > 0.87) with experimental data obtained under real driving conditions using a well-accepted PEMS for the cases of three vehicles (gasoline, diesel, and hybrid). This innovation enables new alternatives to regulate vehicular emissions. It also provides valuable real-time data for improving ecodriving, vehicle technology, and national emission inventories.

1. Introduction

Currently, there is an urgent need for an instrumental system (µPEMS), permanently embedded in each vehicle, that continuously measures tailpipe mass emissions and periodically uploads the data to the cloud. The primary pollutants of interest are carbon monoxide (0–5%), nitrogen oxides [NO (0–5000) ppm and NO2 (0–2500) ppm], and particulate matter (PM1, PM2.5), which must be measured across wide concentration ranges under varying temperature and humidity conditions.
This system will enable drivers, fleet managers, and governmental authorities to monitor and report vehicular emissions in near-real time with high accuracy. Considering that CO2, CH4, and N2O are greenhouse gases (GHGs) present in tailpipe emissions, the µPEMS could also support emission inventories and track progress towards NDC (Nationally Determined Contribution) commitments of GHG reductions [1]. Furthermore, the µPEMS could become an easy and low-cost alternative for regulating vehicular emissions, especially in heavy-duty vehicles, which remain under-regulated in most countries. The automotive industry needs this kind of system to demonstrate the improved emission conformity demanded by regulations, such as EU VII [2]. This system would also enable the handling of emission zones [3,4]. Finally, this system can detect the effects of simultaneous faults in the catalytic converter, lambda probe, or injector, which can lead to excessive emissions [5,6].
Despite the widespread adoption of electric vehicles in urban centers, several applications, such as long-distance transportation and off-road operations, will continue to rely on fuel-powered vehicles [7]. To date, vehicle emissions remain the primary source of air pollutants in large urban centers [8]. In an effort to reduce air pollution in these areas, environmental authorities have established regulations targeting brand-new vehicles that mandate CVS (constant volume sampler) laboratory tests, in which vehicles should comply with threshold-limiting values for mass tailpipe emissions [9]. Over time, these regulations have become progressively more restrictive, resulting in significantly cleaner vehicles compared to previous years [10]. The process of fulfilling these regulations involves costly equipment and high operating costs [11]. As a result, few countries have the facilities to enforce those types of regulations under their local conditions, and therefore, most countries rely on manufacturer tests [12].
Several studies have indicated that vehicles emit significantly more pollutants under real driving conditions than reported by manufacturers, primarily due to differences between real-world and laboratory test conditions [13]. To address these discrepancies, researchers developed portable emission monitoring systems (PEMSs) to measure vehicle emissions by on-road tests [14]. The US 40 CFR 1065 regulates measurement techniques, methods, and verification processes that PEMSs can use [15]. PEMSs were also incorporated into regulations in Europe for testing real driving emissions [16]. AVL, Sensors, Inc., and Horiba are among the most popular trademarks for 1065-compliant PEMSs. All PEMSs use NDIR sensors for the determination of HC, CO, and CO2 concentration, as well as the chemiluminescence (CLD) or non-dispersive ultraviolet (NDUV) methods for the determination of NO and NO2. Thus, sensors that measure pollutant concentration do not exhibit cross-sensitivity, but they do exhibit signal drift, which limits testing time to ~1 h before recalibration. PEMSs also include an exhaust flow meter (EFM) to measure gas mass flow using Pitot or Venturi tubes. PEMSs have minor data synchronization issues because the two devices (sensors and EFMs) are in the same position.
The investment and operational costs of PEMSs are also high. Their size and weight are still significant. They are delicate and require specialized personnel for their operation. Those circumstances make them invasive and unsuitable for continuous operation over extended periods. Consequently, results from on-road tests using PEMSs are obtained under controlled conditions during short-term tests, failing to capture emissions as the vehicle operates under everyday normal conditions. Ideally, each vehicle should be equipped with a PEMS that continuously monitors its emissions. Additionally, it should feature an information technology system that periodically reports cumulative real driving emissions to relevant stakeholders. PEMSs should therefore be significantly smaller, cheaper, and more user-friendly than current PEMSs [4,17].
The idea of a small-sized PEMS (mini-PEMS) that could be used for non-regulatory purposes evolved more than 10 years ago. Maha developed a mini-PEMS that measures NOx, CO2, and PM. The company 3DATX developed their parSYNC mini-PEMS that includes measurement of NOx, CO2, and PM mass [18]. NGK Spark Plug developed their NTK Compact Emissions Meter (NCEM) to measure PM, particle number (PN), NOx, O2, and air/fuel ratio [19]. These mini-PEMSs use different commercially available sensor technologies [20]. Some of them use electrochemical cells or the NOx dissociation technique to measure NO and NO2. These mini-PEMSs also rely on the EFM used by PEMSs to measure mass gas flow, making them still too costly and heavy to be used permanently in each vehicle. They also require frequent recalibration to counteract signal drift. Ref. [21] compared a mini-PEMS with a 1065-compliant PEMS under road conditions and found high correlation in their results. They suggested that the mini-PEMS could be used as a screening tool to measure a large number of vehicles operating under a wide range of conditions.
Some authors have suggested the use of instant fuel consumption and air–fuel ratio to determine mass gas flow at the exhaust in place of the EFM [21,22,23,24]. This alternative significantly reduces the cost and volume of mini-PEMSs because these two pieces of information are already available from the engine control unit (ECU) and can be retrieved via the OBD port. We will refer to them as a micro-PEMS (µPEMS). Ref. [22] suggested a self-contained unit temporarily installed at the tailpipe, powered by an independent energy source and capable of data acquisition/transmission independent of the vehicle’s OBD, that could be used for temporary applications, e.g., for estimating the exhaust gas quality in the control procedure of the Periodical Inspection in Germany (TÜV), MoT in England, and Inspection and Maintenance I/M in the USA. However, they did not demonstrate the device’s operation. Ref. [23] presented an exploratory study carried out with a µPEMS of reduced size (45 × 30 × 20 cm) and weight (~15 kg) for applications on two-wheeler vehicles. They measured the exhaust gas concentrations of HC, CO, and CO2 with the NDIR method, and NO2 and O2 using electrochemical cells. Electrochemical cells require gas pretreatment (drying and particle filtering) for their proper operation. They obtained high correlations between the results obtained with their µPEMS and the one obtained with a PEMS under laboratory conditions.
In this work, we propose to advance previous works and take advantage of the OBD system and advances in sensor technology to address the need for low-cost µPEMS. The objective of the present work is to demonstrate the feasibility of µPEMS based on MOX sensors and OBD data for the continuous, real-time measurement of tailpipe emissions from road vehicles. It is out of the scope of the present work to measure particulate matter, CH4, or N2O.
In the process of achieving this objective, we reached the following contributions to new knowledge: (i.) the development of a proof-of-concept µPEMS that continuously reports in real time the mass emissions of gas phase pollutants (CO, NOx, CO2), highly correlated with the ones obtained with a 1065-compliant PEMS, when monitoring road vehicles working under normal conditions of operation; (ii.) additionally, the use of metal oxide (MOX) sensors for the direct measurement (without gas pretreatment) of tailpipe concentration and the solution of their cross-sensitivity problems by the use of a multilinear correlation with their influencing factors; and (iii.) finally, an alternative to mitigate signal drift in pollutant concentration by reporting cumulative mass emissions rather than emission rates.

2. Materials and Methods

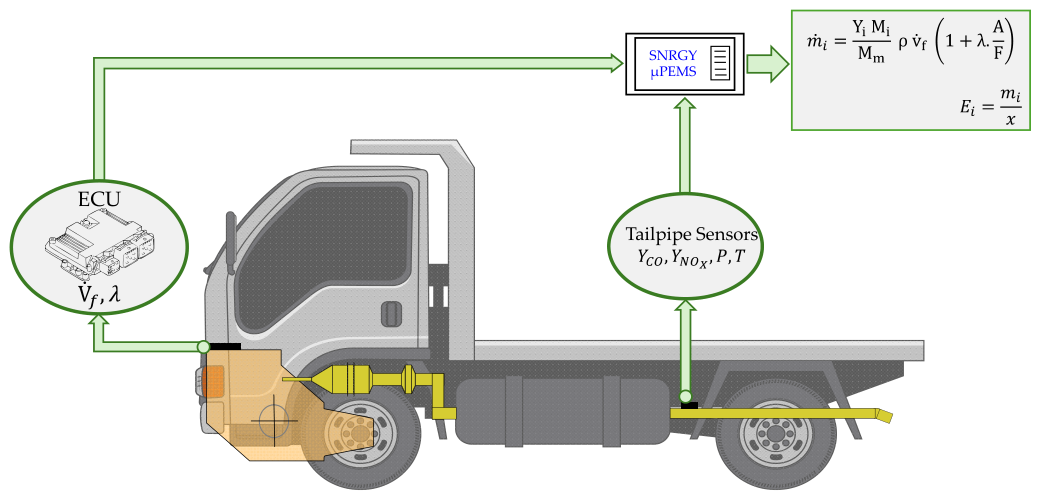
The working principle of the μPEMS consists of determining exhaust mass flow through the readings of fuel consumption ( v f ˙ ) and air–flow ratio (AF) from the OBD system, and then multiplying it by the mass fraction ( X i ) of the pollutant of interest, using independent sensors installed directly at the exit of the tailpipe without requiring any gas pretreatment. The proposal is summarized in Figure 1.
This section describes the operation of the µPEMS and their calibration process. First, the selection and setup of a multi-gas sensor to measure pollutant concentration at tailpipe conditions are explained. Subsequently, the process of gathering data from the OBD system is described. Then, the method to calculate pollutant mass emissions is presented. Finally, the work conducted to calibrate the µPEMS is shown.

2.1. Sensors to Measure CO and NOx Concentrations at Tailpipe Conditions

The mass concentration of each pollutant i at the tailpipe conditions is determined through Equation (1), where Yi is the volumetric concentration of pollutant i, and M and Mi are the molecular weights of the combustion products and pollutant i, respectively. Yi is the only variable in Equation (1).
X i = Y i M i M
Thus, the µPEMS requires sensors to measure the instant CO and NOx volumetric concentration ( Y i ) at the exit of the vehicle tailpipe in the ranges of 0–5.0% and 0–0.5%, respectively. CO2 can be determined directly from fuel consumption. Particulate matter sensors are of great importance for the µPEMS, but they are excluded from the scope of the present work due to the additional challenges they pose. Pollutant concentration must be measured at high temperatures (200–400 °C), in the presence of other pollutants, and under high humidity (15–100%) in a pulsating flow at near-atmospheric pressure [25]. Low energy consumption, low cost, and portability are essential characteristics these sensors must meet to be incorporated into the µPEMS.
Table 1 lists sensors currently available that could be used to measure tailpipe pollutant concentrations. Among them, metal oxide (MOX) semiconductors exhibit the most promising performance for the current application. They are the least expensive detectors available commercially.

2.1.1. MOX Sensors

The surface of the MOX sensor layer consists of small-grained ceramics (e.g., metal-doped SnO) as the gas-sensitive material. Detailed composition and grain diameter yield different gas sensitivities that depend on the manufacturer. When exposed to tailpipe gases, molecules of the gas stream are adsorbed at the ceramic surface as they interact with the ceramic’s oxygen atoms, thereby varying the material’s electrical resistivity. In the case of the 3A4P-UST Triplesensor, the temperature can be controlled with a platinum heater to improve the absorption process, thereby increasing its gas sensitivity [33,34]. Exposure of the MOX material to H2O, CO, CH, and NH3 decreases its electrical resistance, while exposure to NO and NO2 will increase its resistance. Exposure to CO2 and N2O does not influence the resistance of the material due to their non-reactive behavior. The electrical resistance of the MOX sensor should be divided by the value reported by the same sensor when the pollutant concentration is zero. The logarithm of this fraction is proportional to the pollutant concentration. MOX sensors present two issues: cross-sensitivity and drift.
  • Cross-sensitivity refers to the fact that the sensor is sensitive to the presence of multiple gases (e.g., CO, H2O, several CH, NH3, and NOx) [33,34]. Various studies reported that the application of MOX sensors in automotive gas mixtures exhibits cross-sensitivity, particularly influenced by humidity and temperature, leading to depletion problems, [35] and resulting in inaccurate readings [36,37]. In MOX technology, sensitivity can be improved by operating with thermal modulation and employing multiple selective layers [38,39]. Additionally, sensor arrays combined with multivariable analysis can mitigate cross-sensitivity, enabling the detection of the target gas within a mixture of gases [40,41,42].
  • Drift is defined as the gradual, time-dependent variation in the sensor’s bulk conductivity due to prolonged use and exposure to corrosive gases [43]. Long-term evaluations of calibrated sensor arrays have demonstrated a substantial reduction in gas-recognition performance, declining from 98% to 20% over three years [44]. It has been found that the rate of change in this conductivity, when driven by a pulsed input, is more stable and reproducible [45]. Thus, to avoid sensor drift over time, periodic recalibration, or the application of temperature control to the imaginary part of the sensing layer impedance, has been proposed [39,46,47]. Additionally, it can be solved by adjusting the measurements, using the CO2 concentration measurements obtained by other sensors or methods as a reference.
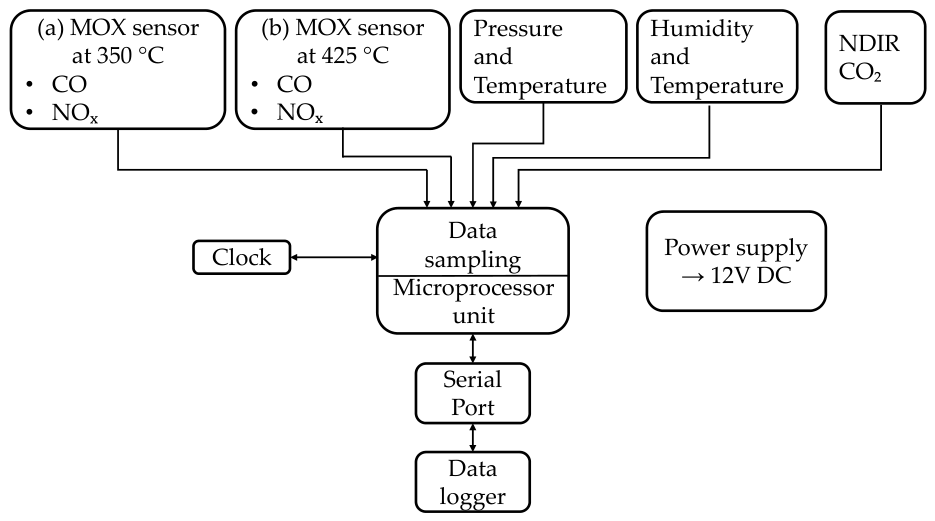
Umweltsensortechnik (UST) [48] provides sensors with three layers of MOX materials for measuring CO, NOx, and HC in each layer. Deckma Hamburg [49], a partner company, integrated two MOX sensors operating at different temperatures (350 and 425 °C), along with CO2, humidity, temperature, and pressure sensors in a homemade multi-gas-sensor module. It includes (Figure 2) a battery-assisted temperature-corrected clock and a 12 V DC power supply. Data are transmitted via RS-232 serial link at 115 kbaud. It was built on a PCB (printed circuit board) with dimensions of 6 × 10 cm2, and a measuring area with a diameter of 2.5 cm, which is exposed to exhaust gas via a copper connection pipe. Supplementary details of this configuration can be found in [50,51]. Additional work was undertaken to adapt the output of this device to a portable datalogger, enabling automatic data collection and recording during on-road tests. We named this version of the µPEMS as the MOX-µPEMS.

2.1.2. Zirconia-Based Electrochemical Sensors

Zirconia-based electrochemical sensors have been used for oxygen monitoring and combustion control. These solid-state devices are highly robust and are currently implemented in nearly all internal combustion engines where they supply feedback for air–fuel ratio control. Through modifications in sensor architecture and operating principles, this technology has been extended to enable the detection of NOx at ppm concentrations, supplying critical input for the control and optimization of exhaust post-treatment systems [52]. In this work, we also used commercially available NOx sensors manufactured by Bosch. A data acquisition system was developed to enable online readings from this sensor. We named this version of the µPEMS as NOx-µPEMS.

2.2. Measurement of Exhaust Mass Emission Rate

Usually, existing PEMS determine the mass exhaust rate ( m ˙ ) by multiplying the volumetric flow of combustion products in the exhaust pipe (   v p   ˙ ) with their density (   ρ p ). These instruments use either Pitot or Venturi tubes to measure the volumetric flow of combustion products, and pressure and temperature sensors to measure density.
Alternatively, we propose obtaining the mass exhaust rate ( m ˙ ) through Equation (2), where ρ f is the fuel density,   v f   ˙ is the volumetric fuel consumption rate, (1 − λ ) is the excess air, and AF is the air–fuel stoichiometric ratio. All these variables are constant except for v f   ˙ and λ , which need to be continuously measured. We propose to read these variables directly from the Engine Computer Unit (ECU) by using an LM327 OBD-II adapter connected to the vehicle’s OBD port. The adapter sends data to the cloud via the internet or to a computer via Bluetooth at a frequency of 1 Hz.
m ˙ = ρ f   v f   ˙ ( 1 + λ   A F )

2.3. Determination of the CO and NOx Mass Emissions Rates

Finally, the mass emission rate of pollutant i is determined by multiplying the mass fraction of pollutant i by the exhaust mass emissions rate ( m ˙ ) as per Equation (3), which results in Equation (4).
m i ˙ = X i m ˙
m i ˙ = Y i M i M ρ f   v f   ˙ ( 1 + λ   A F )
However, implementing Equations (3) or (4) has three complications: sensors have different response times, data are gathered at different sampling frequencies, and data are unsynchronized.

2.3.1. Differences in Sampling Frequency

A recurrent problem that arises when measuring the tailpipe mass emissions is the variation in sensors’ time response and sampling frequencies of the signals involved. These issues are resolved by computing the average value of each variable over the same window time. Although we targeted average mass emissions at 1 Hz, we found that the best results are obtained at lower frequencies. These analyses will be presented in Section 3.

2.3.2. The Time-Alignment Problem

Synchronization problems arise from the fact that some variables (e.g., fuel consumption) are measured at the engine, while others (e.g., pollutant concentration) are measured several meters downstream at the tailpipe exit. Even then, although measurements are taken simultaneously, data are asynchronized. The delay time mostly corresponds to the time it takes for the combustion byproducts to travel from the engine to the tailpipe. This time depends on the exhaust mass flow. Furthermore, differences in the diffusivity of different pollutants cause the delay time to differ between pollutants. We adopted the dynamic data synchronization proposed by [53] to resolve this issue. It consists of shifting one signal forward or backward with respect to the signal that should be synchronized (e.g., fuel consumption and CO2 concentration). The delay time ( Δ t ( t ) ) follows Equation (5), where t o and β are constant.
Δ t ( t ) = t o + β 1 v f   ˙
A correlation analysis between the signals involved (CO2 concentration and fuel consumption, as in our previous example) will be used to determine the level of synchronization. Thus, the constants in Equation (5) are the ones that maximize the coefficient of determination (R2). This proposal was verified with a large number of tests (>240) carried out with different PEMSs and several diesel- and gasoline-powered vehicles (>70) [53].

2.4. Calibration by On-Road Tests

As mentioned previously, the focus of this work is the development of a “proof-of-concept” µPEMS by using existing sensors rather than developing new sensors. Therefore, the demonstration of its functionality must be based on on-road tests comparing its results with those obtained with 1065-compliant PEMSs. Thus, the two versions of the µPEMS were mounted on diesel, gasoline, and hybrid gasoline–electric (HEV) vehicles. Table 2 describes the technical characteristics of the vehicles used in the tests. The test vehicles were pick-ups and SUVs from recent model years.
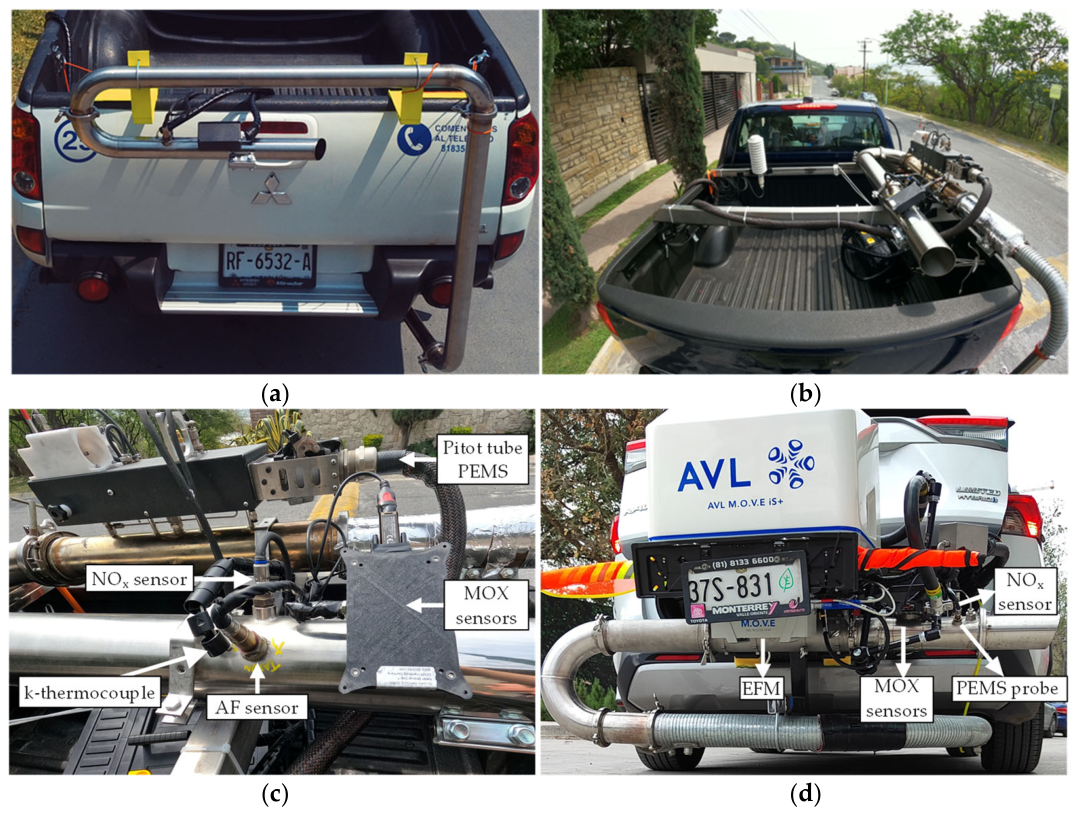
Assembling the µPEMS onto the vehicle required developing an exhaust gas cooling system to ensure temperatures remained below 200 °C upon contact with the µPEMS. To accomplish this objective, the exhaust pipe was extended 2 m with a stainless-steel pipe. Sensors were assembled to avoid exposure to condensed water from combustion products. Figure 3c shows the location of these sensors in the exhaust pipe extension.
Calibration: Measurements from the MOX-µPEMS and NOx-µPEMS were intercompared with measurements from a 1065-compliant PEMS. Table 3 presents the technical specifications of the PEMS used for intercomparison. It was the AVL MOVE iS+ PEMS. It was mounted in the vehicles in accordance with the manufacturer’s instructions. Traceable NIST calibration gases were used prior to and after each test, following the operational recommendations provided by the PEMS manufacturer.
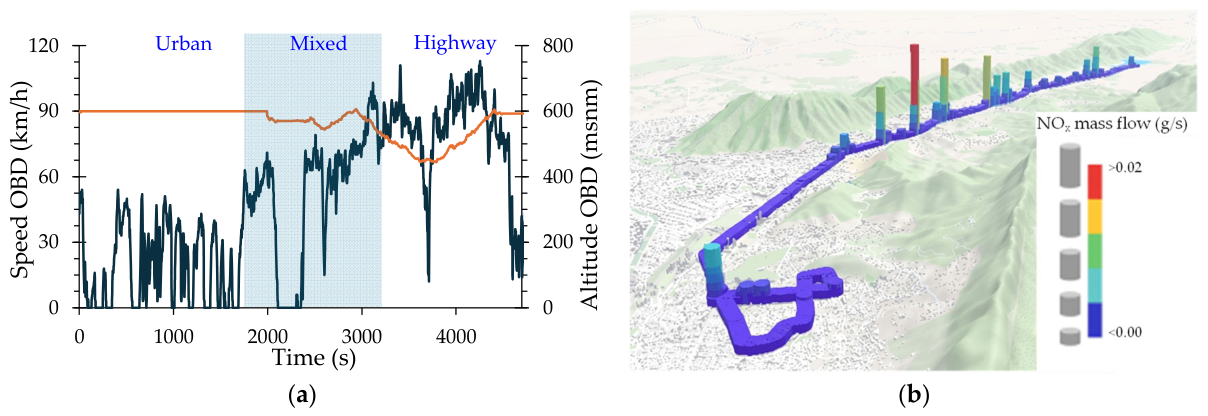
The tests were conducted by driving the vehicles along the main roads of the city of Monterrey, Mexico, following existing traffic, while all the variables described above were simultaneously recorded at one-second intervals. Figure 4a shows the profiles of speed and altitude. The tests lasted ~90 min and covered ~70 km.

3. Results

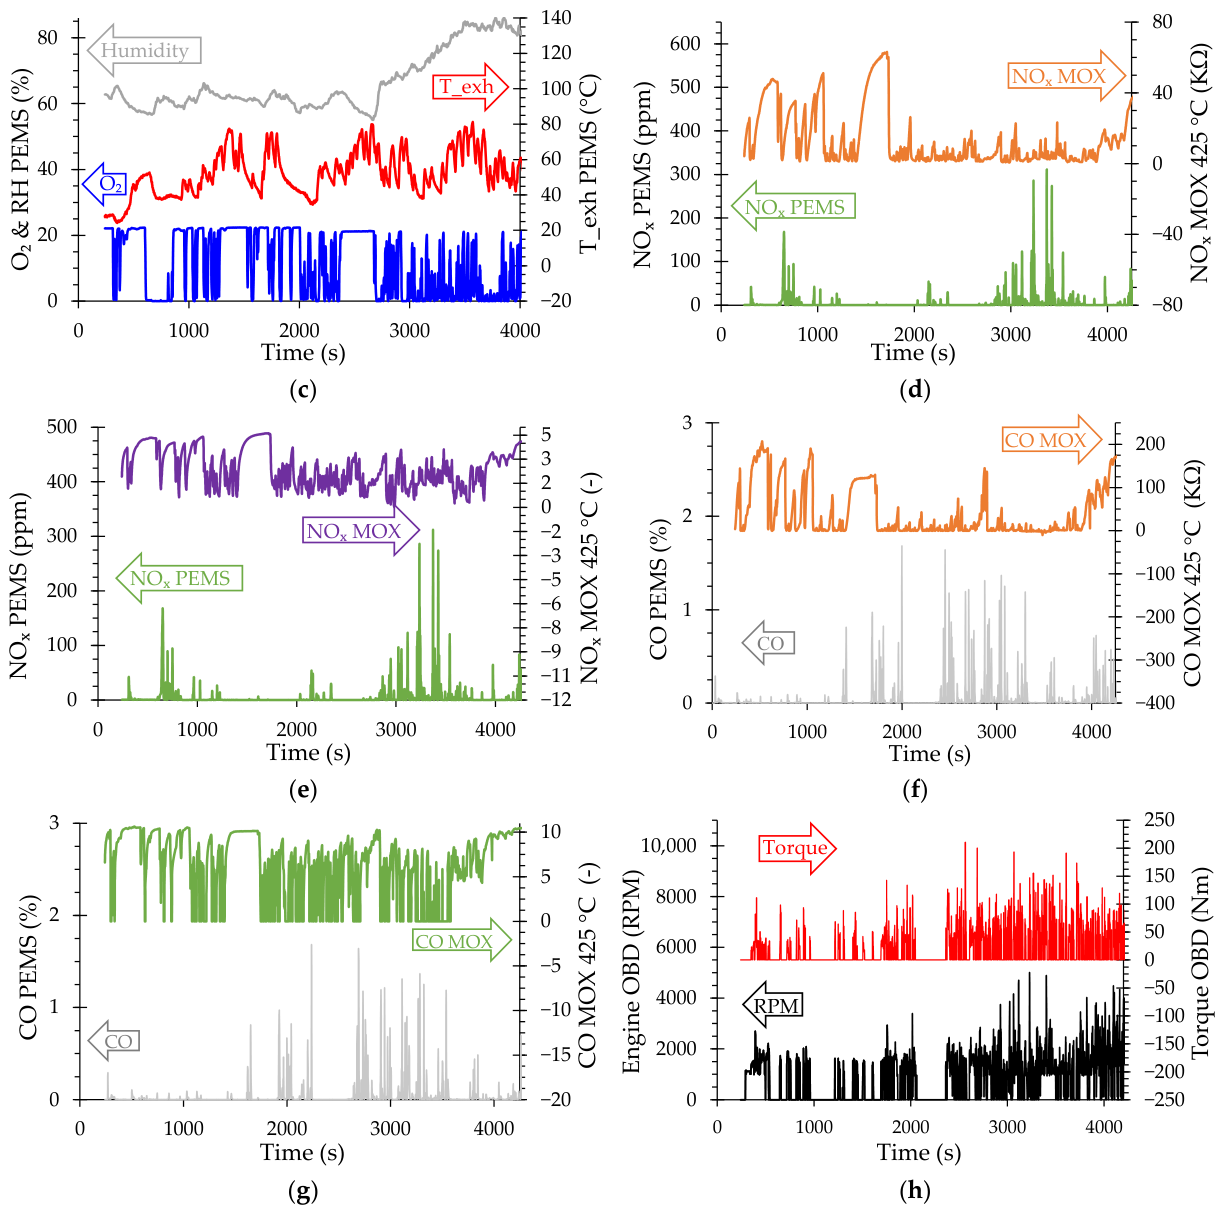
Figure 4 shows the results obtained during one of the road tests. It shows the results obtained with the hybrid vehicle.

3.1. Data Synchronization and Averaging Time Window

Given the disparity in sampling frequencies across the measurement systems installed on the vehicle (PEMS, NOx sensor, MOX sensor, and OBD system data), it was necessary to unify these to a common frequency prior to further analysis. This down-sampling (with appropriate windowing and filtering) mitigates biases from uneven temporal sampling and differences in sensor response times, as well as reducing noise.
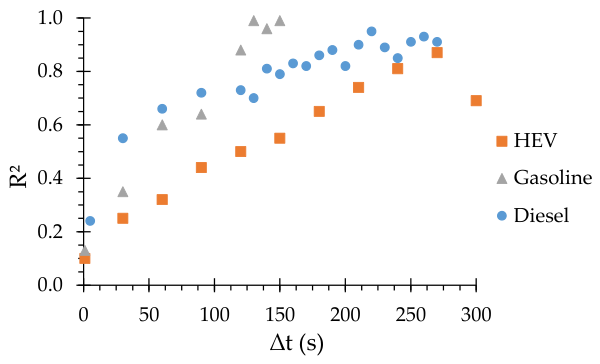
Simultaneously, data synchronization was performed at each time averaging frequency. Figure 5 presents, for illustrative purposes, the variation in correlation coefficients (R2) between the fuel consumption rates and CO2 mass emission rates as a function of the time averaging frequency. The best results were observed when the sampling rate averaged every 140 s for gasoline vehicles, 220 s for diesel vehicles, and 270 s for HEVs.

3.2. Performance of the MOX Sensor

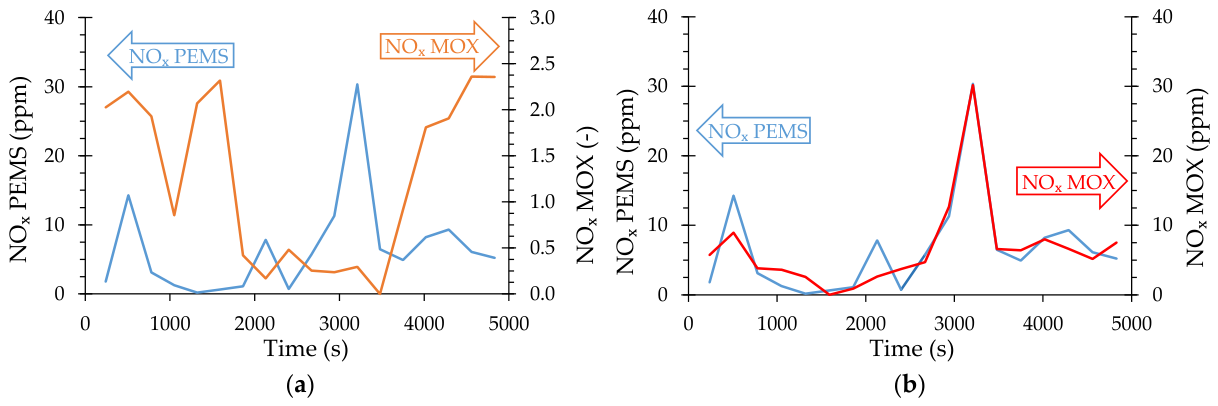
As mentioned above, the logarithm of the output of the NOx-sensitive layer of the MOX sensor, heated to 425 °C, should be proportional to the NOx concentration. In this case, we used the NOx concentration measured by the PEMS as the reference. Figure 6a shows the evolution of both signals, illustrating that they are highly uncorrelated (R2 ~ 0.054) in the HEV case. Similar results were observed in the other vehicles.
As described in Section 2.1, the NOx concentration from the MOX sensor can be obtained as a linear combination of the multiple variables that influence its response. Thus, we proposed a multiple linear combination of the variables influencing the MOX sensor response (Equation (6)). That is, the Ci coefficients of Equation (6) need to be determined to predict the NOx concentration. In this equation, r H represents the relative humidity measured by the humidity sensor; T is the temperature measured by the humidity sensor; P t denotes the temperature measured by the pressure sensor; P corresponds to the absolute pressure measured by the pressure sensor; l n ( C H / C H r e f ) expresses the natural logarithm transformed resistance of the MOX C H s sensing layer; l n ( C O / C O r e f ) refers to the natural logarithm transformed resistance of the MOX CO sensing layer; and l n ( N O / N O r e f ) captures the natural-log-transformed resistance of the MOX NO sensing layer.
Y N O x = C 1 + C 2 rH + C 3 T + C 4 Pt + C 5 P + C 6 l n ( C H C H r e f ) + C 7   l n ( C O C O r e f ) + C 8   l n ( N O N O r e f )
Since, in practice, only the signals reported by the multisensory device will be available, the regression was limited to the variables it can read. In this case, we used one MOX sensor heated to 350 °C and another to 425 °C. Table 4 presents the results of the correlation analysis conducted for one of the time windows considered. In this case, a high adjusted coefficient of determination (R2 > 0.87) was observed in the three vehicles (Figure 6b). The Ci coefficients obtained for Equation (6) are also shown in Table 4. Finally, this table shows the p-values for each coefficient. p-Values > 0.05 indicate variables that are not relevant in the correlation and can therefore be excluded from Equation (6). Readings of NOx from the second MOX sensor showed a p-value < 0.05 and therefore could be excluded from Table 4. The fact that the second reading from MOX showed a p-value < 0.05 indicates that these readings are correlated with the readings from the first MOX sensor.
Previous results indicate that the MOX sensor measures NOx concentrations comparable to those obtained with the PEMS and the zirconia-based electrochemical NOx sensor. Similar results were obtained in tests with gasoline-powered vehicles and diesel-powered vehicles.

3.3. Performance of the Zirconia-Based Electrochemical NOx Sensor

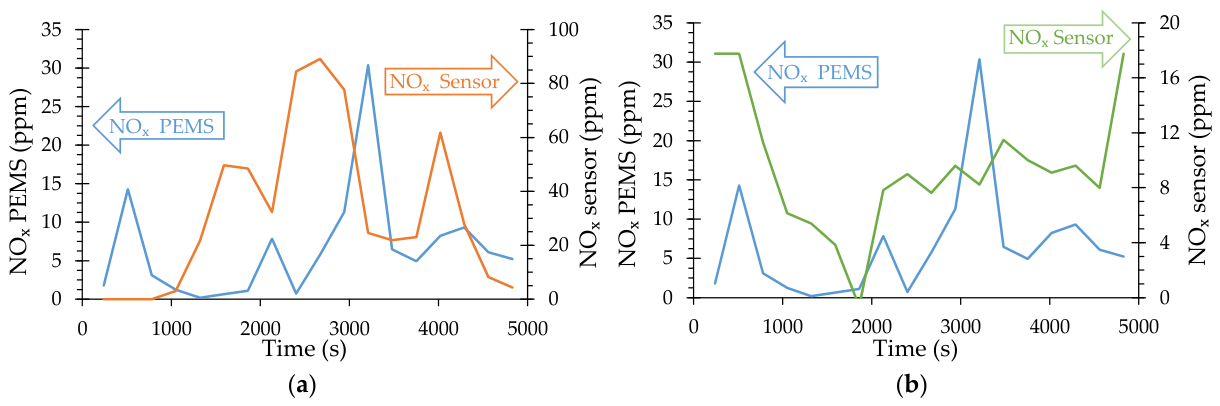
The zirconia-based electrochemical sensor used to measure NOx concentration in the tailpipe was included in the experimental setup used during the tests conducted with the HEV, with the aim of determining its performance relative to the PEMS. Figure 7a shows that the amperometric sensor tends to overestimate NOx concentration and exhibits response delay issues. Therefore, both signals exhibit a poor coefficient of determination (R2 of 0.008).
However, when the sensor was subjected to the calibration procedures described in Section 2—including corrections for the time-alignment problem and differences in sampling frequency—an improvement in the readings was observed, increasing the R2 to 0.54; these results are illustrated in (Figure 7b). Although the resulting R2 remains lower than expected, this outcome is understandable considering that such sensors are primarily designed to evaluate NOx in heavy-duty vehicle technologies, where emissions are significantly higher. Consequently, when applied to technologies such as HEVs, which are characterized by low NOx emissions, their performance is limited.

3.4. Determination of Mass Emissions

Measurements taken during the on-road test were processed using the methodologies described above to obtain the mass emission rates of NOx and CO. Next, we will concentrate on the tests conducted with the gasoline hybrid vehicle.
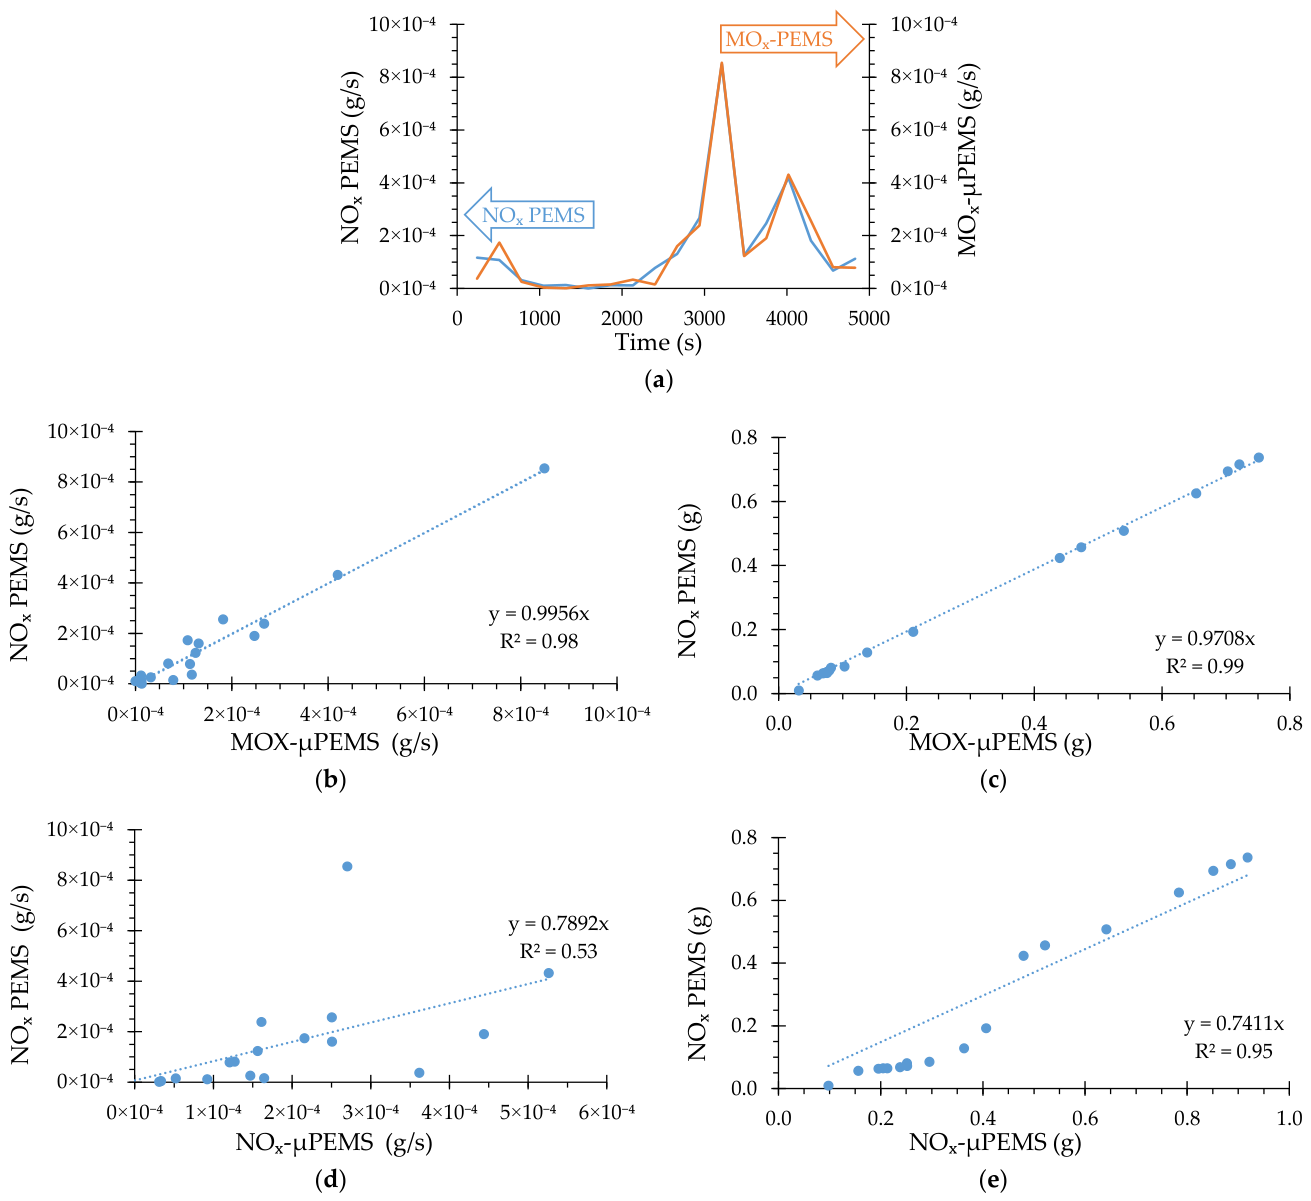
Results in terms of mass flow rate of pollutants: Figure 8a illustrates the evolution of the NOx mass flow rate, obtained with averaging time windows of Δt = 270 s, during an arbitrary segment of the on-road test. It shows that the MOX-µPEMS produce results that follow the PEMS measurements of NOx mass flow rate. Figure 8b confirms this qualitative result. It shows that the MOX-µPEMS produced highly correlated results (R2 = 0.98) of NOx mass flow rate compared with the reference PEMS. The slope close to one is a result of the calibration process. Similar results were obtained for the case of NOx-µPEMS (Figure 8d).
Results in terms of cumulative mass emission of pollutants: To determine the monitored cumulative mass emission, previous mass emission rate results were integrated over time. Again, results were compared with those obtained with the reference PEMS. Figure 8c shows that they are even more correlated (R2 = 0.99) than in the previous case. This observation was expected, as integrating the variables over time damps errors that frequently occur when sampling time-dependent physical processes. Similar results were obtained for the case of NOx-µPEMS (Figure 8e).
Results in terms of emission index: Emission indices were obtained by integrating the mass emission rate (mg/s) over time and by normalizing the distance traveled (mg/km) after frequency harmonization and data synchronization. Table 5 shows the average emission index values obtained across all tests. For reference purposes, it also shows the values reported by the manufacturer and the emission limits permitted for this type of technology under the Mexican national standard NOM-42-SEMARNAT and EU standards. We recall that the emission indices reported by the manufacturer were obtained during lab tests on a chassis dynamometer following a homologation driving cycle. Therefore, the two values are not comparable because the values reported in our tests were obtained from the vehicle running under real driving conditions in this study. However, they can be used to confirm the values were within the same order of magnitude and the relevance of the test with PEMS under real driving conditions.

4. Discussion

The proposed method for the determination of the real mass emissions of CO2, CO, and NOx in the tailpipe of fossil-fuel-powered vehicles by the use of low-cost sensors for the measurement of tailpipe concentrations, combined with a device to read the fuel consumption from the Engine Computer Unit (ECU), offers several key advantages.

4.1. Exactitude and Representativeness of the μPEMS Results

In the real world, instantaneous measurements of tailpipe emissions (in g/s) exhibit high variability due to uncertainty propagation in input variables and the inherent transients of driving. The RDE/PEMS literature converges on the view that representativeness is not achieved at the second-by-second scale but through statistical aggregation of micro-trips to obtain driving patterns, capturing how people drive in a region [68]. In practice, normalized emission indices (g/km) stabilize after sufficient distance and fuel consumption have been accumulated, using segment-weighted averages and cumulative metrics (with moving time windows and uncertainty estimates), or by reproducing controlled driving cycles that statistically capture usage regimes. This approach, grounded in real driving conditions and convergence analysis, yields robust, comparable emission factors suitable for regulatory assessment and field diagnostics.
The CO2 sensor: According to various studies [69,70,71,72], the most robust estimate of the CO2 EI (g/km) is obtained using a fuel-based approach—from the specific fuel consumption (SFC) and a conversion factor that depends on the fuel’s carbon content (carbon balance method). This approach reduces sensitivity to concentration noise and instrumental phase shifts and typically yields lower uncertainties under real driving conditions.
Nevertheless, the NDIR sensor included in the system provides diagnostic value: its temporal concentration profile in RDE enables the detection of operational deviations in the powertrain (e.g., anomalous transients, prolonged enrichments, aftertreatment inefficiencies) that have been documented in previous studies. Results showed that the NDIR signal qualitatively reproduces the trend of the reference PEMS; however, the coefficient of determination is R2 ≈ 0.67, indicating limited point-by-point agreement.
In summary, we propose employing the SFC-based method for the primary quantification of the CO2 EI and using the NDIR sensor as complementary observability for dynamic analysis and early fault detection at a very efficient cost.

4.2. Implications from the Industrial Perspective

From an operational standpoint, the μpems exhibits substantial flexibility. It can be applied during laboratory or on-the-road tests conducted under normal driving conditions. It can also be used with data collected by monitoring a vehicle without interfering with its operation.
In economic terms, the method is low cost compared with existing alternatives. It does not require laboratory infrastructure or formal testing protocols. It requires continuous monitoring at 1 Hz of the following operating variables: location, engine RPM, air–fuel ratio, vehicle speed, instantaneous fuel consumption, and the concentration of each pollutant gas (CO and NOx). This activity can be carried out using the instruments installed by vehicle manufacturers to control vehicle operation and the implementation of low-cost sensors for the measurement of tailpipe concentrations. Thus, it does not require high instrumentation costs comparable to those of PEMS or mini-PEMS. However, it requires a telemetry system that reads such data, aggregates it in a central computer, and processes it according to the proposed method. Currently, telemetry companies charge about USD 200 for installing their telemetry devices and USD 50 per vehicle per month for the monitoring service. These figures are substantially lower than the cost of a test using PEMS (~1 million USD of CAPEX and ~0.05 million USD of OPEX per test). We highlight that the development of the μPEMS prototype at TRL 3 or 4 has incurred significant costs, primarily for calibration and research. At a later stage (TRL 7–8), we will focus on manufacturing processes at an industrial scale that meet the low-cost requirement (<100 USD).
With respect to scalability, the proposed method is applicable to a wide range of transportation technologies that use internal combustion engines powered by fossil fuels, both in conventional propulsion configurations and in hybrid systems incorporating this type of engine. Consequently, its implementation is suitable for the analysis and evaluation of large-scale fleets.

4.3. Implications for Public Policy

In the current field of environmental technology, significant advances in cost-effectiveness and applicability have been achieved through the development of µPEMS designed for measuring pollutants in the exhaust systems of vehicles with internal combustion engines. The completion of this phase of the project has resulted in a system that combines a low-cost µPEMS to measure the mass flow of the main pollutants (CO, CO2, NOx) in gases emitted by internal combustion engines. These prototypes are affordable and easy to use, distinguishing them from current systems, which are typically expensive and complex to implement.
From a regulatory perspective, measuring the mass emission of pollutants under real-world driving conditions helps environmental authorities. All these advantages of the proposed method enable regulators to ensure that vehicles in circulation comply with environmental laws, holding manufacturers accountable for proper vehicle functioning and users for adequate maintenance. The method can help identify and promote options that remain within stipulated conformity limits and support the establishment of environmental performance standards, with a focus on environmentally friendly propulsion systems. However, its regulatory adoption will require standardization, metrological validation, and social acceptance.
The easy implementation of these µPEMS in aftertreatment systems not only enables effective monitoring and optimization but also ensures compliance with current environmental regulations. Owing to its low cost and considerable commercial potential, this patentable technology could catalyze a significant change in how manufacturers and regulatory bodies address environmental protection and air quality improvement. This technological development is a clear example of how targeted innovation not only contributes to environmental improvement, but also facilitates regulatory compliance [73,74], promotes the adoption of sustainable technological proposals to address the complex environmental problems caused by the automotive industry, and contributes to regulatory compliance.

4.4. Main Drawbacks of the Proposed Method for the Measurement of the Real Mass Emissions

For heavy and light duty vehicles, the measurement of real mass emissions faces mainly practical constraints: (a) cross-sensitivity and drift in MOX sensors, stemming from humidity and interferents such as HC, require thermal modulation and periodic recalibration to preserve selectivity and sensitivity; (b) synchronization and resampling are necessary to reconcile disparate channel frequencies (µPEMS/OBD/MOX), and decisions regarding harmonization, filtering, and temporal alignment influence bias and uncertainty; (c) maintenance and aging, through fouling and degradation of MOX/NDIR sensors and conditioning elements, demand routine verification and recalibration to prevent response shifts; and (d) achieving a unit cost below USD 100 for mass deployment depends on economies of scale, application-specific integrated circuits (ASICs), and optimized calibration processes, since otherwise the costs of materials, assembly, metrological assurance, housing, connectivity, and post-sale support may exceed this threshold and compromise economic viability.

4.5. Main Limitations of This Study

An important limitation of this study is that the experimental evaluation was conducted on only three vehicles. Even though the vehicles used represent different propulsion technologies (gasoline, diesel, and HEV), all are equipped with engines of approximately 2.5 L displacement and were manufactured after 2010. The restriction on the number of the μPEMS tests was due to the high costs associated with the tests, mainly associated with the use of NIST traceable calibration gases. Therefore, it is recommended that future research validate the µPEMS in vehicles across a wider range of engine displacements, ages, fuel types, and propulsion technologies.

4.6. Follow-Up Optimization Schemes for the Issues

The µPEMS faces significant limitations, including long-term drift in MOX sensors and sensitivity to temperature and humidity variations in exhaust gases. In this context, a promising line of research focuses on the development and application of equivalent vehicle maps, which enable estimation of pollutant emissions based on the vehicle’s energy consumption. As proposed in [75], these maps use operating parameters such as engine torque and revolutions per minute (RPM), which can be obtained reliably and at low cost. Furthermore, comparative analyses between different optimization approaches, including those based on these models, open the possibility of establishing more accurate and accessible methodologies for emissions assessment. Taken together, this approach could not only improve the accuracy of µPEMS but also promote their adoption in a wider range of applications and vehicle technologies.

5. Conclusions

The µPEMS is a low-cost device for the measurement of the real mass emissions of CO2, CO, and NOx in the tailpipe of fossil-fuel-powered vehicles under real driving conditions. It consists of low-cost sensors for the measurement of tailpipe concentrations combined with a device to read the fuel consumption from the Engine Control Unit (ECU).
This manuscript presents the work carried out to develop a µPEMS. It deploys MOX sensors, which exhibit cross-sensitivity issues when measuring the concentration of CO and NOx at the tailpipe conditions. We addressed this issue by using multiple linear regression models with temperature, humidity, pressure, and MOX readings. Under these circumstances, it demonstrated a robust correlation (R2 > 0.87) with experimental data obtained by testing gasoline, diesel, and hybrid vehicles under real driving conditions using a regulatory-compliant PEMS (AVL MOVES).
To convert these pollutant concentration measurements into mass emissions, we coupled them with readings of instantaneous fuel consumption taken directly from the ECU. Problems of varying sampling frequency and sensor time responses were solved by averaging independent variables with the same time window. Data time-alignment issues were addressed using dynamic data synchronization. Drift problems were mitigated by considering the time-accumulative results instead of instant variables.
Results were presented in terms of emission indices (g/km). When compared to results obtained by the well-accepted PEMS, it was found that the µPEMS monitors NOx emissions with a high level of correlation in gasoline (R2 = 0.96), diesel (R2 = 0.95), and hybrid vehicles (R2 = 0.87). Similar results were obtained for CO.
This innovation can provide valuable data for improving vehicle technology and national emission inventories. It also enables new alternatives to regulate vehicular emissions. However, additional work is required to explore the possibility of using other sensors and to evaluate the performance of the µPEMS after long hours of service. Data drift is the main issue to be resolved.

Author Contributions

Conceptualization, J.I.H.; methodology, J.A.H. and J.I.H.; software, J.A.H.; validation, J.A.H. and J.I.H.; formal analysis, J.A.H.; investigation, J.A.H.; resources, J.I.H.; data curation, J.A.H. and J.I.H.; writing—original draft preparation, J.A.H. and J.I.H.; writing—review and editing, J.A.H. and J.I.H.; visualization, J.A.H. and J.I.H.; supervision, J.A.H. and J.I.H.; project administration, J.I.H.; funding acquisition, J.I.H. All authors have read and agreed to the published version of the manuscript.

Funding

This research received no external funding.

Data Availability Statement

The data presented in this study are available from the corresponding authors upon request.

Acknowledgments

The authors thank Rafaela Tunze and Axel Schmidt of Deckma Hamburg GmbH for setting up the MOX sensor system, and Michael Palocz-Andresen for connecting the different organizations. This work is a continuation of a research project originated within the framework of the industrial collective research program and part of the Collective Research Networking (CORNET) program (IGF/CORNET 313 EBG), which was partially supported by the Federal Ministry for Economic Affairs and Climate Action (BMWK) based on a decision taken by the German Bundestag. Finally, we express our gratitude to the Secretariat of Science, Humanities, Technology, and Innovation (SECIHTI) for the financial support provided to Jordy Alexander Hernández Vivanco. This work was supported through the TEC-Challenge 2023 program under the project MAITEC: Decision-Making Platform for Evaluating the Impact of Urban Mobility Strategies on Human Health, Air Pollution, and Energy Consumption Based on a Digital Twin of the City, led by José Ignacio Huertas.

Conflicts of Interest

The authors declare no conflicts of interest.

Abbreviations

The following abbreviations are used in this manuscript:
μpemsMicro-PEMS
CMOSensComplementary Metal Oxide Semiconductor
ECUEngine Computer Unit
EIEmission Index
MOXMetal Oxide Sensor
NDIRNon-Dispersive Infrared
NDUVNon-Dispersive Ultraviolet
N/ANot Available
OBDOn-Board Diagnostics System
PEMSPortable Emissions Measurement System
RDEReal Driving Emissions
WLTCWorldwide Harmonized Light Vehicles Test Cycle
WLTPWorldwide Harmonized Light Vehicles Test Protocol

References

  1. IPCC. Mitigation of Climate Change. Contribution of Working Group III to the Sixth Assessment Report of the IPCC; Cambridge University Press: Cambridge, UK, 2022; Available online: https://www.ipcc.ch/report/ar6/wg3/ (accessed on 30 May 2025).
  2. Conway, G.; Joshi, A.; Leach, F.; García, A.; Senecal, P.K. A review of current and future powertrain technologies and trends in 2020. Transp. Eng. 2021, 5, 100080. [Google Scholar] [CrossRef]
  3. Bermúdez, V.; Ruiz, S.; Sanchis, E.J.; Conde, B. Assessment of exhaust raw emissions and aftertreatment performance in a retrofitted heavy duty-spark ignition engine operating with liquefied petroleum gas. J. Clean. Prod. 2024, 434, 140139. [Google Scholar] [CrossRef]
  4. Basshuysen, R.; Schäfer, F. Handbuch Verbrennungsmotor, 8th ed.; Basshuysen, R., Schäfer, F., Eds.; Springer: Berlin/Heidelberg, Germany, 2017; Available online: https://link.springer.com/book/9783658109011 (accessed on 30 May 2025).
  5. Soltic, P.; Hilfiker, T.; Wright, Y.; Hardy, G.; Fröhlich, B.; Klein, D. The potential of dimethyl ether (DME) to meet current and future emissions standards in heavy-duty compression-ignition engines. Fuel 2024, 355, 129357. [Google Scholar] [CrossRef]
  6. Barbier, A.; Salavert, J.M.; Palau, C.E.; Guardiola, C. Analysis of the Euro 7 on-board emissions monitoring concept with real-driving data. Transp. Res. D Transp. Environ. 2024, 127, 104062. [Google Scholar] [CrossRef]
  7. Un-Noor, F.; Wu, G.; Perugu, H.; Collier, S.; Yoon, S.; Barth, M.; Boriboonsomsin, K. Off-Road Construction and Agricultural Equipment Electrification: Review, Challenges, and Opportunities. Vehicles 2022, 4, 780–807. [Google Scholar] [CrossRef]
  8. Winkler, L.; Pearce, D.; Nelson, J.; Babacan, O. The effect of sustainable mobility transition policies on cumulative urban transport emissions and energy demand. Nat. Commun. 2023, 14, 2357. [Google Scholar] [CrossRef] [PubMed]
  9. Valverde, V.; Kondo, Y.; Otsuki, Y.; Krenz, T.; Melas, A.; Suarez-Bertoa, R.; Giechaskiel, B. Measurement of Gaseous Exhaust Emissions of Light-Duty Vehicles in Preparation for Euro 7: A Comparison of Portable and Laboratory Instrumentation. Energies 2023, 16, 2561. [Google Scholar] [CrossRef]
  10. United States Environmental Protection Agency. Basic Information about the Emission Standards Reference Guide for On-road and Nonroad Vehicles and Engines. In Emission Standards Reference Guide; United States Environmental Protection Agency: Washington, DC, USA, 2026. [Google Scholar]
  11. Li, X.; Nam, K.M. Environmental regulations as industrial policy: Vehicle emission standards and automotive industry performance. Environ. Sci. Policy 2022, 131, 68–83. [Google Scholar] [CrossRef]
  12. Singh, S.; Kulshrestha, M.J.; Rani, N.; Kumar, K.; Sharma, C.; Aswal, D.K. An Overview of Vehicular Emission Standards; Springer: Berlin/Heidelberg, Germany, 2023. [Google Scholar] [CrossRef]
  13. Fontaras, G.; Zacharof, N.G.; Ciuffo, B. Fuel consumption and CO2 emissions from passenger cars in Europe–Laboratory versus real-world emissions. Prog. Energy Combust. Sci. 2017, 60, 97–131. [Google Scholar] [CrossRef]
  14. Sandhu, G.; Frey, C. Effects of Errors on Vehicle Emission Rates from Portable Emissions Measurement Systems. Transp. Res. Rec. 2013, 2340, 10–19. [Google Scholar] [CrossRef]
  15. CFR. Title 40, Part 1065, Engine Testing Procedures, Subpart J—Field Testing and Portable Emission Measurement Systems. Available online: https://www.ecfr.gov/current/title-40/chapter-I/subchapter-U/part-1065/subpart-J (accessed on 22 February 2026).
  16. Vlachos, T.G.; Bonnel, P.; Perujo, A.; Weiss, M.; Mendoza Villafuerte, P.; Riccobono, F. In-Use Emissions Testing with Portable Emissions Measurement Systems (PEMS) in the Current and Future European Vehicle Emissions Legislation: Overview, Underlying Principles and Expected Benefits. SAE Int. J. Commer. Veh. 2014, 7, 199–215. [Google Scholar] [CrossRef]
  17. Garg, A.; Chaudhary, M.; Garg, C. Global Impact of Carbon Emissions and Strategies for Its Management; IGI Global Scientific Publishing: Hershey, PA, USA, 2024; pp. 75–107. [Google Scholar] [CrossRef]
  18. Ropkins, K.; Li, H.; Burnette, A. Next Generation (Smaller, Lower Cost, Lower Energy Consumption) PEMS. In PEMS Conference and Workshop; UCR CE-CERT: Riverside, CA, USA, 2016; Available online: https://eprints.whiterose.ac.uk/id/eprint/123692/ (accessed on 22 February 2026).
  19. Jiang, Y.; Johnson, K.C.; Durbin, T.D.; Karavalakis, G.; Jiang, Y.; Miller, J.W.; Cocker, D.R., III. Evaluation of NGK Spark Plug Compact Emission Measurement System (NCEM). In 7th International PEMS Conference; University of California: Riverside, CA, USA, 2017; Available online: https://www.cert.ucr.edu/sites/default/files/2020-07/9_-_yang_pems_v1.pdf (accessed on 1 March 2026).
  20. Lv, Z.; Zhang, Y.; Ji, Z.; Deng, F.; Shi, M.; Li, Q.; He, M.; Xiao, L.; Huang, Y.; Liu, H.; et al. A real-time NOx emission inventory from heavy-duty vehicles based on on-board diagnostics big data with acceptable quality in China. J. Clean. Prod. 2023, 422, 138592. [Google Scholar] [CrossRef]
  21. Yang, J.; Durbin, T.D.; Jiang, Y.; Tange, T.; Karavalakis, G.; Cocker, D.R.; Johnson, K.C. A comparison of a mini-PEMS and a 1065 compliant PEMS for on-road gaseous and particulate emissions from a light duty diesel truck. Sci. Total Environ. 2018, 640–641, 364–376. [Google Scholar] [CrossRef] [PubMed]
  22. Domínguez, D.E.C.; Lehmann, S.; López, V.V.; Palocz-Andresen, M. Micro PEMS for the Control of Emissions in Cars. In International Climate Protection; Palocz-Andresen, M., Szalay, D., Gosztom, A., Sípos, L., Taligás, T., Eds.; Springer International Publishing: Cham, Switzerland, 2019; pp. 247–253. [Google Scholar] [CrossRef]
  23. Vojtisek-Lom, M.; Zardini, A.A.; Pechout, M.; Dittrich, L.; Forni, F.; Montigny, F.; Carriero, M.; Giechaskiel, B.; Martini, G. A miniature Portable Emissions Measurement System (PEMS) for real-driving monitoring of motorcycles. Atmos. Meas. Tech. 2020, 13, 5827–5843. [Google Scholar] [CrossRef]
  24. Martin, C. On-Board Monitoring for EU7–Evolution vs. Revolution Expert Article; AVL: Graz, Austria, 2024; Available online: https://www.avl.com/en/expert-article/board-monitoring-eu7-evolution-vs-revolution (accessed on 30 September 2025).
  25. Garg, P.; Wang, S.; Oakes, J.M.; Bellini, C.; Gollner, M.J. Variations in gaseous and particulate emissions from flaming and smoldering combustion of Douglas fir and lodgepole pine under different fuel moisture conditions. Combust. Flame 2024, 263, 113386. [Google Scholar] [CrossRef]
  26. KEMET. Air Quality Sensor Carbon Monoxide USEQGCDAC8L100. Available online: https://www.arrow.com/es-mx/products/useqgcdac8l100/kemet-corporation (accessed on 27 February 2026).
  27. Winsen. ME2-CO-Φ14x5. One-Stop Sensor Solutions. Available online: https://www.winsen-sensor.com/product/me2-co-%CF%8614x5.html (accessed on 17 February 2026).
  28. Winsen. MP-9 CO/CH4. Available online: https://www.winsen-sensor.com/product/mp-9.html (accessed on 28 June 2024).
  29. Bosch, R. Exhaust-Gas Treatment NOx Sensor EGS-NX. Bosh Mobility Solutions. Available online: https://www.bosch-mobility.com/en/solutions/sensors/nox-sensor/ (accessed on 16 February 2026).
  30. HORIBA. MEXA-1170HCLD Heated Type NOx Analyzer. HORIBA for Mobility. Available online: https://www.horiba.com/esp/mobility/products/detail/action/show/Product/mexa-1170hcld-107/ (accessed on 27 February 2026).
  31. Winsen. ZMHS10-All-in-One Air Quality Sensor: PM2.5, CO2, AQS, Temperature and Humidity. 2025. Available online: https://www.winsen-sensor.com/product/zmhs10.html (accessed on 27 February 2026).
  32. NANOZ. The Smallest Selective Gas Sensor You Have Seen so Far. Available online: http://nanoz-group.eu/ (accessed on 15 February 2026).
  33. UST. UST Triplesensor Gas Sensor Element 3A4P10 2T. 2022. Available online: https://www.umweltsensortechnik.de/fileadmin/assets/downloads/gassensoren/mehrfach/DataSheet-3A4P10-2T_Rev2203.pdf (accessed on 4 January 2026).
  34. Ponzoni, A.; Comini, E.; Concina, I.; Ferroni, M.; Falasconi, M.; Gobbi, E.; Sberveglieri, V.; Sberveglieri, G. Nanostructured metal oxide gas sensors, a survey of applications carried out at SENSOR lab, brescia (Italy) in the security and food quality fields. Sensors 2012, 12, 17023–17045. [Google Scholar] [CrossRef] [PubMed]
  35. Staerz, A.; Weimar, U.; Barsan, N. Current state of knowledge on the metal oxide based gas sensing mechanism. Sens. Actuators B Chem. 2022, 358, 131531. [Google Scholar] [CrossRef]
  36. Chinh, N.D.; Quang, N.D.; Lee, H.; Hien, T.T.; Hieu, N.M.; Kim, D.; Kim, C.; Kim, D. NO gas sensing kinetics at room temperature under UV light irradiation of In2 O3 nanostructures. Sci. Rep. 2016, 6, 35066. [Google Scholar] [CrossRef] [PubMed]
  37. Hong, G.-H.; Le, T.-C.; Lin, G.-Y.; Cheng, H.-W.; Yu, J.-Y.; Dejchanchaiwong, R.; Tekasakul, P.; Tsai, C.-J. Long-term field calibration of low-cost metal oxide VOC sensor: Meteorological and interference gas effects. Atmos. Environ. 2023, 310, 119955. [Google Scholar] [CrossRef]
  38. Khorramifar, A.; Karami, H.; Lvova, L.; Kolouri, A.; Łazuka, E.; Piłat-Rożek, M.; Łagód, G.; Ramos, J.; Lozano, J.; Kaveh, M.; et al. Environmental Engineering Applications of Electronic Nose Systems Based on MOX Gas Sensors. Sensors 2023, 23, 5716. [Google Scholar] [CrossRef] [PubMed]
  39. Solà-Penafiel, N.; Manyosa, X.; Navarrete, E.; Ramos-Castro, J.; Jiménez, V.; Bermejo, S.; Gracia, I.; Llobet, E.; Domínguez-Pumar, M. Acceleration and drift reduction of MOX gas sensors using active sigma-delta controls based on dielectric excitation. Sens. Actuators B Chem. 2022, 365, 131940. [Google Scholar] [CrossRef]
  40. Djedidi, O.; Djeziri, M.A.; Morati, N.; Seguin, J.L.; Bendahan, M.; Contaret, T. Accurate detection and discrimination of pollutant gases using a temperature modulated MOX sensor combined with feature extraction and support vector classification. Sens. Actuators B Chem. 2021, 339, 129817. [Google Scholar] [CrossRef]
  41. Sales, D.; Bello, A.J.; Sánchez-Alzola, A.; Martínez-Jiménez, P.M. An approximation for metal-oxide sensor calibration for air quality monitoring using multivariable statistical analysis. Sensors 2021, 21, 4781. [Google Scholar] [CrossRef] [PubMed]
  42. Wöhrl, T.; Moos, R.; Hagen, G. Analyzing the cross-sensitivities of a zeolite-based ammonia sensor for SCR systems for application in the flue gas of biogenic waste combustion. Sens. Actuators B Chem. 2025, 436, 137727. [Google Scholar] [CrossRef]
  43. Tereshkov, M.; Dontsova, T.; Saruhan, B. Metal Oxide-Based Sensors for Ecological Monitoring: Progress and Perspectives. Chemosensors 2024, 12, 42. [Google Scholar] [CrossRef]
  44. Romain, A.-C.; André, P.; Nicolas, J. Three years experiment with the same tin oxide sensor arrays for the identification of malodorous sources in the environment. Sens. Actuators B Chem. 2002, 84, 271–277. [Google Scholar] [CrossRef]
  45. Fraden, J. Handbook of Modern Sensors; Springer: Berlin/Heidelberg, Germany, 2016. [Google Scholar] [CrossRef]
  46. Dentoni, L.; Capelli, L.; Sironi, S.; Del Rosso, R.; Zanetti, S.; Della Torre, M. Development of an Electronic Nose for Environmental Odour Monitoring. Sensors 2012, 12, 14363–14381. [Google Scholar] [CrossRef] [PubMed]
  47. Cho, J.H.; Kim, Y.W.; Na, K.J.; Jeon, G.J. Wireless electronic nose system for real-time quantitative analysis of gas mixtures using micro-gas sensor array and neuro-fuzzy network. Sens. Actuators B Chem. 2008, 134, 104–111. [Google Scholar] [CrossRef]
  48. Umweltsensortechnik. Metal-Oxide(MOX) Gas Sensor Elements. Available online: https://www.umweltsensortechnik.de/en/gas-sensors/mox-gas-sensors-overview.html (accessed on 27 February 2026).
  49. Deckma. Deckma Hamburg. Available online: https://deckma.eu/ (accessed on 9 March 2023).
  50. Saupe, C.; Werner, R.; Atzler, F. Compact On-board Multi-gas Measuring System. MTZ Worldw. 2025, 86, 50–54. [Google Scholar] [CrossRef]
  51. Huertas, J.; Koch, T.; Atzler, F.; Többen, H. On-board Emission Conformity Monitoring (OBECOM) In Proceedings R 608. The FVV Transfer + Networking Event/Spring 2024; Tutsch, P., Nitsche, M., Eds.; FVV eV: Frankfurt, France, 2024; pp. 246–285. [Google Scholar]
  52. Halley, S.; Ramaiyan, K.P.; Tsui, L.; Garzon, F. A review of zirconia oxygen, NOx, and mixed potential gas sensors–History and current trends. Sens. Actuators B Chem. 2022, 370, 132363. [Google Scholar] [CrossRef]
  53. Giraldo, M.; Restrepo, J.; Huertas, J.; Agudelo, J.R.; Agudelo, A.F. Signal synchronization methods when measuring tailpipe emissions with PEMS. Transp. Res. D. Transp. Environ. 2024, 129, 104154. [Google Scholar] [CrossRef]
  54. KM77, Toyota RAV4 Hybrid 220H 4x2 Advance (2022–2025). Available online: https://www.km77.com/coches/toyota/rav4/2019/estandar/estandar/rav4-hybrid-220h-4x2-advance2/datos (accessed on 13 November 2023).
  55. Mitsubishi. Mitsubishi L200 Double Cab 2.5 DI-D M-PRO (2010–2010)|Precio y Ficha Técnica-km77.com. 2010, km77. Available online: https://www.km77.com/coches/mitsubishi/l200/2010/doble-cabina/m-pro/l200-double-cab-25-di-d-m-pro/datos (accessed on 7 October 2023).
  56. INECC. Portal de Indicadores de Eficiencia Energètica y Emisiones Veiculares. Available online: https://www.gob.mx/inecc/articulos/visita-el-sitio-web-ecovehiculos-gob-mx?idiom=es (accessed on 16 January 2024).
  57. Nissan. Manual Nissan NP300. Available online: https://www.nissan.com.mx/content/dam/Nissan/mexico/brochures/np300/MY20/np300_2020_catalogo.pdf (accessed on 16 January 2024).
  58. Advanced Engine Management. Installation Instructions for 30-4110 Gauge-Type UEGO Controller. No. 310. 2014, pp. 1–13. Available online: https://static.summitracing.com/global/images/instructions/avm-30-4110.pdf (accessed on 3 October 2022).
  59. Elm Electronics. ELM327 OBD to RS232 Interpreter. 2014, pp. 1–5. Available online: https://www.elmelectronics.com/wp-content/uploads/2016/07/ELM327DS.pdf (accessed on 7 November 2022).
  60. Maxim Integrated. Cold Junction Compensated K-Thermocouple. Maxim Dallas. 2021, p. 3. Available online: https://www.analog.com/media/en/technical-documentation/data-sheets/max6675.pdf (accessed on 8 February 2023).
  61. Bosch, M. Lambda Sensor LSU 4.9. 2010, pp. 16–18. Available online: https://www.bosch-motorsport.com/content/downloads/Raceparts/en-GB/51865867208058251.html (accessed on 5 October 2022).
  62. Ysart, D. Sensores Resistivos de Nanofibras de Dióxido de Estaño Para la Detección de Ozono. 2020. Available online: http://oa.upm.es/65018/1/TFG_DIEGO_ROBES_YSART.pdf (accessed on 15 July 2024).
  63. SENSIRION. Sensirion SHT41. SENSIRION. CMOSens Is a Trademark of Sensirion. Available online: https://sensirion.com/products/catalog/SHT41 (accessed on 28 February 2026).
  64. STMicroelectronics. LPS22HB MEMS Nano Pressure Sensor: 260–1260 hPa Absolute Digital Output Barometer. STMicroelectronics. Available online: https://www.st.com/en/mems-and-sensors/lps22hb.html (accessed on 28 February 2026).
  65. DieselNet. EU: Cars and Light Trucks. Available online: https://dieselnet.com/standards/eu/ld.php (accessed on 7 June 2025).
  66. SEMARNAT042, NOM-042-SEMARNAT-2003. Diario Oficial de la Federacion. Available online: https://dof.gob.mx/nota_detalle.php?codigo=2091196&fecha=07/09/2005 (accessed on 17 February 2026).
  67. EPA. Data on Cars used for Testing Fuel Economy; U.S. Environmental Protection Agency: Washington, DC, USA, 2026. Available online: https://www.epa.gov/compliance-and-fuel-economy-data/data-cars-used-testing-fuel-economy (accessed on 22 February 2026).
  68. Roy, F.; Morency, C. Comparing Driving Cycle Development Methods Based on Markov Chains. Transp. Res. Rec. 2021, 2675, 212–221. [Google Scholar] [CrossRef]
  69. Huertas, J.; Lázaro, J.; Ramírez, J. Driving Patterns; Springer: Berlin/Heidelberg, Germany, 2025; pp. 17–39. [Google Scholar] [CrossRef]
  70. Montufar, P.; Huertas, J.; Cuisano, J.; Perez, J. Development of a micro-trip driving cycle and obtaining emission factors. Cienc. Téc. Y Apl. Artíc. De Investig. 2021, 7, 1001–1019. [Google Scholar]
  71. Solano, F.; Huertas, J. Engine Model for Real-Driving Emissions Calculation; Instituto Tecnológico y de Estudios Superiores de Monterrey: Monterrey, Mexico, 2021; Available online: https://hdl.handle.net/11285/648419 (accessed on 12 September 2022).
  72. Serrano, O.; Huertas, J.; Quirama, L.; Mogro, A. Energy Efficiency of Heavy-Duty Vehicles in Mexico. Energies 2023, 16, 459. [Google Scholar] [CrossRef]
  73. EU Commission. European Commission Proposes Euro 7/VII Emission Standards. EU Emission Standards, Dieselnet. Available online: https://dieselnet.com/news/2022/11eu.php (accessed on 24 August 2025).
  74. European Union. European Union Law. Directiva 70/220/CEE. Available online: https://eur-lex.europa.eu/eli/dir/1970/220/oj (accessed on 15 February 2026).
  75. Castillo, J.C.; Huertas, J.I.; Giraldo, M.; Agudelo, A.F.; Quirama, L.F. Equivalent motorcycle fuel consumption and emission maps. Energy Convers. Manag. X 2026, 31, 101951. [Google Scholar] [CrossRef]
Figure 1. Illustration of the working principle of the proposed µPEMS based on OBD data and MOX sensors.
Sensors 26 04333 g001
Figure 2. Block diagram of the embedded system for the measurement of CO, NOx, and CO2 concentrations at tailpipe conditions based on MOX sensors.
Sensors 26 04333 g002
Figure 3. Installation of measurement equipment in the test vehicles. (a) General view of the measurement system in a diesel vehicle; (b) general view of the measurement system in a gasoline vehicle; (c) detailed view of each sensor; (d) detailed view of the measurement system in a HEV.
Sensors 26 04333 g003
Figure 4. Measured variables during the on-road tests in a HEV. (a) OBD measurements for speed (dark green line) and altitude (orange line). (b) Location (latitude, longitude), including NOx emissions measured by the PEMS, plotted on the city map where the RDE test was conducted. (c) Oxygen (bright blue line), relative humidity (gray line), and exhaust gas temperature (red line) were measured by the PEMS. (d) NOx concentrations obtained with the PEMS (light green line) and with the MOX sensor (light orange line). (e) NOx concentrations obtained with the PEMS (light green line) and with the MOX sensor after applying a natural logarithm to the data (purple line). (f) CO concentrations measured by the PEMS (gray line) and by the MOX sensor (orange line). (g) CO concentrations measured by the PEMS (gray line) and by the MOX sensor after applying a natural logarithm to the data (green line). (h) Engine RPM (black line) and torque (red line).
Sensors 26 04333 g004aSensors 26 04333 g004b
Figure 5. Determination of average time window and data synchronization between fuel consumption, NOx, and CO emissions for gasoline, diesel, and HEVs.
Sensors 26 04333 g005
Figure 6. HEV test. The time window t (s) < 5000 was considered for the analysis. (a) Concentration profiles of the NOx PEMS as the reference instrument (blue line) and the natural logarithm of the NOx-sensitive layer (orange line). (b) NOx concentration profiles measured by the PEMS reference instrument (blue line) and by the MOX sensor after applying the linear combination model (red line).
Sensors 26 04333 g006
Figure 7. HEV test. Performance of the zirconia-based electrochemical NOx sensor. (a) Concentration profiles of the NOx PEMS as the reference instrument (blue line) and the zirconia-based electrochemical NOx sensor (orange line); (b) concentration profiles of the NOx PEMS as the reference instrument (blue line) and the zirconia-based electrochemical NOx sensor after applying the linear combination model (green line).
Sensors 26 04333 g007
Figure 8. On-road NOx mass emissions of HEVs. (a) NOx mass flow rate monitored by the PEMS (blue line) and the MOX-µPEMS (orange line). (b) Correlation of NOx mass flow rate: PEMS vs. MOX-µPEMS. (c) Correlation of accumulated NOx mass: PEMS vs. MOX-µPEMS. (d) Correlation of NOx mass flow rate (MOX-µPEMS vs. PEMS). (e) Correlation of accumulated NOx mass, with NOx-µPEMS on the x-axis and PEMS on the y-axis.
Sensors 26 04333 g008
Table 1. Sensors to measure CO and NOx at tailpipe conditions; * indicates methods approved by the USEPA.
GasWorking PrincipleOperating ConditionsAdvantagesDisadvantagesPrice
USD
Size (Bore & Length)Source
CONDIR *Operating temperature: −40 to 85 °C.High precision and selectivity.
Fast response.
Sensitivity to humidity and temperature.1165 9.13 × 17.5 mmUSEQGCDAC8L100 made by KEMET, Phoenix, USA [26]
ElectrochemicalOperating temperature: −20 to 80 °C.
Relative
humidity: 15–90% RH
Low consumption, wide linear range.
Excellent repeatability and stability.
Limited useful life.
Potential cross-sensitivity.
Detection range: 0–10,000 ppm.
N/A16.7 × 10.8 mmCO sensor ME2-CO-Φ14 × 5 made by Winsen, Zhengzhou, China [27]
CO, CH4MOS
sensitivity CO, CH4
Operating temperature:
−10 to 50 °C.
Relative humidity: less than 95%RH
Low-cost.
Small sizes.
Long lifespan.
Detection range: 50–1000 ppm CO, and 300–10,000 ppm CH4.
Exposure to corrosive gases, such as SOx, reduces its sensitivity.
Keep them unused for a long time.
1.8 9.4 × 7.5 mmMP-9 CO, CH4 semiconductor made by Winsen, Zhengzhou, China [28]
NOxAmperometric double chamber principleOperating temperature: 0 to 850 °C.Detection range: 0–3000 ppm.
High lifetime: 15,000 h.
Medium cost.560 20 × 80 mmEGS-NX made by Bosch, Gerlingen-Schillerhöhe, Germany
[29]
Chemiluminescence detection (heated) *Ambient temperature:
5–40 °C.
Humidity: under 80%RH
Detection range: 10–10,000 ppm.
High accuracy.
High selectivity.
High durability.
Expensive.
Requires frequent calibration.
>100,000508(W) × 690(D) × 143(H) mmMEXA-1170HCLDA made by HORIBA, Kyoto, Japon [30]
MOSOperating temperature: −40 to 125 °C.Detects multiple gases, such as CO, NO, and NH3.
Preheating time: 30 s.
Detection range:
CO 1~5000 ppm, NOx 0~10 ppm, and
NH3 1~300 ppm.
37 N/AZMHS10 semiconductor made by Winsen, Zhengzhou, China [31]
MOX-NanozOperating temperature: 0 to 80 °C.Detection range: NOx (0–3000 ppm), and CO (0–50,000 ppm).
Small size and low power consumption.
Expensive.300,000N/A Made by Nanoz, Rousset, PACA, France [32]
MOX-UST (Umweltsensortechnik)Operating temperature: 0 to 150 °C for a short time.Detects multiple gases, such as CO, CH4, C3H8, and NO2. Economic, small, and does not need continuous calibration.
High durability (up to 10 thousand hours).
Cross-sensitivity issues.
Takes about 10 min to reach proper operating temperature.
1108 × 24 mm3A4P-UST Triplesensor made by UST Geratal Germany [33]
Table 2. Technical characteristics of the vehicles used for the on-road tests. Sources: [54,55,56,57].
ModelMitsubishi L200/4WD/4CILNissan NP300/4 × 2/4CILToyota RAV 4 Hybrid 22H/4 × 4/4CIL
Model year201020192023
Type of vehiclePick-upPick-upSUV
Engine modelNot availableQR25A25A-FXS
Compression ratio17.5:110:114:1
Displacement2500 cm32500 cm32500 cm3
Max power100 KW at 4000 rpm122.1 KW at 6000 rpm130 kW at 6000 rpm
Max torque314 Nm at 2000 rpm241.33 Nm at 4000 rpm221 Nm at 3600–5200 rpm
FuelDiesel cetane 45Gasoline octane 92Gasoline octane 87
Exhaust certificationEURO 4NOM-042-SEMARNAT-2003EURO 6d
Driving cycleOn-roadOn-roadOn-road
Table 3. Technical characteristics of the measurement systems installed on the tailpipes of vehicles to measure the real mass emissions of vehicles. Sources: [29,33,58,59,60,61,62,63,64].
Measurement SystemOperating PrincipleVariable to be MeasuredRangeAccuracy
AVL MOVE iS+ PEMS made by AVL List GmbH, Graz, AustriaNDIRCO20 to 20%±2% relative
NDIRCO0 to 5%±2% relative
NDUVNO0 to 5000 ppm±2% relative
NDUVNO20 to 2500 ppm±2% relative
Pitot tubeExhaust flow meter50…2200 kg/h±2% of reading or ±0.5% of full scale, whichever is greater
Photoacoustic measurement & gravimetric filter moduleParticulate matter (PM)1000 mg/m31 µg/m3
MOX-µPEMSMultiple metal oxide semiconductorsCO50…3500 kΩN/A
NO230…3000 kΩN/A
CH4, C3H830…3500 kΩN/A
CMOSens, SHT41 made by Sensirion AG, Stäfa, SwitzerlandHumidity
Temperature
0 to 100%RH
−40 to 125 °C
±1.8%RH
±0.2 °C
Ultra-compact piezoresistive, LPS22HB made by ST Arizona, USAPressure
Temperature
26 to 126 kPa
−40 to 125 °C
±0.1 kPa
±0.2 °C
NOx-µPEMSAmperometric double-chamber principle, Bosch NOx sensor EGS-NX2NOx0 to 1650 ppm±10 ppm new/±12 ppm used
Planar ZrO2 dual cell limiting current sensor, Bosch LSU4.9 UEGO sensorAir/fuel ratioLambda 0.65 to ∞, gasoline or diesel automotive engine±0.7%
Type-K Thermocouple made by Analog Devices Wilmington, MA, USASeebeck effectExhaust gases temperature0 to +1024 °C0.25 °C
OBD made by Elm Electronics, Ontario, CANInventure CAN reader, ELM 327Raw CAN bus dataN/AN/A
Table 4. Determination coefficients obtained by predicting the NOx concentration using Equation (6) in road tests with diesel, gasoline, and hybrid gasoline–electric vehicles. Note: 1: response of the heated MOX sensor at 350 °C; 2: response of the heated MOX sensor at 425 °C.
Regression Statistics
Diesel VehicleGasoline VehicleHEV
Calibration VersionNOx-µPEMSNOx-µPEMSMOX-µPEMS
Multiple R0.9770.9800.932
R-Square0.9550.9610.87
Adjusted R-Square0.8990.7640.682
Standard Error12.31513.7584.032
Observations191318
Coefficientp-ValueCoefficientp-ValueCoefficientp-Value
Intercept6715.7760.245−15,642.290.306−342.3590.343
RH%20.6020.1702.330.3700.0940.743
RH% Temperature12.4810.09635.380.2760.3520.917
Pressure Temperature−4.5080.340−24.670.3180.3220.924
Pressure Absolute−7.9530.15615.910.3100.3170.364
ln (CH/CHref) 1−0.0570.098−0.130.9924.0240.166
ln (CO/COref) 1−0.0090.181−0.840.6941.1830.677
ln (NOx/NOxref) 10.0030.0985.100.09911.4300.293
ln (CH’s/CH’sref) 2−0.3010.722−21.990.18613.0300.070
ln (CO/COref) 2−0.0080.9463.760.149−10.8680.022
ln (NOx/NOxref) 20.1040.056−1.890.079−11.2890.084
Table 5. CO and NOx emission indices obtained by RDE tests for diesel, gasoline, and HEVs tested in this study. a: Euro 4 emission standards, for compression ignition (diesel); N1, class III > 1760 kg. b: Euro 7 emission standards, for positive ignition (gasoline); N1, class III > 1760 kg. c: Euro 7 emission standards, for positive ignition (gasoline); N1, class II (1305–1760) kg. d: Maximum emission limits for light-duty vehicles under the National Regulation Standard C (NOM-042-SEMARNAT-2003). Sources: [56,65,66,67].
Source NOx (mg/km) CO (mg/km)
DieselGasolineHEVHEV
Monitored with AVL MOVE iS+ PEMSN/AN/A10.4470
Monitored with MOX-µPEMS701783.810.5483
Monitored with NOx-µPEMS759583.611.0N/A
Manufacturer-provided data for compliance certification487113.011.4457
National regulations250 d80.0 d80.0 d1000 d
Maximum emission limits for LDVs under EU standards390 a82.0 b75.0 c1810 c
Disclaimer/Publisher’s Note: The statements, opinions and data contained in all publications are solely those of the individual author(s) and contributor(s) and not of MDPI and/or the editor(s). MDPI and/or the editor(s) disclaim responsibility for any injury to people or property resulting from any ideas, methods, instructions or products referred to in the content.