Diode-Laser-Based Raman Spectroscopy Applied to the Thermodynamic Characterization of Natural Gas and Hydrogen-Enriched Natural Gas
 , , ,
, , , 
Highlights
- A Raman-based instrument was developed for in-line compositional analysis of natural gas and hydrogen-enriched natural gas, enabling continuous calculation of gas-quality parameters such as higher heating value.
- The system was validated under industrially relevant conditions, achieving OIML R 140 Class A performance over a wide pressure and temperature range without carrier gases or sample manipulation.
- The results demonstrate that Raman spectroscopy can provide a robust and low-maintenance alternative for distributed natural-gas-quality monitoring in transportation and distribution networks.
- The instrument supports real-time monitoring of hydrogen blending and variable gas compositions, contributing to safer and more flexible operation of future gas infrastructures.
Abstract
1. Introduction
2. Natural Gas Analyzers: State of the Art
3. Materials and Methods
3.1. Opto-Mechanical Realization
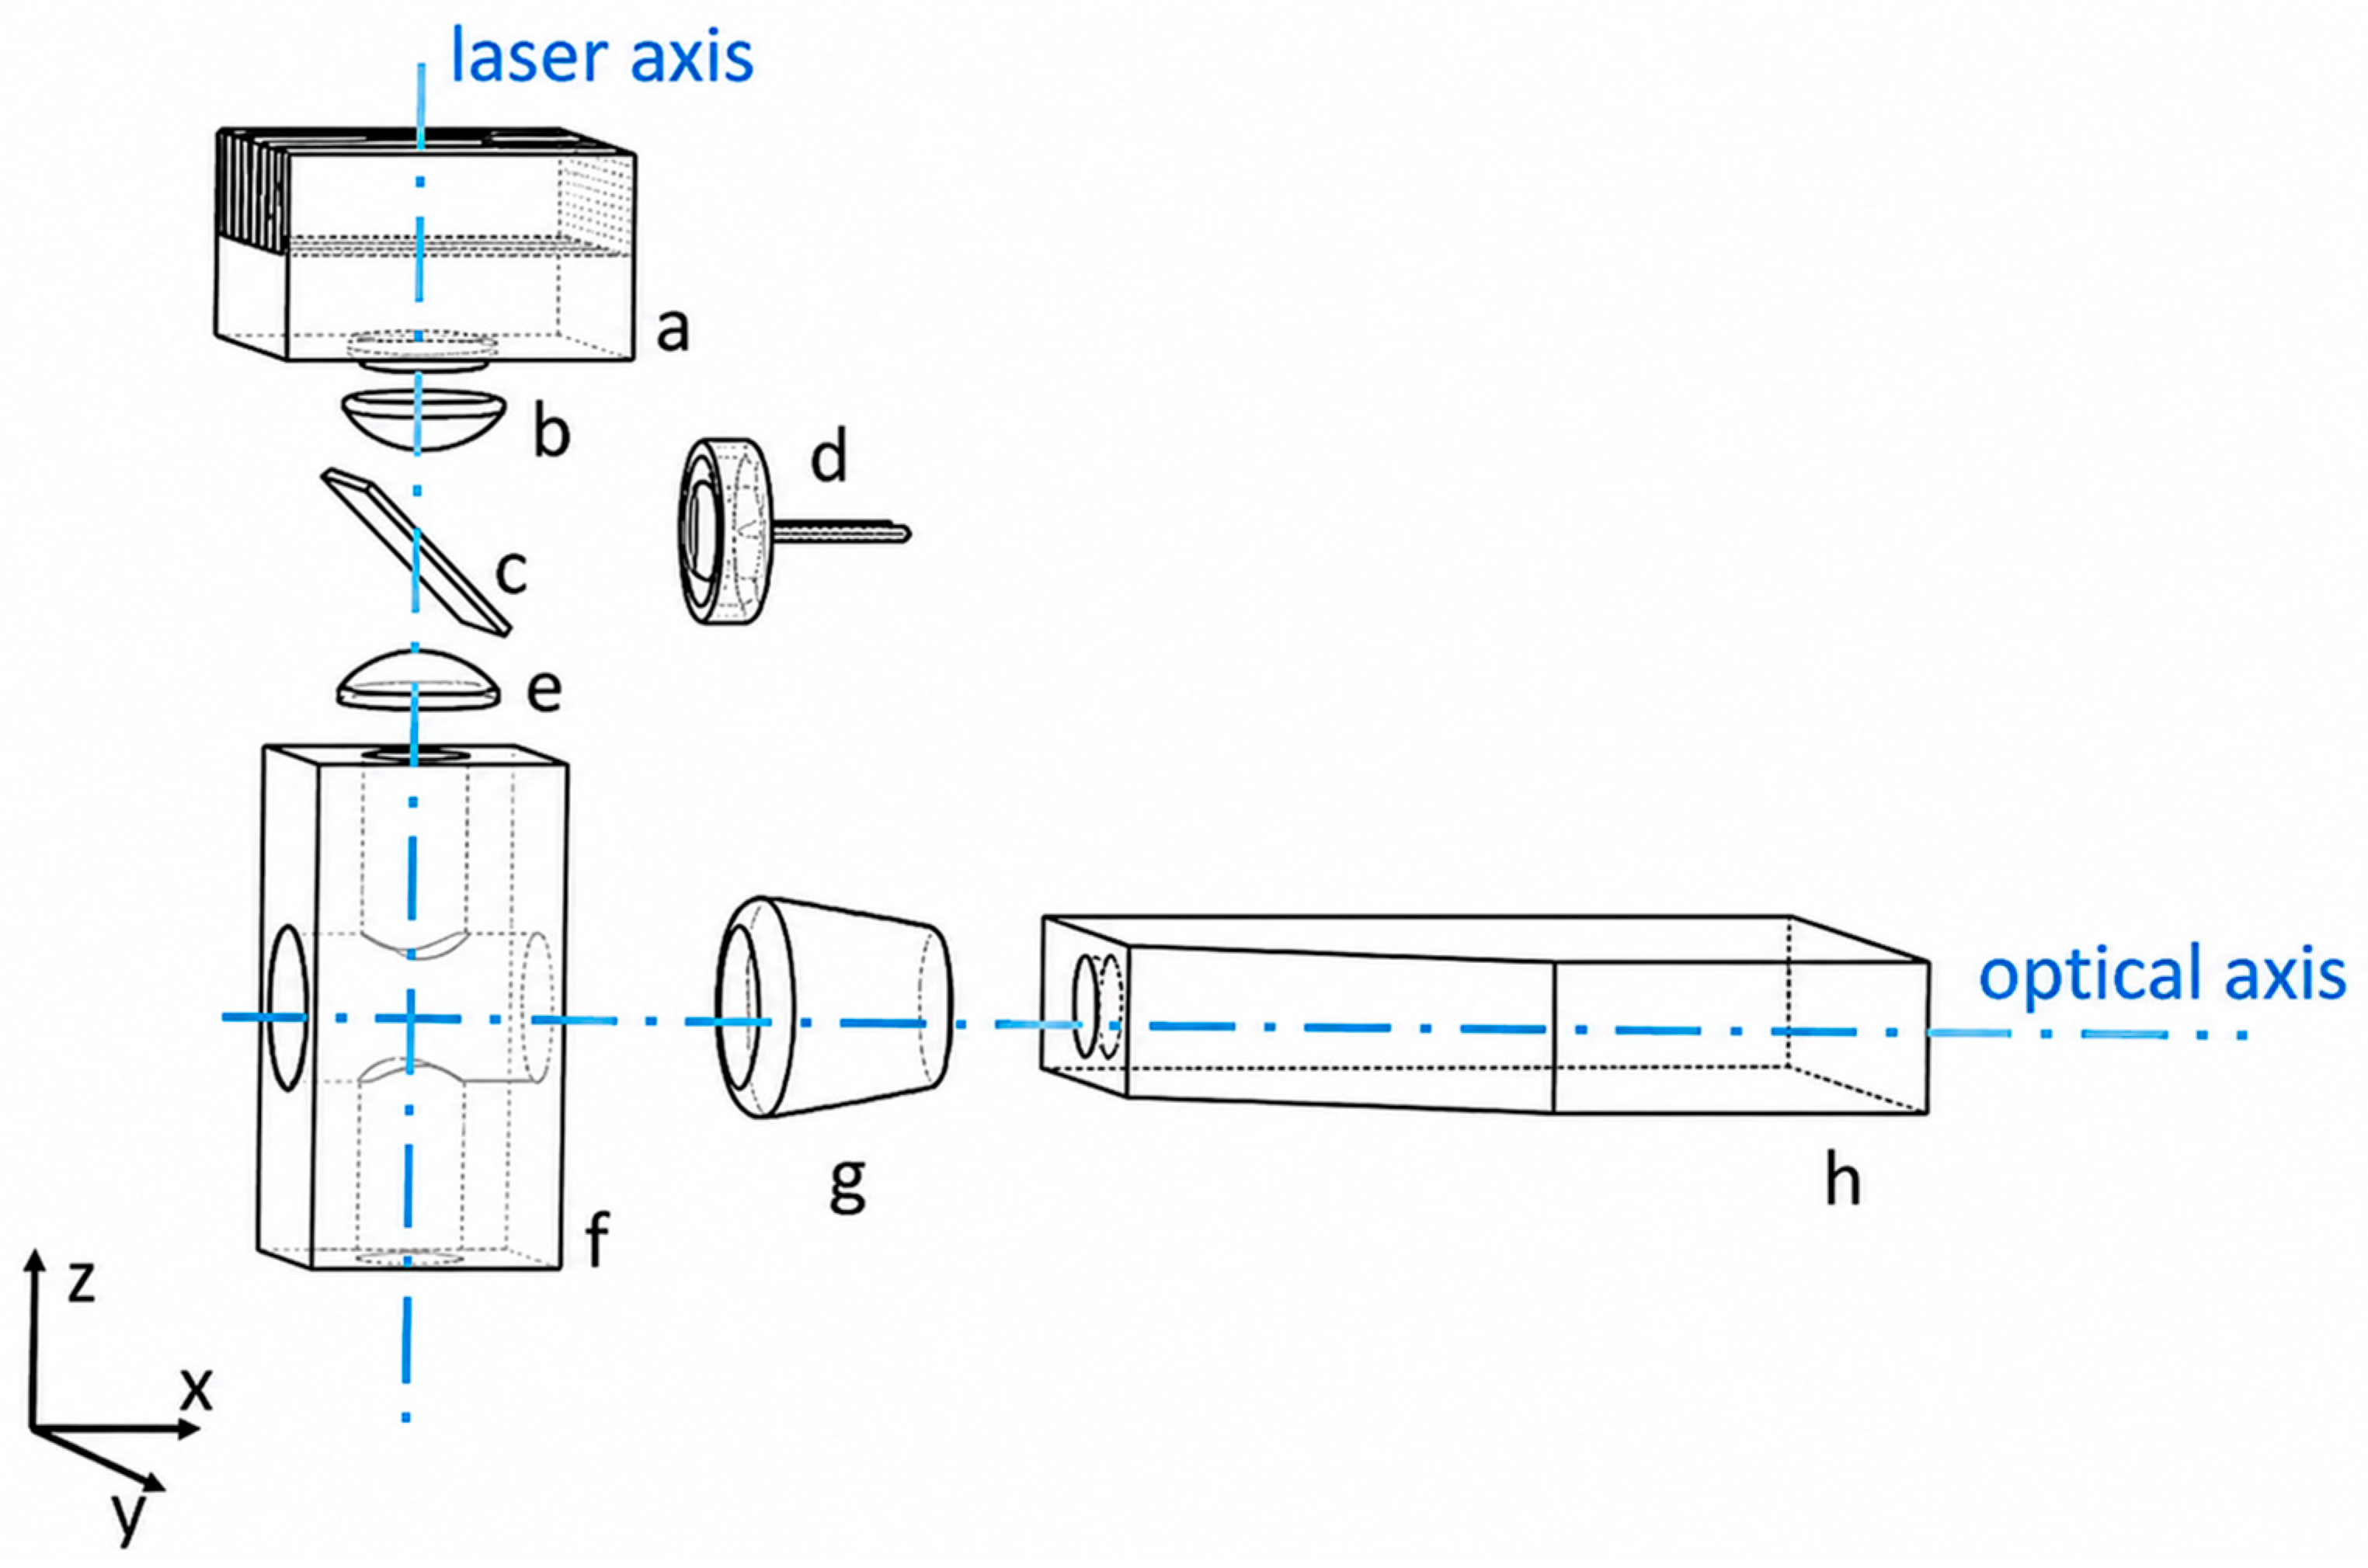
- (a)
- Laser source section. The laser diode is mounted in a custom designed TEC module (Copper housing). The beam propagates along the laser axis with polarization orthogonal to the optical axis, ensuring stable coupling into the optical system. The TEC stabilizes the temperature at 35 °C and drives the diode at 1.5 A, providing about 2 W optical power.
- (b)
- Collimation lens. Due to the high beam divergence and small emitter size, a ½″ diameter, 20 mm focal length lens is mounted directly on the TEC housing to efficiently collimate the laser beam.
- (c)
- Beam splitter. Positioned in the collimated beam path, it splits ~4% of the optical power toward a photodiode for real-time source monitoring.
- (d)
- Photodiode. The deflected beam fraction is measured by a photodiode to provide real-time laser-power monitoring for spectral normalization, as well as diagnostics for possible source degradation.
- (e)
- Focusing lens. A 1″ diameter, 50 mm focal length lens focuses the beam at the center of the gas cell, generating a ~150 µm waist and an interaction length of ~8 mm for Raman scattering.
- (f)
- Gas cell. This is the only component in contact with the sample and is designed for operation up to 17 absolute bar (bara), enabling direct integration into NG networks without depressurization. 1″ diameter broadband-coated optical windows allow Raman signal collection while minimizing stray light. The transmitted beam is terminated in a built-in beam dump integrated into the gas outlet; the adopted design improves robustness and eliminates additional optical components [41]. Before entering the cell, the gas sample passes through porous filters to remove suspended particulate matter that could generate strong spurious signals.
- (g)
- Coupling optics. The laser–gas interaction region is imaged onto the entrance plane of the spectrometer by two lenses giving a 2× demagnification factor and f/3.2 aperture; that is the effective collecting angle of the overall system.
- (h)
- Spectrometer. The Raman spectrum is acquired by a lens-based Czerny–Turner spectrometer, featuring an effective f/2.0 aperture, a 460 nm long-pass filter to block the intense Rayleigh scattering from the fundamental, a 1200 grooves/mm diffraction grating giving an average spectral dispersion of 20 nm/mm. The spectrum is finally acquired by an uncooled CMOS sensor (1936 × 1216 pixels, 5.86 µm pitch). This configuration enables detection from the filter cut-off to beyond the H2 Raman line at 4156 cm−1.
3.2. Data Acquisition and Spectral Processing
3.3. Validation Procedure
4. Results and Discussion
5. Conclusions
6. Patents
Author Contributions
Funding
Institutional Review Board Statement
Informed Consent Statement
Data Availability Statement
Conflicts of Interest
Abbreviations
| ATEX | Atmosphères Explosibles |
| BAL | Balance |
| bara | Absolute bar |
| CMOS | Complementary Metal–Oxide–Semiconductor |
| DPSS | Diode-Pumped Solid-State |
| FTIR | Fourier Transform Infrared |
| GC | Gas Chromatography |
| HHV | Higher Heating Value |
| HNG | Hydrogen-Enriched Natural Gas |
| ISO | International Organization for Standardization |
| LNG | Liquefied Natural Gas |
| LOD | Limit of Detection |
| MEMS | Micro-Electro-Mechanical Systems |
| NG | Natural Gas |
| OIML | International Organization of Legal Metrology |
| TCD | Thermal Conductivity Detector |
| TDLAS | Tunable Diode Laser Absorption Spectroscopy |
| TEC | Thermo-Electric Cooler |
Appendix A

| T [°C] | CH4 [%] | C2H6 [%] | C3H8 [%] | n-C4H10 [%] | i-C4H10 [%] | N2 [%] | CO2 [%] | H2 [%] | HHV [kJ/m3] |
|---|---|---|---|---|---|---|---|---|---|
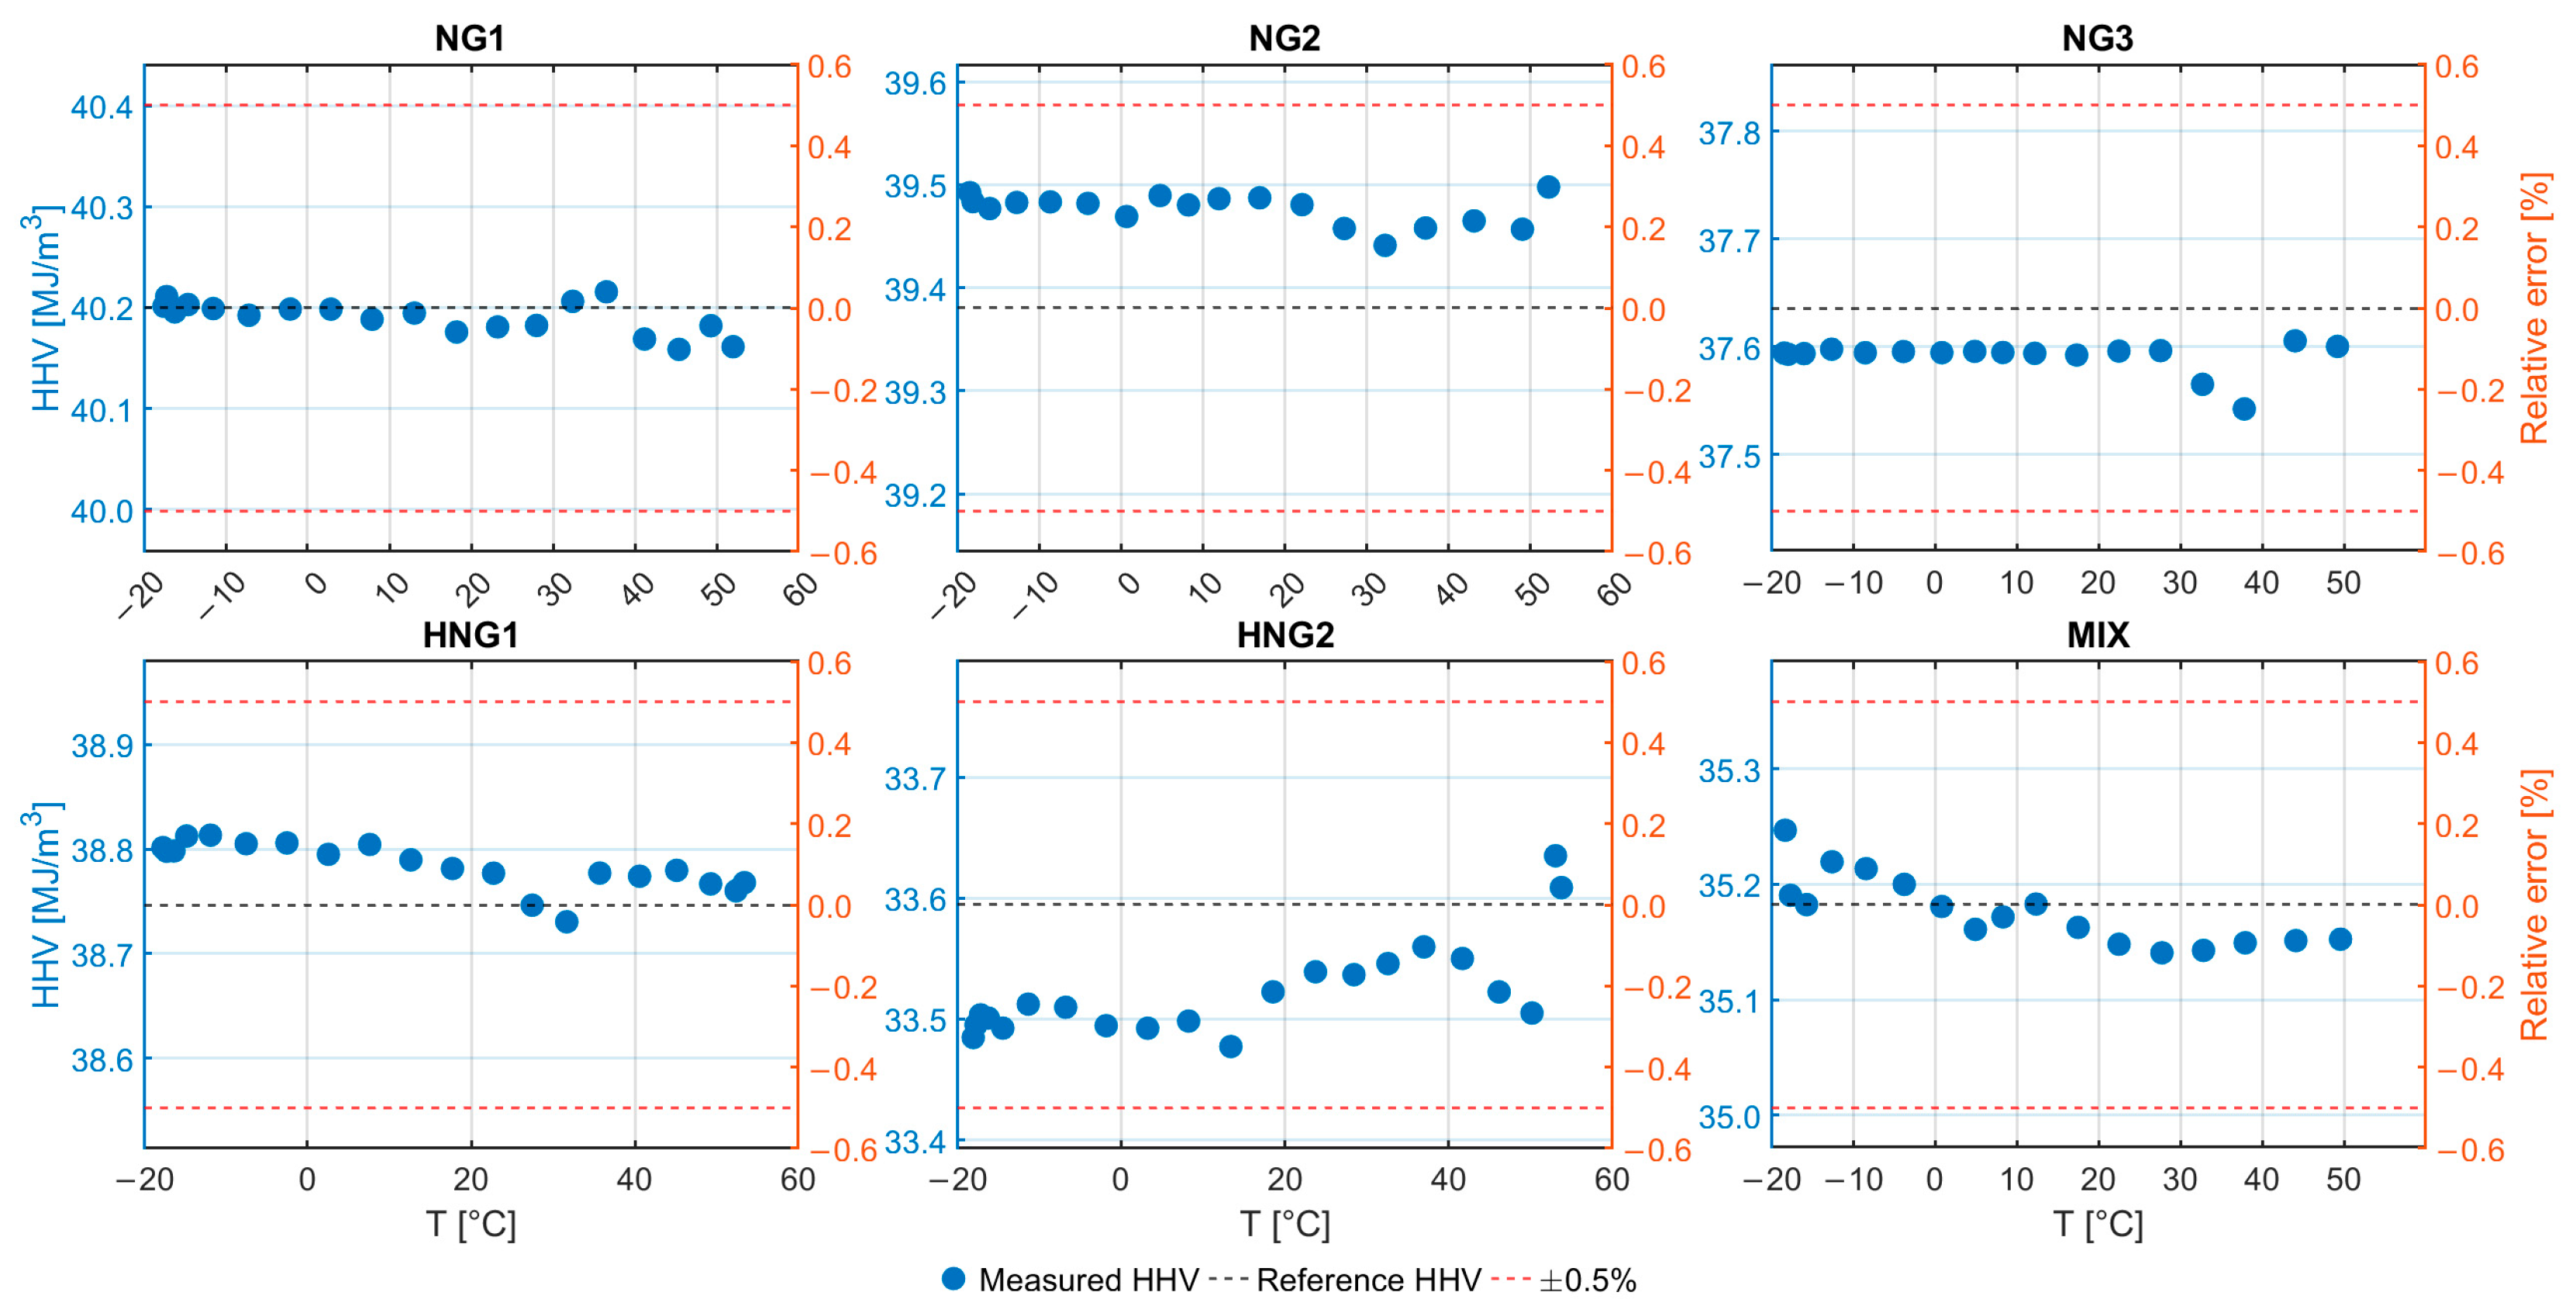
| −18 | 84.98 | 9.00 | 1.24 | 0.62 | 0.16 | 2.64 | 1.37 | 0.00 | 40,201.3 |
| −17 | 84.97 | 9.00 | 1.25 | 0.62 | 0.16 | 2.64 | 1.36 | 0.00 | 40,210.9 |
| −16 | 85.02 | 8.97 | 1.24 | 0.63 | 0.15 | 2.63 | 1.37 | 0.00 | 40,195.7 |
| −15 | 84.96 | 8.98 | 1.26 | 0.62 | 0.17 | 2.63 | 1.39 | 0.00 | 40,203.0 |
| −12 | 85.03 | 8.96 | 1.24 | 0.69 | 0.09 | 2.62 | 1.36 | 0.00 | 40,199.0 |
| −7 | 84.89 | 8.97 | 1.29 | 0.59 | 0.19 | 2.62 | 1.46 | 0.00 | 40,192.4 |
| −2 | 84.94 | 8.96 | 1.30 | 0.61 | 0.15 | 2.59 | 1.44 | 0.00 | 40,198.5 |
| 3 | 84.96 | 8.96 | 1.28 | 0.66 | 0.11 | 2.60 | 1.43 | 0.00 | 40,198.4 |
| 8 | 84.89 | 8.97 | 1.32 | 0.60 | 0.15 | 2.60 | 1.48 | 0.00 | 40,188.4 |
| 13 | 84.93 | 8.97 | 1.30 | 0.66 | 0.10 | 2.59 | 1.45 | 0.00 | 40,194.5 |
| 18 | 84.86 | 8.98 | 1.32 | 0.59 | 0.15 | 2.60 | 1.50 | 0.00 | 40,175.8 |
| 23 | 84.85 | 8.99 | 1.33 | 0.61 | 0.13 | 2.60 | 1.50 | 0.00 | 40,180.8 |
| 28 | 84.85 | 9.00 | 1.33 | 0.59 | 0.13 | 2.58 | 1.50 | 0.00 | 40,182.3 |
| 32 | 84.94 | 9.02 | 1.31 | 0.65 | 0.08 | 2.52 | 1.48 | 0.00 | 40,206.1 |
| 37 | 85.05 | 9.04 | 1.28 | 0.72 | 0.00 | 2.47 | 1.45 | 0.00 | 40,215.6 |
| 41 | 84.96 | 9.01 | 1.31 | 0.59 | 0.11 | 2.55 | 1.47 | 0.00 | 40,168.8 |
| 45 | 84.94 | 9.07 | 1.29 | 0.59 | 0.09 | 2.58 | 1.44 | 0.00 | 40,158.6 |
| 49 | 85.02 | 9.09 | 1.21 | 0.72 | 0.00 | 2.59 | 1.36 | 0.00 | 40,182.0 |
| 52 | 85.02 | 9.09 | 1.23 | 0.63 | 0.06 | 2.60 | 1.37 | 0.00 | 40,161.2 |
| T [°C] | CH4 [%] | C2H6 [%] | C3H8 [%] | n-C4H10 [%] | i-C4H10 [%] | N2 [%] | CO2 [%] | H2 [%] | HHV [kJ/m3] |
|---|---|---|---|---|---|---|---|---|---|
| −18 | 91.49 | 5.20 | 0.83 | 0.48 | 0.09 | 0.99 | 0.93 | 0.00 | 39,492.2 |
| −18 | 91.46 | 5.20 | 0.83 | 0.48 | 0.08 | 1.00 | 0.94 | 0.00 | 39,483.4 |
| −16 | 91.45 | 5.21 | 0.85 | 0.46 | 0.09 | 0.99 | 0.95 | 0.00 | 39,476.7 |
| −13 | 91.39 | 5.21 | 0.86 | 0.47 | 0.09 | 1.01 | 0.97 | 0.00 | 39,482.7 |
| −9 | 91.30 | 5.22 | 0.89 | 0.43 | 0.13 | 1.00 | 1.03 | 0.00 | 39,483.2 |
| −4 | 91.29 | 5.23 | 0.90 | 0.43 | 0.12 | 0.99 | 1.04 | 0.00 | 39,481.8 |
| 1 | 91.27 | 5.21 | 0.90 | 0.44 | 0.12 | 0.99 | 1.07 | 0.00 | 39,469.0 |
| 5 | 91.28 | 5.22 | 0.90 | 0.45 | 0.11 | 0.99 | 1.05 | 0.00 | 39,489.4 |
| 8 | 91.16 | 5.24 | 0.94 | 0.39 | 0.16 | 1.00 | 1.11 | 0.00 | 39,480.3 |
| 12 | 91.16 | 5.24 | 0.93 | 0.41 | 0.15 | 1.00 | 1.11 | 0.00 | 39,486.4 |
| 17 | 91.17 | 5.24 | 0.93 | 0.41 | 0.15 | 1.00 | 1.10 | 0.00 | 39,487.2 |
| 22 | 91.08 | 5.27 | 0.95 | 0.38 | 0.17 | 1.01 | 1.13 | 0.00 | 39,480.5 |
| 27 | 91.12 | 5.28 | 0.90 | 0.45 | 0.11 | 1.06 | 1.09 | 0.00 | 39,457.4 |
| 32 | 91.05 | 5.29 | 0.89 | 0.45 | 0.11 | 1.10 | 1.10 | 0.00 | 39,441.1 |
| 37 | 91.15 | 5.29 | 0.86 | 0.50 | 0.07 | 1.02 | 1.11 | 0.00 | 39,457.9 |
| 43 | 91.13 | 5.30 | 0.91 | 0.41 | 0.13 | 1.01 | 1.11 | 0.00 | 39,464.8 |
| 49 | 91.12 | 5.32 | 0.88 | 0.42 | 0.12 | 1.03 | 1.10 | 0.00 | 39,456.7 |
| 52 | 91.06 | 5.36 | 0.88 | 0.41 | 0.16 | 1.02 | 1.11 | 0.00 | 39,497.7 |
| T [°C] | CH4 [%] | C2H6 [%] | C3H8 [%] | n-C4H10 [%] | i-C4H10 [%] | N2 [%] | CO2 [%] | H2 [%] | HHV [kJ/m3] |
|---|---|---|---|---|---|---|---|---|---|
| −18 | 99.51 | 0.00 | 0.00 | 0.00 | 0.00 | 0.49 | 0.00 | 0.00 | 37,594.3 |
| −18 | 99.51 | 0.00 | 0.00 | 0.00 | 0.00 | 0.49 | 0.00 | 0.00 | 37,593.2 |
| −16 | 99.51 | 0.00 | 0.00 | 0.00 | 0.00 | 0.49 | 0.00 | 0.00 | 37,593.8 |
| −13 | 99.52 | 0.00 | 0.00 | 0.00 | 0.00 | 0.48 | 0.00 | 0.00 | 37,597.9 |
| −9 | 99.51 | 0.00 | 0.00 | 0.00 | 0.00 | 0.49 | 0.00 | 0.00 | 37,594.6 |
| −4 | 99.52 | 0.00 | 0.00 | 0.00 | 0.00 | 0.48 | 0.00 | 0.00 | 37,595.7 |
| 1 | 99.51 | 0.00 | 0.00 | 0.00 | 0.00 | 0.49 | 0.00 | 0.00 | 37,594.7 |
| 5 | 99.52 | 0.00 | 0.00 | 0.00 | 0.00 | 0.48 | 0.00 | 0.00 | 37,595.9 |
| 8 | 99.51 | 0.00 | 0.00 | 0.00 | 0.00 | 0.49 | 0.00 | 0.00 | 37,594.8 |
| 12 | 99.51 | 0.00 | 0.00 | 0.00 | 0.00 | 0.49 | 0.00 | 0.00 | 37,594.1 |
| 17 | 99.51 | 0.00 | 0.00 | 0.00 | 0.00 | 0.49 | 0.00 | 0.00 | 37,592.5 |
| 22 | 99.52 | 0.00 | 0.00 | 0.00 | 0.00 | 0.48 | 0.00 | 0.00 | 37,596.1 |
| 28 | 99.52 | 0.00 | 0.00 | 0.00 | 0.00 | 0.48 | 0.00 | 0.00 | 37,596.5 |
| 33 | 99.44 | 0.00 | 0.00 | 0.00 | 0.00 | 0.51 | 0.05 | 0.00 | 37,565.3 |
| 38 | 99.37 | 0.00 | 0.00 | 0.00 | 0.00 | 0.51 | 0.11 | 0.00 | 37,542.5 |
| 44 | 99.24 | 0.06 | 0.00 | 0.06 | 0.00 | 0.50 | 0.14 | 0.00 | 37,605.6 |
| 50 | 99.17 | 0.07 | 0.00 | 0.07 | 0.00 | 0.50 | 0.19 | 0.00 | 37,600.5 |
| T [°C] | CH4 [%] | C2H6 [%] | C3H8 [%] | n-C4H10 [%] | i-C4H10 [%] | N2 [%] | CO2 [%] | H2 [%] | HHV [kJ/m3] |
|---|---|---|---|---|---|---|---|---|---|
| −18 | 92.32 | 4.02 | 0.63 | 0.44 | 0.00 | 1.26 | 0.35 | 0.96 | 38,801.4 |
| −17 | 92.30 | 4.03 | 0.63 | 0.45 | 0.00 | 1.26 | 0.37 | 0.96 | 38,797.8 |
| −16 | 92.31 | 4.02 | 0.64 | 0.44 | 0.00 | 1.25 | 0.38 | 0.96 | 38,798.1 |
| −15 | 92.24 | 4.02 | 0.67 | 0.39 | 0.05 | 1.26 | 0.40 | 0.97 | 38,812.4 |
| −12 | 92.18 | 4.03 | 0.68 | 0.39 | 0.07 | 1.25 | 0.44 | 0.96 | 38,813.2 |
| −8 | 92.03 | 4.05 | 0.73 | 0.33 | 0.11 | 1.25 | 0.53 | 0.97 | 38,805.0 |
| −3 | 92.03 | 4.05 | 0.71 | 0.38 | 0.08 | 1.24 | 0.53 | 0.98 | 38,805.8 |
| 3 | 92.02 | 4.04 | 0.71 | 0.40 | 0.06 | 1.24 | 0.54 | 0.98 | 38,794.9 |
| 8 | 91.94 | 4.06 | 0.72 | 0.40 | 0.08 | 1.23 | 0.58 | 0.99 | 38,804.3 |
| 13 | 91.88 | 4.07 | 0.73 | 0.38 | 0.09 | 1.24 | 0.62 | 1.00 | 38,789.6 |
| 18 | 91.76 | 4.08 | 0.76 | 0.34 | 0.13 | 1.25 | 0.68 | 1.01 | 38,781.3 |
| 23 | 91.61 | 4.10 | 0.78 | 0.33 | 0.15 | 1.28 | 0.72 | 1.02 | 38,776.9 |
| 27 | 91.54 | 4.11 | 0.77 | 0.36 | 0.11 | 1.34 | 0.71 | 1.05 | 38,746.3 |
| 32 | 91.44 | 4.14 | 0.74 | 0.39 | 0.10 | 1.37 | 0.72 | 1.09 | 38,730.5 |
| 36 | 91.50 | 4.18 | 0.71 | 0.45 | 0.07 | 1.29 | 0.72 | 1.08 | 38,777.0 |
| 41 | 91.62 | 4.17 | 0.64 | 0.54 | 0.00 | 1.26 | 0.72 | 1.05 | 38,774.0 |
| 45 | 91.40 | 4.20 | 0.73 | 0.38 | 0.15 | 1.28 | 0.79 | 1.07 | 38,779.6 |
| 49 | 91.41 | 4.20 | 0.71 | 0.38 | 0.15 | 1.30 | 0.78 | 1.07 | 38,766.6 |
| 52 | 91.51 | 4.20 | 0.69 | 0.40 | 0.11 | 1.28 | 0.74 | 1.08 | 38,760.1 |
| 53 | 91.44 | 4.20 | 0.70 | 0.36 | 0.17 | 1.30 | 0.75 | 1.08 | 38,767.9 |
| T [°C] | CH4 [%] | C2H6 [%] | C3H8 [%] | n-C4H10 [%] | i-C4H10 [%] | N2 [%] | CO2 [%] | H2 [%] | HHV [kJ/m3] |
|---|---|---|---|---|---|---|---|---|---|
| −18 | 74.32 | 3.08 | 0.65 | 0.00 | 0.27 | 0.97 | 0.50 | 20.21 | 33,484.7 |
| −18 | 74.33 | 3.09 | 0.65 | 0.00 | 0.28 | 0.97 | 0.50 | 20.20 | 33,495.1 |
| −17 | 74.28 | 3.09 | 0.66 | 0.00 | 0.28 | 0.97 | 0.50 | 20.22 | 33,503.5 |
| −16 | 74.26 | 3.10 | 0.65 | 0.00 | 0.28 | 0.96 | 0.51 | 20.22 | 33,500.8 |
| −14 | 74.19 | 3.11 | 0.66 | 0.00 | 0.28 | 0.97 | 0.52 | 20.26 | 33,492.5 |
| −11 | 74.03 | 3.15 | 0.66 | 0.00 | 0.33 | 0.96 | 0.56 | 20.31 | 33,512.3 |
| −7 | 73.86 | 3.17 | 0.68 | 0.00 | 0.34 | 0.95 | 0.58 | 20.42 | 33,509.8 |
| −2 | 73.70 | 3.20 | 0.71 | 0.00 | 0.33 | 0.95 | 0.58 | 20.54 | 33,494.5 |
| 3 | 73.48 | 3.24 | 0.69 | 0.00 | 0.38 | 0.95 | 0.63 | 20.64 | 33,492.4 |
| 8 | 73.26 | 3.30 | 0.68 | 0.00 | 0.42 | 0.96 | 0.66 | 20.72 | 33,498.3 |
| 13 | 73.16 | 3.31 | 0.72 | 0.00 | 0.38 | 0.95 | 0.63 | 20.84 | 33,477.3 |
| 19 | 72.89 | 3.40 | 0.68 | 0.00 | 0.48 | 0.95 | 0.70 | 20.89 | 33,522.5 |
| 24 | 72.80 | 3.45 | 0.68 | 0.00 | 0.49 | 0.95 | 0.71 | 20.92 | 33,539.1 |
| 28 | 72.71 | 3.45 | 0.56 | 0.25 | 0.35 | 1.00 | 0.70 | 20.97 | 33,536.7 |
| 33 | 72.48 | 3.53 | 0.56 | 0.24 | 0.40 | 1.07 | 0.72 | 21.00 | 33,545.9 |
| 37 | 72.47 | 3.55 | 0.47 | 0.38 | 0.33 | 1.04 | 0.72 | 21.04 | 33,559.8 |
| 42 | 72.29 | 3.60 | 0.38 | 0.51 | 0.27 | 1.00 | 0.72 | 21.23 | 33,550.1 |
| 46 | 72.16 | 3.59 | 0.29 | 0.71 | 0.14 | 1.01 | 0.67 | 21.43 | 33,522.5 |
| 50 | 72.05 | 3.62 | 0.23 | 0.81 | 0.07 | 1.03 | 0.67 | 21.51 | 33,505.0 |
| 53 | 72.34 | 3.65 | 0.21 | 0.93 | 0.00 | 1.02 | 0.63 | 21.21 | 33,635.2 |
| 54 | 72.23 | 3.70 | 0.18 | 0.94 | 0.00 | 1.04 | 0.64 | 21.27 | 33,608.8 |
| T [°C] | CH4 [%] | C2H6 [%] | C3H8 [%] | n-C4H10 [%] | i-C4H10 [%] | N2 [%] | CO2 [%] | H2 [%] | HHV [kJ/m3] |
|---|---|---|---|---|---|---|---|---|---|
| −18 | 89.93 | 0.00 | 0.00 | 0.00 | 0.07 | 0.06 | 0.00 | 9.94 | 35,246.9 |
| −18 | 90.00 | 0.00 | 0.00 | 0.00 | 0.00 | 0.05 | 0.00 | 9.95 | 35,190.5 |
| −16 | 89.97 | 0.00 | 0.00 | 0.00 | 0.00 | 0.06 | 0.00 | 9.98 | 35,182.4 |
| −13 | 89.85 | 0.00 | 0.00 | 0.00 | 0.06 | 0.05 | 0.00 | 10.04 | 35,219.6 |
| −8 | 89.76 | 0.00 | 0.00 | 0.00 | 0.08 | 0.05 | 0.00 | 10.11 | 35,213.6 |
| −4 | 89.67 | 0.00 | 0.00 | 0.00 | 0.09 | 0.05 | 0.00 | 10.19 | 35,200.0 |
| 1 | 89.61 | 0.00 | 0.00 | 0.00 | 0.08 | 0.06 | 0.00 | 10.25 | 35,180.9 |
| 5 | 89.54 | 0.00 | 0.00 | 0.00 | 0.08 | 0.06 | 0.00 | 10.32 | 35,161.0 |
| 8 | 89.53 | 0.00 | 0.00 | 0.00 | 0.09 | 0.00 | 0.00 | 10.38 | 35,171.8 |
| 12 | 89.42 | 0.00 | 0.00 | 0.00 | 0.12 | 0.00 | 0.00 | 10.46 | 35,182.9 |
| 18 | 89.33 | 0.00 | 0.00 | 0.00 | 0.13 | 0.00 | 0.00 | 10.55 | 35,162.7 |
| 23 | 89.21 | 0.00 | 0.00 | 0.05 | 0.08 | 0.00 | 0.00 | 10.65 | 35,148.1 |
| 28 | 89.11 | 0.00 | 0.00 | 0.06 | 0.09 | 0.00 | 0.00 | 10.73 | 35,140.7 |
| 33 | 88.97 | 0.08 | 0.00 | 0.15 | 0.00 | 0.00 | 0.00 | 10.80 | 35,142.7 |
| 38 | 88.76 | 0.14 | 0.00 | 0.19 | 0.00 | 0.00 | 0.11 | 10.80 | 35,149.3 |
| 44 | 88.62 | 0.16 | 0.00 | 0.22 | 0.00 | 0.00 | 0.15 | 10.86 | 35,151.2 |
| 50 | 88.42 | 0.22 | 0.00 | 0.24 | 0.00 | 0.00 | 0.17 | 10.96 | 35,152.5 |
References
- Adenubi, S.; Appah, D.; Okafor, E.; Aimikhe, V. A Review of Leak Detection Systems for Natural Gas Pipelines and Facilities. Int. J. Energy Technol. Policy 2023, 13, 9–19. [Google Scholar] [CrossRef] [Scilit]
- Zhang, S.; Xie, S.; Li, Y.; Yuan, M.; Qian, X. Detection of Gas Pipeline Leakage Using Distributed Optical Fiber Sensors: Multi-Physics Analysis of Leakage-Fiber Coupling Mechanism in Soil Environment. Sensors 2023, 23, 5430. [Google Scholar] [CrossRef] [Scilit]
- ENTSOG. Gas Quality Monitoring Report—First Edition; European Network of Transmission System Operators for Gas: Brussels, Belgium, 2024; Available online: https://www.entsog.eu/sites/default/files/2024-12/ENTSOG%20Gas%20Quality%20Monitoring%20Report%20-%20First%20Edition_0.pdf (accessed on 11 May 2026).
- Keogh, N.; Corr, D.; Monaghan, R.F.D. Biogenic renewable gas injection into natural gas grids: A review of technical and economic modelling studies. Renew. Sustain. Energy Rev. 2022, 168, 112818. [Google Scholar] [CrossRef] [Scilit]
- Quintino, F.M.; Nascimento, N.; Fernandes, E.C. Aspects of hydrogen and biomethane introduction in natural gas infrastructure and equipment. Hydrogen 2021, 2, 301–318. [Google Scholar] [CrossRef] [Scilit]
- Mahajan, D.; Tan, K.; Venkatesh, T.; Kileti, P.; Clayton, C.R. Hydrogen blending in gas pipeline networks—A review. Energies 2022, 15, 3582. [Google Scholar] [CrossRef] [Scilit]
- Bloj, M.-D.; Ripeanu, R.G.; Diniță, A.; Oprea, V.O.; Tănase, M. Comprehensive review of hydrogen-natural gas blending: Global project insights with a focus on implementation and impact in Romanian gas networks. Heliyon 2025, 11, e43090. [Google Scholar] [CrossRef] [Scilit]
- Vaccariello, E.; Trinchero, R.; Stievano, I.S.; Leone, P. A statistical assessment of blending hydrogen into gas networks. Energies 2021, 14, 5055. [Google Scholar] [CrossRef] [Scilit]
- ISO 6976:2016; Natural Gas—Calculation of Calorific Values, Density, Relative Density and Wobbe Index from Composition. International Organization for Standardization: Geneva, Switzerland, 2016.
- Brown, A.S.; Milton, M.J.T.; Cowper, C.J.; Squire, G.D.; Bremser, W.; Branch, R.W. Analysis of natural gas by gas chromatography: Reduction of correlated uncertainties by normalisation. J. Chromatogr. A 2004, 1040, 215–225. [Google Scholar] [CrossRef] [Scilit] [PubMed]
- Ficco, G.; Cigolotti, V.; Cortellessa, G.; Monteleone, G.; Dell’Isola, M. Impact of hydrogen-enriched natural gas on the accuracy of odorant measurements. Sensors 2025, 25, 4394. [Google Scholar] [CrossRef] [Scilit]
- Regmi, B.P.; Agah, M. Micro gas chromatography: An overview of critical components and their integration. Anal. Chem. 2018, 90, 13133–13150. [Google Scholar] [CrossRef] [Scilit]
- Emerson. Fundamentals of Gas Chromatography; Application Note Oil & Gas, Rosemount EN-105270; Emerson Process Management: Rosemount, MN, USA; Available online: https://www.emerson.com/documents/automation/application-note-fundamentals-of-gas-chromatography-rosemount-en-105270.pdf (accessed on 11 May 2026).
- ISO 6974 Series; Natural Gas—Determination of Composition and Associated Uncertainty by Gas Chromatography. International Organization for Standardization: Geneva, Switzerland, 2012.
- Crucello, J.; Oliveira, A.M.; Sampaio, N.M.F.M.; Hantao, L.W. Miniaturized systems for gas chromatography: Developments in sample preparation and instrumentation. J. Chromatogr. A 2022, 1685, 463603. [Google Scholar] [CrossRef] [Scilit]
- Agilent Technologies. Natural Gas Analyzer GC Systems; Brochure No. 5994-8260EN; Agilent Technologies: Santa Clara, CA, USA, 2023; Available online: https://www.agilent.com/cs/library/brochures/br-nga-gc-analyzer-5994-8260en-agilent.pdf (accessed on 11 May 2026).
- Singh, R.; Gupta, R.; Bansal, D.; Bhateria, R.; Sharma, M. A review on recent trends and future developments in electrochemical sensing. ACS Omega 2024, 9, 7336–7356. [Google Scholar] [CrossRef] [Scilit]
- Laref, R.; Losson, E.; Sava, A.; Siadat, M. Empiric unsupervised drifts correction method of electrochemical sensors for in-field nitrogen dioxide monitoring. Sensors 2021, 21, 3581. [Google Scholar] [CrossRef] [Scilit]
- Rivera, P.; Della Pelle, F.; Stonyte, J.; Martins Antunes de Melo, W.C.; Abouhagger, A.; Pauliukaite, R. Overcoming challenges in electrochemical sensing: Toward continuous monitoring. ACS Sens. 2025, 10, 9183–9202. [Google Scholar] [CrossRef] [Scilit] [PubMed]
- Ba Hashwan, S.S.; Khir, M.H.M.; Nawi, I.M.; Ahmad, M.R.; Hanif, M.; Zahoor, F.; Al-Douri, Y.; Algamili, A.S.; Bature, U.I.; Alabsi, S.S.; et al. A review of piezoelectric MEMS sensors and actuators for gas detection application. Discov. Nano 2023, 18, 25. [Google Scholar] [CrossRef] [Scilit] [PubMed]
- Wu, Y.; Lei, M.; Xia, X. Research progress of MEMS gas sensors: A comprehensive review of sensing materials. Sensors 2024, 24, 8125. [Google Scholar] [CrossRef] [Scilit] [PubMed]
- Luo, W.; Dai, F.; Liu, Y.; Wang, X.; Li, M. Pulse-driven MEMS gas sensor combined with machine learning for selective gas identification. Microsyst. Nanoeng. 2025, 11, 72. [Google Scholar] [CrossRef] [Scilit]
- Hamaguchi, R. Natural gas measurement using temperature-dependent thermal conductivity. Tech. Rev. 2018, 1–5. Available online: https://www.azbil.com/corporate/technology/review/pdf/rev2018E_4.pdf (accessed on 11 May 2026).
- Avetisov, V.; Bjoroey, O.; Wang, J.; Geiser, P.; Paulsen, K.G. Hydrogen sensor based on tunable diode laser absorption spectroscopy. Sensors 2019, 19, 5313. [Google Scholar] [CrossRef] [Scilit]
- Liang, T.; Qiao, S.; Liu, X.; Ma, Y. Highly sensitive hydrogen sensing based on tunable diode laser absorption spectroscopy with a 2.1 μm diode laser. Chemosensors 2022, 10, 321. [Google Scholar] [CrossRef] [Scilit]
- Nie, Q.; Wang, Z.; Ren, W. Cavity-enhanced absorption spectroscopy with continuous and fast wavelength tuning. Chin. Opt. Lett. 2025, 23, 121201. [Google Scholar] [CrossRef] [Scilit]
- Chu, L.-K.; Huang, Y.-H.; Lee, Y.-P. Step-scan FTIR techniques for investigations of spectra and dynamics of transient species in gaseous chemical reactions. In Molecular and Laser Spectroscopy; Gupta, V.P., Ed.; Elsevier: Amsterdam, The Netherlands, 2022; pp. 481–527. [Google Scholar] [CrossRef] [Scilit]
- Long, D.A. The Raman Effect—A Unified Treatment of the Theory of Raman Scattering by Molecules; John Wiley & Sons: Chichester, UK, 2002. [Google Scholar]
- Hollas, J.M. Modern Spectroscopy, 4th ed.; John Wiley & Sons: Chichester, UK, 2003. [Google Scholar]
- Popp, J.; Mayerhöfer, T. Micro-Raman Spectroscopy: Theory and Application; De Gruyter: Berlin, Germany; Boston, MA, USA, 2020. [Google Scholar]
- Huang, B.; Zhao, Q.; Sun, C.; Zhu, L.; Zhang, H.; Zhang, Y.; Liu, C.; Li, F. Trace analysis of gases and liquids with spontaneous Raman scattering based on the integrating sphere principle. Anal. Chem. 2022, 94, 13311–13314. [Google Scholar] [CrossRef] [Scilit]
- Danichkin, S.A.; Eliseev, A.A.; Popova, T.N.; Ravodina, O.V.; Stenina, V.V. Raman scattering parameters for gas molecules (survey). J. Appl. Spectrosc. 1981, 35, 1057–1066. [Google Scholar] [CrossRef] [Scilit]
- Buldakov, M.A.; Korolkov, V.A.; Matrosov, I.I.; Petrov, D.V.; Tikhomirov, A.A.; Korolev, B.V. Analyzing natural gas by spontaneous Raman scattering spectroscopy. J. Opt. Technol. 2013, 80, 426–430. [Google Scholar] [CrossRef] [Scilit]
- Petrov, D.V.; Matrosov, I.I. Raman gas analyzer (RGA): Natural gas measurements. Appl. Spectrosc. 2016, 70, 1770–1776. [Google Scholar] [CrossRef] [Scilit]
- Hippler, M. Cavity-enhanced Raman spectroscopy of natural gas with optical feedback cw-diode lasers. Anal. Chem. 2015, 87, 7803–7809. [Google Scholar] [CrossRef] [Scilit] [PubMed]
- Sandfort, V.; Trabold, B.M.; Abdolvand, A.; Bolwien, C.; Russell, P.S.J.; Wöllenstein, J.; Palzer, S. Monitoring the Wobbe index of natural gas using fiber-enhanced Raman spectroscopy. Sensors 2017, 17, 2714. [Google Scholar] [CrossRef] [Scilit] [PubMed]
- Qin, Y.; Sun, X.; Shi, G.; Ning, R.; Li, X.; Shen, L. Methane gas detection based on cavity-enhanced Raman spectroscopy. J. Phys. Conf. Ser. 2026, 3171, 012004. [Google Scholar] [CrossRef] [Scilit]
- Dal Moro, R.; Melison, F.; Cocola, L.; Poletto, L. Raman Spectroscopy for Monitoring NOx and N2O in Combustion Products. Sensors 2026, 26, 3180. [Google Scholar] [CrossRef] [Scilit] [PubMed]
- Cocola, L.; Melison, F.; Scarabottolo, N.; Tondello, G.; Poletto, L. Diode-based Raman sensor for fuel gas analysis. In Proceedings of the SPIE—Optical Sensing and Detection VI, Strasbourg, France, 6–10 April 2020; Volume 11354, p. 113541A. [Google Scholar] [CrossRef] [Scilit]
- Melison, F.; Cocola, L.; Meneghin, E.; Rossi, D.; Poletto, L. Raman spectroscopy applied to in-situ natural gas and hydrogen-enriched natural gas composition measurements. In Proceedings of the SPIE—Next-Generation Spectroscopic Technologies XVII, Kissimmee, FL, USA, 13–17 April 2025; Volume 13449, p. 134490I. [Google Scholar] [CrossRef] [Scilit]
- Pietro Fiorentini S.p.A. Device for Gas Analysis Using Raman Spectroscopy. European Patent EP 4 339 570 A2, 20 March 2024. [Google Scholar]
- IEC 60079:2026 SER; Explosive Atmospheres—All Parts, Including IEC 60079-0, Explosive Atmospheres—Part 0: Equipment—General Requirements, and IEC 60079-1, Explosive Atmospheres—Part 1: Equipment Protection by Flameproof Enclosures “d”. International Electrotechnical Commission: Geneva, Switzerland, 2026.
- Riedl, M.J. Optical Design Fundamentals for Infrared Systems, 2nd ed.; SPIE Press: Bellingham, WA, USA, 2001; p. 40. [Google Scholar]
- Qi, J.; Bechtel, K.L.; Shih, W.-C. Automated image curvature assessment and correction for high-throughput Raman spectroscopy and microscopy. Biomed. Spectrosc. Imaging 2014, 3, 359–368. [Google Scholar] [CrossRef] [Scilit]
- OIML R 140:2007; Measuring Systems for Gaseous Fuels. International Organization of Legal Metrology: Paris, France, 2007. Available online: https://www.oiml.org/en/files/pdf_r/r140-e07.pdf (accessed on 11 May 2026).
- Melison, F.; Cocola, L.; Poletto, L. Raman gas sensor for hydrogen detection via non-dispersive and dispersive approaches. Sensors 2025, 25, 4190. [Google Scholar] [CrossRef] [Scilit]



| HHV [MJ/mol] | HHV [MJ/m3] @ 15 °C, 1 atm | |
|---|---|---|
| Methane, CH4 | 0.89 | 39.8 |
| Ethane, C2H6 | 1.56 | 68.4 |
| Propane, C3H8 | 2.22 | 93.0 |
| n-Butane, nC4H10 | 2.87 | 121.0 |
| i-Butane, iC4H10 | 2.86 | 120.5 |
| Hydrogen, H2 | 0.286 | 12.7 |
| Nitrogen, N2 | – | – |
| Carbon dioxide, CO2 | – | – |
| NG1 | NG2 | NG3 | HNG1 | HNG2 | MIX | |
|---|---|---|---|---|---|---|
| CH4 | 85.10 | 91.57 | 99.48 | 91.81 | 74.15 | 89.94 |
| C2H6 | 9.00 | 5.05 | 0.04 | 4.12 | 3.32 | 0.00 |
| C3H8 | 1.52 | 0.98 | 0.01 | 0.81 | 0.66 | 0.00 |
| n-C4H10 | 0.21 | 0.15 | 0.00 | 0.14 | 0.11 | 0.00 |
| i-C4H10 | 0.14 | 0.14 | 0.00 | 0.12 | 0.09 | 0.00 |
| N2 | 2.47 | 0.99 | 0.40 | 1.28 | 1.03 | 0.00 |
| CO2 | 1.43 | 1.03 | 0.05 | 0.65 | 0.52 | 0.00 |
| H2 | 0.00 | 0.00 | 0.00 | 1.00 | 20.04 | 10.06 |
| BAL | 0.13 | 0.10 | 0.01 | 0.08 | 0.07 | 0.00 |
| HHV [kJ/m3] | 40,199.50 | 39,380.21 | 37,636.04 | 38,746.66 | 33,594.57 | 35,182.25 |
| Refs. | Target Gases/Application | Optical Strategy | Acquisition Time | Operating Conditions | Main Performance | Deployment |
|---|---|---|---|---|---|---|
| [33,34] | NG composition analysis | 532 nm narrow-linewidth, cooled CCD | Tens of seconds | Controlled laboratory conditions | Accurate NG composition, low detection limits for main species | Laboratory oriented, not specifically designed for field deployment |
| [35] | NG/CH4 detection | Cavity enhanced with optical feedback | Seconds—minutes | Laboratory cavity configuration | Enhanced Raman signal and improved sensitivity | High optical complexity; cavity alignment and stability requirements |
| [36] | Wobbe-index monitoring of NG | Holow-core fiber enhanced | Application– dependent | Controlled experimental setup | Demonstrated Wobbe-index monitoring | Promising for gas monitoring, not presented as legal-metrology compliant industrial instrumentation |
| [37] | CH4 detection | Cavity enhanced | 60 s | Optimized controlled conditions | Enhanced methane sensitivity | Optimized for trace detection |
| This work | NG/HNG composition and HHV | 450 nm broadband diode laser, custom high-throughput spectrometer, uncooled CMOS | 20 s | Controlled validation/field operations | HHV measurements within OIML R 140 class A/12 month field stability | Designed for industrial field deployment and gas-quality monitoring |
Disclaimer/Publisher’s Note: The statements, opinions and data contained in all publications are solely those of the individual author(s) and contributor(s) and not of MDPI and/or the editor(s). MDPI and/or the editor(s) disclaim responsibility for any injury to people or property resulting from any ideas, methods, instructions or products referred to in the content. |
© 2026 by the authors. Licensee MDPI, Basel, Switzerland. This article is an open access article distributed under the terms and conditions of the Creative Commons Attribution (CC BY) license.
Share and Cite
Melison, F.; Cocola, L.; Meneghin, E.; Danese, R.; Rossi, D.; Poletto, L. Diode-Laser-Based Raman Spectroscopy Applied to the Thermodynamic Characterization of Natural Gas and Hydrogen-Enriched Natural Gas. Sensors 2026, 26, 3820. https://doi.org/10.3390/s26123820
Melison F, Cocola L, Meneghin E, Danese R, Rossi D, Poletto L. Diode-Laser-Based Raman Spectroscopy Applied to the Thermodynamic Characterization of Natural Gas and Hydrogen-Enriched Natural Gas. Sensors. 2026; 26(12):3820. https://doi.org/10.3390/s26123820
Chicago/Turabian StyleMelison, Fabio, Lorenzo Cocola, Elena Meneghin, Riccardo Danese, Daniele Rossi, and Luca Poletto. 2026. "Diode-Laser-Based Raman Spectroscopy Applied to the Thermodynamic Characterization of Natural Gas and Hydrogen-Enriched Natural Gas" Sensors 26, no. 12: 3820. https://doi.org/10.3390/s26123820
APA StyleMelison, F., Cocola, L., Meneghin, E., Danese, R., Rossi, D., & Poletto, L. (2026). Diode-Laser-Based Raman Spectroscopy Applied to the Thermodynamic Characterization of Natural Gas and Hydrogen-Enriched Natural Gas. Sensors, 26(12), 3820. https://doi.org/10.3390/s26123820