Context-Driven Active Contour (CDAC): A Novel Medical Image Segmentation Method Based on Active Contour and Contextual Understanding

 , , , , , , ,
  and
and
Abstract
1. Introduction
Paper Organization
2. Materials and Methods
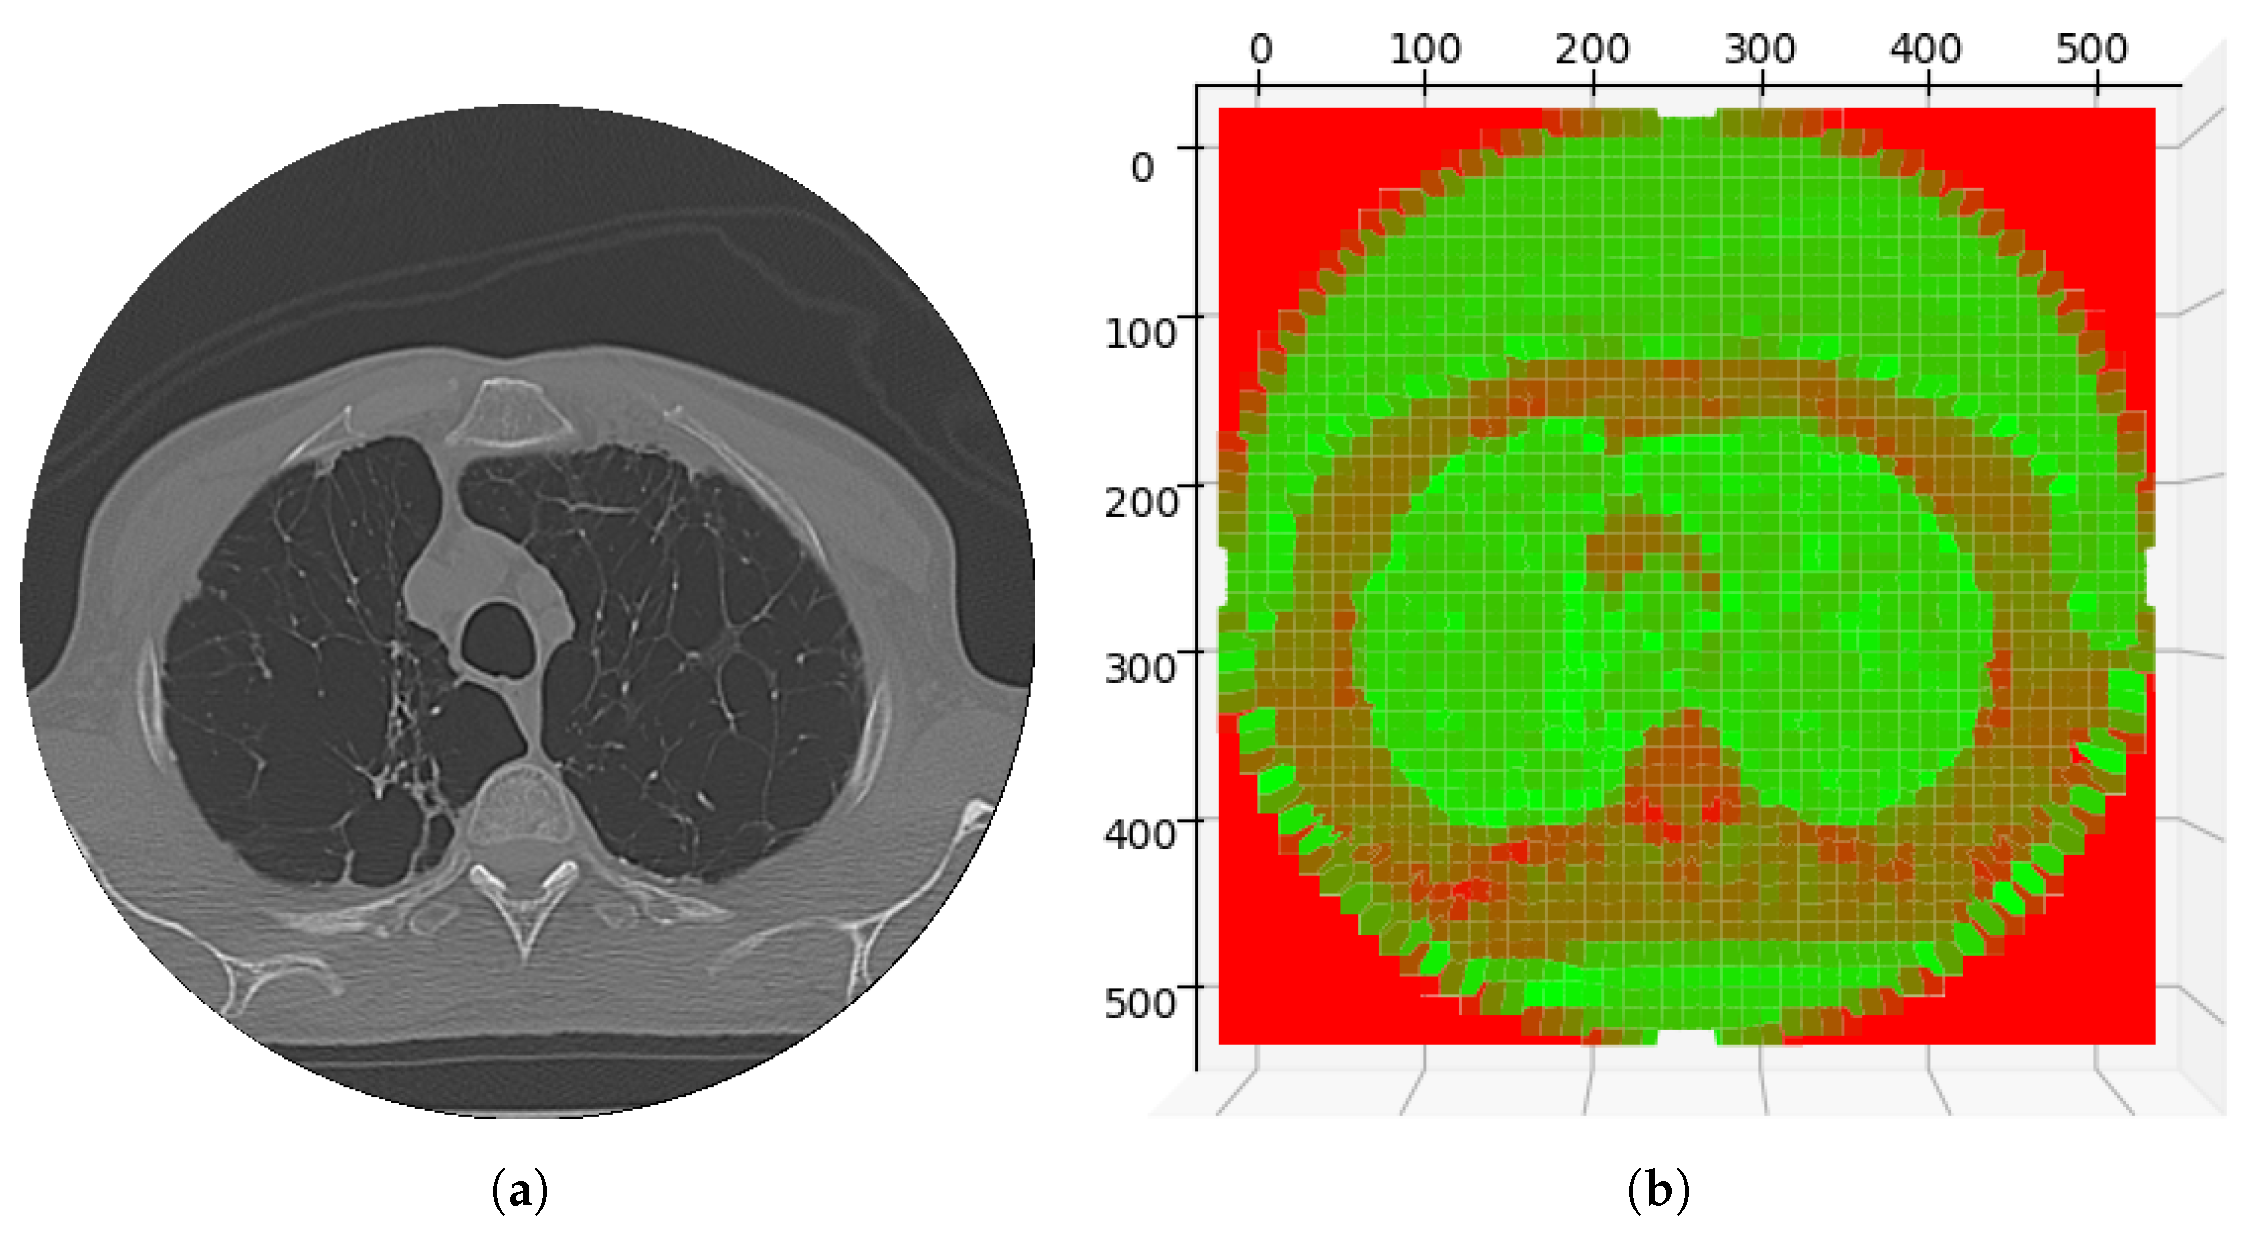
2.1. Chest CT Dataset
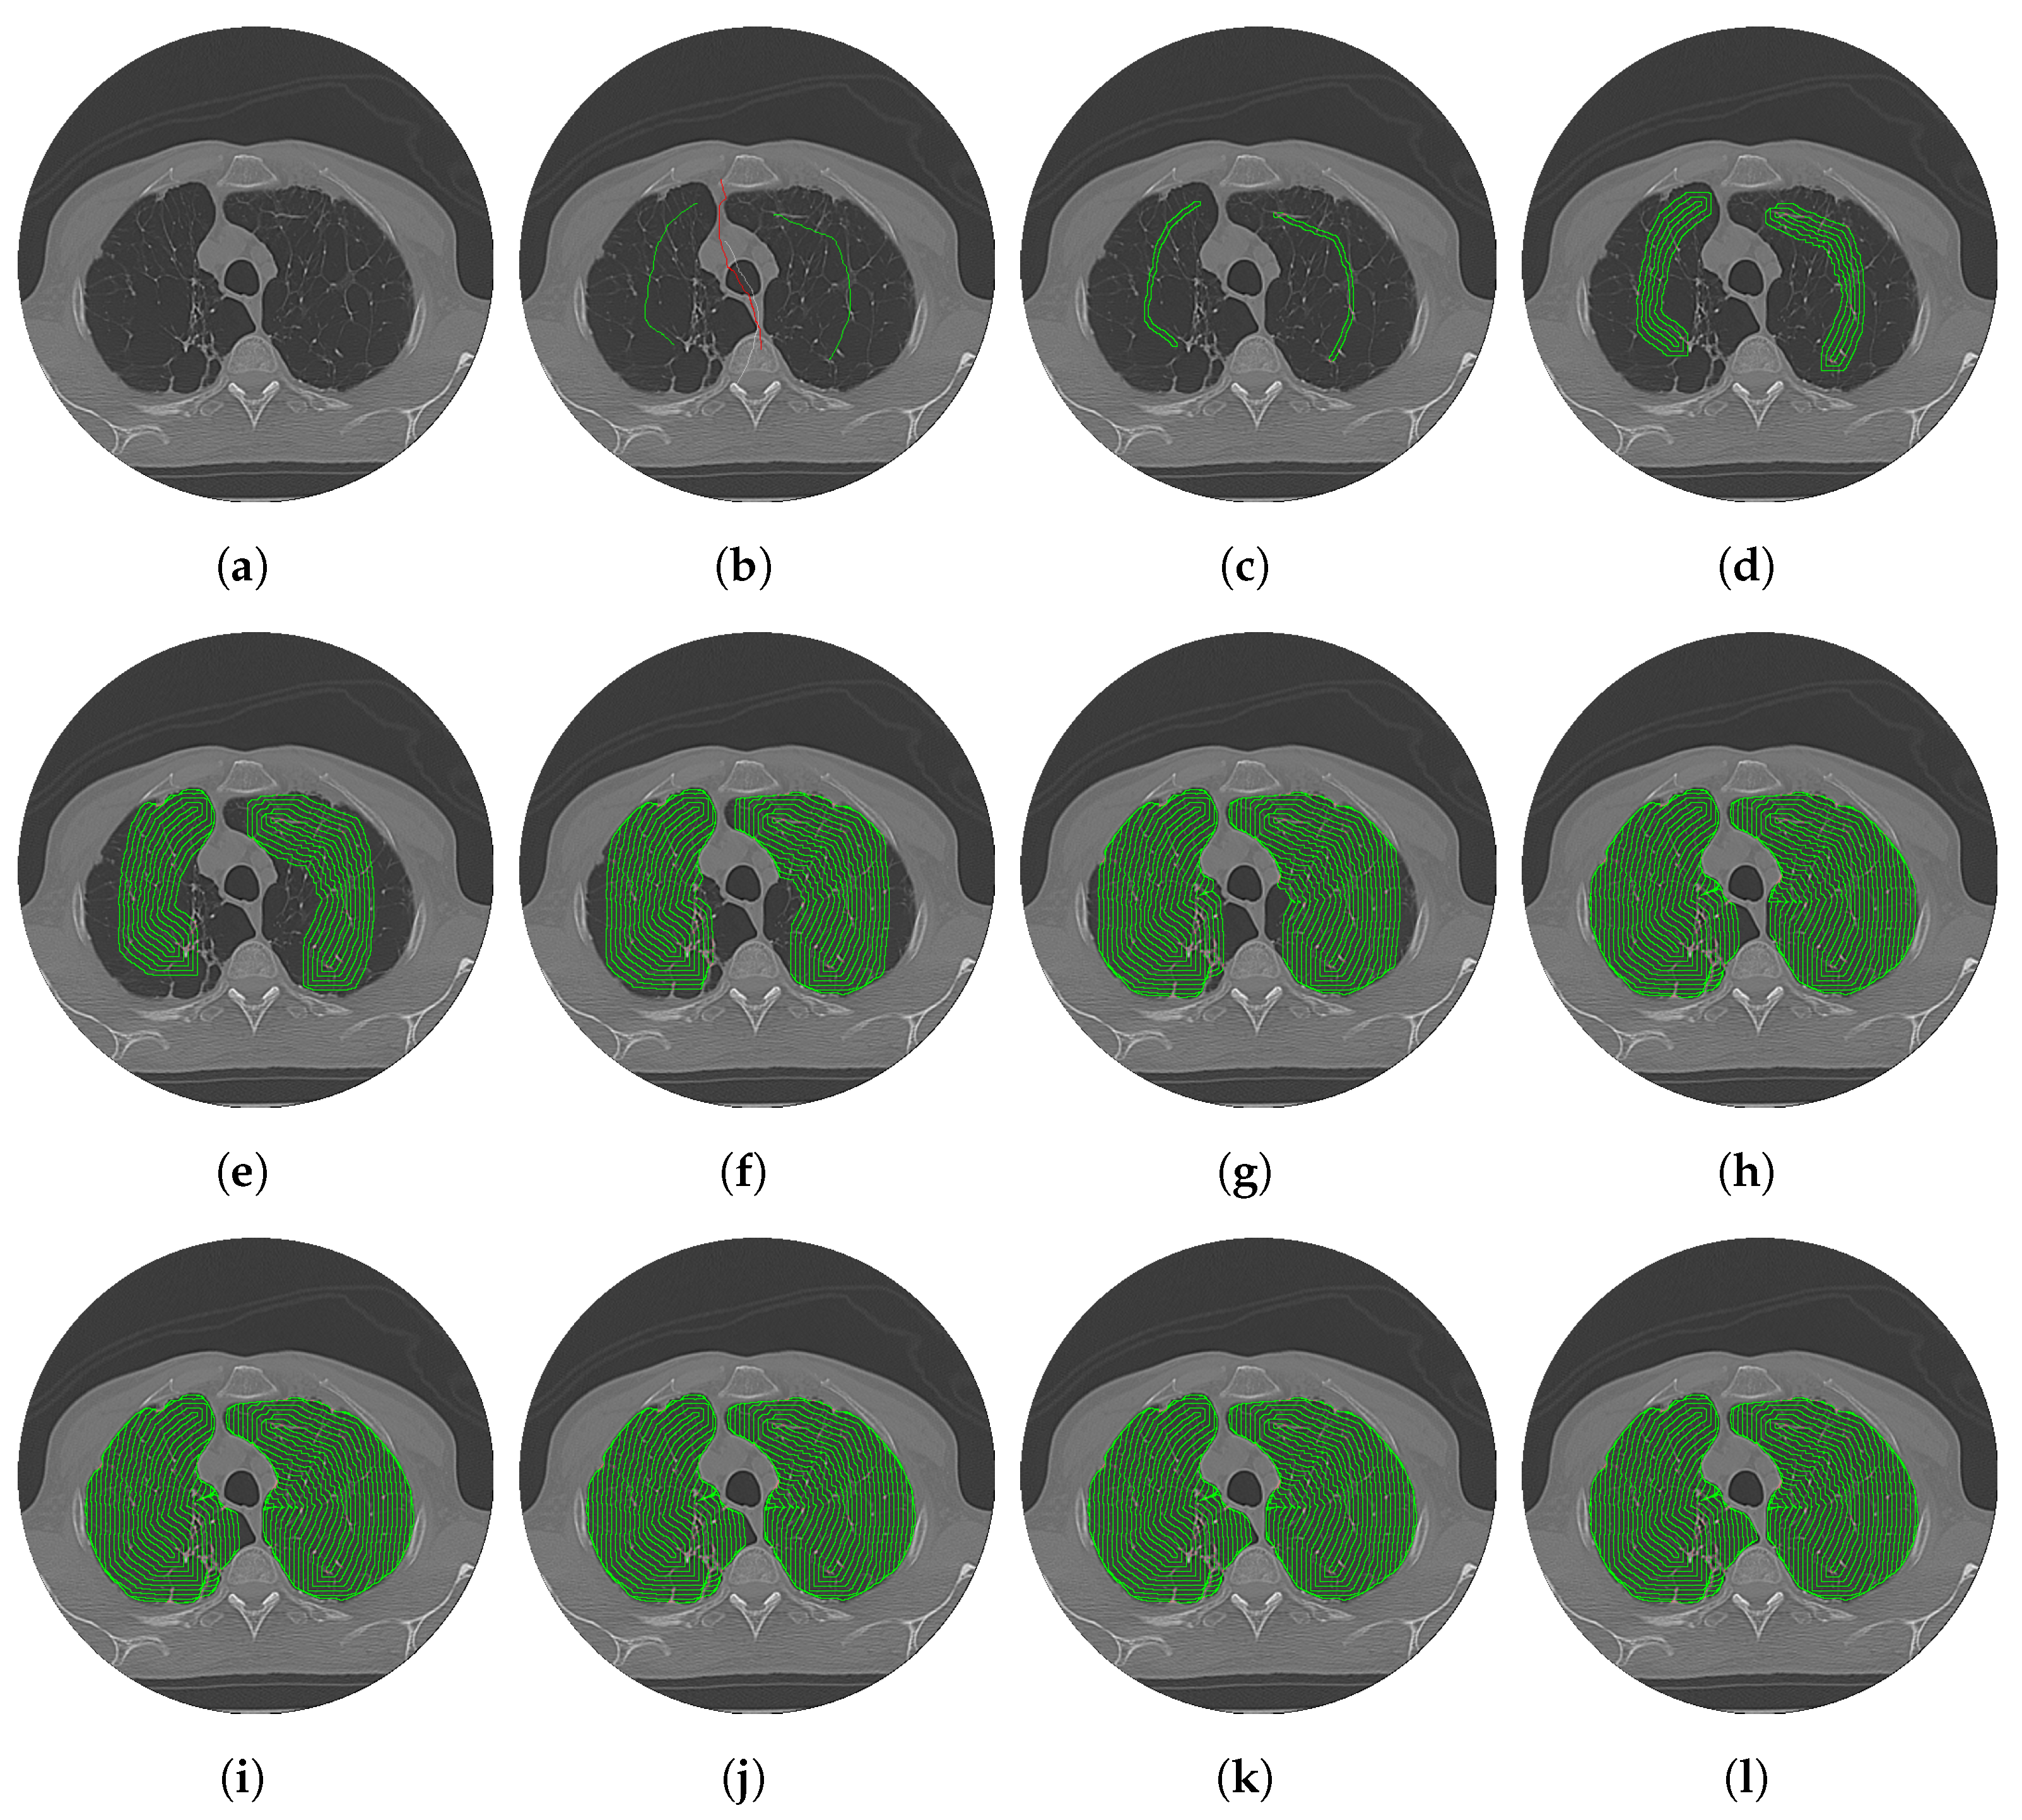
2.2. Context-Driven Active Contour (CDAC)
2.2.1. External Energy Contextual Attention Force (CAF)
- represents the linear interpolation between the points and , ensuring that the closed curve starts and ends at the extreme points.
- is a perpendicular vector of magnitude D in relation to the segment , ensuring that the curve maintains the distance D of the points internally.
2.2.2. Internal Energy Contextual Balloon Force (CBF)
- is the CBF internal energy along the curve .
- is the continuity force, which maintains the smoothness of the curve.
- is the adaptive contextual force, which adapts the force based on the contextual analysis of the region.
- and are weights that adjust the influence of each term.
- is a weight that controls the stiffness of the curve.
- is the derivative of the curve with respect to the parameter s, representing the continuity of the curve.
- is a weight that adjusts for the influence of contextual force.
- is a modified step function that takes into account the influence of external energy CAF:
- is the contextual external energy that attracts the curve to the edges of the object of interest.
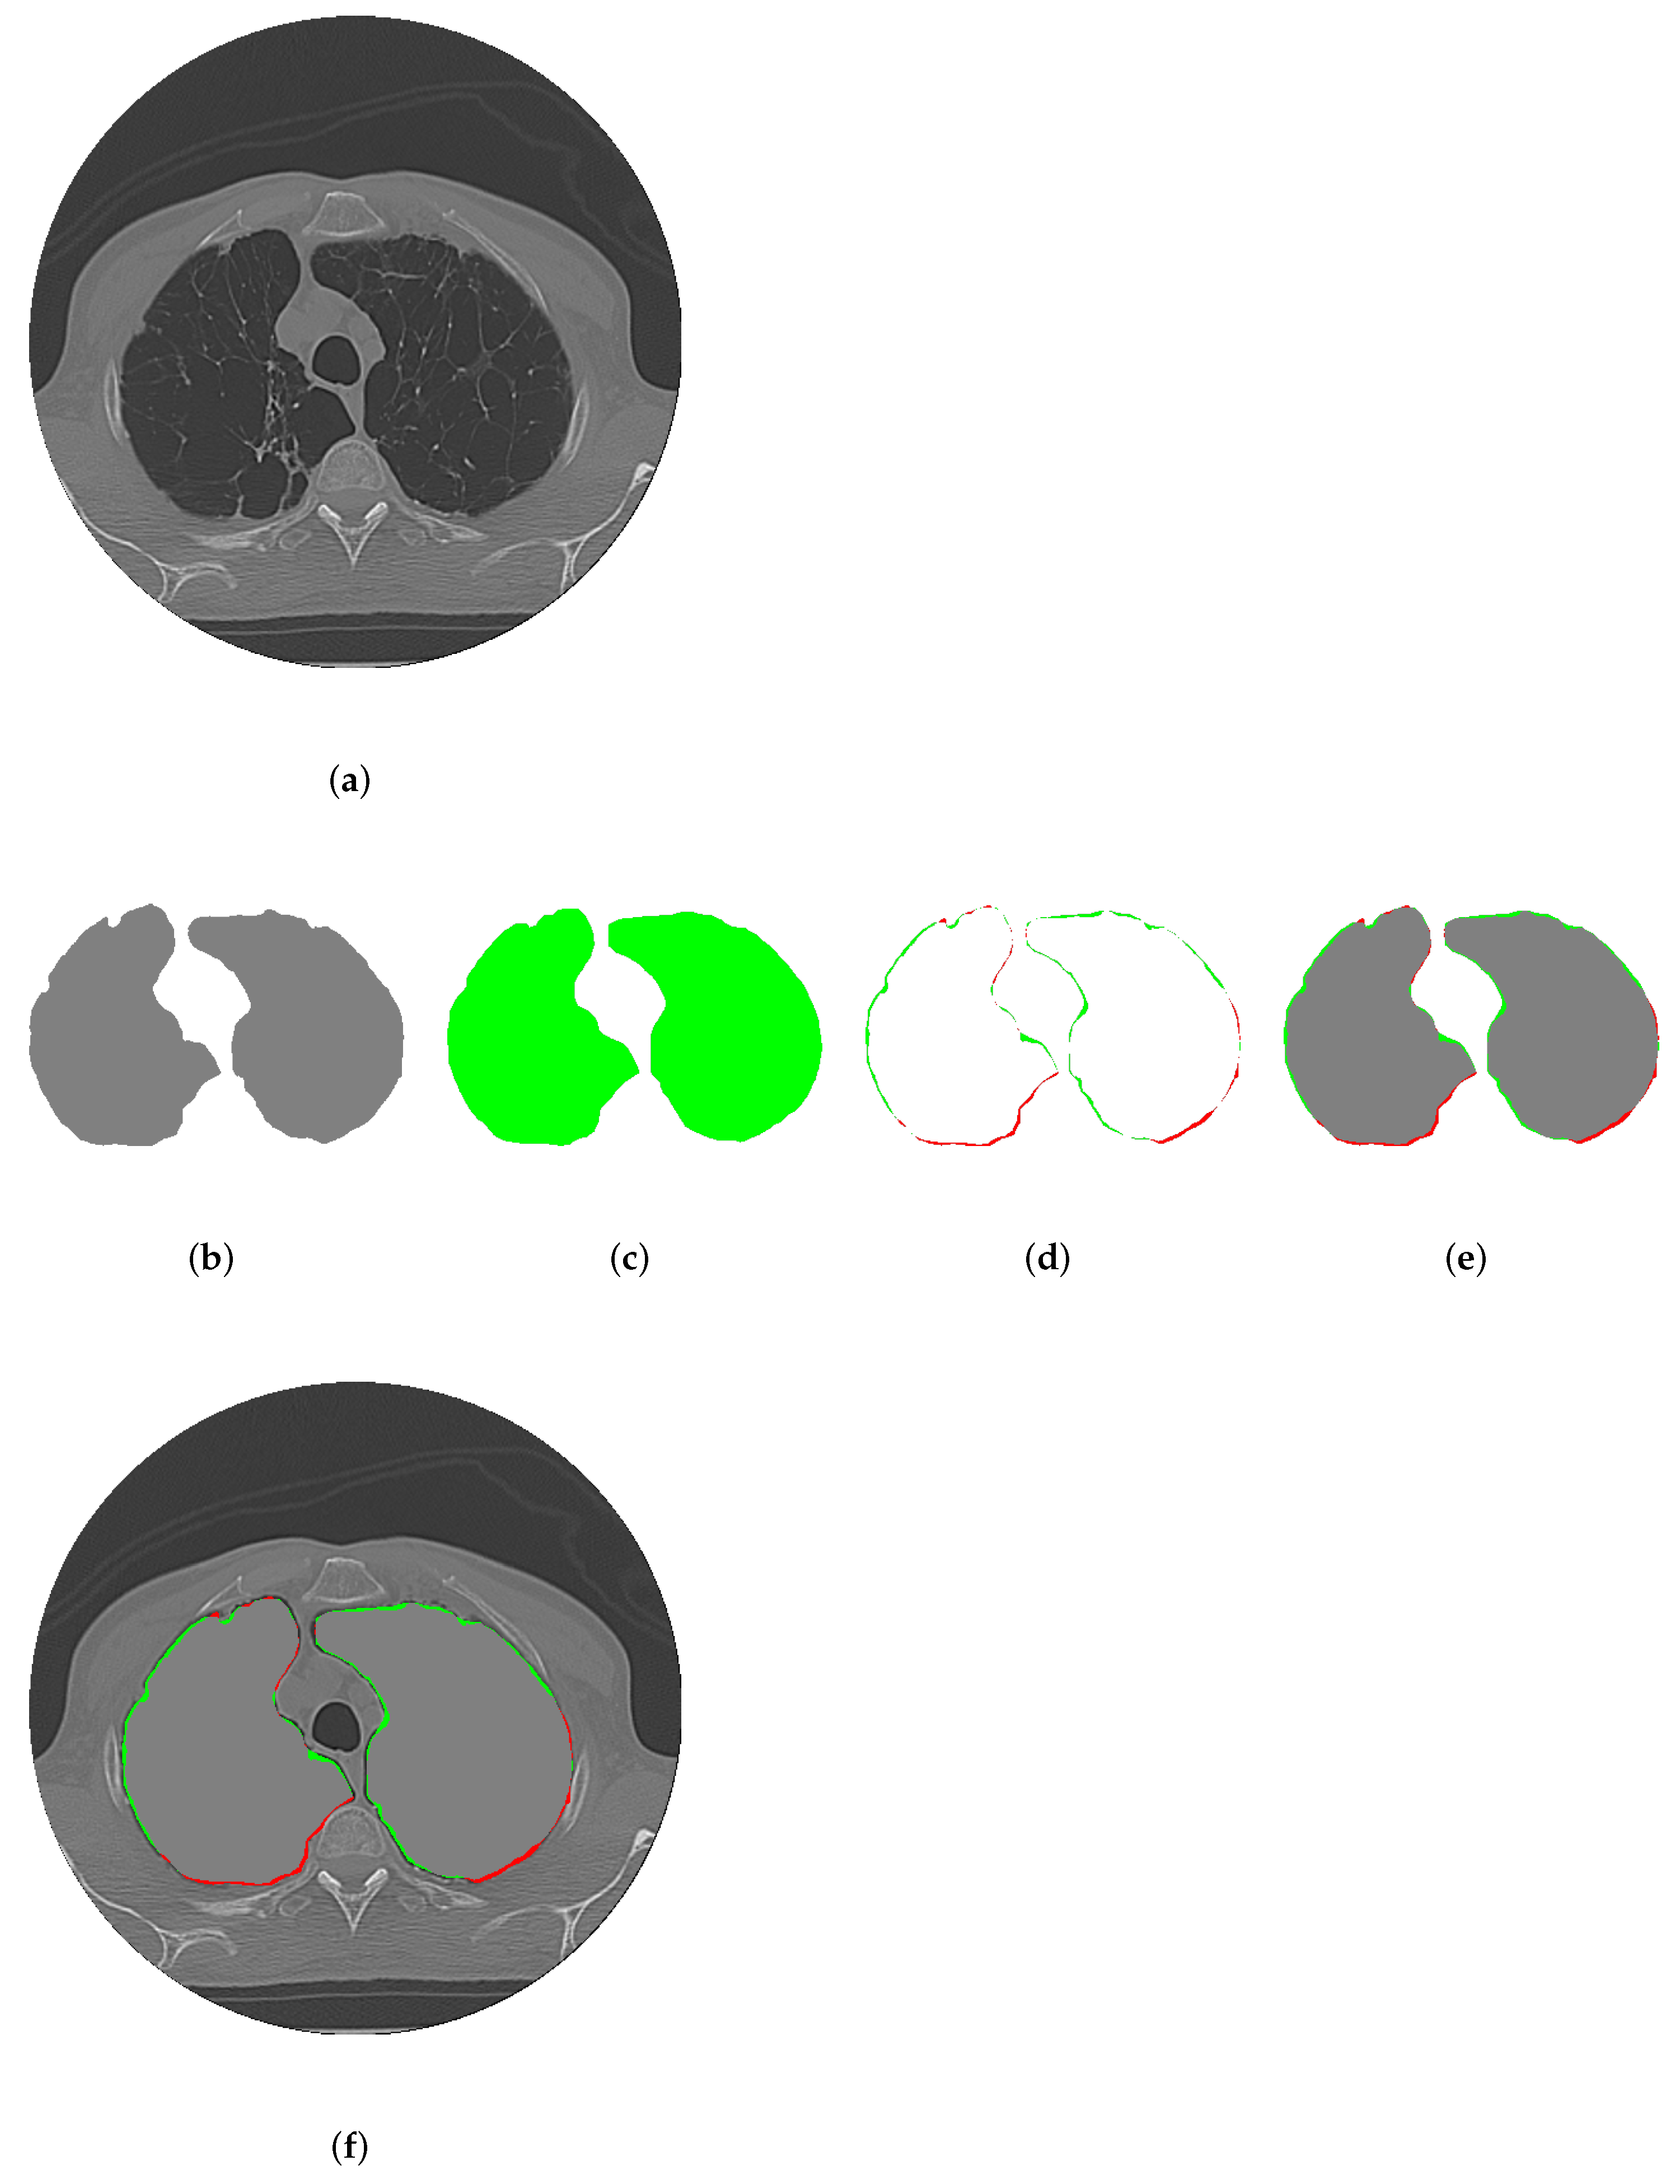
2.3. Evaluation Metrics for Segmentation
3. Results and Discussion
3.1. CDAC Settings
3.2. Individual Analysis Approach
- Anatomical complexity:
- –
- Right lung: With three lobes, the right lung has a more complex anatomy, which can make segmentation more challenging. The horizontal and oblique fissures must be correctly identified to separate the lobes.
- –
- Left lung: With only two lobes, segmentation can be simpler due to less anatomical complexity. The presence of only one oblique fissure makes it easier to separate the lobes.
- Interference from neighboring structures:
- –
- Right lung: Less interference from the heart, which can simplify segmentation. However, the azygos vein and other structures can still create challenges.
- –
- Left lung: Proximity to the heart and deep cardiac impression can make accurate segmentation difficult, especially in the area close to the heart.
- Size and Shape:
- –
- Right lung: Larger volume and more lobes may provide more data for the segmentation algorithm, but they also increase complexity.
- –
- Left lung: Smaller volume and fewer lobes may simplify segmentation, but the shape may be more irregular due to the cardiac impression.
- Aspiration cases and anomalies:
- –
- Right lung: More prone to foreign body aspiration due to the more vertical bronchus, which may introduce variability in the images.
- –
- Left lung: Less prone to foreign body aspiration, potentially resulting in less variability.
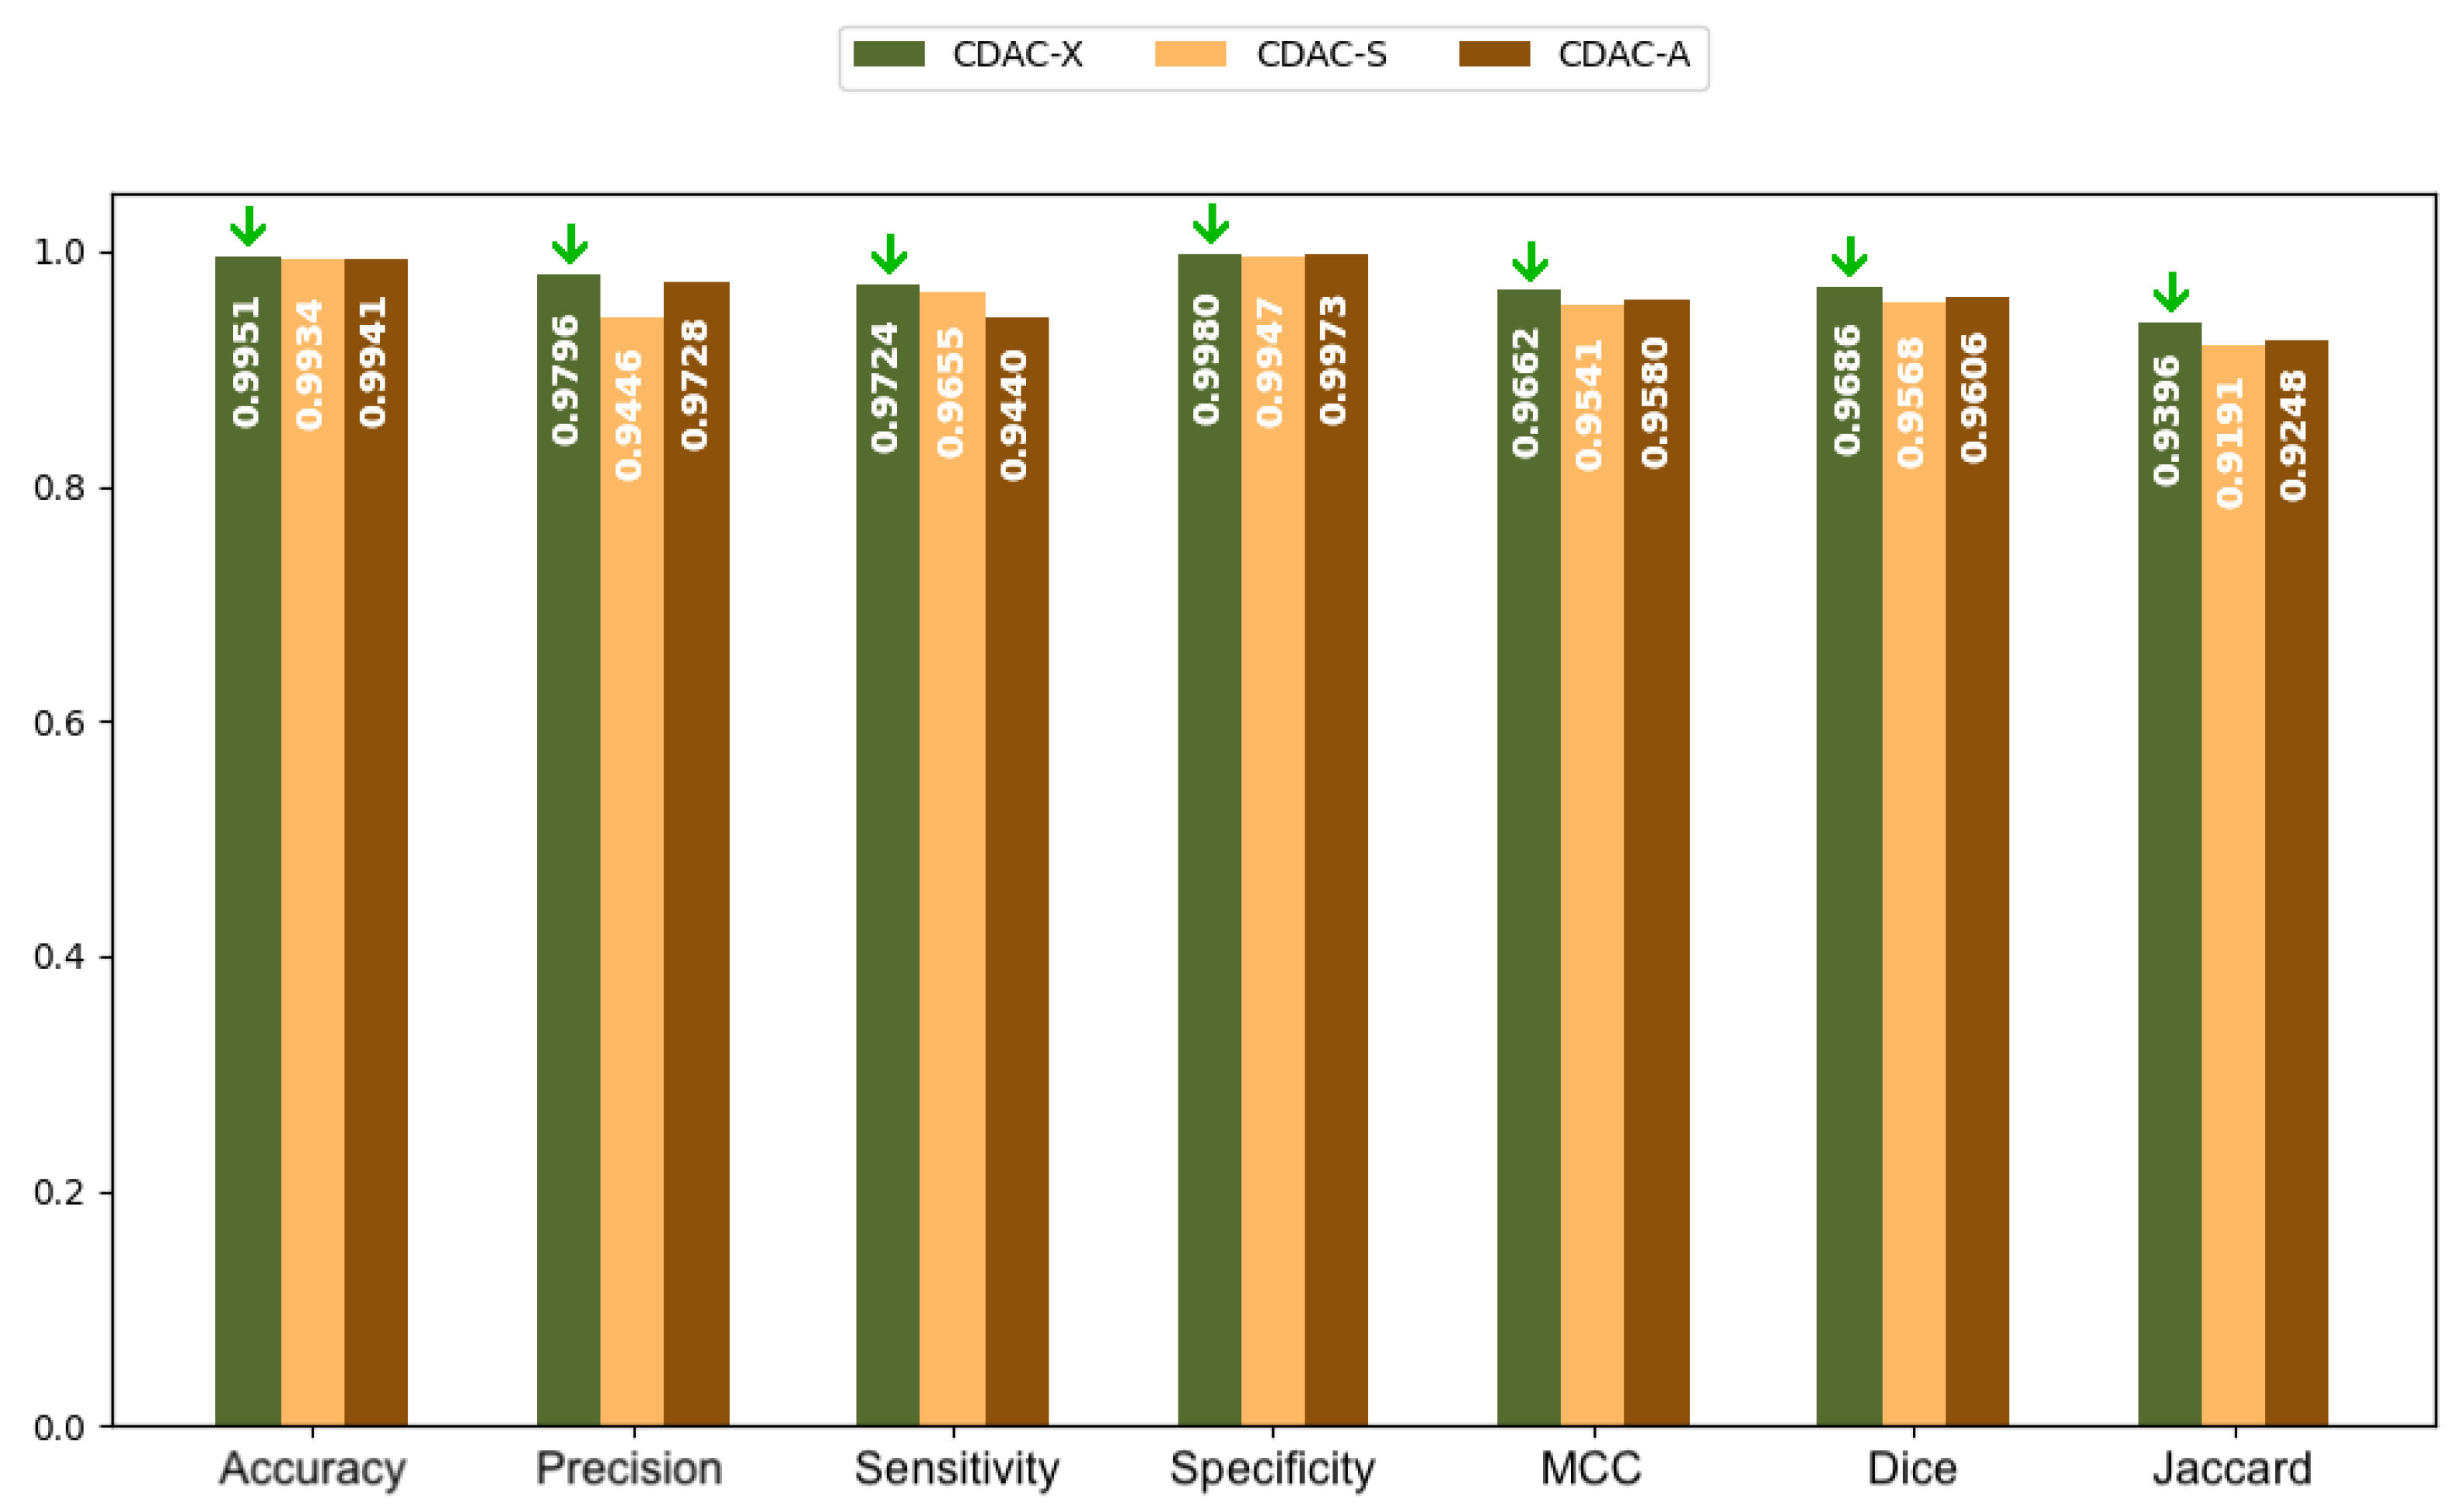
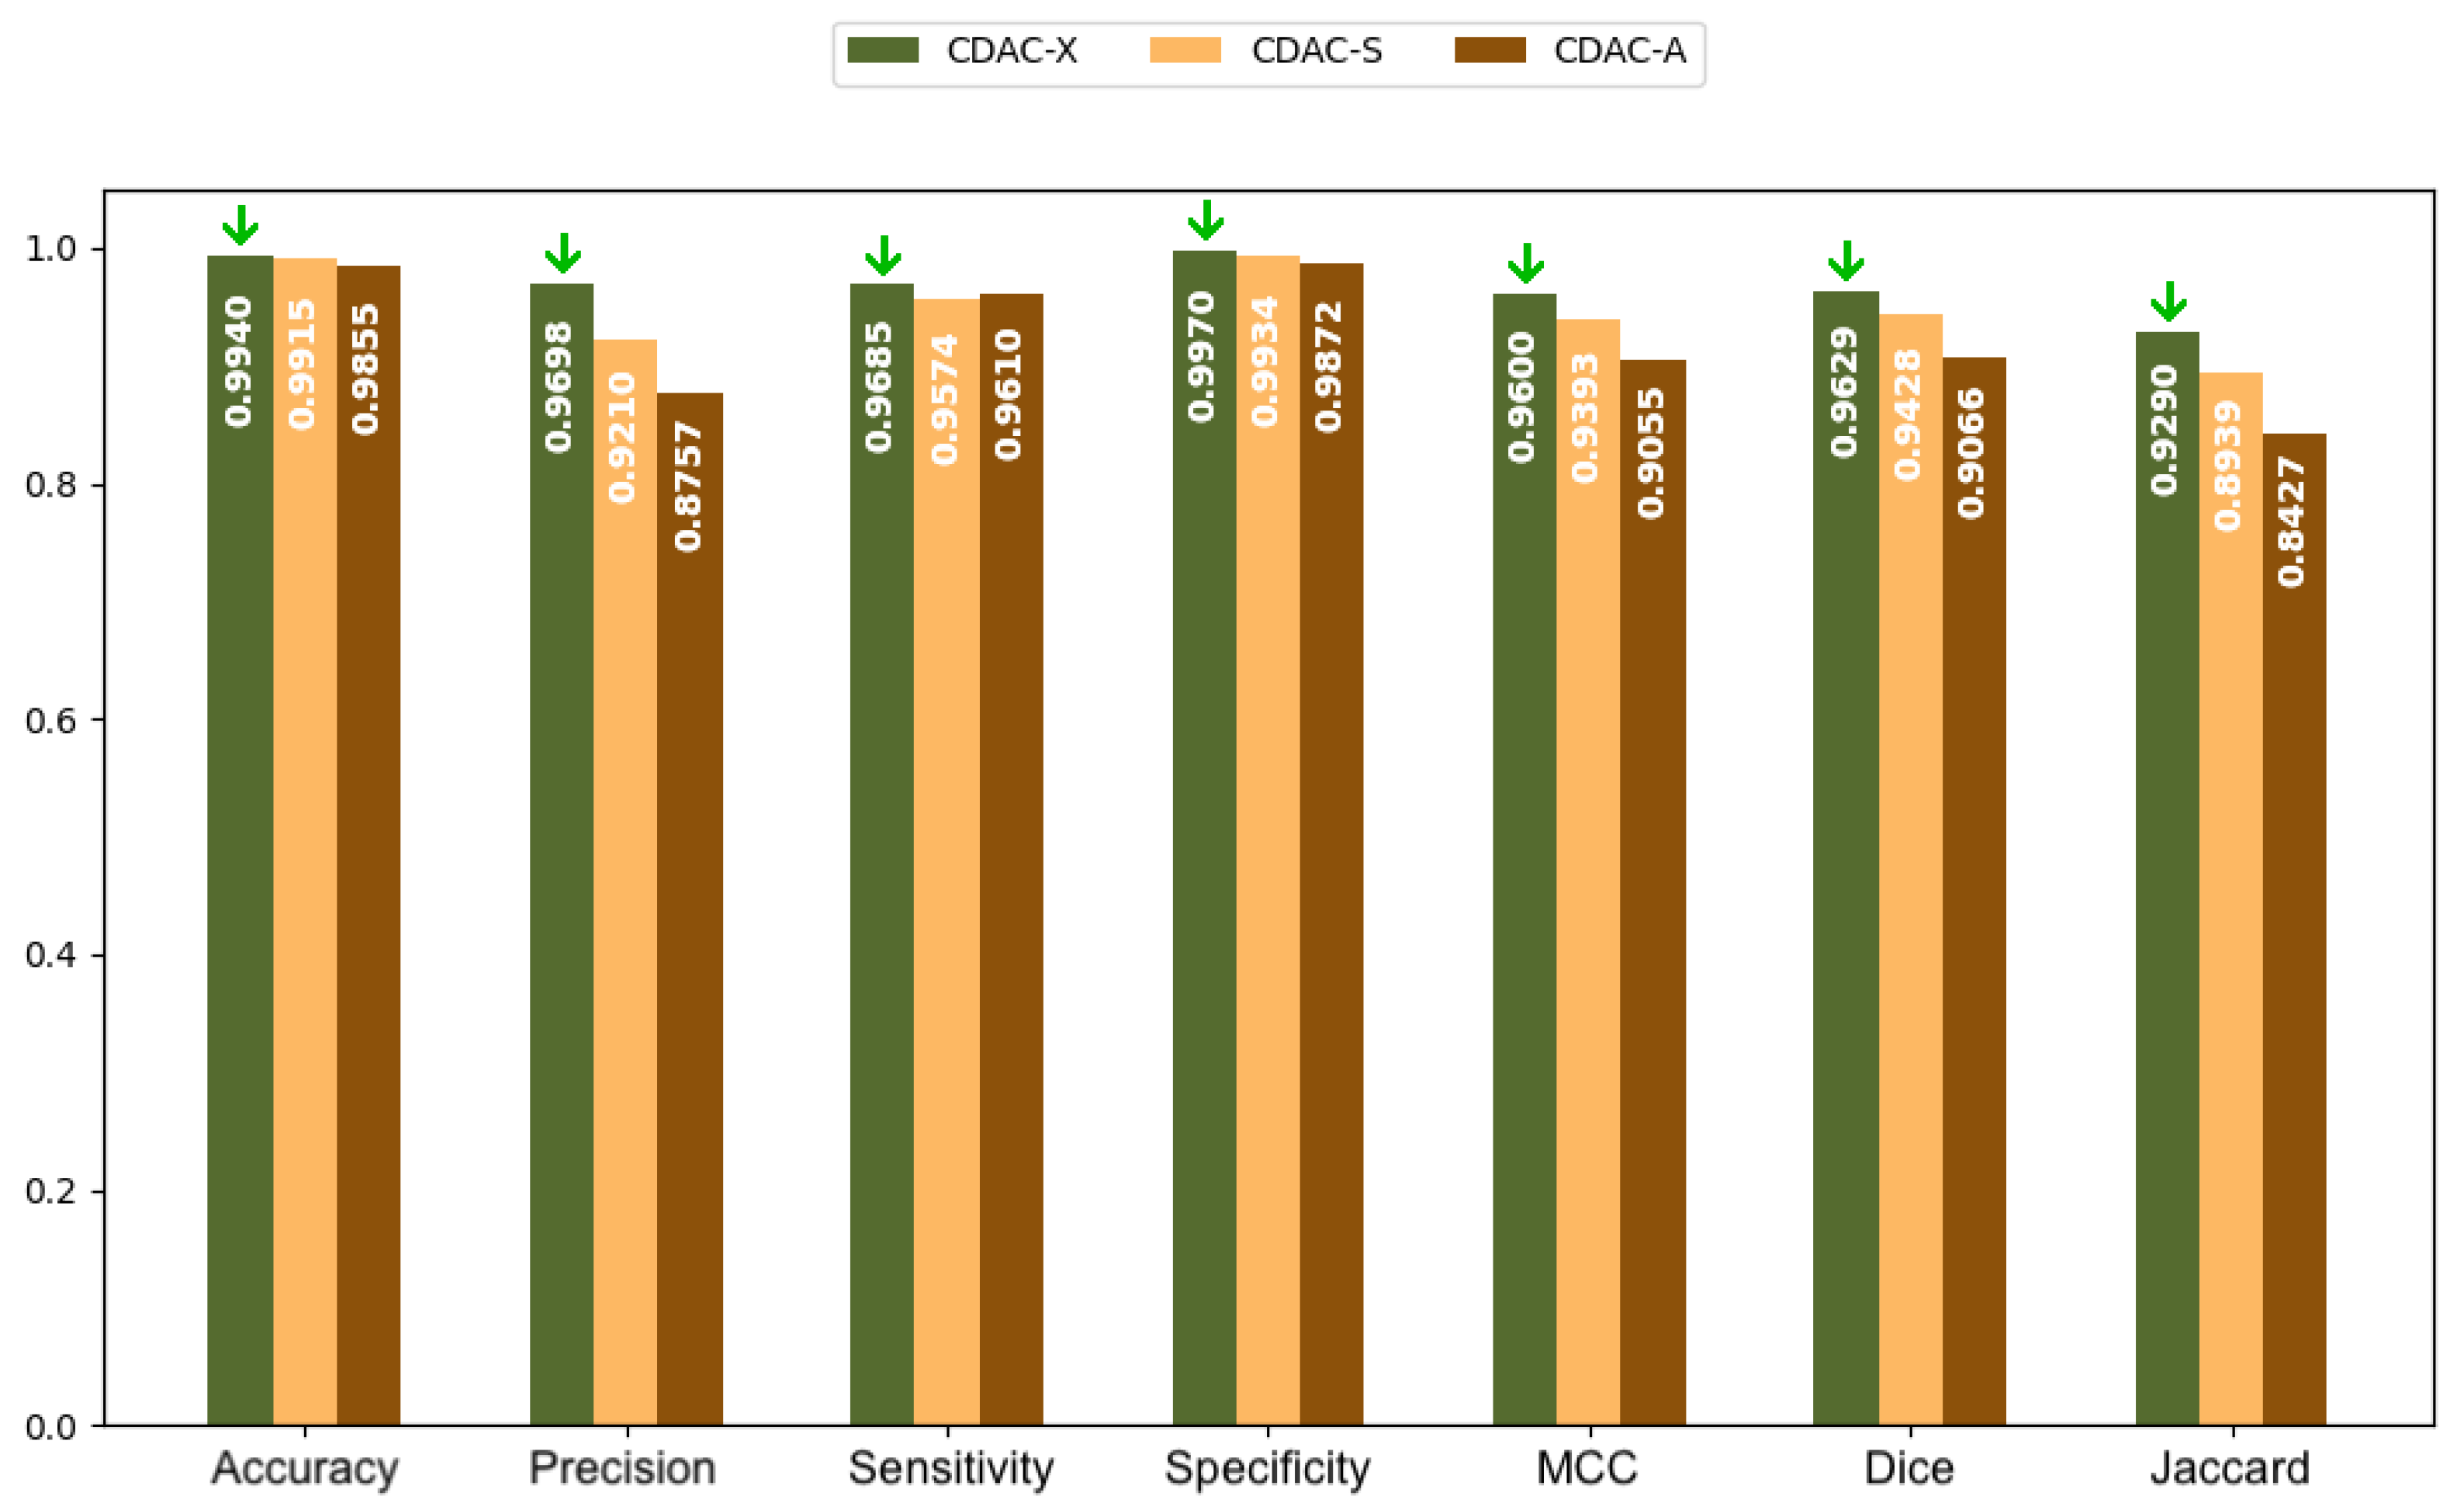
3.2.1. Analysis Between CDAC Versions—Individual Approach
3.2.2. Comparison with Other Methods—Individual Approach

| Methods | Accuracy | Precision | Sensitivity | Specificity | ||||
|---|---|---|---|---|---|---|---|---|
| Left Lung | Right Lung | Left Lung | Right Lung | Left Lung | Right Lung | Left Lung | Right Lung | |
| CDAC-X 3 | 0.9954 ± 0.0027 | 0.9944 ± 0.0032 | 0.9796 ± 0.0282 | 0.9698 ± 0.0277 | 0.9777 ± 0.0157 | 0.9691 ± 0.0165 | 0.9980 ± 0.0029 | 0.9970 ± 0.0033 |
| He et al. (2023) [32] | 0.9835 ± 0.0075 | 0.9828 ± 0.0078 | 0.9315 ± 0.0418 | 0.9303 ± 0.0435 | 0.9321 ± 0.0420 | 0.9297 ± 0.0438 | 0.9830 ± 0.0072 | 0.9825 ± 0.0077 |
| Filho et al. (2019) [31] | 0.9878 ± 0.0039 | 0.9879 ± 0.0039 | 0.9935 ± 0.0133 4 | 0.9939 ± 0.0109 | 0.8618 ± 0.0437 | 0.8640 ± 0.0510 | 0.9994 ± 0.0013 | 0.9991 ± 0.0018 |
| Filho et al. (2014) [12] | 0.9951 ± 0.0027 | 0.9938 ± 0.0034 | 0.9569 ± 0.0599 | 0.9620 ± 0.0307 | 0.9724 ± 0.0235 | 0.9685 ± 0.0236 | 0.9969 ± 0.0032 | 0.9965 ± 0.0031 |
| Felix et al. (2013) [33] | 0.9770 ± 0.0261 | 0.9806 ± 0.0194 | 0.8651 ± 0.1673 | 0.8839 ± 0.1131 | 0.8674 ± 0.1966 | 0.9096 ± 0.0938 | 0.9871 ± 0.0154 | 0.9874 ± 0.0153 |
| Rebouças Filho et al. (2011) [34] | 0.9901 ± 0.0053 | 0.9893 ± 0.0065 | 0.9783 ± 0.0561 | 0.9638 ± 0.0614 | 0.9003 ± 0.0402 | 0.9085 ± 0.0336 | 0.9985 ± 0.0036 | 0.9967 ± 0.0052 |
| Alexandria et al. (2010) [35] | 0.9881 ± 0.0074 | 0.9874 ± 0.0097 | 0.9354 ± 0.0904 | 0.9437 ± 0.0596 | 0.9175 ± 0.0267 | 0.9124 ± 0.0353 | 0.9942 ± 0.0073 | 0.9939 ± 0.0086 |
| Felix et al. (2009) [30] | 0.9948 ± 0.0022 | 0.9940 ± 0.0036 | 0.9786 ± 0.0367 | 0.9802 ± 0.0283 | 0.9528 ± 0.0256 | 0.9471 ± 0.0251 | 0.9985 ± 0.0019 | 0.9980 ± 0.0033 |
| Li and Acton (2006) [14] | 0.9899 ± 0.0050 | 0.9888 ± 0.0090 | 0.9293 ± 0.1487 | 0.9577 ± 0.0516 | 0.9215 ± 0.0304 | 0.9145 ± 0.0387 | 0.9961 ± 0.0048 | 0.9954 ± 0.0078 |
| Xu and Prince (1998) [13] | 0.9885 ± 0.0085 | 0.9791 ± 0.0318 | 0.9533 ± 0.0827 | 0.9658 ± 0.0507 | 0.9126 ± 0.0424 | 0.8678 ± 0.1282 | 0.9959 ± 0.0060 | 0.9958 ± 0.0093 |
| Methods | Dice | Jaccard | MCC | Hausdorff | ||||
|---|---|---|---|---|---|---|---|---|
| Left Lung | Right Lung | Left Lung | Right Lung | Left Lung | Right Lung | Left Lung | Right Lung | |
| CDAC-X 5 | 0.9686 ± 0.0151 | 0.9641 ± 0.0166 | 0.9396 ± 0.0279 | 0.9312 ± 0.0304 | 0.9662 ± 0.0157 | 0.9613 ± 0.0176 | 4.3818 ± 1.1329 | 6.6402 ± 2.6732 |
| He et al. (2023) [32] | 0.9429 ± 0.0259 | 0.9418 ± 0.0266 | 0.8930 ± 0.0459 | 0.8915 ± 0.0470 | 0.9336 ± 0.0276 | 0.9312 ± 0.0283 | 32.9000 ± 1.8200 | 33.1700 ± 1.8300 |
| Filho et al. (2019) [31] | 0.9222 ± 0.0235 | 0.9234 ± 0.0271 | 0.8566 ± 0.0406 | 0.8589 ± 0.0461 | 0.9186 ± 0.0209 | 0.9200 ± 0.0254 | 6.2447 ± 1.1128 | 7.4814 ± 2.7366 |
| Filho et al. (2014) [12] | 0.9659 ± 0.0323 | 0.9651 ± 0.0149 6 | 0.9357 ± 0.0550 | 0.9330 ± 0.0274 | 0.9641 ± 0.0304 | 0.9622 ± 0.0158 | 4.5954 ± 1.1834 | 6.0330 ± 2.6641 |
| Felix et al. (2013) [33] | 0.8499 ± 0.1782 | 0.8877 ± 0.0800 | 0.7688 ± 0.1961 | 0.8063 ± 0.1140 | 0.8466 ± 0.1712 | 0.8825 ± 0.0786 | 17.4651 ± 2.1102 | 16.9211 ± 3.2122 |
| Rebouças Filho et al. (2011) [34] | 0.9358 ± 0.0291 | 0.9336 ± 0.0322 | 0.8807 ± 0.0498 | 0.8771 ± 0.0536 | 0.9323 ± 0.0280 | 0.9291 ± 0.0330 | 8.9734 ± 1.4054 | 11.8374 ± 2.8111 |
| Alexandria et al. (2010) [35] | 0.9229 ± 0.0497 | 0.9263 ± 0.0312 | 0.8603 ± 0.0734 | 0.8642 ± 0.0524 | 0.9181 ± 0.0460 | 0.9203 ± 0.0355 | 10.1758 ± 1.6466 | 12.5796 ± 1.9638 |
| Felix et al. (2009) [30] | 0.9647 ± 0.0167 | 0.9628 ± 0.0155 | 0.9323 ± 0.0304 | 0.9287 ± 0.0279 | 0.9624 ± 0.0161 | 0.9599 ± 0.0166 | 8.7083 ± 1.4481 | 11.0324 ± 1.8023 |
| Li and Acton (2006) [14] | 0.9161 ± 0.0999 | 0.9341 ± 0.0279 | 0.8571 ± 0.1309 | 0.8777 ± 0.0479 | 0.9152 ± 0.0861 | 0.9290 ± 0.0314 | 7.2563 ± 1.2725 | 9.8863 ± 1.5893 |
| Xu and Prince (1998) [13] | 0.9292 ± 0.0471 | 0.9065 ± 0.0843 | 0.8710 ± 0.0731 | 0.8383 ± 0.1214 | 0.9249 ± 0.0449 | 0.9015 ± 0.0858 | 6.4655 ± 1.1463 | 9.1117 ± 1.5038 |
3.3. General Analysis Approach
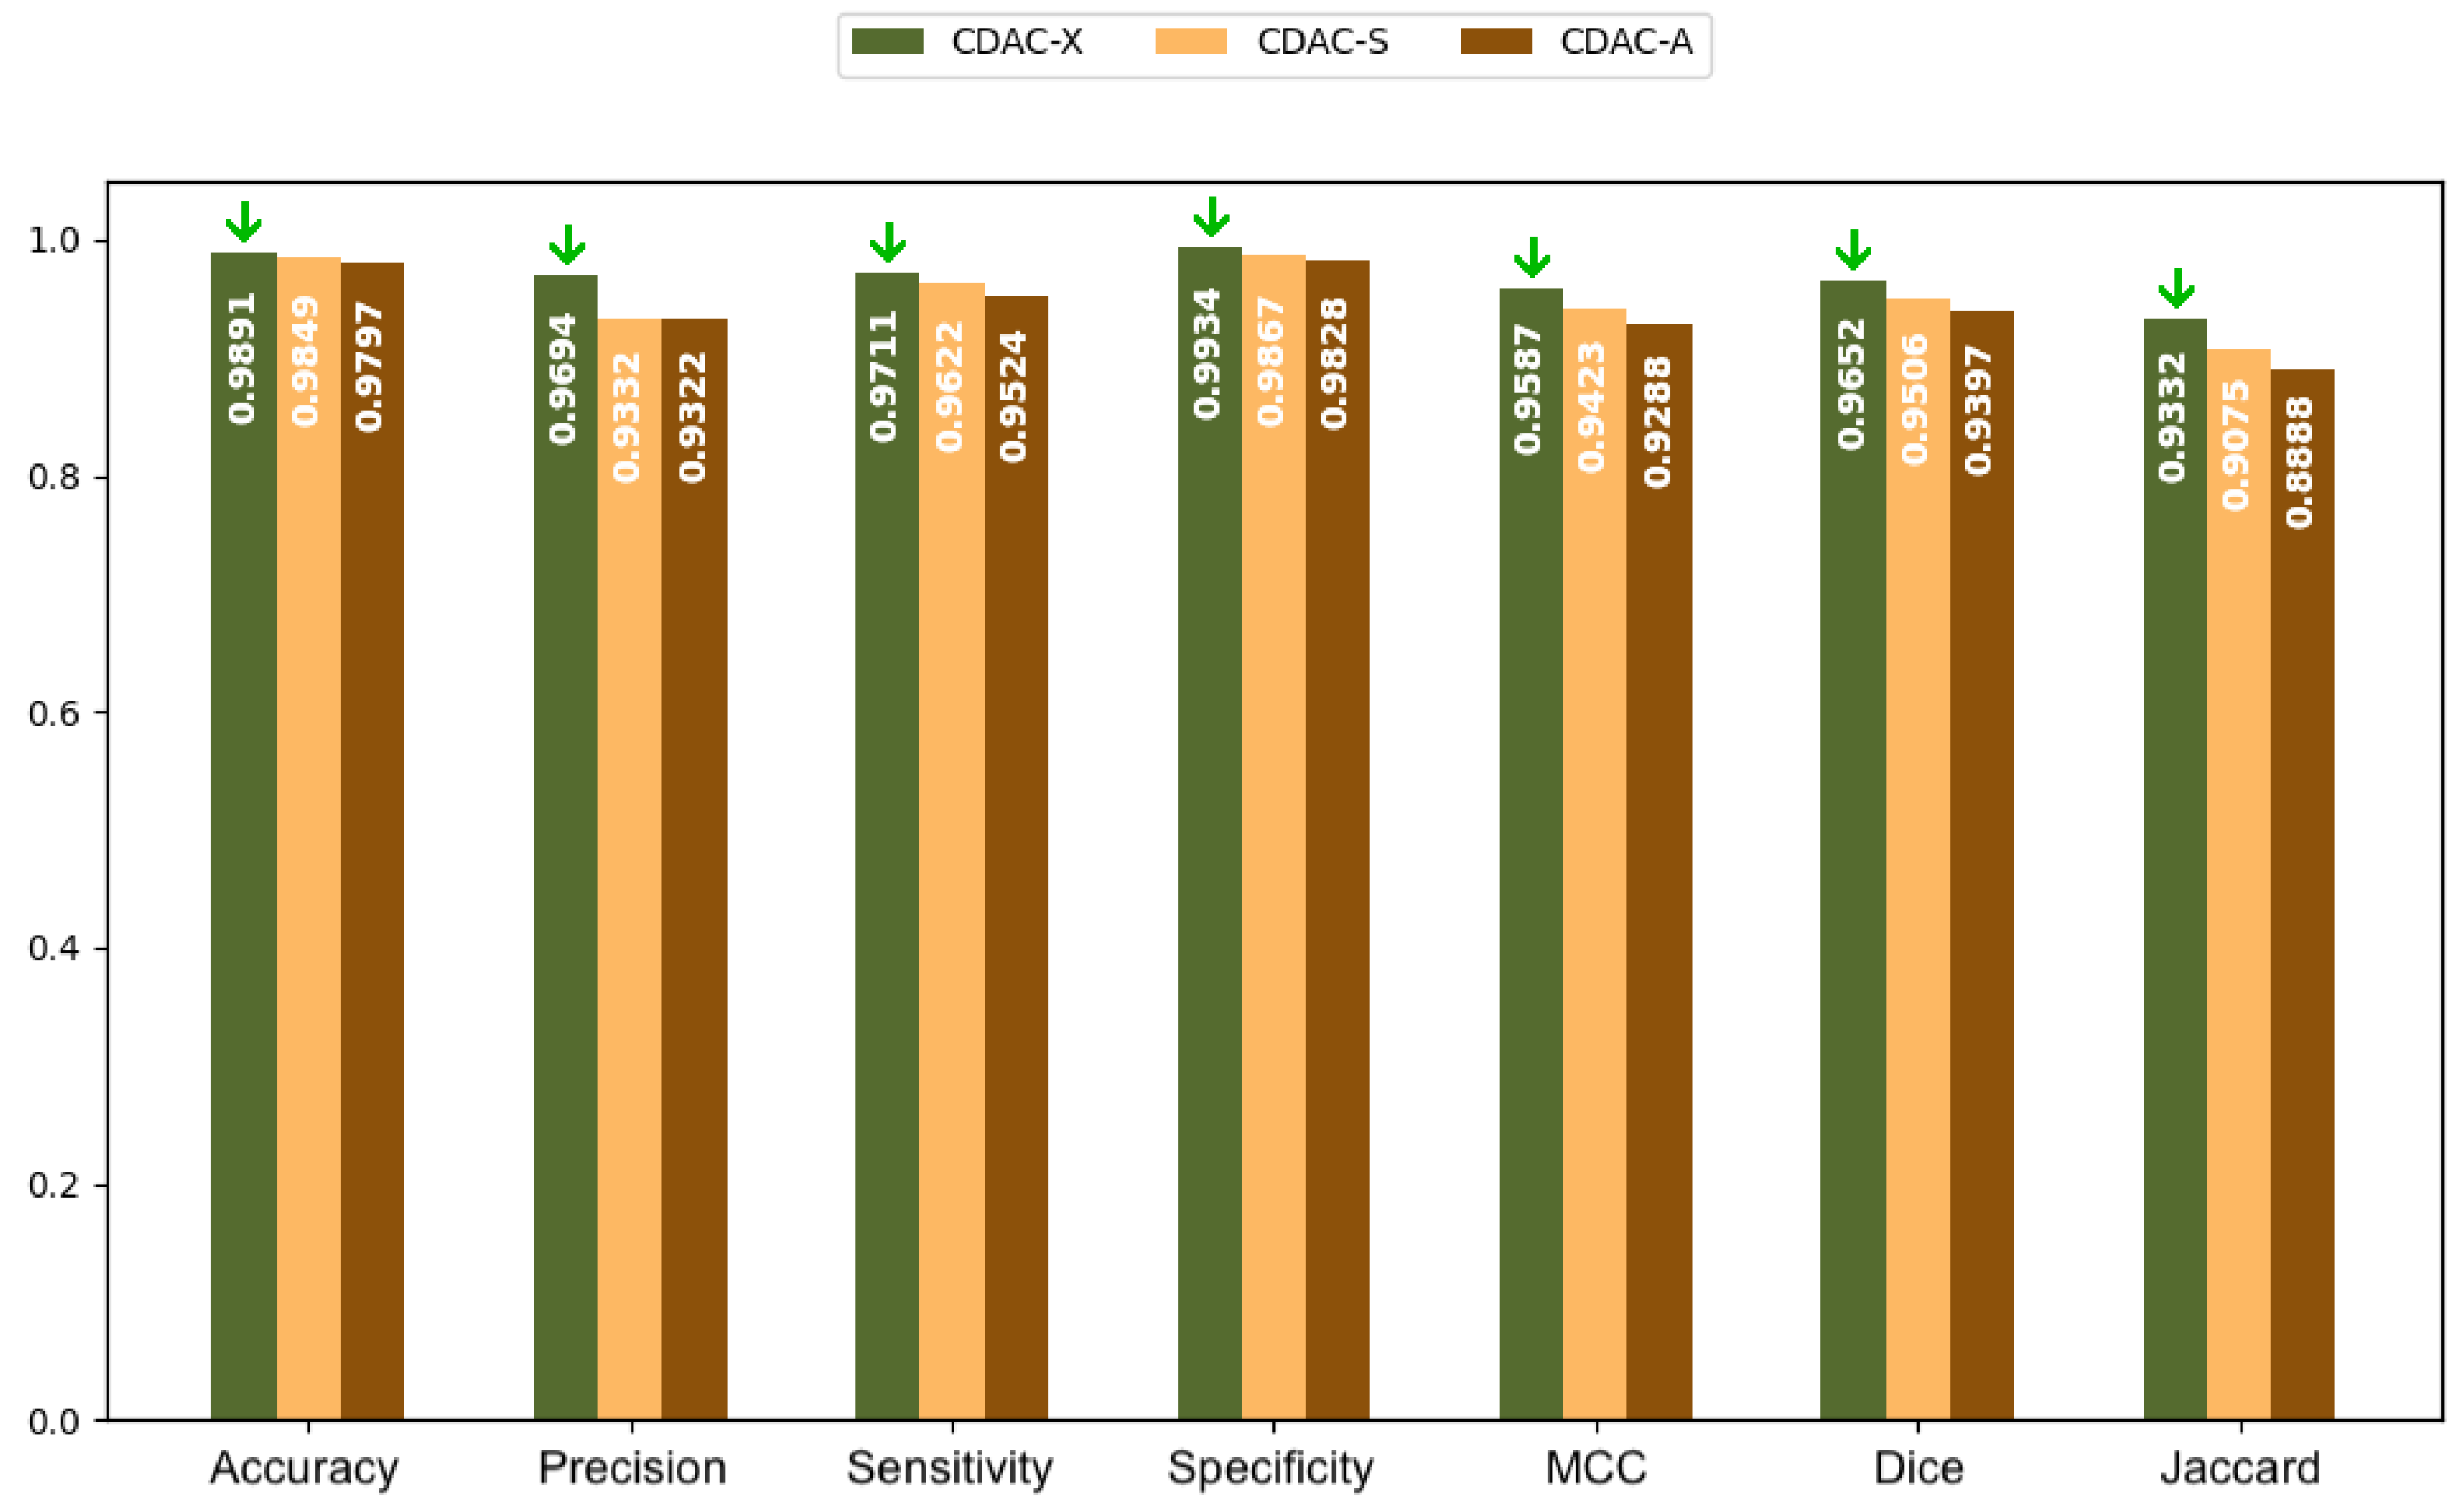
3.3.1. Analysis Between CDAC Versions—General Approach
3.3.2. Comparison with Other Methods—General Approach
| Methods | Accuracy | Sensitivity | MCC |
|---|---|---|---|
| CDAC-X 9 | 0.9891 ± 0.0058 | 0.9711 ± 0.0216 | 0.9637 ± 0.0181 9 |
| He et al. (2023) [32] | 0.9828 ± 0.0075 | 0.9309 ± 0.0429 | 0.9327 ± 0.0280 |
| de S. Rebouças et al. (2021) [36] | 0.9897 ± 0.0065 | 0.9857 ± 0.0178 | 0.9473 ± 0.0150 |
| Braga et al. (2021) [39] | 0.9717 ± 0.0109 | 0.8248 ± 0.0616 | 0.8854 ± 0.0367 |
| Medeiros et al. (2020) [37] | 0.9886 ± 0.0046 | 0.9921 ± 0.0066 10 | 0.9554 ± 0.0132 |
| Filho et al. (2019) [31] | 0.9731 ± 0.0079 | 0.8489 ± 0.0471 | 0.9036 ± 0.0226 |
| Braga et al. (2017) [38] | 0.9884 ± 0.0046 | 0.9739 ± 0.0287 | 0.9555 ± 0.0138 |
| Filho et al. (2014) [12] | 0.9898 ± 0.0057 | 0.9736 ± 0.0141 | 0.9612 ± 0.0183 |
| Felix et al. (2013) [33] | 0.9577 ± 0.0396 | 0.9768 ± 0.0345 | 0.8538 ± 0.1185 |
| Rebouças Filho et al. (2011) [34] | 0.9803 ± 0.0088 | 0.9058 ± 0.0344 | 0.9266 ± 0.0269 |
| Alexandria et al. (2010) [35] | 0.9756 ± 0.0163 | 0.9159 ± 0.0287 | 0.9133 ± 0.0305 |
| Felix et al. (2009) [30] | 0.9888 ± 0.0052 | 0.9501 ± 0.0229 | 0.9586 ± 0.0110 |
| Li and Acton (2006) [14] | 0.9788 ± 0.0128 | 0.9189 ± 0.0333 | 0.9212 ± 0.0315 |
| Xu and Prince (1998) [13] | 0.9678 ± 0.0357 | 0.8868 ± 0.0791 | 0.8999 ± 0.0637 |
| Methods | Dice | Jaccard | Hausdorff |
|---|---|---|---|
| CDAC-X 11 | 0.9680 ± 0.0163 | 0.9382 ± 0.0297 | 5.2922 ± 1.1134 |
| He et al. (2023) [32] | 0.9424 ± 0.0263 | 0.8922 ± 0.0465 | 33.0336 ± 1.8253 |
| de S. Rebouças et al. (2021) [36] | 0.9551 ± 0.0142 | 0.9145 ± 0.0262 | 4.2400 ± 0.4300 12 |
| Braga et al. (2021) [39] | 0.8971 ± 0.0401 | 0.8157 ± 0.0618 | 119.4400 ± 39.5800 |
| Medeiros et al. (2020) [37] | 0.9619 ± 0.0193 | 0.9273 ± 0.0343 | 5.5700 ± 1.1700 |
| Filho et al. (2019) [31] | 0.9158 ± 0.0256 | 0.8456 ± 0.0437 | 77.7383 ± 1.7590 |
| Braga et al. (2017) [38] | 0.9623 ± 0.0134 | 0.9276 ± 0.0245 | 88.8900 ± 31.4300 |
| Filho et al. (2014) [12] | 0.9672 ± 0.0170 | 0.9371 ± 0.0309 | 5.1400 ± 1.1700 |
| Felix et al. (2013) [33] | 0.8729 ± 0.1118 | 0.7882 ± 0.1443 | 19.0498 ± 1.7982 |
| Rebouças Filho et al. (2011) [34] | 0.9372 ± 0.0266 | 0.8830 ± 0.0449 | 10.7655 ± 1.2027 |
| Alexandria et al. (2010) [35] | 0.9281 ± 0.0221 | 0.8665 ± 0.0379 | 13.0924 ± 1.1400 |
| Felix et al. (2009) [30] | 0.9651 ± 0.0099 | 0.9329 ± 0.0183 | 6.6433 ± 1.1095 |
| Li and Acton (2006) [14] | 0.9333 ± 0.0278 | 0.8761 ± 0.0474 | 11.9261 ± 1.1579 |
| Xu and Prince (1998) [13] | 0.9176 ± 0.0477 | 0.8510 ± 0.0761 | 14.3020 ± 1.3013 |
| Method | Time (s) |
|---|---|
| CDAC-X | 7.42 ± 5.24 |
| He et al. (2023) [32] | 1.15 ± 2.75 |
| de S. Rebouças et al. (2021) [36] | 1.32 ± 0.09 |
| Braga et al. (2021) [39] | 0.13 ± 0.02 13 |
| Medeiros et al. (2020) [37] | 1.85 ± 0.50 |
| Filho et al. (2019) [31] | 5.86 ± 1.96 |
| Braga et al. (2017) [38] | 2.01 ± 0.46 |
| Filho et al. (2014) [12] | 2.00 ± 0.16 |
| Felix et al. (2009) [30] | 4.90 ± 2.02 |
| Li and Acton (2006) [14] | 30.00 ± 2.67 |
| Xu and Prince (1998) [13] | 240.00 ± 3.05 |
3.4. Comorbidity Approach
3.4.1. Analysis Between CDAC Versions—Comorbidity Approach
3.4.2. Comparison with Other Methods—Comorbidity Approach
| Methods | Accuracy | Precision | Sensitivity | Specificity | MCC |
|---|---|---|---|---|---|
| Healthy Lungs | |||||
| CDAC-X | 0.9877 ± 0.0055 | 0.9774 ± 0.0211 | 0.9762 ± 0.0164 | 0.9911 ± 0.0100 | 0.9663 ± 0.0087 |
| He et al. (2023) [32] | 0.9845 ± 0.0062 | 0.9719 ± 0.0225 | 0.9577 ± 0.0335 | 0.9889 ± 0.0114 | 0.9540 ± 0.0162 |
| Filho et al. (2019) [31] | 0.9719 ± 0.0082 | 0.9917±0.0091 | 0.8891 ± 0.0439 | 0.9968 ± 0.0038 | 0.9200 ± 0.0193 |
| Filho et al. (2014) [12] | 0.9880 ± 0.0057 | 0.9777 ± 0.0167 | 0.9718 ± 0.0080 | 0.9920 ± 0.0081 | 0.9651 ± 0.0083 |
| Felix et al. (2013) [33] | 0.9453 ± 0.0338 | 0.8668 ± 0.1061 | 0.9210 ± 0.0308 | 0.9476 ± 0.0441 | 0.8555 ± 0.0667 |
| Rebouças Filho et al. (2011) [34] | 0.9731 ± 0.0091 | 0.9817 ± 0.0222 | 0.9031 ± 0.0340 | 0.9936 ± 0.0072 | 0.9232 ± 0.0192 |
| Alexandria et al. (2010) [35] | 0.9631 ± 0.0214 | 0.9462 ± 0.0529 | 0.9095 ± 0.0266 | 0.9770 ± 0.0275 | 0.9013 ± 0.0373 |
| Felix et al. (2009) [30] | 0.9852 ± 0.0060 | 0.9825 ± 0.0193 | 0.9543 ± 0.0179 | 0.9938 ± 0.0075 | 0.9581 ± 0.0106 |
| Li and Acton (2006) [14] | 0.9704 ± 0.0175 | 0.9721 ± 0.0316 | 0.9105 ± 0.0317 | 0.9869 ± 0.0195 | 0.9197 ± 0.0299 |
| Xu and Prince (1998) [13] | 0.9382 ± 0.0489 | 0.9622 ± 0.0404 | 0.8410 ± 0.1136 | 0.9829 ± 0.0211 | 0.8563 ± 0.0835 |
| COPD Lungs | |||||
| CDAC-X | 0.9884 ± 0.0065 | 0.9662 ± 0.0278 | 0.9710 ± 0.0324 | 0.9996 ± 0.0010 | 0.9675 ± 0.0202 |
| He et al. (2023) [32] | 0.9814 ± 0.0084 | 0.9497 ± 0.0327 | 0.9356 ± 0.0312 | 0.9903 ± 0.0073 | 0.9313 ± 0.0242 |
| Filho et al. (2019) [31] | 0.9695 ± 0.0060 | 0.9981 ± 0.0045 | 0.8284 ± 0.0376 | 0.9932 ± 0.0062 | 0.8925 ± 0.0215 |
| Filho et al. (2014) [12] | 0.9895 ± 0.0065 | 0.9542 ± 0.0325 | 0.9801 ± 0.0128 | 0.9910 ± 0.0075 | 0.9607 ± 0.0205 |
| Felix et al. (2013) [33] | 0.9794 ± 0.0084 | 0.9458 ± 0.0534 | 0.9249 ± 0.0317 | 0.9887 ± 0.0113 | 0.9225 ± 0.0251 |
| Rebouças Filho et al. (2011) [34] | 0.9827 ± 0.0068 | 0.9846 ± 0.0227 | 0.9052 ± 0.0378 | 0.9968 ± 0.0047 | 0.9339 ± 0.0248 |
| Alexandria et al. (2010) [35] | 0.9812 ± 0.0059 | 0.9625 ± 0.0418 | 0.9199 ± 0.0317 | 0.9921 ± 0.0088 | 0.9295 ± 0.0162 |
| Felix et al. (2009) [30] | 0.9897 ± 0.0039 | 0.9854 ± 0.0170 | 0.9481 ± 0.0252 | 0.9969 ± 0.0036 | 0.9604 ± 0.0129 |
| Li and Acton (2006) [14] | 0.9842 ± 0.0050 | 0.9834 ± 0.0215 | 0.9166 ± 0.0370 | 0.9965 ± 0.0046 | 0.9400 ± 0.0172 |
| Xu and Prince (1998) [13] | 0.9833 ± 0.0061 | 0.9804 ± 0.0277 | 0.9144 ± 0.0369 | 0.9960 ± 0.0060 | 0.9368 ± 0.0211 |
| Lungs with Fibrosis | |||||
| CDAC-X | 0.9911 ± 0.0046 | 0.9644 ± 0.0395 | 0.9661 ± 0.0133 | 0.9969 ± 0.0046 | 0.9576 ± 0.0214 |
| He et al. (2023) [32] | 0.9825 ± 0.0074 | 0.9481 ± 0.0520 | 0.8993 ± 0.0411 | 0.9940 ± 0.0066 | 0.9129 ± 0.0256 |
| Filho et al. (2019) [31] | 0.9780 ± 0.0067 | 0.9980 ± 0.0047 | 0.8293 ± 0.0298 | 0.9998 ± 0.0006 | 0.8982 ± 0.0167 |
| Filho et al. (2014) [12] | 0.9920 ± 0.0037 | 0.9543 ± 0.0467 | 0.9688 ± 0.0172 | 0.9950 ± 0.0044 | 0.9536 ± 0.0210 |
| Felix et al. (2013) [33] | 0.9484 ± 0.0516 | 0.8309 ± 0.1111 | 0.8085 ± 0.2204 | 0.9768 ± 0.0164 | 0.7831 ± 0.1618 |
| Rebouças Filho et al. (2011) [34] | 0.9853 ± 0.0049 | 0.9557 ± 0.0773 | 0.9090 ± 0.0307 | 0.9951 ± 0.0069 | 0.9227 ± 0.0333 |
| Alexandria et al. (2010) [35] | 0.9823 ± 0.0075 | 0.9215 ± 0.0557 | 0.9183 ± 0.0264 | 0.9899 ± 0.0070 | 0.9093 ± 0.0268 |
| Felix et al. (2009) [30] | 0.9916 ± 0.0029 | 0.9768 ± 0.0267 | 0.9480 ± 0.0244 | 0.9976 ± 0.0026 | 0.9574 ± 0.0091 |
| Li and Acton (2006) [14] | 0.9817 ± 0.0073 | 0.9010 ± 0.0777 | 0.9296 ± 0.0276 | 0.9876 ± 0.0089 | 0.9038 ± 0.0338 |
| Xu and Prince (1998) [13] | 0.9820 ± 0.0079 | 0.9299 ± 0.0608 | 0.9049 ± 0.0365 | 0.9912 ± 0.0066 | 0.9066 ± 0.0380 |
| Methods | Dice | Jaccard | Hausdorff |
|---|---|---|---|
| Healthy Lungs | |||
| CDAC-X 16 | 0.9746 ± 0.0065 | 0.9505 ± 0.0124 | 8.2271 ± 1.8225 |
| He et al. (2023) [32] | 0.9641 ± 0.0158 | 0.9312 ± 0.0288 | 39.2823 ± 2.2563 |
| Filho et al. (2019) [31] | 0.9383 ± 0.0234 | 0.8846 ± 0.0408 | 68.8394 ± 2.5022 |
| Filho et al. (2014) [12] | 0.9734 ± 0.0060 | 0.9482 ± 0.0114 | 8.3183 ± 1.8190 |
| Felix et al. (2013) [33] | 0.8883 ± 0.0488 | 0.8024 ± 0.0774 | 23.0173 ± 2.0028 |
| Rebouças Filho et al. (2011) [34] | 0.9402 ± 0.0193 | 0.8878 ± 0.0344 | 13.2998 ± 1.6877 |
| Alexandria et al. (2010) [35] | 0.9261 ± 0.0224 | 0.8632 ± 0.0383 | 16.3310 ± 1.6237 |
| Felix et al. (2009) [30] | 0.9679 ± 0.0090 | 0.9380 ± 0.0166 | 10.9098 ± 1.9122 |
| Li and Acton (2006) [14] | 0.9396 ± 0.0184 | 0.8866 ± 0.0321 | 14.7047 ± 1.6152 |
| Xu and Prince (1998) [13] | 0.8915 ± 0.0619 | 0.8096 ± 0.0959 | 19.8571 ± 1.4710 |
| COPD Lungs | |||
| CDAC-X | 0.9641 ± 0.0162 | 0.9311 ± 0.0299 | 4.0302 ± 0.3298 |
| He et al. (2023) [32] | 0.9419 ± 0.0192 | 0.8908 ± 0.0341 | 25.2761 ± 1.1491 |
| Filho et al. (2019) [31] | 0.9049 ± 0.0221 | 0.8271 ± 0.0371 | 78.4890 ± 1.2651 |
| Filho et al. (2014) [12] | 0.9666±0.0170 17 | 0.9359 ± 0.0315 | 3.2058 ± 0.1977 |
| Felix et al. (2013) [33] | 0.9336 ± 0.0202 | 0.8761 ± 0.0355 | 10.1916 ± 0.7677 |
| Rebouças Filho et al. (2011) [34] | 0.9427 ± 0.0221 | 0.8923 ± 0.0395 | 9.0103 ± 0.6018 |
| Alexandria et al. (2010) [35] | 0.9395 ± 0.0127 | 0.8861 ± 0.0223 | 9.6780 ± 0.6970 |
| Felix et al. (2009) [30] | 0.9660 ± 0.0111 | 0.9345 ± 0.0206 | 3.7288 ± 0.2011 |
| Li and Acton (2006) [14] | 0.9480 ± 0.0157 | 0.9016 ± 0.0285 | 7.6722 ± 0.5257 |
| Xu and Prince (1998) [13] | 0.9454 ± 0.0186 | 0.8971 ± 0.0334 | 7.8677 ± 0.4147 |
| Lungs with Fibrosis | |||
| CDAC-X | 0.9682 ± 0.0193 | 0.9304 ± 0.0348 | 3.6490 ± 0.2185 |
| He et al. (2023) [32] | 0.9212 ± 0.0232 | 0.8547 ± 0.0396 | 34.5237 ± 1.4902 |
| Filho et al. (2019) [31] | 0.9055 ± 0.0168 | 0.8278 ± 0.0277 | 84.6300 ± 1.7726 |
| Filho et al. (2014) [12] | 0.9605 ± 0.0210 | 0.9248 ± 0.0377 | 4.5954 ± 0.7860 |
| Felix et al. (2013) [33] | 0.7965 ± 0.1545 | 0.6858 ± 0.1872 | 23.9368 ± 2.4316 |
| Rebouças Filho et al. (2011) [34] | 0.9289 ± 0.0339 | 0.8689 ± 0.0547 | 9.9457 ± 1.4493 |
| Alexandria et al. (2010) [35] | 0.9184 ± 0.0232 | 0.8500 ± 0.0394 | 13.1974 ± 1.1605 |
| Felix et al. (2009) [30] | 0.9616 ± 0.0082 | 0.9261 ± 0.0151 | 5.2953 ± 0.6588 |
| Li and Acton (2006) [14] | 0.9122 ± 0.0321 | 0.8402 ± 0.0533 | 13.4484 ± 1.1233 |
| Xu and Prince (1998) [13] | 0.9158 ± 0.0345 | 0.8464 ± 0.0564 | 15.1653 ± 1.4811 |
3.5. Computational Cost and Practical Deployment Considerations
3.6. CDAC Segmentation Interpretability
- Expert-guided initialization: Radiologists can define an initial region of interest (ROI) by marking key areas in the image. This ensures that segmentation aligns with expert knowledge instead of relying exclusively on learned representations;
- Progressive contour evolution: The active contour model gradually adapts its boundaries based on predefined energy functions (CAF and CBF), allowing for visual tracking of the segmentation process, a feature typically absent in deep learning-based approaches;
- Context-aware decision making: Instead of solely depending on global pixel features, CDAC dynamically adjusts segmentation based on local image context, making it easier to interpret why a particular boundary was selected.
3.7. Impact of Hyperparameters on Model Performance
3.8. Clinical Validation and Automated Deployment of CDAC
4. Conclusions
4.1. Limitations of the CDAC
- Sensitivity to anatomical variations: In the analysis of the individual approach, discussed in Section 3.2, CDAC-A exhibited greater sensitivity to the anatomical characteristics of the right lung, leading to less consistent segmentations. This suggests that the method may be influenced by variations in morphology and anatomical structure, such as differences in shape, size, and regional distribution.
- Computational cost: Considering the analysis of the general approach, discussed in Section 3.3, while CDAC-S achieves a convergence time of 3.53 seconds, as shown in Table 7, other methods, such as those by Braga et al. [39] (0.13 seconds) and He et al. [32] (1.15 seconds), demonstrate significantly faster processing times, as detailed in Table 10. This highlights the need for optimization in scenarios requiring real-time segmentation.
- Contour precision: Although CDAC-X demonstrates high segmentation performance based on Dice and Jaccard metrics, it is outperformed by methods such as de S. Rebouças et al. [36] when evaluated using the Hausdorff distance metric, which measures the precision of segmented contours. This suggests that while CDAC-X is effective in identifying and overlapping regions of interest, it may exhibit inconsistencies or lower accuracy in precisely defining the boundaries of these regions.
4.2. Future Work
- Adjustments to the contextual attention force (CAF) and contextual balloon force (CBF) to account for differences in tissue contrast, anatomical variations, and imaging artifacts specific to each modality;
- Training or fine-tuning the model using domain-specific embeddings, optimizing feature extraction relevant to different types of medical imaging.
Author Contributions
Funding
Institutional Review Board Statement
Informed Consent Statement
Data Availability Statement
Conflicts of Interest
References
- Jiang, Z.; Bakker, O.J.; Bartolo, P.J. Industry 4.0-Compliant Occupational Chronic Obstructive Pulmonary Disease Prevention: Literature Review and Future Directions. Sensors 2024, 24, 5734. [Google Scholar] [CrossRef] [PubMed]
- World Health Organization. The Top 10 Causes of Death. 2024. Available online: https://www.who.int/news-room/fact-sheets/detail/the-top-10-causes-of-death (accessed on 22 January 2025).
- World Health Organization. 2023 GOLD Report—Global Initiative for Chronic Obstructive Lung Disease. 2023. Available online: https://www.who.int/activities/strengthening-medical-imaging (accessed on 22 January 2025).
- Alsomali, H.; Palmer, E.; Aujayeb, A.; Funston, W. Early diagnosis and treatment of idiopathic pulmonary fibrosis: A narrative review. Pulm. Ther. 2023, 9, 177–193. [Google Scholar] [CrossRef] [PubMed]
- Ali, S.W.; Rashid, M.M.; Yousuf, M.U.; Shams, S.; Asif, M.; Rehan, M.; Ujjan, I.D. Towards the Development of the Clinical Decision Support System for the Identification of Respiration Diseases via Lung Sound Classification Using 1D-CNN. Sensors 2024, 24, 6887. [Google Scholar] [CrossRef]
- Shah, R.M.; Kolansky, A.M.; Kligerman, S. Thin-Section CT in the categorization and management of Pulmonary Fibrosis including recently defined Progressive Pulmonary Fibrosis. Radiol. Cardiothorac. Imaging 2024, 6, e230135. [Google Scholar] [CrossRef]
- Sheraz, M.; Sun, X.F.; Wang, Y.; Chen, J.; Sun, L. Recent Developments in Aptamer-Based Sensors for Diagnostics. Sensors 2024, 24, 7432. [Google Scholar] [CrossRef]
- World Health Organization. Chronic Obstructive Pulmonary Disease (COPD). 2024. Available online: https://www.who.int/news-room/fact-sheets/detail/chronic-obstructive-pulmonary-disease-(copd) (accessed on 22 January 2025).
- Yang, G.Z.; Firmin, D. The birth of the first CT scanner. IEEE Eng. Med. Biol. Mag. 2000, 19, 120–125. [Google Scholar] [CrossRef]
- Panayides, A.S.; Amini, A.; Filipovic, N.D.; Sharma, A.; Tsaftaris, S.A.; Young, A.; Foran, D.; Do, N.; Golemati, S.; Kurc, T.; et al. AI in Medical Imaging Informatics: Current Challenges and Future Directions. IEEE J. Biomed. Health Inform. 2020, 24, 1837–1857. [Google Scholar] [CrossRef]
- Kass, M.; Witkin, A.; Terzopoulos, D. Snakes: Active contour models. Int. J. Comput. Vis. 1988, 1, 321–331. [Google Scholar] [CrossRef]
- Filho, P.P.R.; Cortez, P.C.; da Silva Barros, A.C.; de Albuquerque, V.H.C. Novel Adaptive Balloon Active Contour Method based on internal force for image segmentation—A systematic evaluation on synthetic and real images. Expert Syst. Appl. 2014, 41, 7707–7721. [Google Scholar] [CrossRef]
- Xu, C.; Prince, J.L. Snakes, shapes, and gradient vector flow. IEEE Trans. Image Process. 1998, 7, 359–369. [Google Scholar]
- Li, B.; Acton, S.T. Vector Field Convolution for Image Segmentation using Snakes. In Proceedings of the IEEE International Conference on Image Processing, ICIP 2006, Atlanta, GA, USA, 8–11 October 2006; pp. 1637–1640. [Google Scholar]
- Gonzalez, C.I.; Melin, P.; Castillo, O. Edge Detection Method Based on General Type-2 Fuzzy Logic Applied to Color Images. Information 2017, 8, 104. [Google Scholar] [CrossRef]
- Medeiros, A.G.; Guimarães, M.T.; Peixoto, S.A.; de O. Santos, L.; da Silva Barros, A.C.; de S. Rebouças, E.; de Albuquerque, V.H.C.; Rebouças Filho, P.P. A new fast morphological geodesic active contour method for lung CT image segmentation. Measurement 2019, 148, 106687. [Google Scholar] [CrossRef]
- Lee, B.R.; Hamza, A.B.; Krim, H. An active contour model for image segmentation: A variational perspective. In Proceedings of the 2002 IEEE International Conference on Acoustics, Speech, and Signal Processing, Orlando, FL, USA, 13–17 May 2002; Volume 2, pp. II-1585–II-1588. [Google Scholar]
- Otsu, N. A Threshold Selection Method from Gray-Level Histograms. IEEE Trans. Syst. Man Cybern. 1979, 9, 62–66. [Google Scholar] [CrossRef]
- Adams, R.; Bischof, L. Seeded region growing. IEEE Trans. Pattern Anal. Mach. Intell. 1994, 16, 641–647. [Google Scholar] [CrossRef]
- de S.Rebouças, E.; Braga, A.M.; Sarmento, R.M.; Marques, R.C.P.; Filho, P.P.R. Level Set Based on Brain Radiological Densities for Stroke Segmentation in CT Images. In Proceedings of the 30th IEEE International Symposium on Computer-Based Medical Systems, CBMS 2017, Thessaloniki, Greece, 22–24 June 2017; Bamidis, P.D., Konstantinidis, S.T., Rodrigues, P.P., Eds.; IEEE Computer Society: Washington, DC, USA, 2017; pp. 391–396. [Google Scholar]
- Ronneberger, O.; Fischer, P.; Brox, T. U-Net: Convolutional Networks for Biomedical Image Segmentation. In Medical Image Computing and Computer-Assisted Intervention–MICCAI 2015: 18th International Conference, Munich, Germany, 5–9 October 2015, Proceedings, Part III 18; Springer: Cham, Switzerlands, 2015; Volume 9351, pp. 234–241. [Google Scholar]
- de F.Souza, L.F.; Silva, I.C.L.; Marques, A.G.; dos S. Silva, F.H.; Nunes, V.X.; Hassan, M.M.; de Albuquerque, V.H.C.; Filho, P.P.R. Internet of Medical Things: An Effective and Fully Automatic IoT Approach Using Deep Learning and Fine-Tuning to Lung CT Segmentation. Sensors 2020, 20, 6711. [Google Scholar] [CrossRef]
- Raman, R.; Kumar, V.; Pillai, B.G.; Rabadiya, D.; Divekar, R.; Vachharajani, H. Leveraging DeepLabV3+ for Lung Region Delineation in Chest Radiographs using Convolutional Neural Network Approach. In Proceedings of the 2024 Second International Conference on Data Science and Information System (ICDSIS), Hassan, India, 17–18 May 2024; pp. 1–5. [Google Scholar]
- Esteva, A.; Chou, K.; Yeung, S.; Naik, N.; Madani, A.; Mottaghi, A.; Liu, Y.; Topol, E.; Dean, J.; Socher, R. Deep learning-enabled medical computer vision. npj Digit. Med. 2021, 4, 5. [Google Scholar] [CrossRef]
- Zunair, H.; Hamza, A.B. Sharp U-Net: Depthwise convolutional network for biomedical image segmentation. Comput. Biol. Med. 2021, 136, 104699. [Google Scholar] [CrossRef]
- Vaswani, A.; Shazeer, N.; Parmar, N.; Uszkoreit, J.; Jones, L.; Gomez, A.N.; Kaiser, L.; Polosukhin, I. Attention is all you need. In Proceedings of the Advances in Neural Information Processing Systems, Long Beach, CA, USA, 4–9 December 2017; pp. 5998–6008. [Google Scholar]
- Metz, C.E. Basic principles of ROC analysis. Semin. Nucl. Med. 1978, 8, 283–298. [Google Scholar] [CrossRef]
- Yu, Y.; Wang, C.; Fu, Q.; Kou, R.; Huang, F.; Yang, B.; Yang, T.; Gao, M. Techniques and Challenges of Image Segmentation: A Review. Electronics 2023, 12, 1199. [Google Scholar] [CrossRef]
- Müller, D.; Soto-Rey, I.; Kramer, F. Towards a guideline for evaluation metrics in medical image segmentation. BMC Res. Notes 2022, 15, 210. [Google Scholar] [CrossRef]
- Felix, J.; Cortez, P.; Costa, R.; Fortaleza, S.; Pereira, E.; Holanda, M. Computer-assisted evaluation of pulmonary emphysema in CT scans: Comparison between a locally developed system and a freeware system. J. Bras. Pneumol. Publicacao Soc. Bras. Pneumol. Tisilogia 2009, 35, 868–876. [Google Scholar]
- Filho, P.P.R.; da Silva Barros, A.C.; Almeida, J.S.; Rodrigues, J.J.P.C.; de Albuquerque, V.H.C. A new effective and powerful medical image segmentation algorithm based on optimum path snakes. Appl. Soft Comput. 2019, 76, 649–670. [Google Scholar] [CrossRef]
- He, S.; Bao, R.; Li, J.; Stout, J.; Bjornerud, A.; Grant, P.E.; Ou, Y. Computer-Vision Benchmark Segment-Anything Model (SAM) in Medical Images: Accuracy in 12 Datasets. arXiv 2023, arXiv:2304.09324. [Google Scholar]
- Felix, J.H.d.S.; Cortez, P.C.; Alexandria, A.R.; Filho, P.R.; Cavalcante, T.; Holanda, M.A. Novo método de contornos ativo baseado na transforma de hilbert radial. In Proceedings of the V Latin American Congress on Biomedical Engineering CLAIB 2011, Habana, Cuba, 16–21 May 2011; Sustainable Technologies for the Health of All. Springer: Berlin/Heidelberg, Germany, 2013; pp. 1051–1053. [Google Scholar]
- Rebouças Filho, P.P.; Cortez, P.C.; Holanda, M.A. Active contour modes crisp: New technique for segmentation the lungs in CT images. Rev. Bras. Eng. Biomed. 2011, 27, 259–272. [Google Scholar] [CrossRef]
- Alexandria, A.; Cortez, P.; Hebert, J.; Félix, S.; Cavalcante, T.; Cavalcante, S.; Pedrosa, P.; Filho, P.P.; De, J.; Carvalho, A.; et al. Hilbertian Energy: A method for external energy calculation on radial active contours. In Proceedings of the IWSSIP 2010—17th International Conference on Systems, Signals and Image Processing, Rio de Janeiro, Brazil, 17–19 June 2010. [Google Scholar]
- de S.Rebouças, E.; de Medeiros, F.N.S.; Marques, R.C.P.; das Chagas, J.V.S.; Guimarães, M.T.; de O. Santos, L.; Medeiros, A.G.; Peixoto, S.A. Level set approach based on Parzen Window and floor of log for edge computing object segmentation in digital images. Appl. Soft Comput. 2021, 105, 107273. [Google Scholar]
- Medeiros, A.G.; de O.Santos, L.; Sarmento, R.M.; de S. Rebouças, E.; Filho, P.P.R. New Adaptive Morphological Geodesic Active Contour Method for Segmentation of Hemaorrhagic Stroke in Computed Tomography Image. In Proceedings of the Intelligent Systems—9th Brazilian Conference, BRACIS 2020, Rio Grande, Brazil, 20–23 October 2020; Lecture Notes in Computer Science, Proceedings, Part II. Cerri, R., Prati, R.C., Eds.; Springer: Berlin/Heidelberg, Germany, 2020; Volume 12320, pp. 604–618. [Google Scholar]
- Braga, A.M.; Marques, R.C.P.; Rodrigues, F.A.A.; de Medeiros, F.N.S. A Median Regularized Level Set for Hierarchical Segmentation of SAR Images. IEEE Geosci. Remote Sens. Lett. 2017, 14, 1171–1175. [Google Scholar] [CrossRef]
- Braga, A.M.; Marques, R.C.; Medeiros, F.N.; Neto, J.F.R.; Bianchi, A.G.; Carneiro, C.M.; Ushizima, D.M. Hierarchical median narrow band for level set segmentation of cervical cell nuclei. Measurement 2021, 176, 109232. [Google Scholar] [CrossRef]
- Setio, A.A.A.; Traverso, A.; de Bel, T.; Berens, M.S.; van den Bogaard, C.; Cerello, P.; Chen, H.; Dou, Q.; Fantacci, M.E.; Geurts, B.; et al. Validation, comparison, and combination of algorithms for automatic detection of pulmonary nodules in computed tomography images: The LUNA16 challenge. Med. Image Anal. 2017, 42, 1–13. [Google Scholar] [CrossRef]


| Variant | Number of Layers | Heads of Attention | Embedding Size | Parameters (Approx.) |
|---|---|---|---|---|
| CDAC-S | 12 | 12 | 768 | 85 millions |
| CDAC-A | 24 | 16 | 1024 | 307 millions |
| CDAC-X | 32 | 16 | 1280 | 632 millions |
| Metric | CDAC-X 1 | CDAC-S | CDAC-A | |||
|---|---|---|---|---|---|---|
| Left Lung | Right Lung | Left Lung | Right Lung | Left lung | Right Lung | |
| Accuracy | 0.9951 ± 0.0027 | 0.9940 ± 0.0034 | 0.9934 ± 0.0051 | 0.9915 ± 0.0047 | 0.9941 ± 0.0030 | 0.9855 ± 0.0160 |
| Precision | 0.9796 ± 0.0282 | 0.9698 ± 0.0277 | 0.9446 ± 0.0617 | 0.9210 ± 0.0646 | 0.9728 ± 0.0289 | 0.8757 ± 0.1620 |
| Sensitivity | 0.9724 ± 0.0235 | 0.9685 ± 0.0236 | 0.9655 ± 0.0225 | 0.9574 ± 0.0312 | 0.9440 ± 0.0358 | 0.9610 ± 0.0205 |
| Specificity | 0.9980 ± 0.0029 | 0.9970 ± 0.0033 | 0.9947 ± 0.0058 | 0.9934 ± 0.0049 | 0.9973 ± 0.0032 | 0.9872 ± 0.0180 |
| MCC | 0.9662 ± 0.0157 | 0.9600 ± 0.0178 | 0.9541 ± 0.0340 | 0.9393 ± 0.0369 | 0.9580 ± 0.0175 | 0.9055 ± 0.0948 |
| Dice | 0.9686 ± 0.0151 | 0.9629 ± 0.0169 | 0.9568 ± 0.0346 | 0.9428 ± 0.0367 | 0.9606 ± 0.0173 | 0.9066 ± 0.1000 |
| Jaccard | 0.9396 ± 0.0279 | 0.9290 ± 0.0308 | 0.9191 ± 0.0576 | 0.8939 ± 0.0621 | 0.9248 ± 0.0317 | 0.8427 ± 0.1481 |
| Hausdorff | 4.3793 ± 1.1334 | 6.6373 ± 2.6732 | 4.8570 ± 1.1162 | 7.4921 ± 2.6594 | 5.6548 ± 1.1430 | 9.0498 ± 2.6279 |
| CDAC Version | Left Lung—Time (s) | Right Lung—Team (s) |
|---|---|---|
| CDAC-X | 4.42 ± 4.91 | 6.29 ± 5.55 |
| CDAC-S 2 | 2.32 ± 1.21 | 1.86 ± 0.75 |
| CDAC-A | 2.37 ± 1.25 | 5.38 ± 6.45 |
| Metric | CDAC-X 7 | CDAC-S | CDAC-A |
|---|---|---|---|
| Accuracy | 0.9891 ± 0.0058 | 0.9849 ± 0.0090 | 0.9797 ± 0.0172 |
| Precision | 0.9694 ± 0.0310 | 0.9332 ± 0.0567 | 0.9322 ± 0.0800 |
| Sensitivity | 0.9711 ± 0.0216 | 0.9622 ± 0.0236 | 0.9524 ± 0.0251 |
| Specificity | 0.9934 ± 0.0075 | 0.9867 ± 0.0111 | 0.9828 ± 0.0236 |
| MCC | 0.9587 ± 0.0181 | 0.9423 ± 0.0337 | 0.9288 ± 0.0466 |
| Dice | 0.9652 ± 0.0163 | 0.9506 ± 0.0317 | 0.9397 ± 0.0399 |
| Jaccard | 0.9332 ± 0.0297 | 0.9075 ± 0.0539 | 0.8888 ± 0.0676 |
| Hausdorff | 5.2922 ± 1.1140 | 5.7942 ± 1.0968 | 8.2371 ± 1.1682 |
| CDAC Version | Time (s) |
|---|---|
| CDAC-X | 7.42 ± 5.24 |
| CDAC-S 8 | 3.53 ± 1.00 |
| CDAC-A | 5.62 ± 4.64 |
| Metric | CDAC-X 14 | CDAC-S | CDAC-A |
|---|---|---|---|
| Healthy Lungs | |||
| Accuracy | 0.9877 ± 0.0055 | 0.9846 ± 0.0079 | 0.9731 ± 0.0206 |
| Precision | 0.9774 ± 0.0211 | 0.9607 ± 0.0239 | 0.9306 ± 0.0640 |
| Sensitivity | 0.9762 ± 0.0164 | 0.9701 ± 0.0106 | 0.9631 ± 0.0257 |
| Specificity | 0.9911 ± 0.0100 | 0.9856 ± 0.0121 | 0.9724 ± 0.0306 |
| MCC | 0.9651 ± 0.0083 | 0.9577 ± 0.0132 | 0.9280 ± 0.0411 |
| Dice | 0.9734 ± 0.0065 | 0.9681 ± 0.0092 | 0.9448 ± 0.0295 |
| Jaccard | 0.9482 ± 0.0124 | 0.9383 ± 0.0170 | 0.8968 ± 0.0516 |
| Hausdorff | 8.2271 ± 1.8225 | 8.2273 ± 1.8031 | 12.7296 ± 1.7132 |
| COPD Lungs | |||
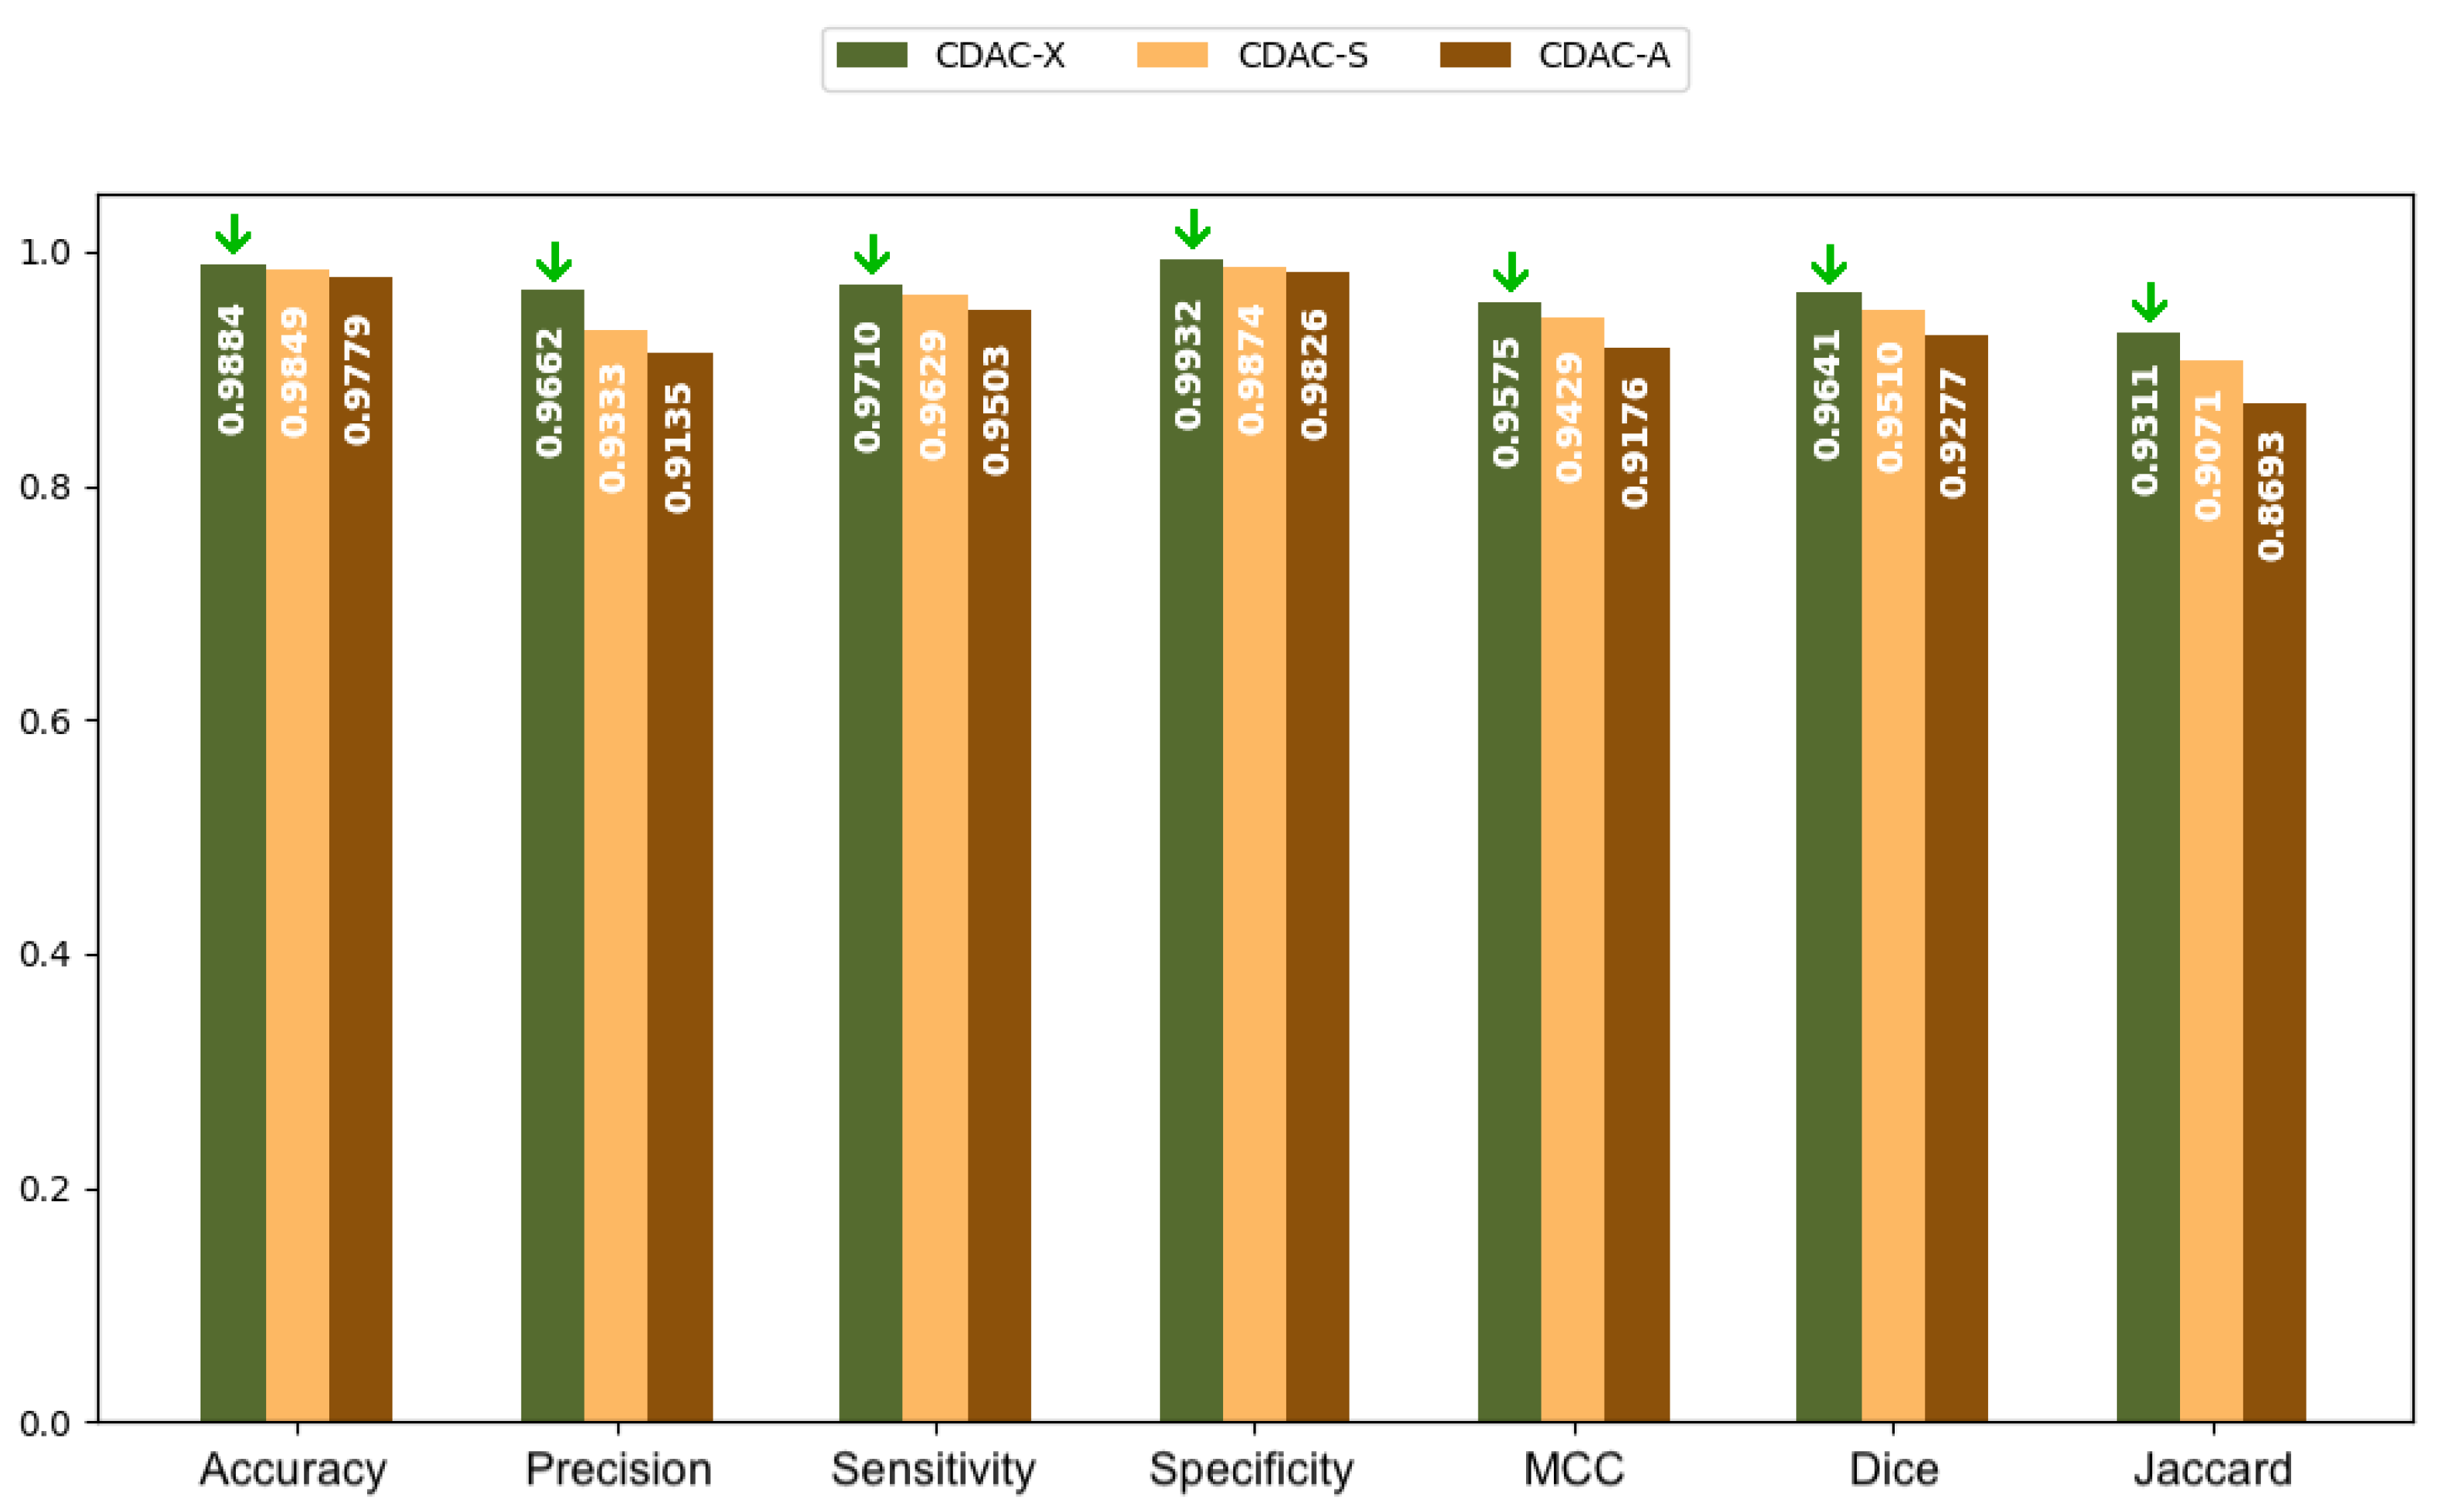
| Accuracy | 0.9884 ± 0.0065 | 0.9849 ± 0.0067 | 0.9779 ± 0.0164 |
| Precision | 0.9662 ± 0.0278 | 0.9333 ± 0.0345 | 0.9135 ± 0.1017 |
| Sensitivity | 0.9710 ± 0.0324 | 0.9629 ± 0.0262 | 0.9503 ± 0.0242 |
| Specificity | 0.9932 ± 0.0062 | 0.9874 ± 0.0080 | 0.9826 ± 0.0205 |
| MCC | 0.9575 ± 0.0202 | 0.9429 ± 0.0218 | 0.9176 ± 0.0573 |
| Dice | 0.9641 ± 0.0162 | 0.9510 ± 0.0184 | 0.9277 ± 0.0514 |
| Jaccard | 0.9311 ± 0.0299 | 0.9071 ± 0.0331 | 0.8693 ± 0.0867 |
| Hausdorff | 4.0302 ± 0.3298 | 4.0421 ± 0.1772 | 7.6557 ± 0.4858 |
| Lungs with Fibrosis | |||
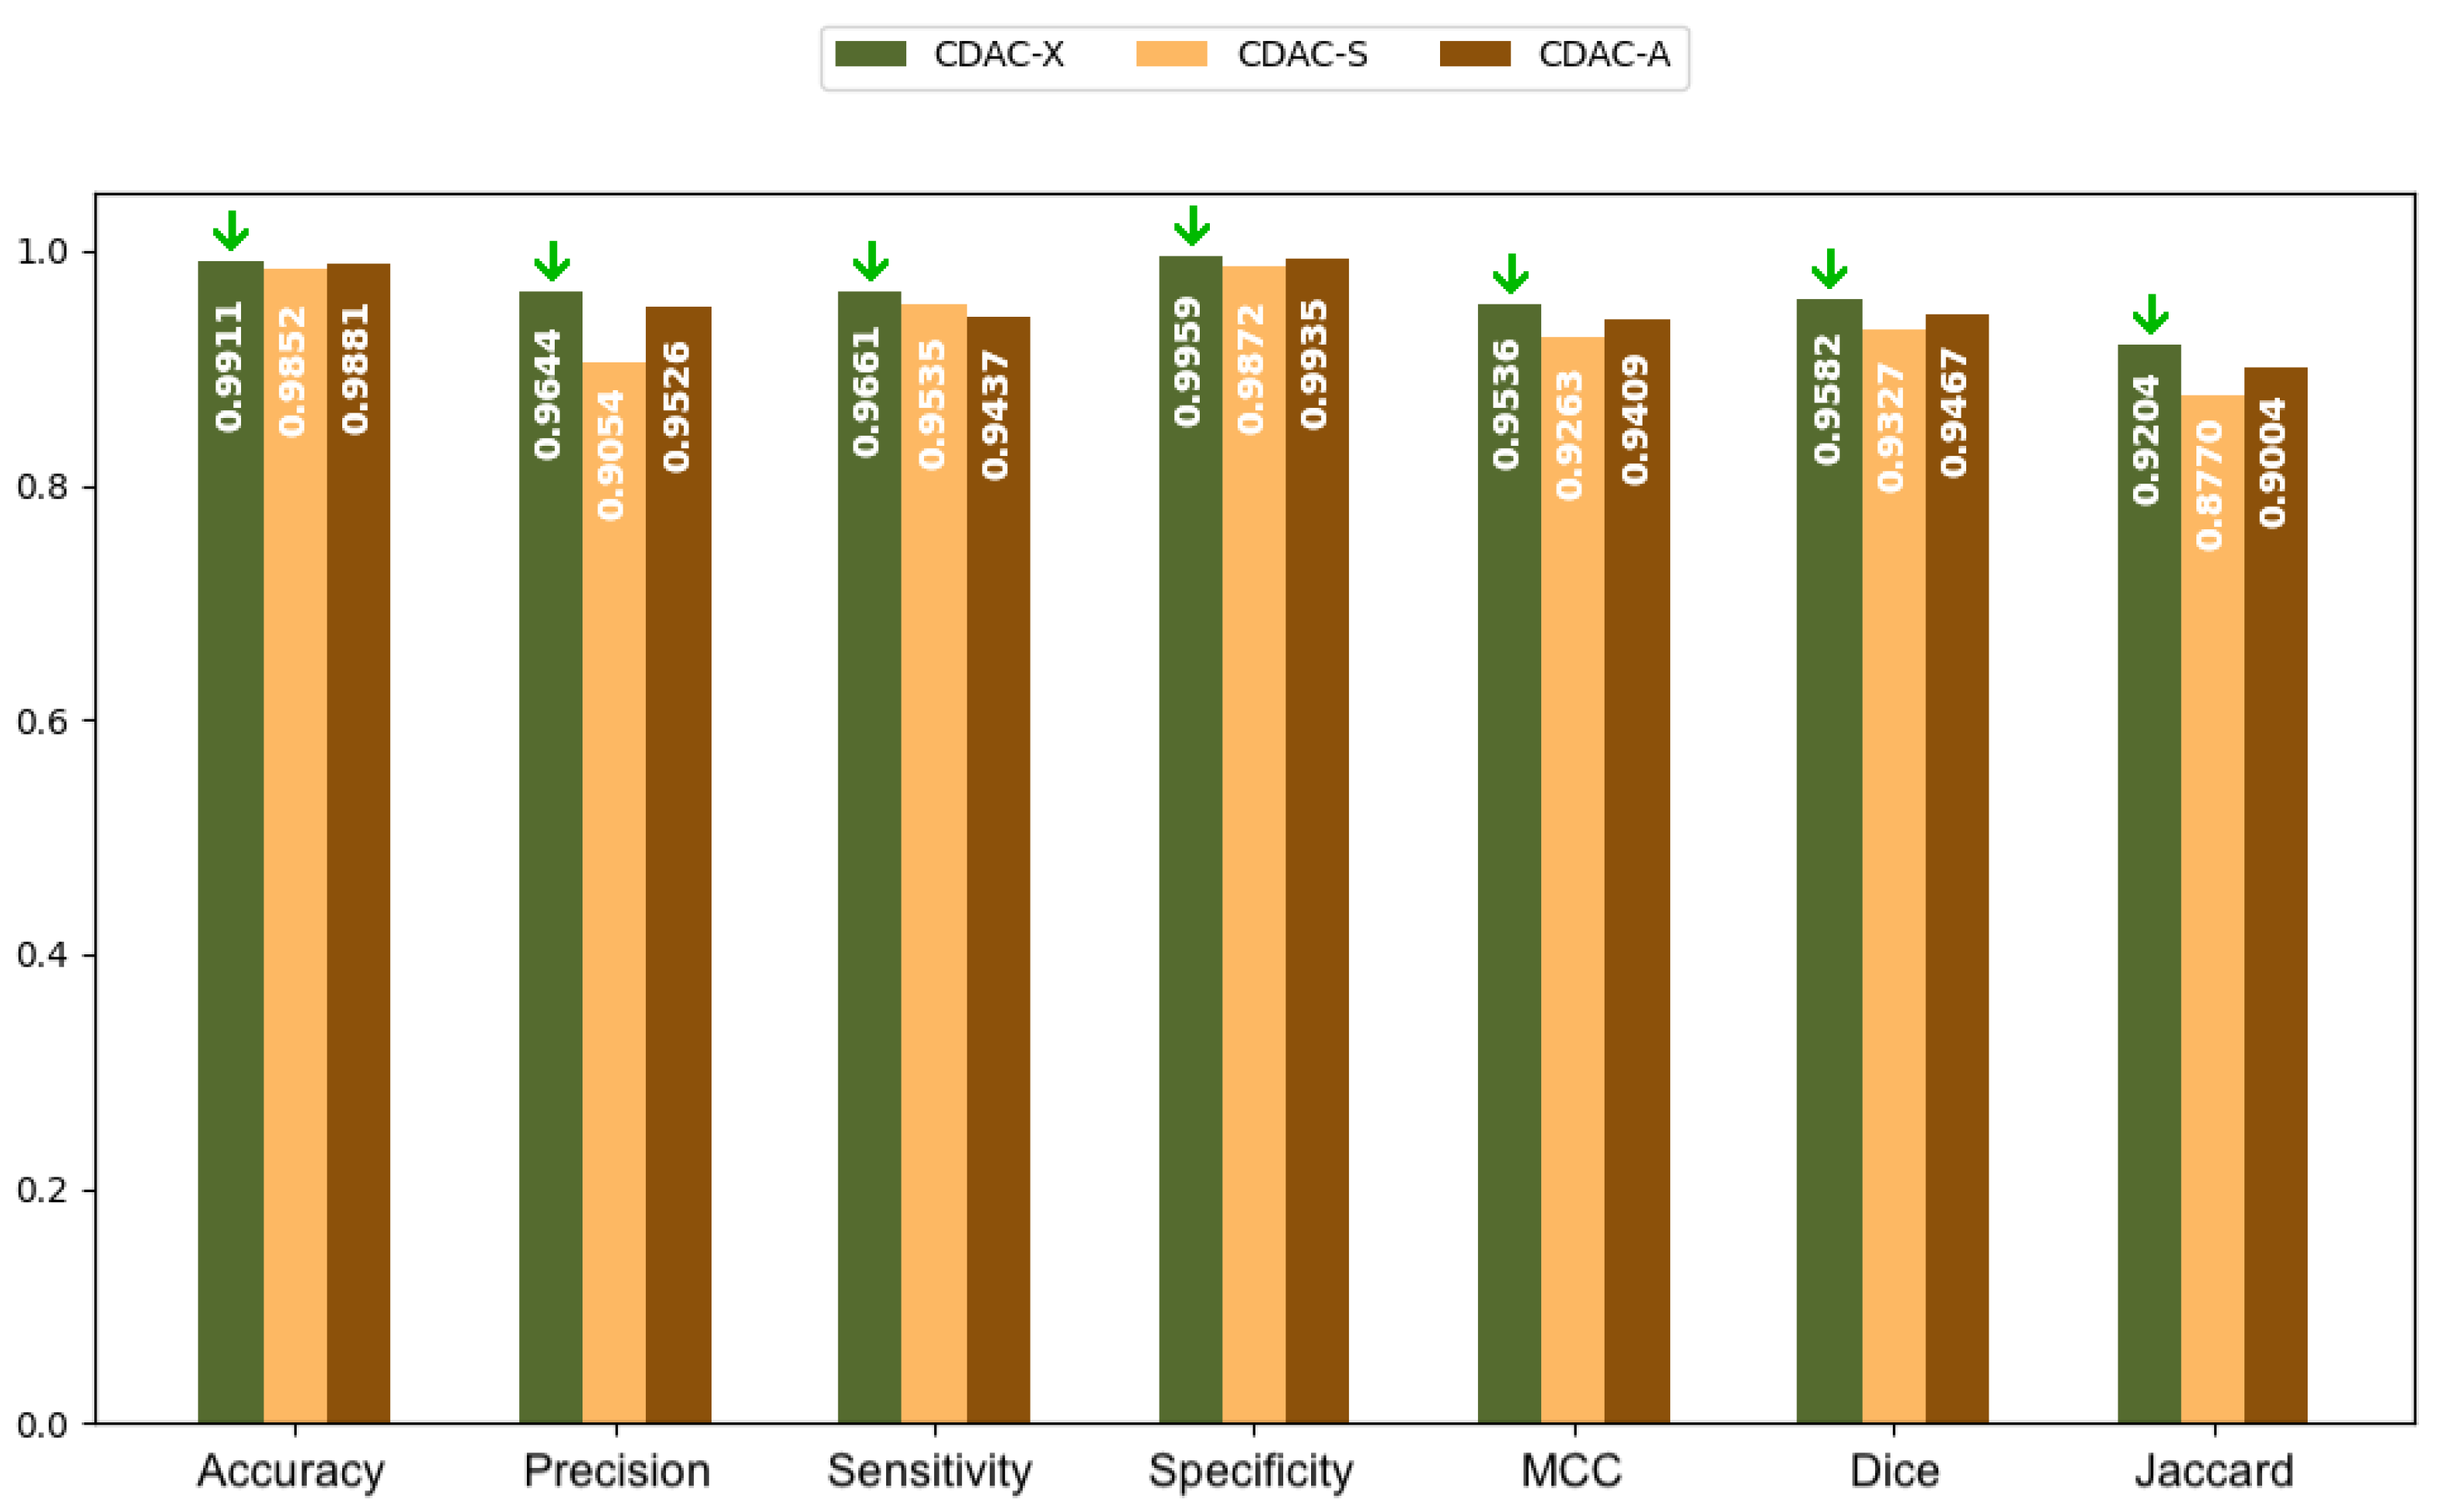
| Accuracy | 0.9911 ± 0.0046 | 0.9852 ± 0.0116 | 0.9881 ± 0.0090 |
| Precision | 0.9644 ± 0.0395 | 0.9054 ± 0.0798 | 0.9526 ± 0.0631 |
| Sensitivity | 0.9661 ± 0.0133 | 0.9535 ± 0.0242 | 0.9437 ± 0.0210 |
| Specificity | 0.9959 ± 0.0046 | 0.9872 ± 0.0125 | 0.9935 ± 0.0098 |
| MCC | 0.9536 ± 0.0210 | 0.9263 ± 0.0477 | 0.9409 ± 0.0358 |
| Dice | 0.9582 ± 0.0193 | 0.9327 ± 0.0443 | 0.9467 ± 0.0323 |
| Jaccard | 0.9204 ± 0.0348 | 0.8770 ± 0.0738 | 0.9004 ± 0.0543 |
| Hausdorff | 3.6490 ± 0.2185 | 5.1302 ± 0.4021 | 4.2861 ± 0.3774 |
| CDAC Version | Healthy Lung—Time (s) | COPD Lung—Time (s) | Lung with Fibrosis—Time (s) |
|---|---|---|---|
| CDAC-X | 7.99 ± 8.57 | 4.98 ± 5.34 | 7.27 ± 6.27 |
| CDAC-S 15 | 3.88 ± 2.96 | 2.03 ± 0.94 | 1.58 ± 0.808 |
| CDAC-A | 7.68 ± 8.92 | 2.36 ± 1.41 | 5.76 ± 8.43 |
Disclaimer/Publisher’s Note: The statements, opinions and data contained in all publications are solely those of the individual author(s) and contributor(s) and not of MDPI and/or the editor(s). MDPI and/or the editor(s) disclaim responsibility for any injury to people or property resulting from any ideas, methods, instructions or products referred to in the content. |
© 2025 by the authors. Licensee MDPI, Basel, Switzerland. This article is an open access article distributed under the terms and conditions of the Creative Commons Attribution (CC BY) license (https://creativecommons.org/licenses/by/4.0/).
Share and Cite
Silva, S.P.P.d.; Ivo, R.F.; Barroso, C.B.; Fernandes, J.C.N.; Portela, T.F.; Medeiros, A.G.; Sousa, P.H.F.d.; Song, H.; Rebouças Filho, P.P. Context-Driven Active Contour (CDAC): A Novel Medical Image Segmentation Method Based on Active Contour and Contextual Understanding. Sensors 2025, 25, 2864. https://doi.org/10.3390/s25092864
Silva SPPd, Ivo RF, Barroso CB, Fernandes JCN, Portela TF, Medeiros AG, Sousa PHFd, Song H, Rebouças Filho PP. Context-Driven Active Contour (CDAC): A Novel Medical Image Segmentation Method Based on Active Contour and Contextual Understanding. Sensors. 2025; 25(9):2864. https://doi.org/10.3390/s25092864
Chicago/Turabian StyleSilva, Suane Pires Pinheiro da, Roberto Fernandes Ivo, Calleo Belo Barroso, João Carlos Nepomuceno Fernandes, Thiago Ferreira Portela, Aldísio Gonçalves Medeiros, Pedro Henrique F. de Sousa, Houbing Song, and Pedro Pedrosa Rebouças Filho. 2025. "Context-Driven Active Contour (CDAC): A Novel Medical Image Segmentation Method Based on Active Contour and Contextual Understanding" Sensors 25, no. 9: 2864. https://doi.org/10.3390/s25092864
APA StyleSilva, S. P. P. d., Ivo, R. F., Barroso, C. B., Fernandes, J. C. N., Portela, T. F., Medeiros, A. G., Sousa, P. H. F. d., Song, H., & Rebouças Filho, P. P. (2025). Context-Driven Active Contour (CDAC): A Novel Medical Image Segmentation Method Based on Active Contour and Contextual Understanding. Sensors, 25(9), 2864. https://doi.org/10.3390/s25092864