
Enhancing Airport Traffic Flow: Intelligent System Based on VLC, Rerouting Techniques, and Adaptive Reward Learning †

 ,
,  ,
,  ,
, 
Abstract
Highlights
- The AI and VLC-based airport traffic management system enhances traffic flow efficiency, reduces congestion, and enhances safety through real-time asset tracking, adaptive reward mechanisms, and intelligent rerouting strategies.
- VLC-enabled infrastructure: Utilizes tetrachromatic LED luminaires and SiC optical receivers in a hybrid mesh network to provide precise, location-specific guidance and replace traditional gateway systems.
- AI-driven optimization: Employs Deep Reinforcement Learning (DRL) with Q-learning to support adaptive reward allocation, dynamic phase control, and intelligent rerouting across multiple intersections.
- GPS-free indoor localization: Enables seamless navigation for AGVs and pedestrians through VLC-based geolocation, contributing to smoother operations, improved mobility, and an enhanced passenger experience.
Abstract
1. Introduction
2. System Design and Methodological Approach
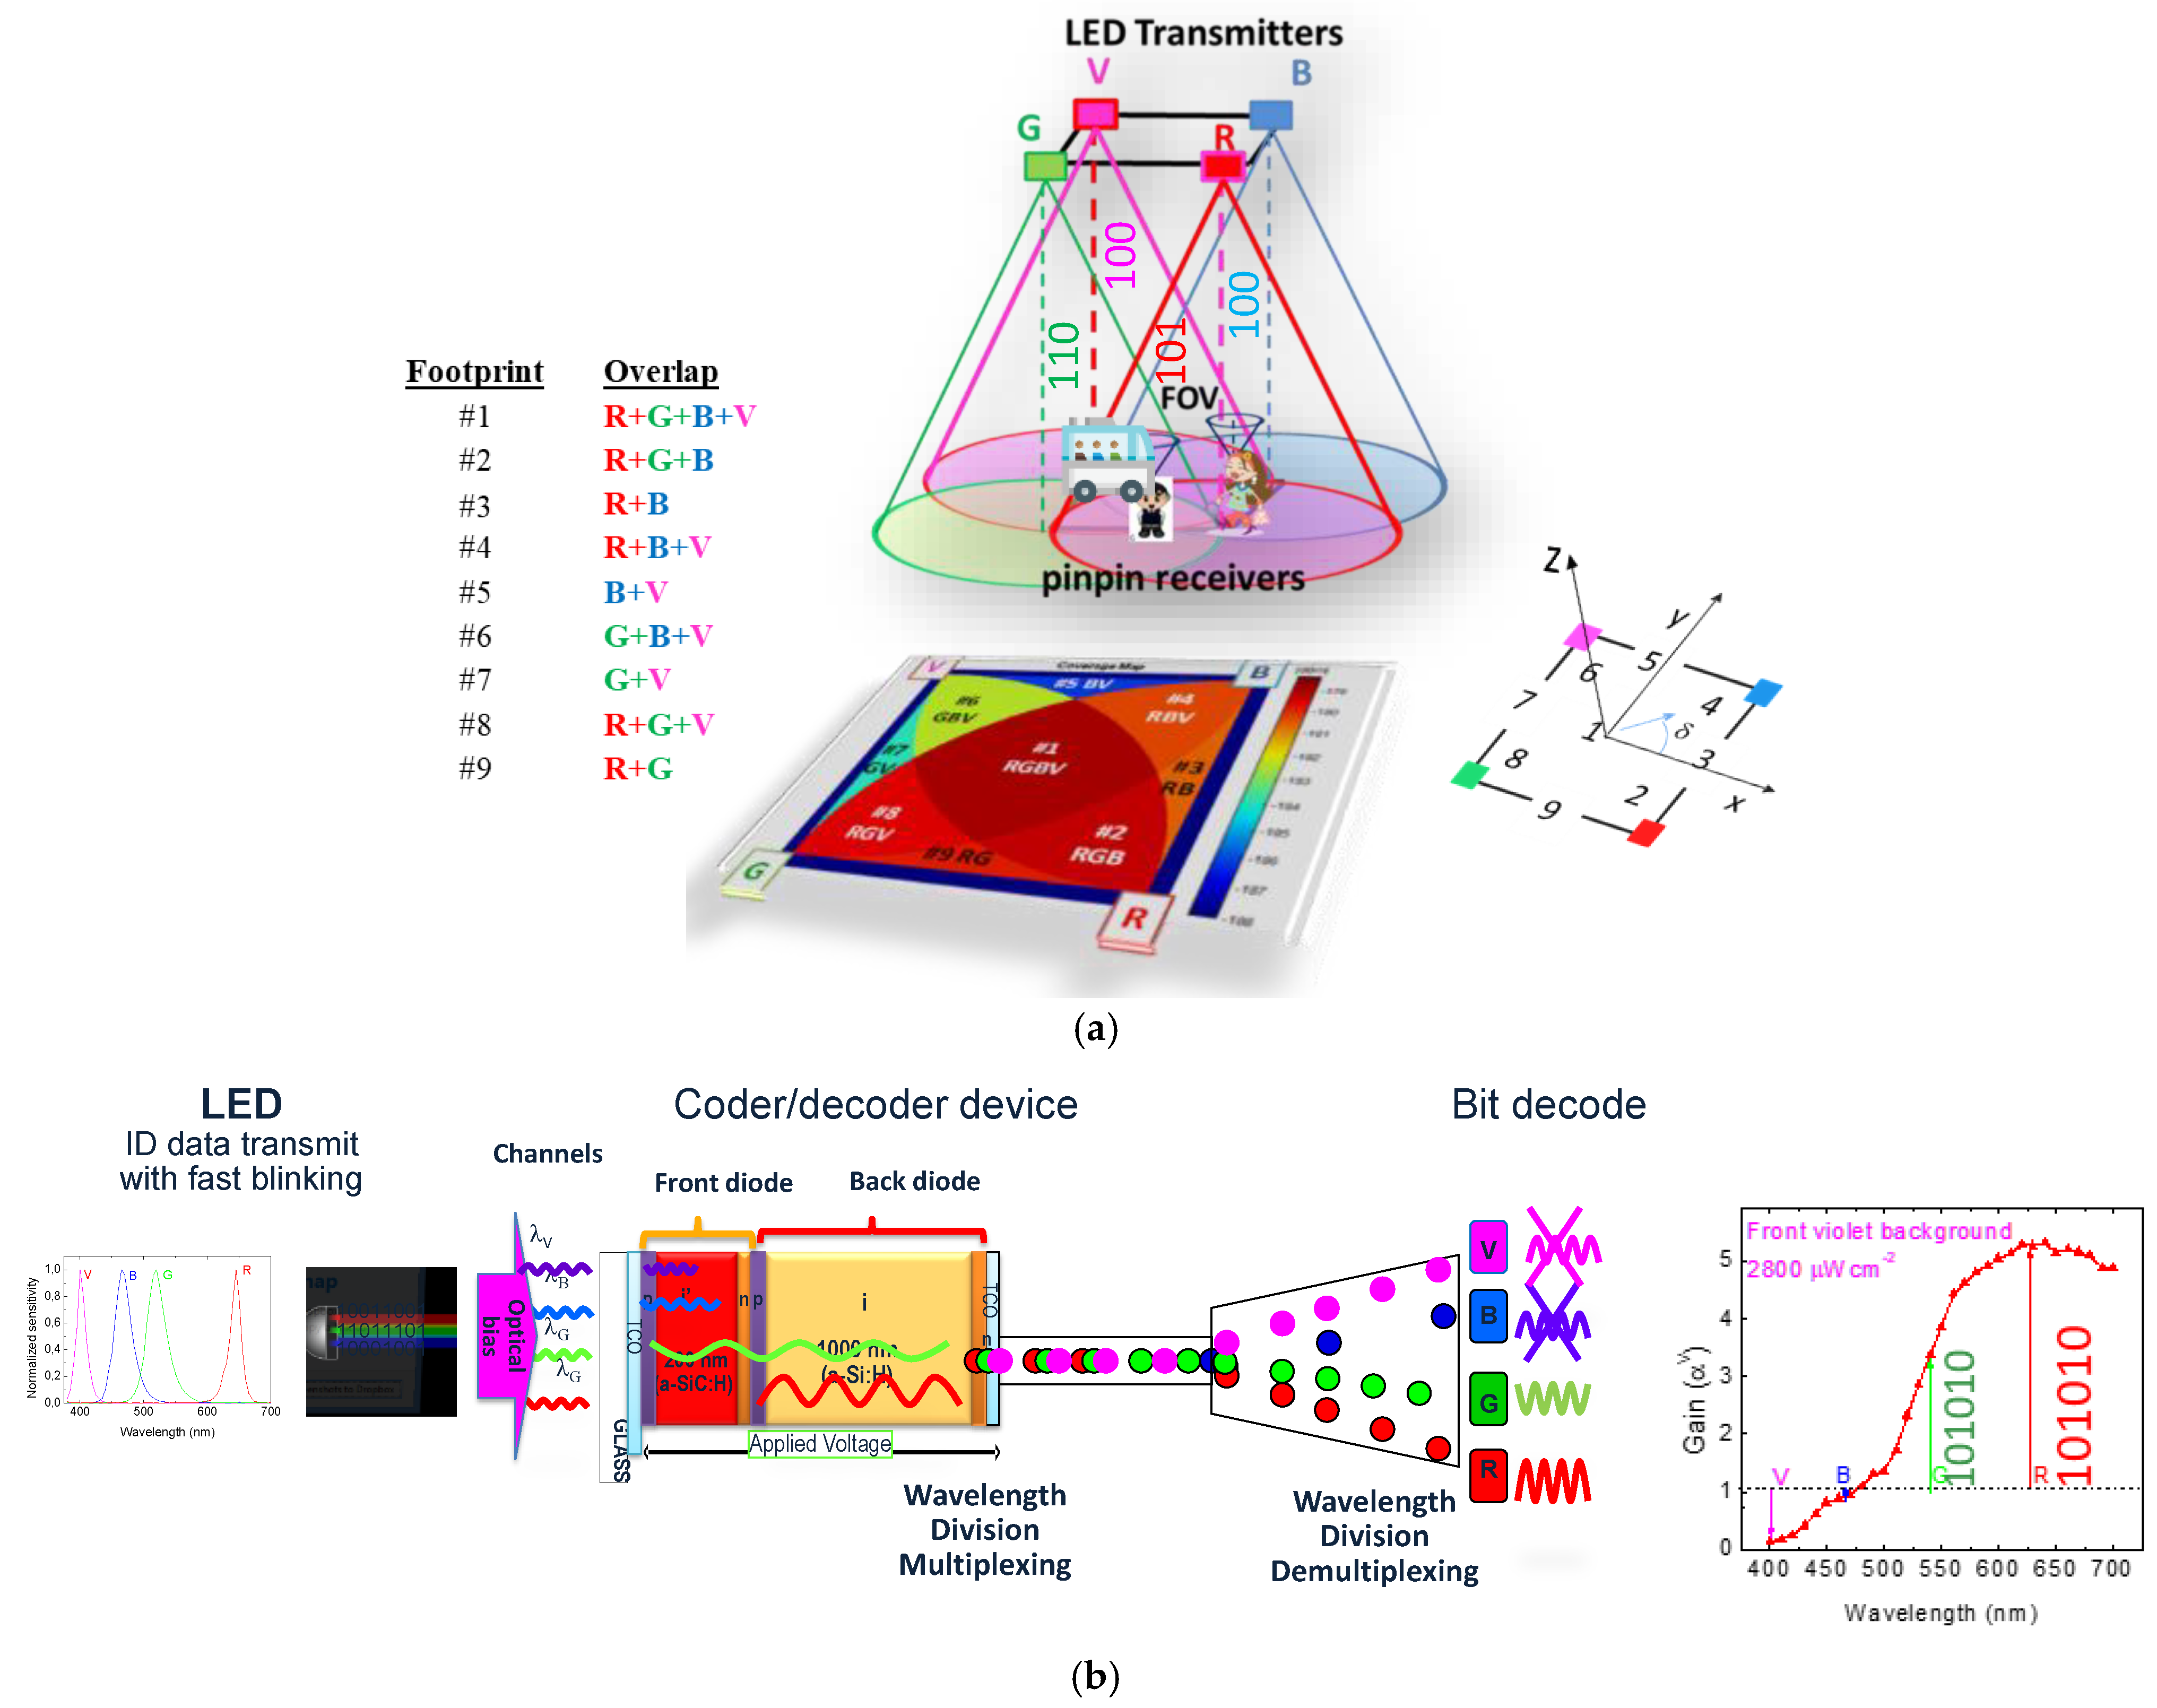
2.1. Fundamentals of Visible Light Communication (VLC)
2.2. VLC-Based Indoor Positioning
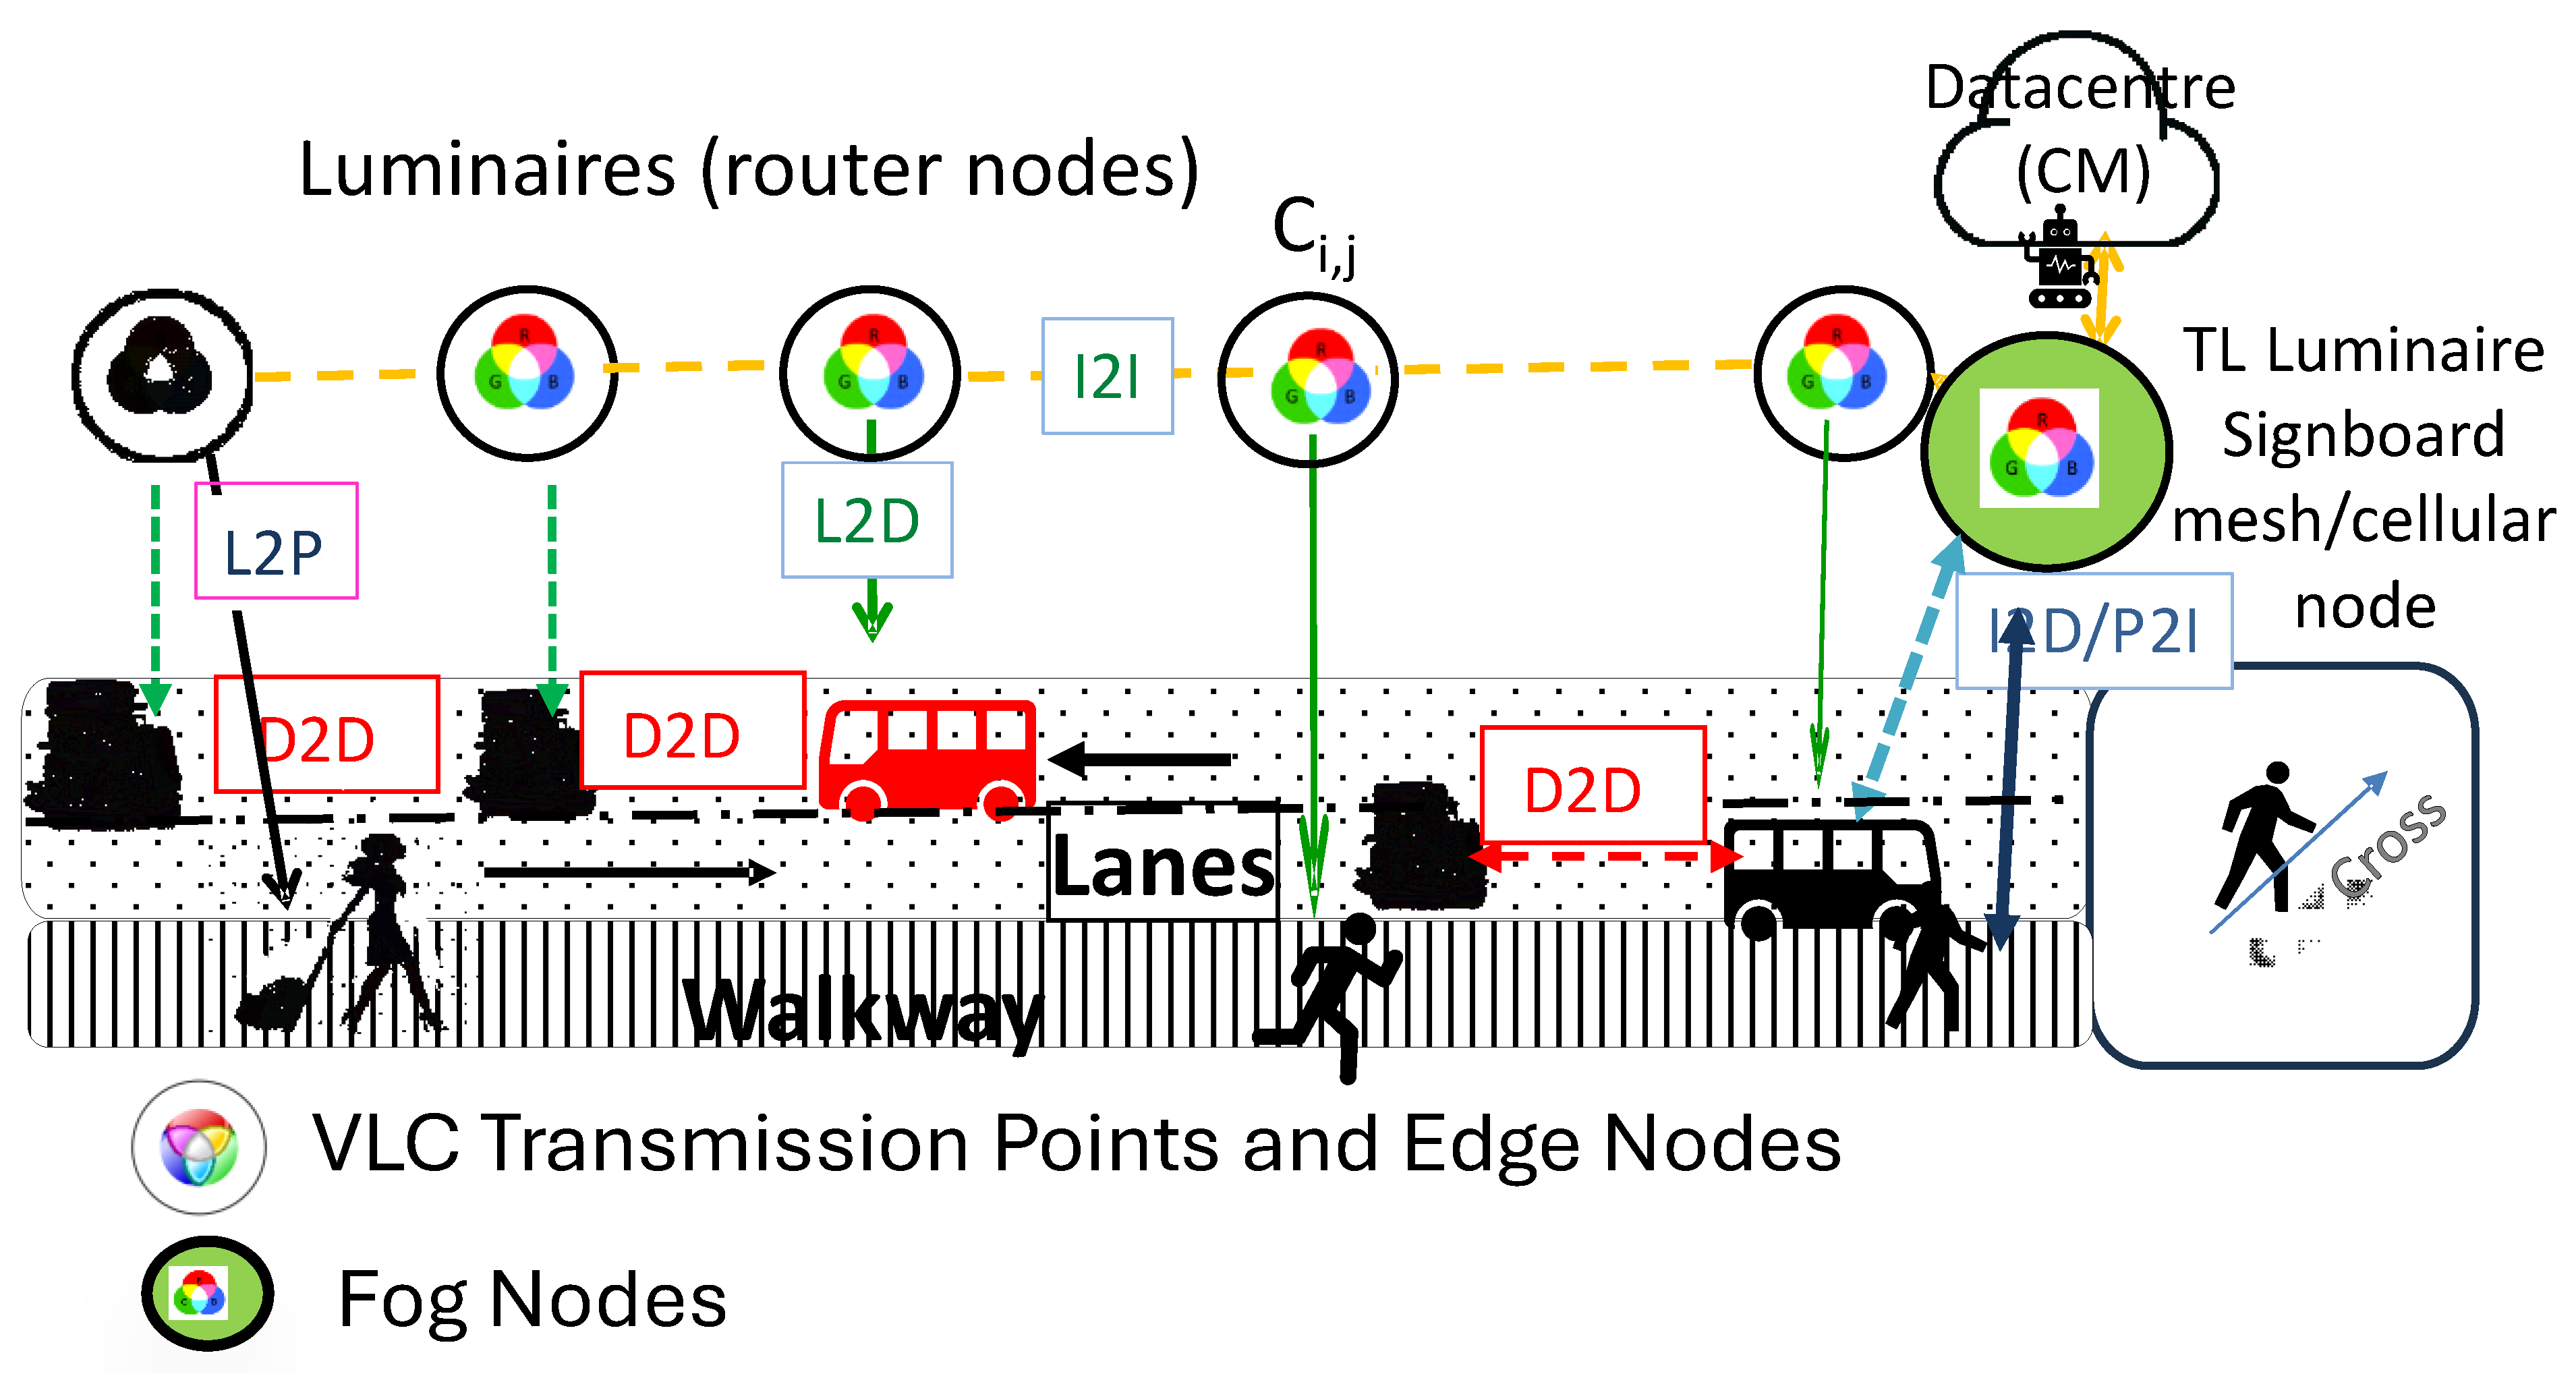
2.3. System Architecture and Components
3. VLC-Airport Model
3.1. Airport Infrastructure Modeling
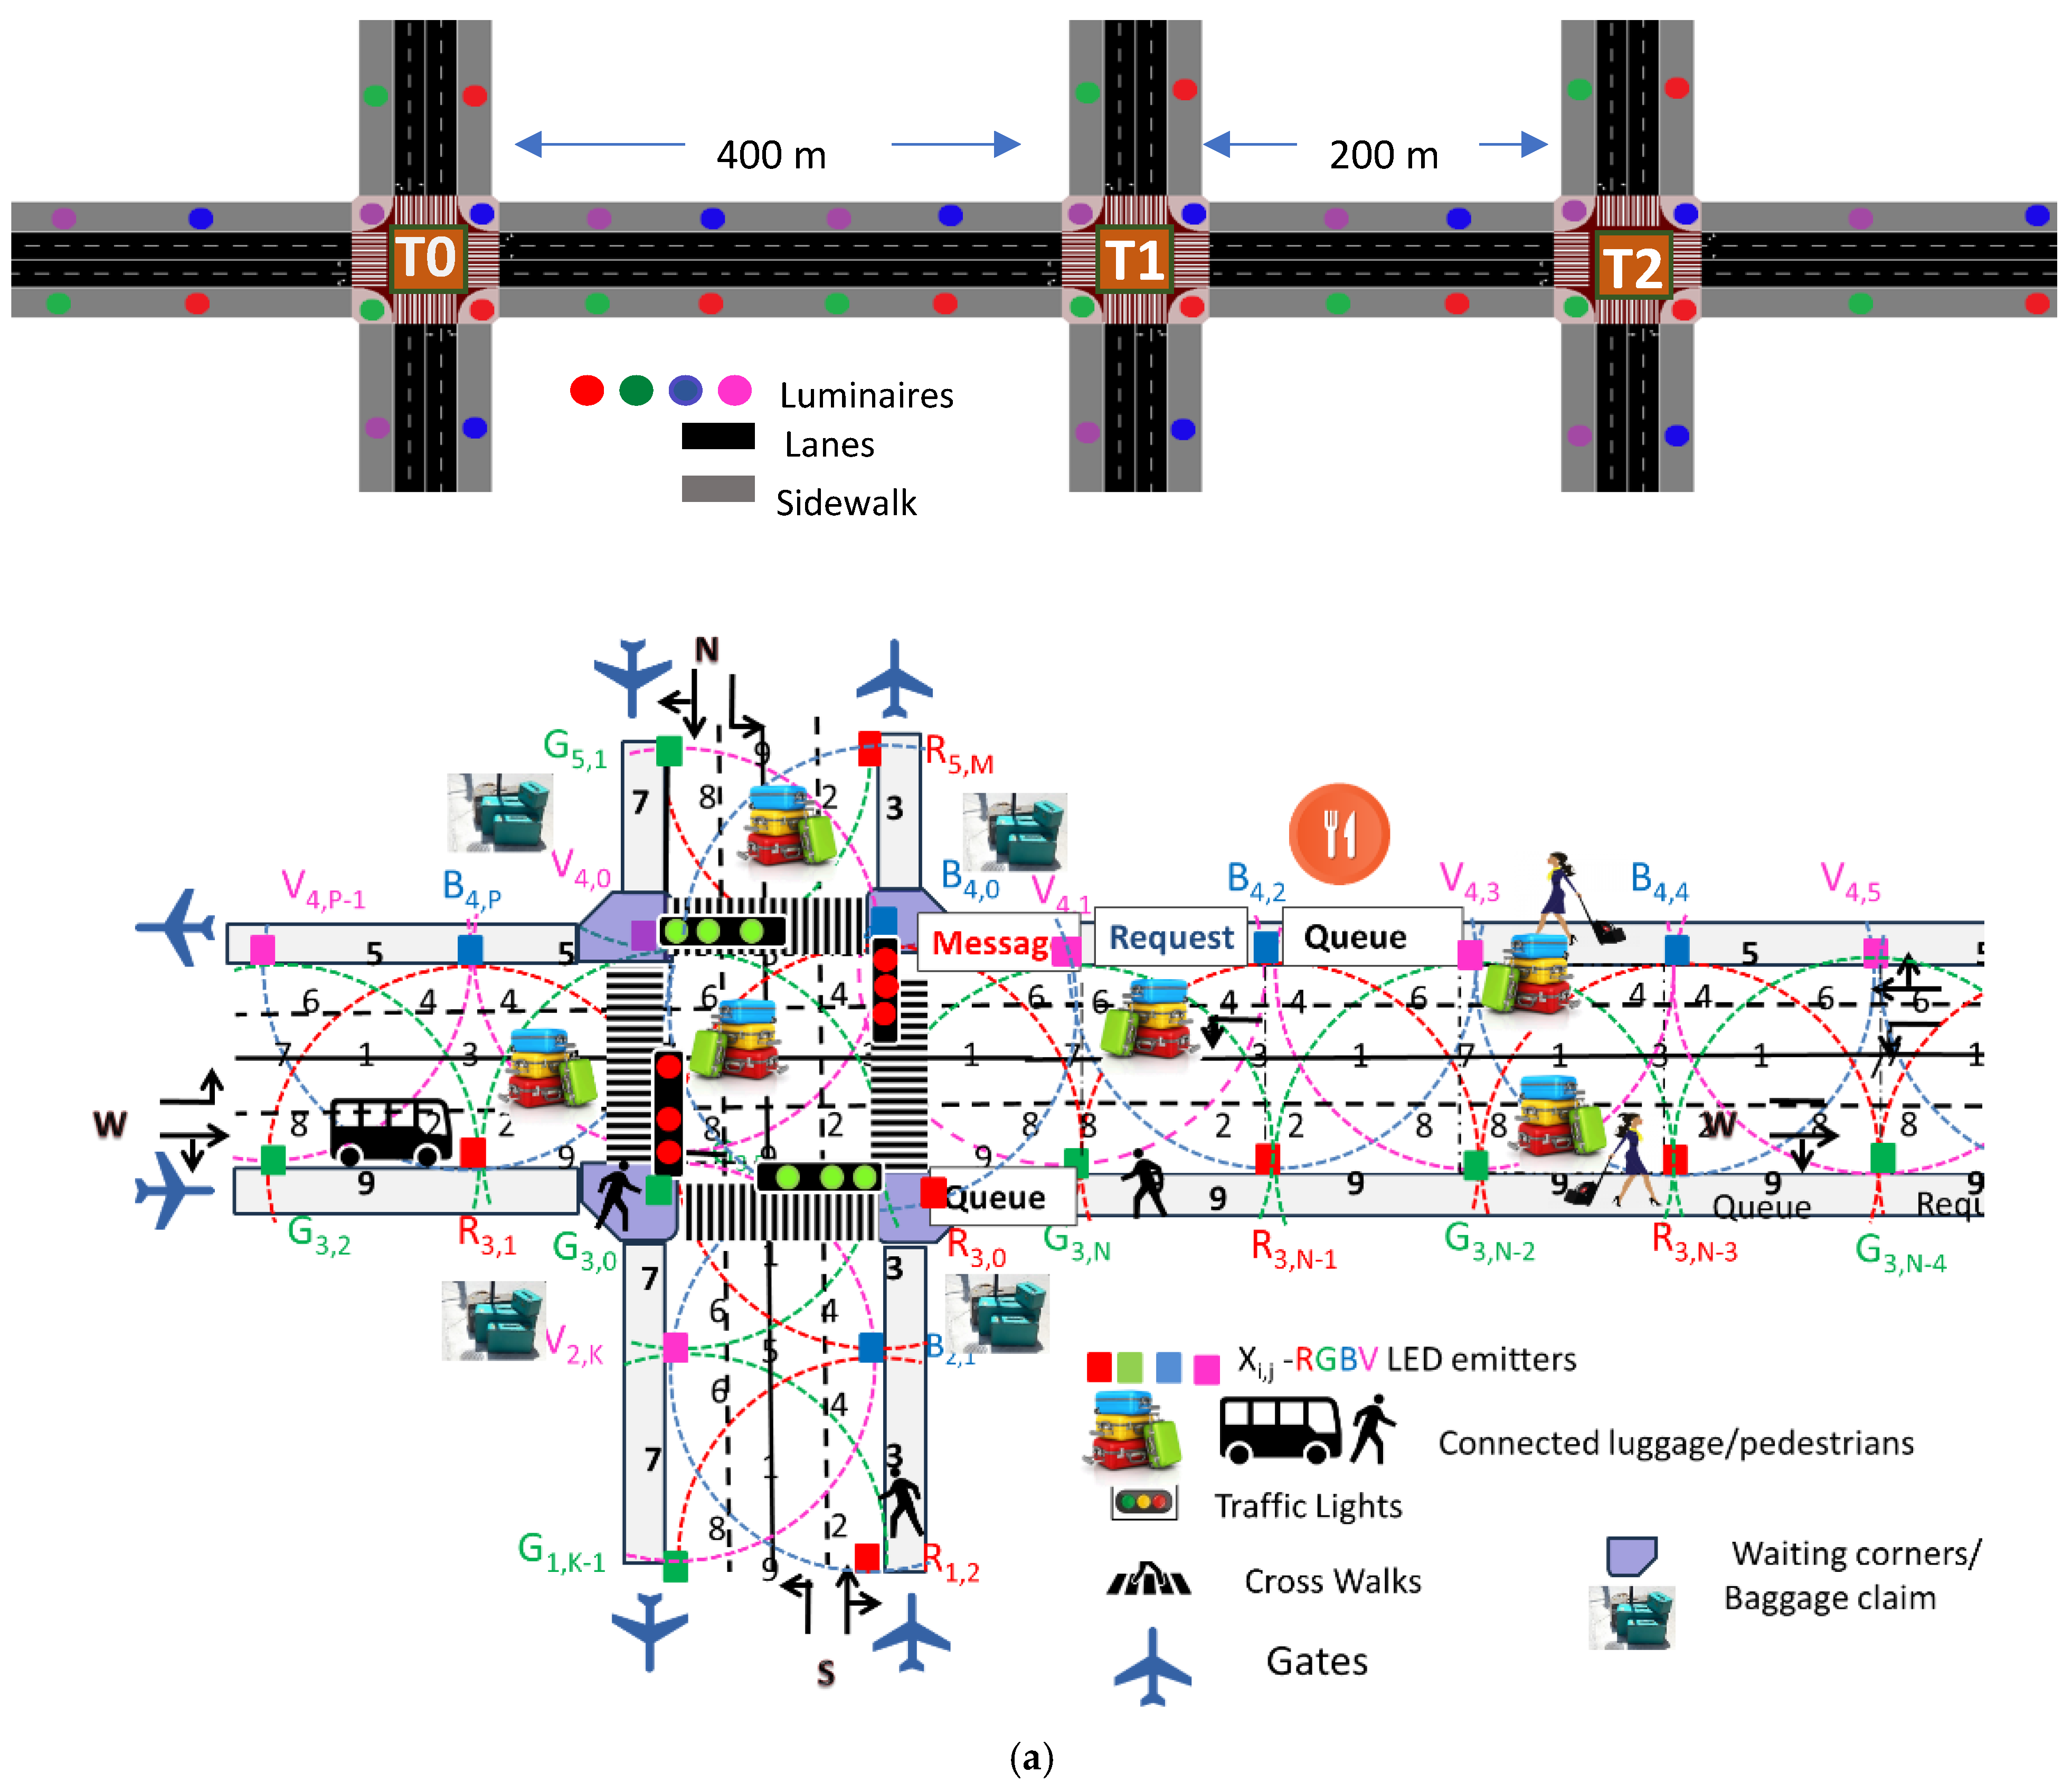
3.1.1. Simulated Airport Scenario
3.1.2. Traffic Management System
3.1.3. Pedestrian Navigation
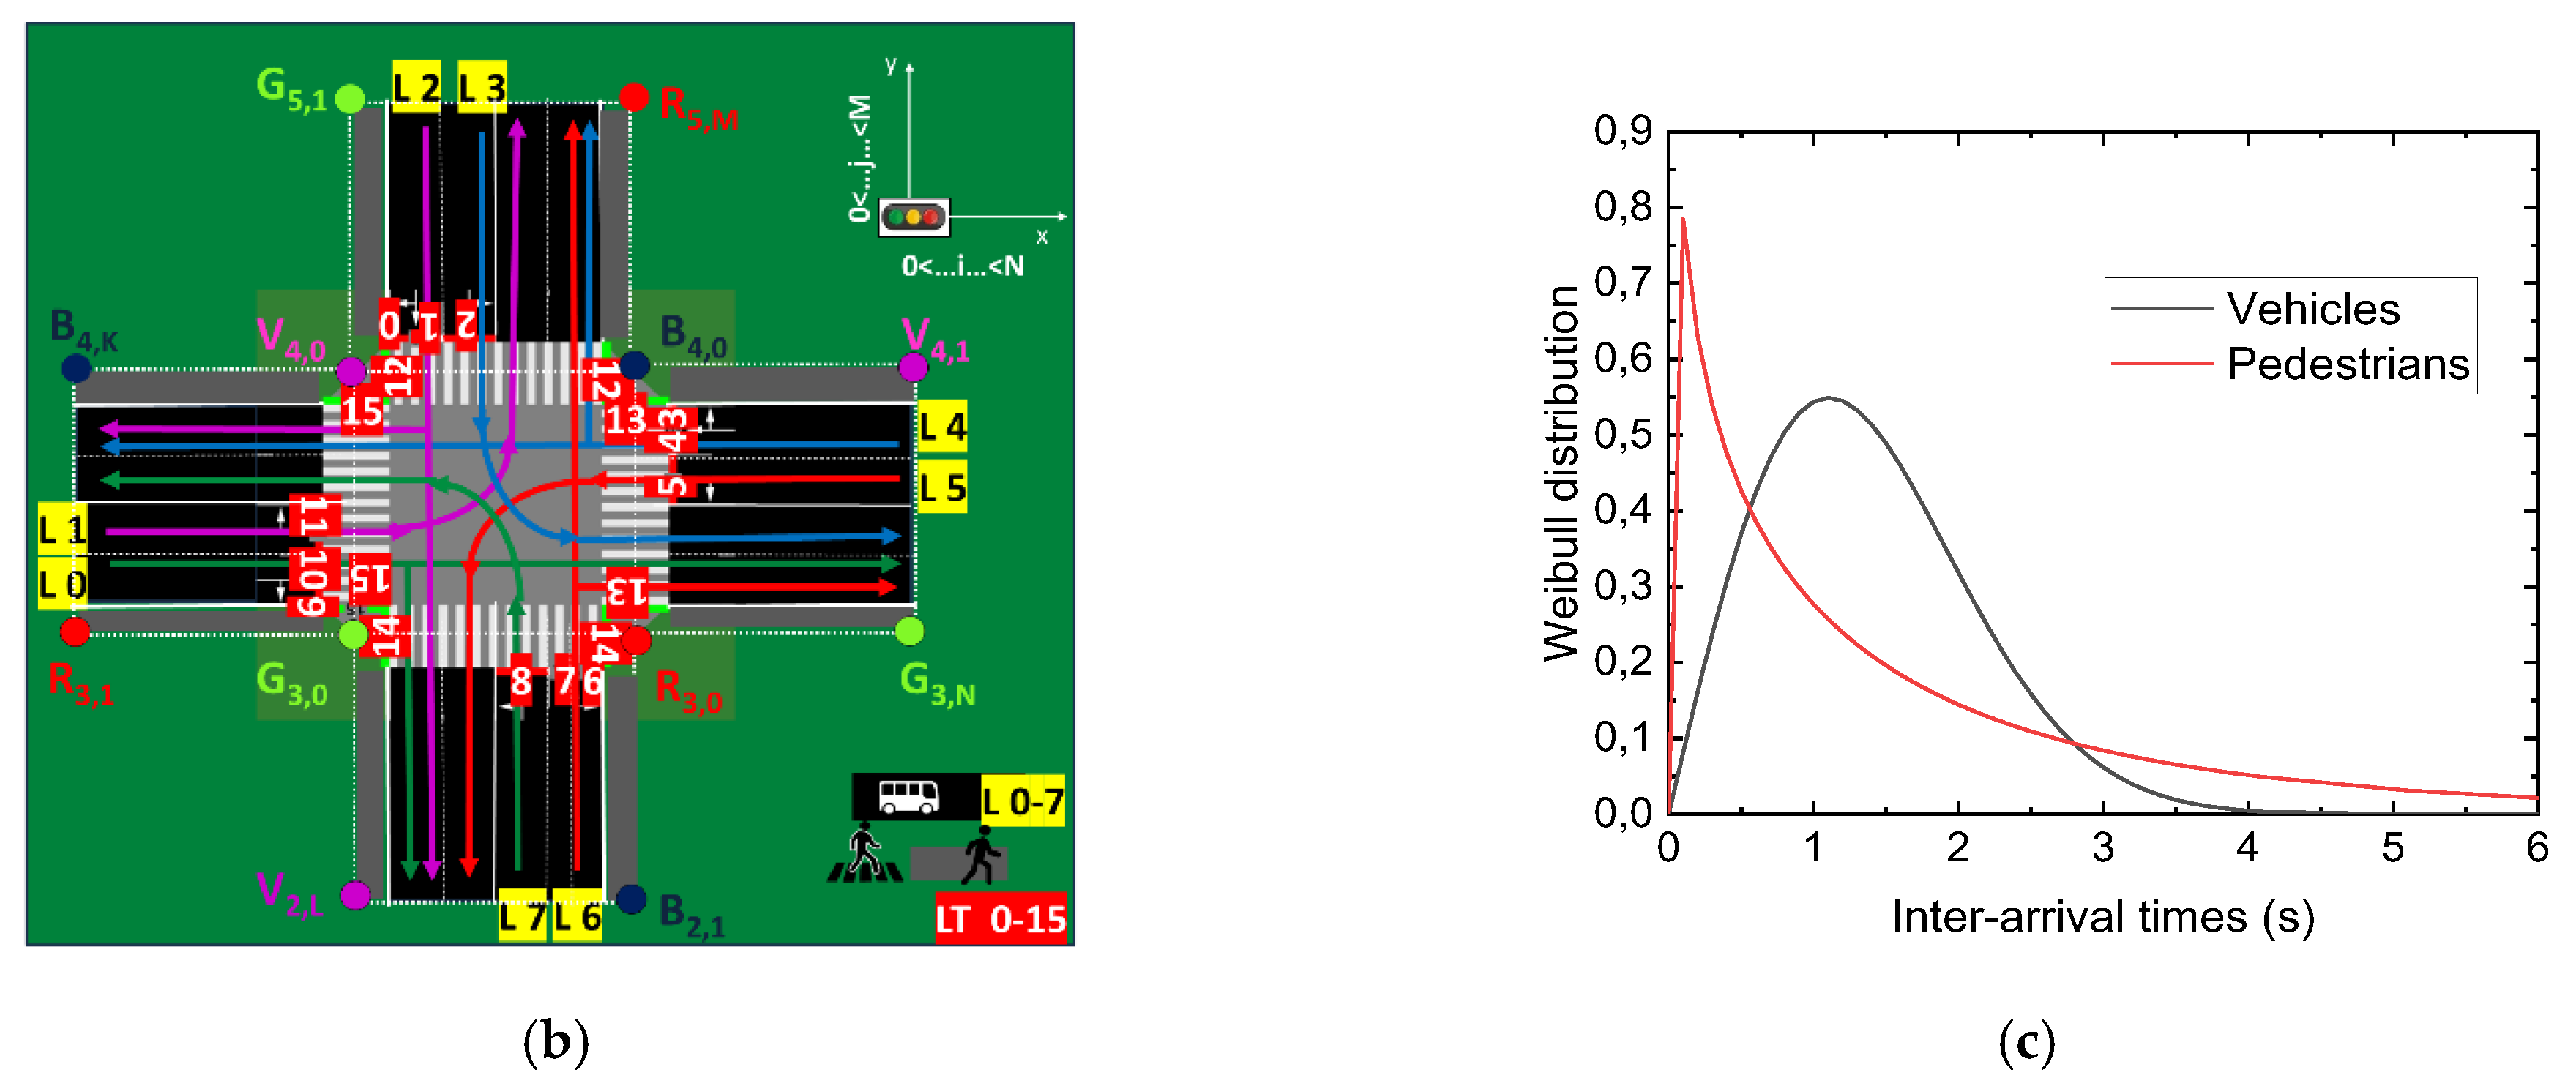
3.1.4. Traffic Generation
- k > 0 is the shape parameter, determining the form of the distribution.
- λ > 0 is the scale parameter, representing the characteristic time scale or mean time.
- t denotes the inter-arrival time between events.
- Vehicles (k = 2, λ = 1.8)—A moderately skewed distribution, capturing clustered arrivals typically observed in traffic flows.
- Pedestrians (k = 0.8, λ = 1.5)—A more spread-out distribution, reflecting higher variability in pedestrian arrivals.
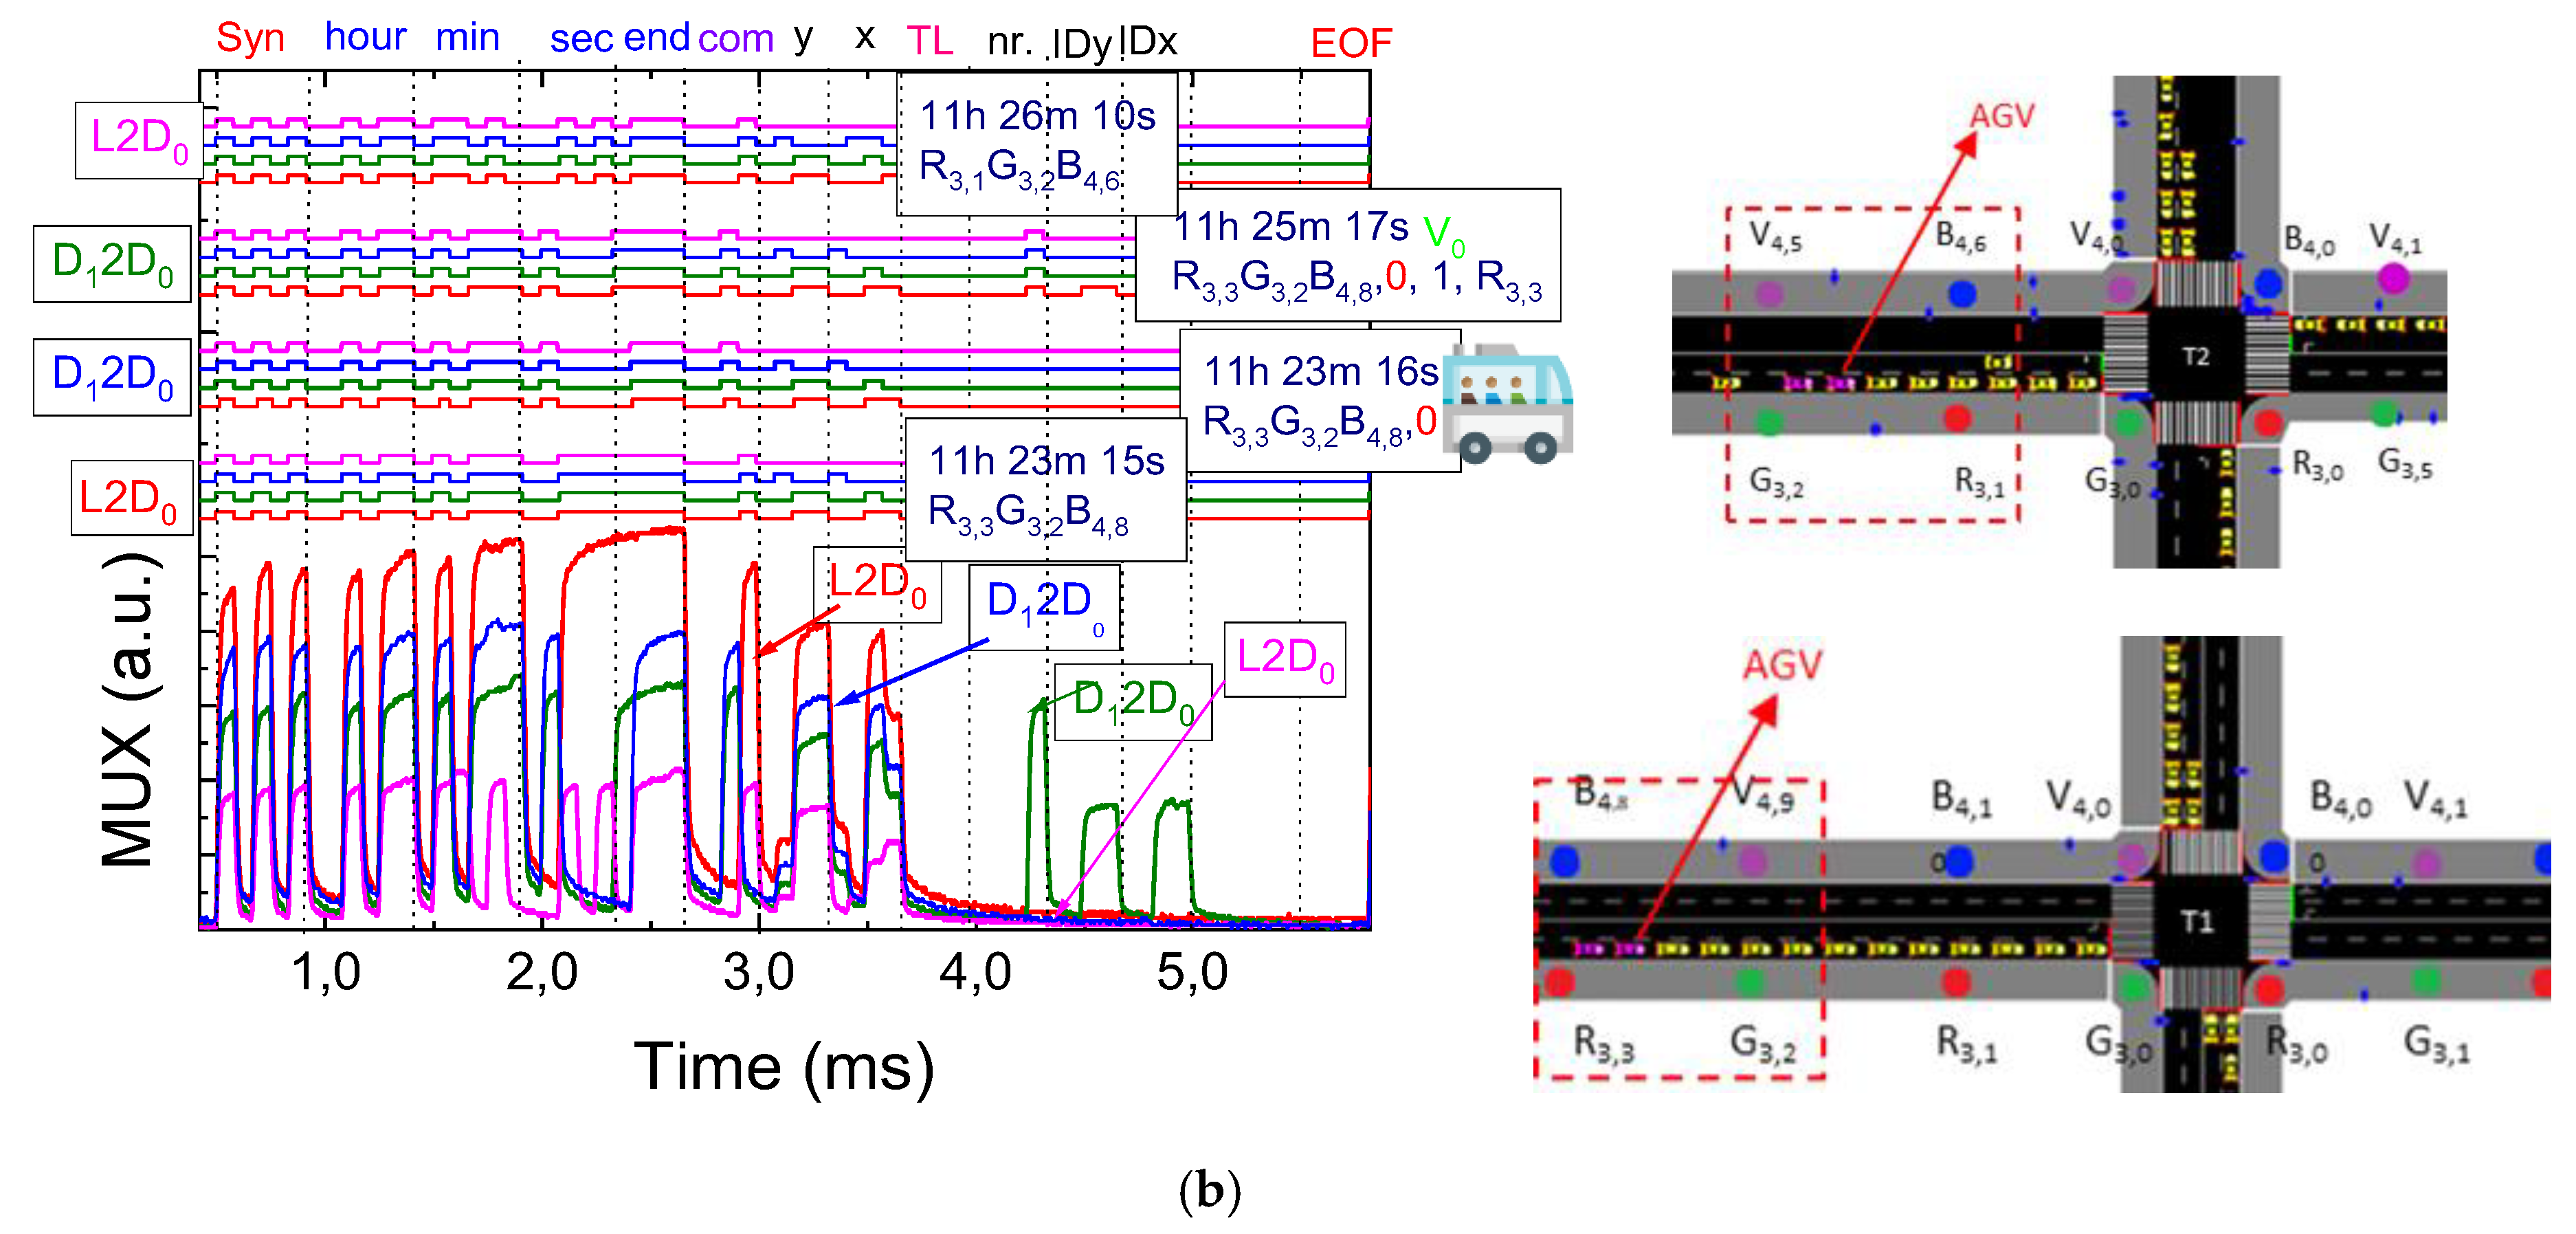
3.2. Data Encoding, Decoding Techniques, and Communication Protocol
- Frame Structure
- Start of Frame (SoF): A 5-bit synchronization block ([10101]) marks the beginning of a frame, enabling receivers to align with transmitters.
- Identification (ID) Blocks: Encodes key details using binary representation for decimal numbers, including:
- ○
- Timeline Information: Contains time data formatted as hour (6 bits), minute (6 bits), and second (6 bits). After this, a flag with the pattern [1111] alerts the decoder to expect specific ID blocks
- ○
- Communication Type (COM): Specifies the type of exchange, such as Lamp/Infrastructure-to-Device/Pedestrian (L/I 2 D/P), Device-to-Device (D2D), or (D/P 2 I).
- ○
- Transmitter Localization: Identifies the transmitter’s y, x coordinates.
- ○
- Other Identifiers: Include additional information specific to the communication type:
- -
- Device Number (Device Nr.): A unique identifier for each device.
- -
- Temporary Identification (Device ID): Session-specific temporary IDs.
- -
- Lane Occupancy (Lane 0–7): Denotes active lane usage.
- -
- Requested Traffic Signal (TL 0–15): Indicates traffic signal requests.
- -
- Cardinal Direction (N, S, E, W): Specifies movement direction.
- -
- Active Phase: Represents the state of “request” or “response” messages at intersections.
- Message Content
- Traffic Message: The body of the frame includes critical information such as the following:
- ○
- Carrier Information: Details like Device IDy,x (y,x coordinates), order behind the leader (Nr. behind), and intersection crossing requests.
- ○
- Traffic Payload: Contains the primary data being transmitted.
- End of Frame (EoF)
- A 4-bit block ([0000]) signals the conclusion of the transmission frame, ensuring complete data integrity.
3.3. Comparing Framework Algorithms with Empirical Data: Insights from Experimentation
3.4. Adaptive Traffic Signal Control Using Deep Reinforcement Learning
4. AI Optimization Model and Rerouting Strategy
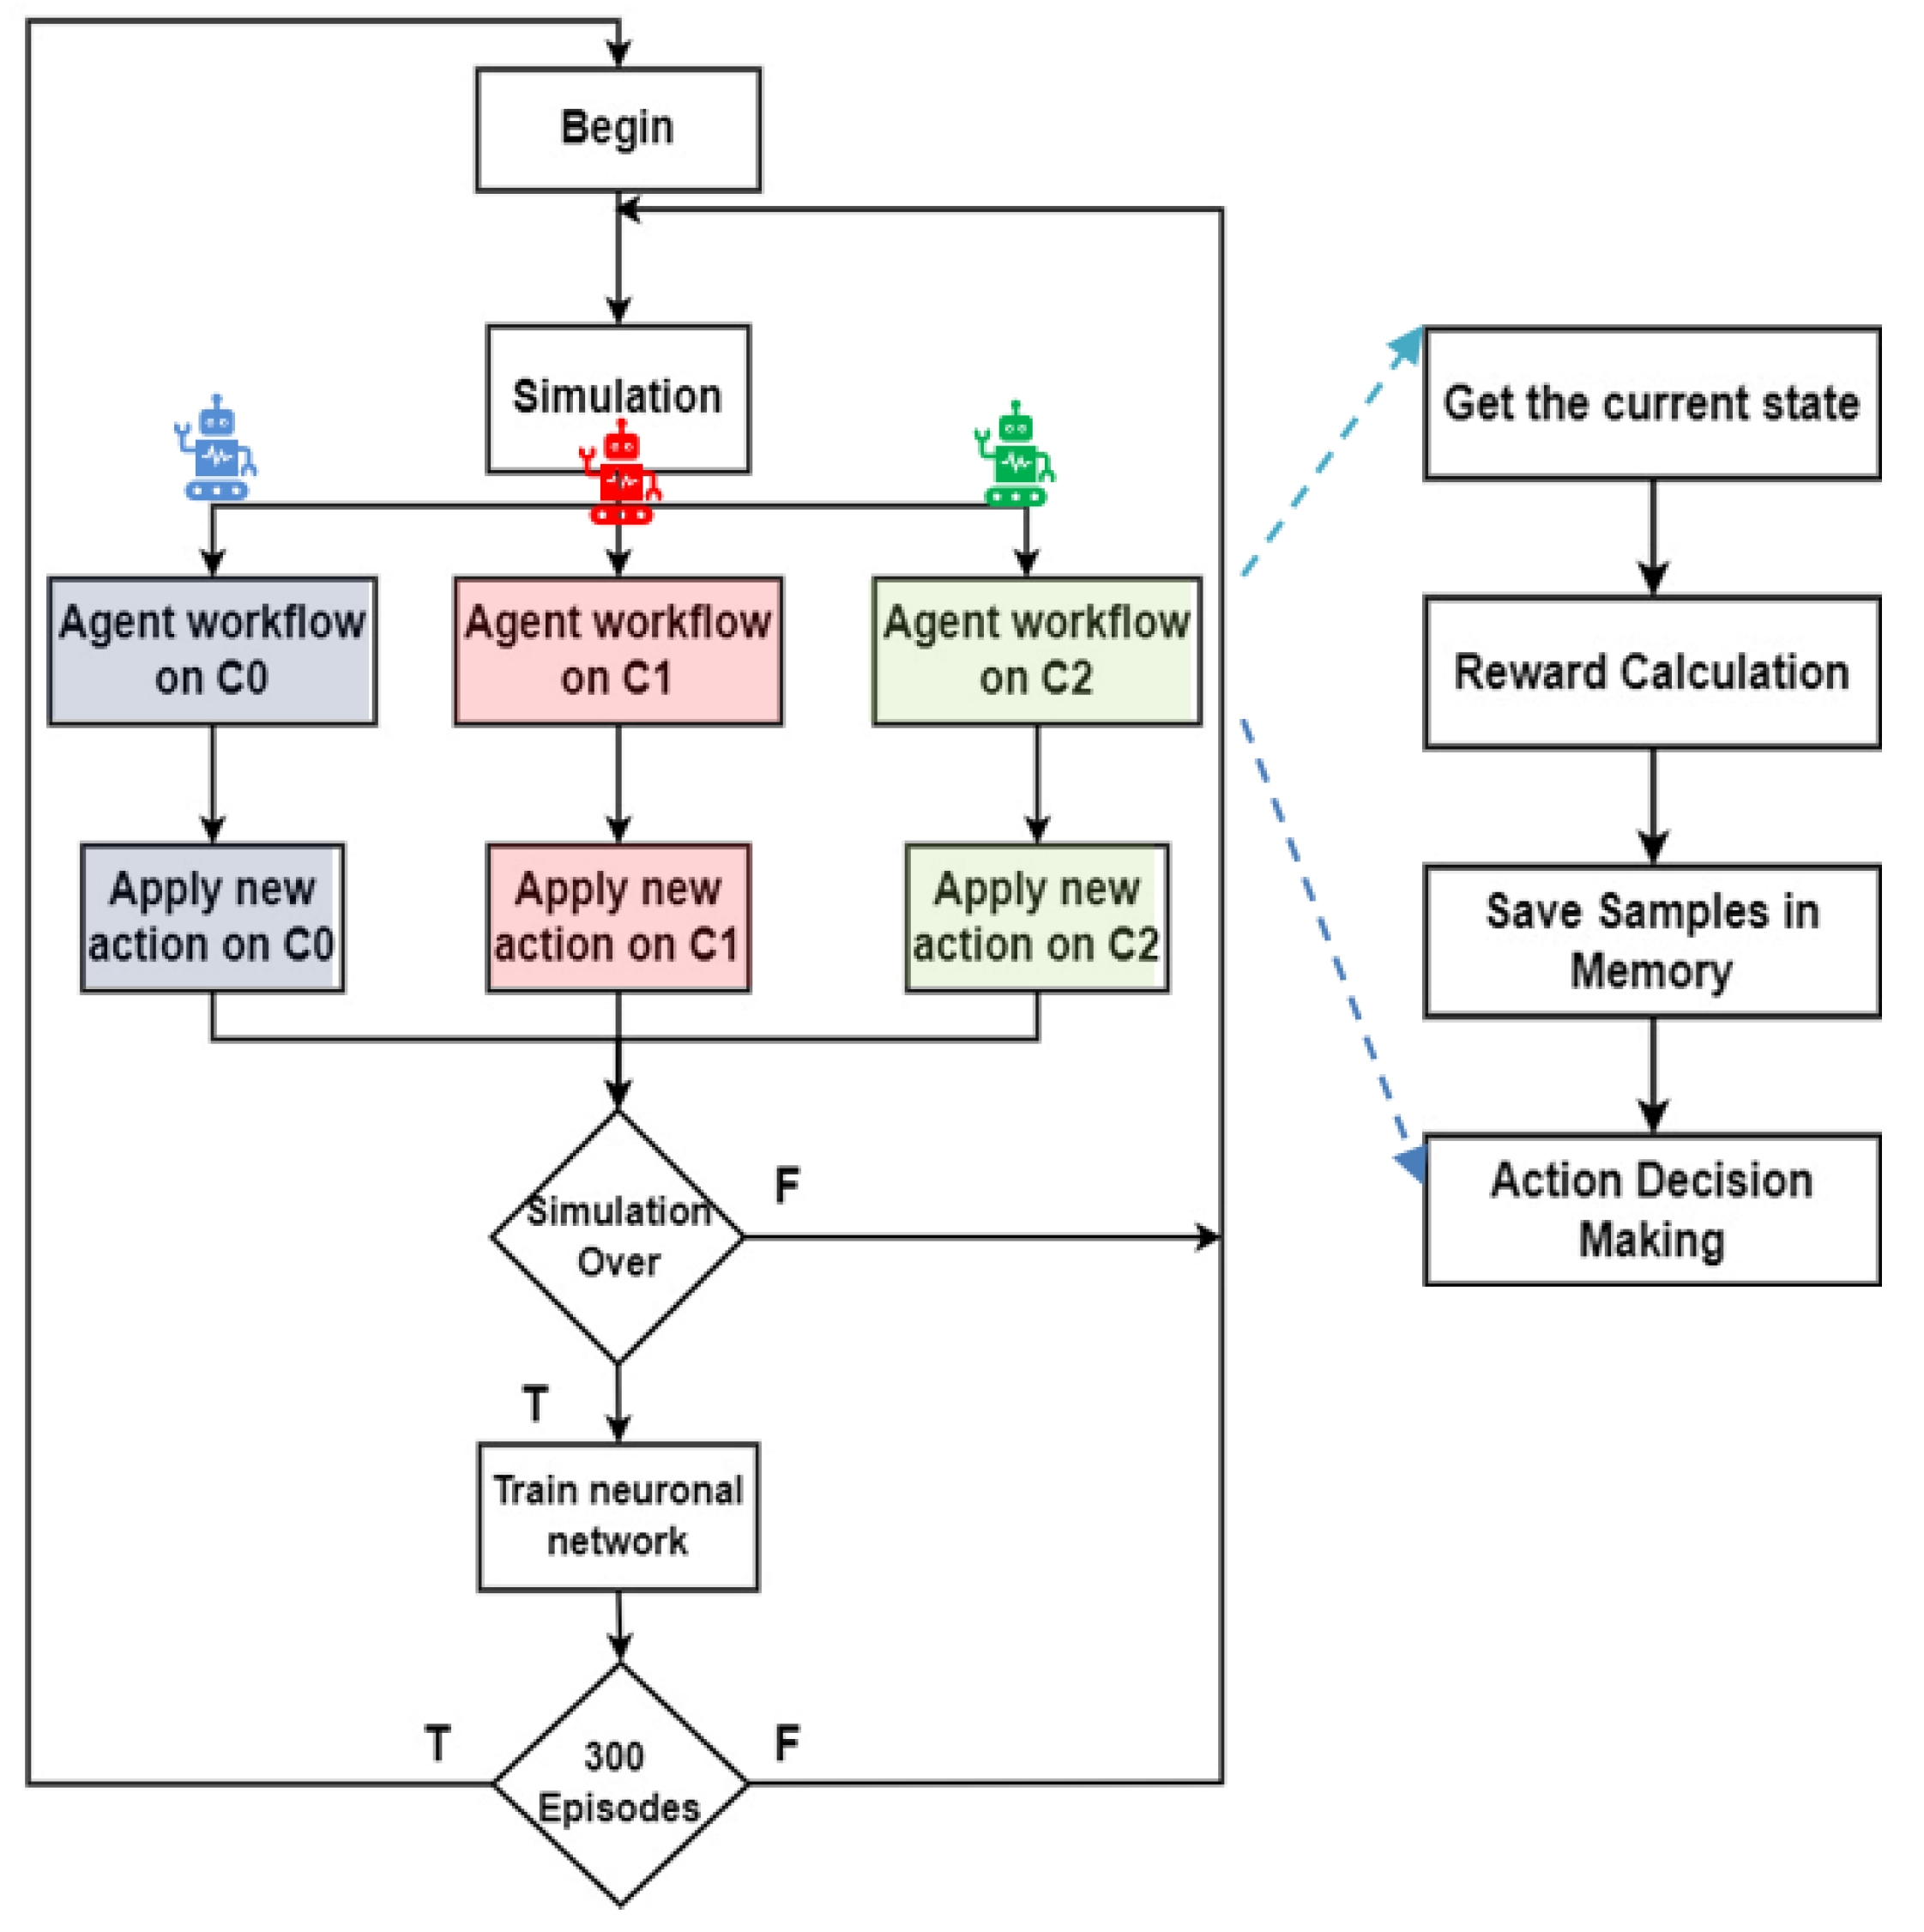
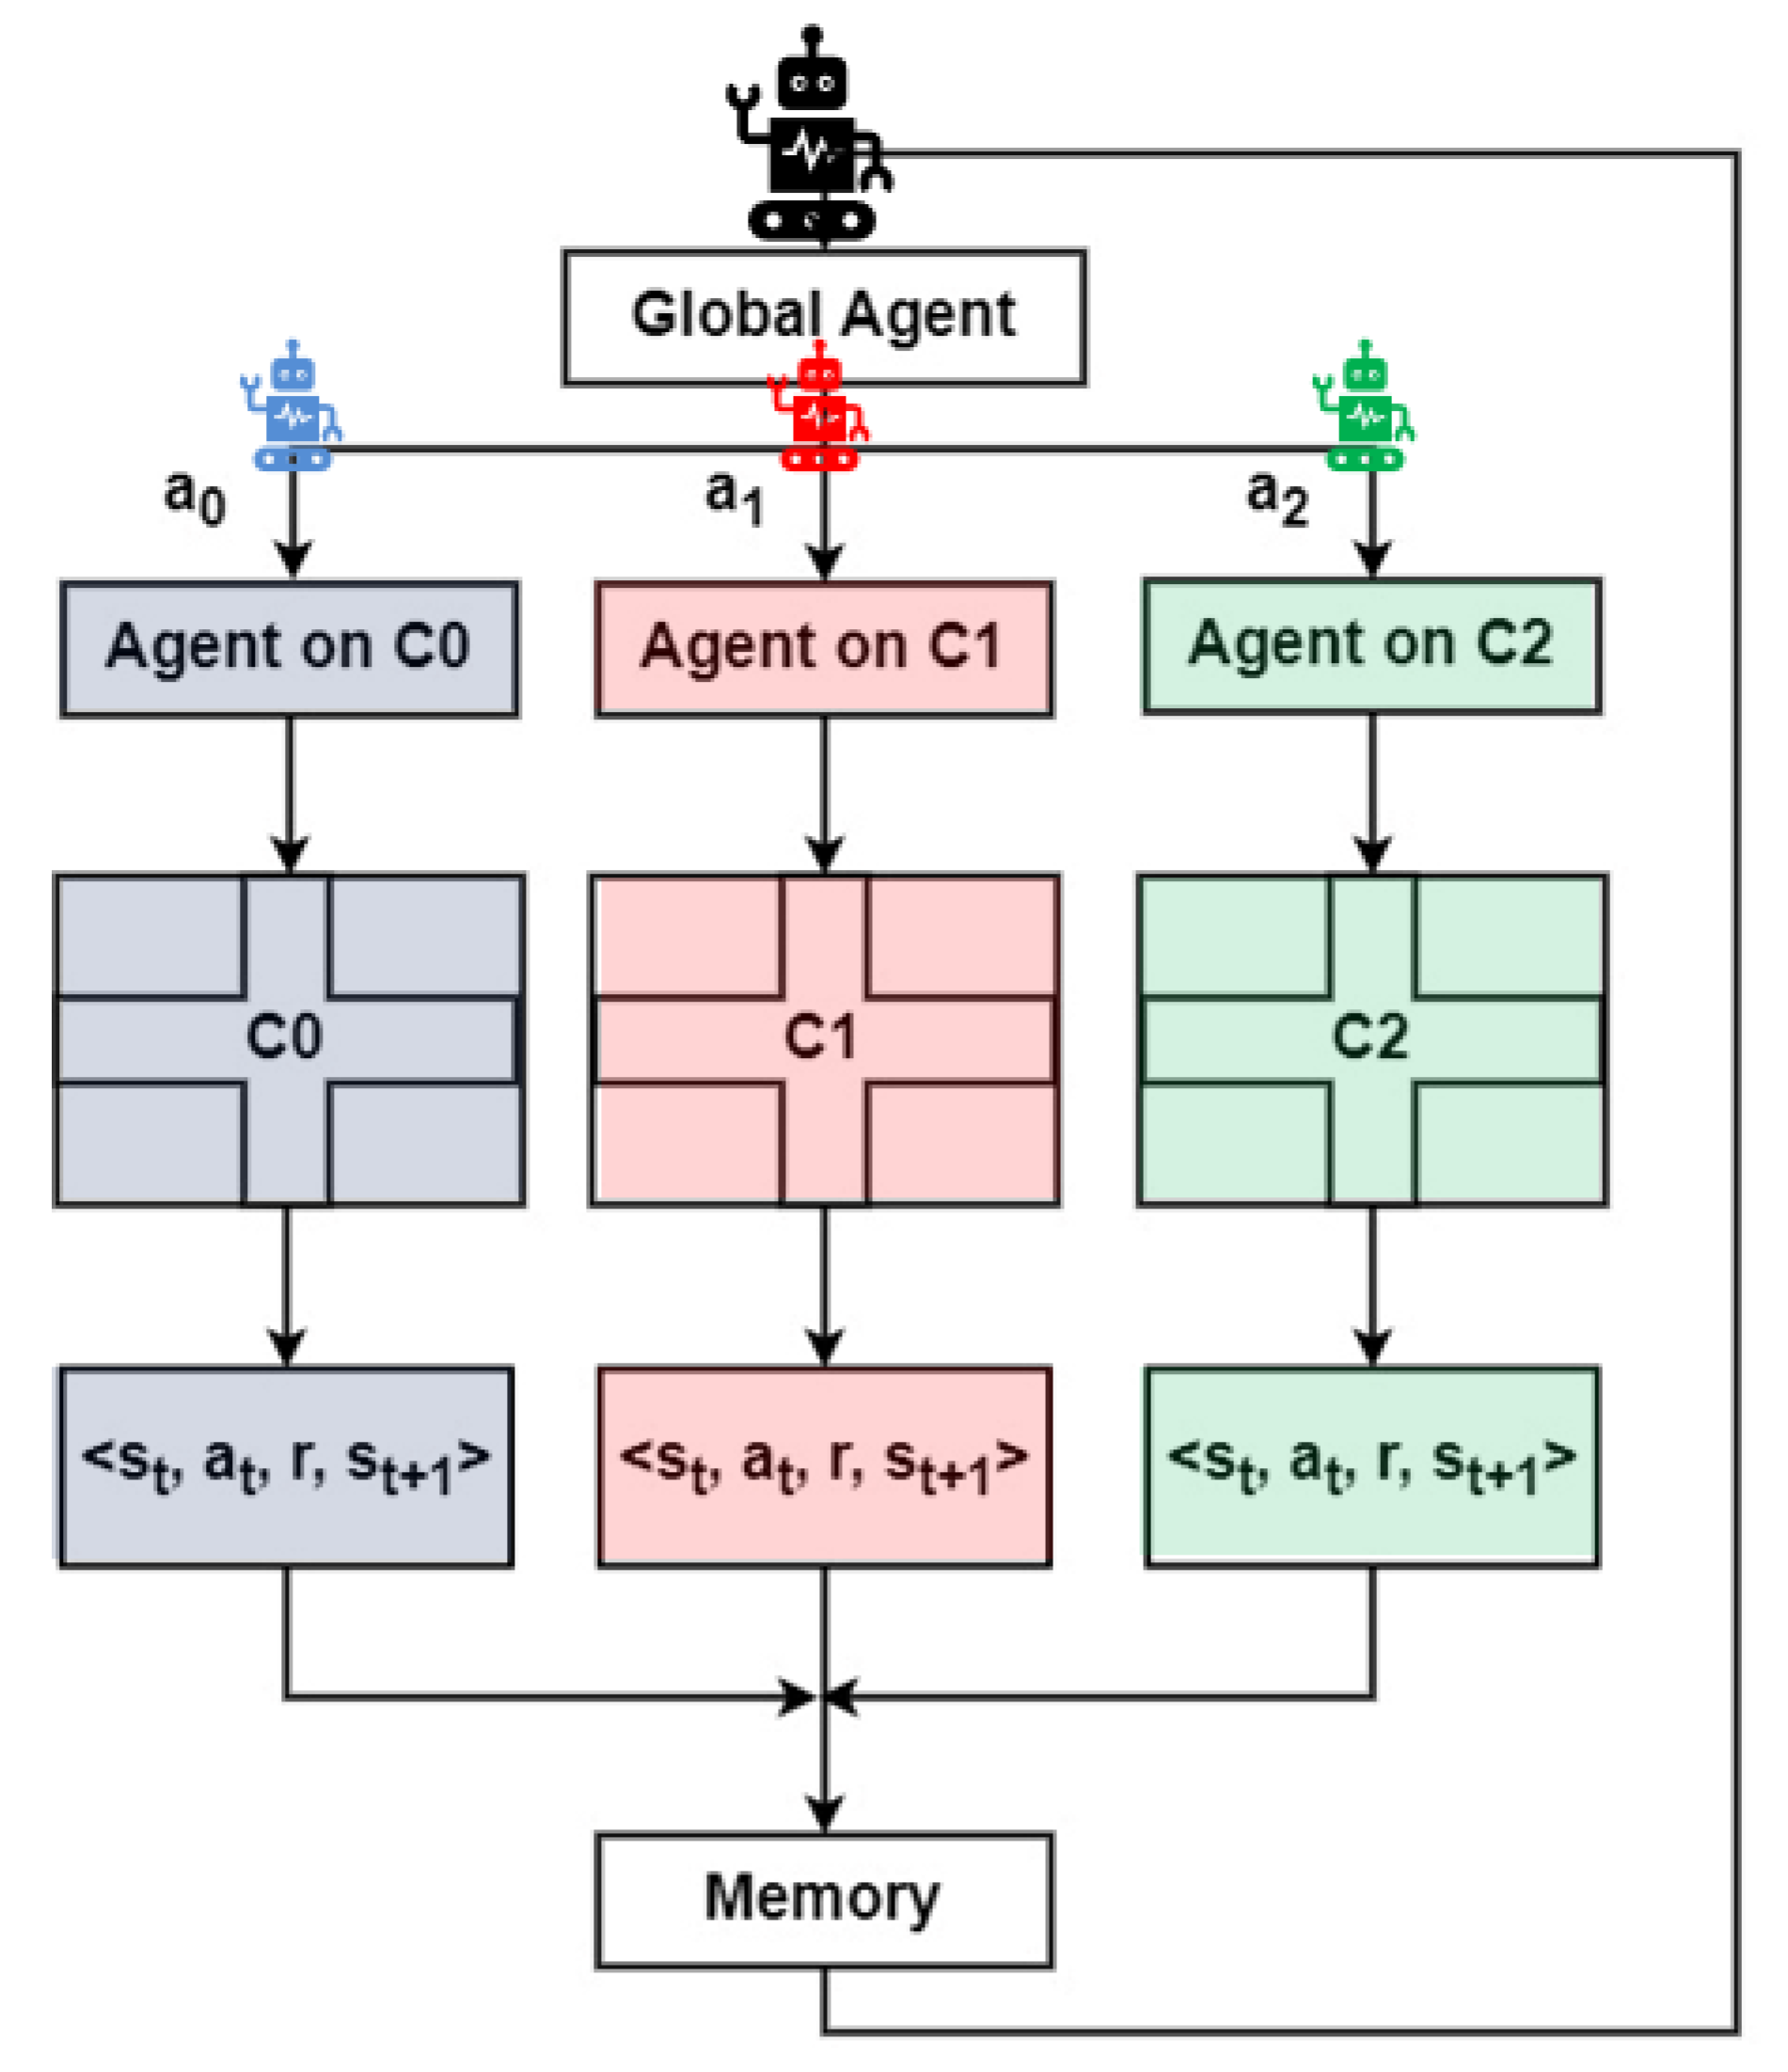
4.1. Multi-Agent Reinforcement Learning Strategies
4.1.1. Agent Architecture and Interaction Model
4.1.2. Practical Agent Interactions in Coordinated Scenarios
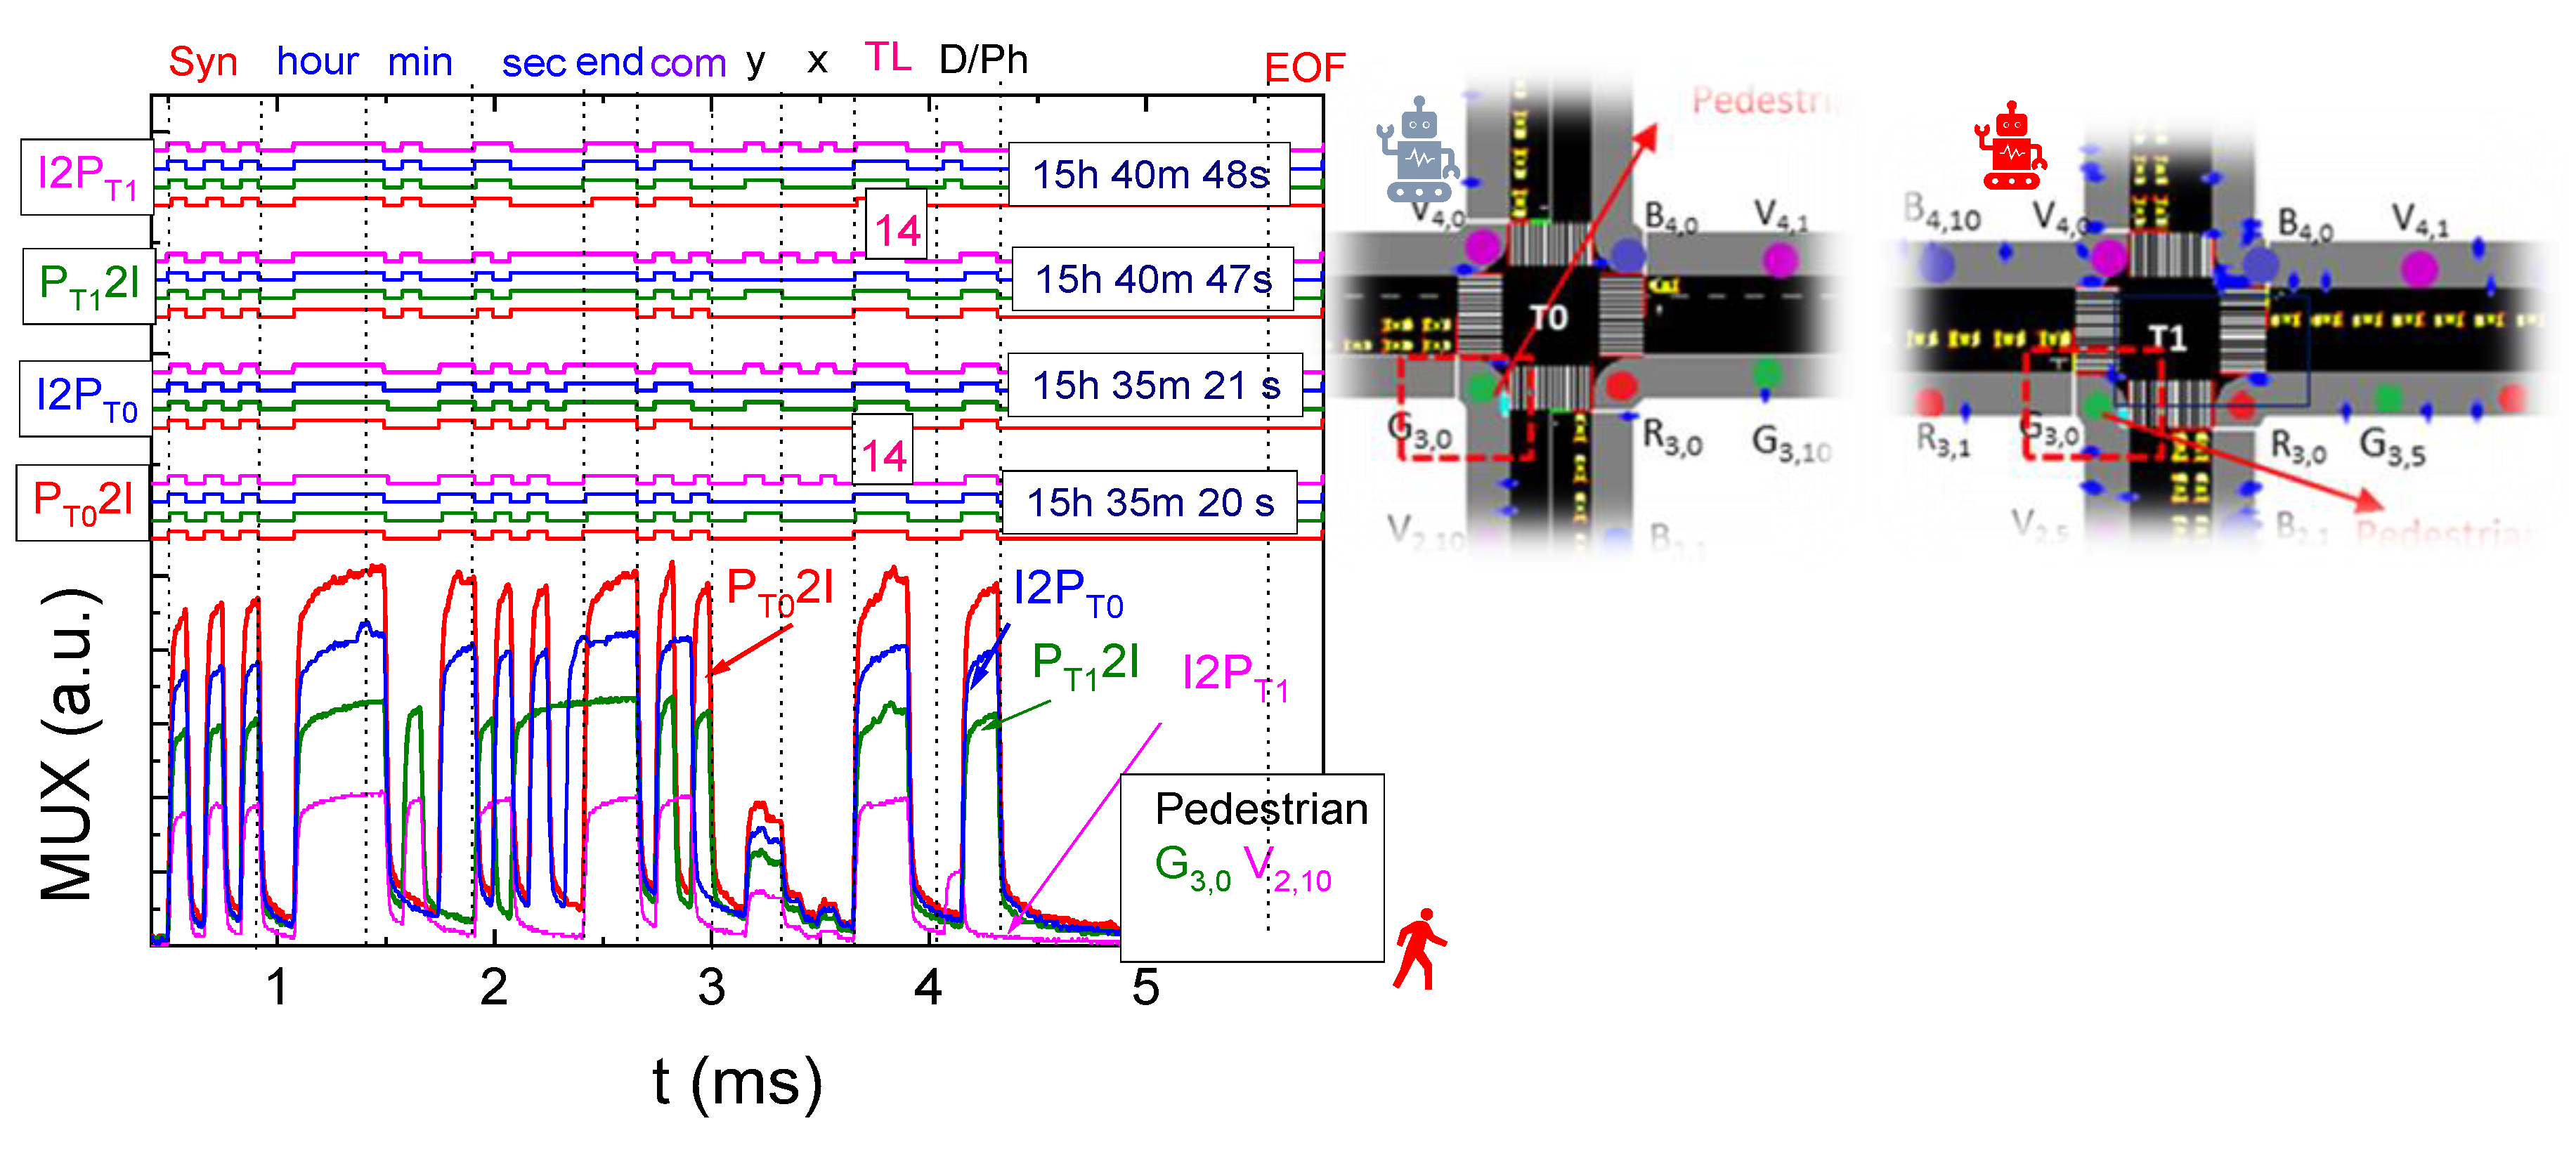
- Coordination Between Adjacent Intersections (I2I): Two traffic signal control agents located at adjacent intersections, say T0 and T1, continuously exchange information about queue lengths and approaching traffic flows. For instance, if the agent at T0 detects a long queue forming in the eastbound lane, it can preemptively notify T1, allowing it to adjust its signal timings to avoid downstream congestion. Conversely, T1 can also notify T0 of a sudden influx of vehicles or pedestrians, prompting T0 to delay green phases momentarily to better synchronize flow. Such inter-agent coordination enables smoother traffic progression across multiple intersections, reduces abrupt stops for AGVs, and minimizes the occurrence of blocking situations at crossings.
- Coordination Between Signal Agents and AGVs (I2D/D2I): In this scenario, the agent managing a traffic light communicates directly with AGVs approaching a decision point. Suppose an AGV is en route to intersection T2, and the local agent forecasts a high pedestrian density in the area. It can proactively communicate a delay message or suggest an alternative route to the AGV to maintain safety and operational efficiency. Conversely, the AGV, via D2I communication, can request early green phase allocation based on real-time mission urgency or cargo priority, which the traffic signal agent can factor into its decision-making process.
- Coordination Between Signal Agents and Pedestrians (I2P/P2I): Pedestrian agents communicate their intention to cross, including direction and location, via P2I messages. In response, the infrastructure agent provides estimated wait times or the activation schedule for the corresponding crossing phase. For example, if a pedestrian at G3,0 V2,10 signals intent to cross eastbound at TL:14, the agent can evaluate whether to integrate the crossing request into the next cycle based on overall system state. If multiple pedestrian agents request the same crossing, the agent can adjust its policy to minimize cumulative waiting time while balancing AGV flow.
- Multi-Agent Cooperation in Dynamic Environments: In complex scenarios—such as during peak passenger arrivals or cargo transfers—agents may dynamically form coalitions to handle localized congestion. For example, agents at T1, T2, and T3 can share aggregated states and collaboratively adjust their policies, prioritizing evacuation routes or accelerating AGV delivery pathways. This emergent cooperative behavior, fostered by MARL, enhances scalability and resilience, particularly in unpredictable environments.
4.1.3. Centralized Traffic Management with Multi-Agent Reinforcement Learning: Routing Strategies and Scenario Analysis
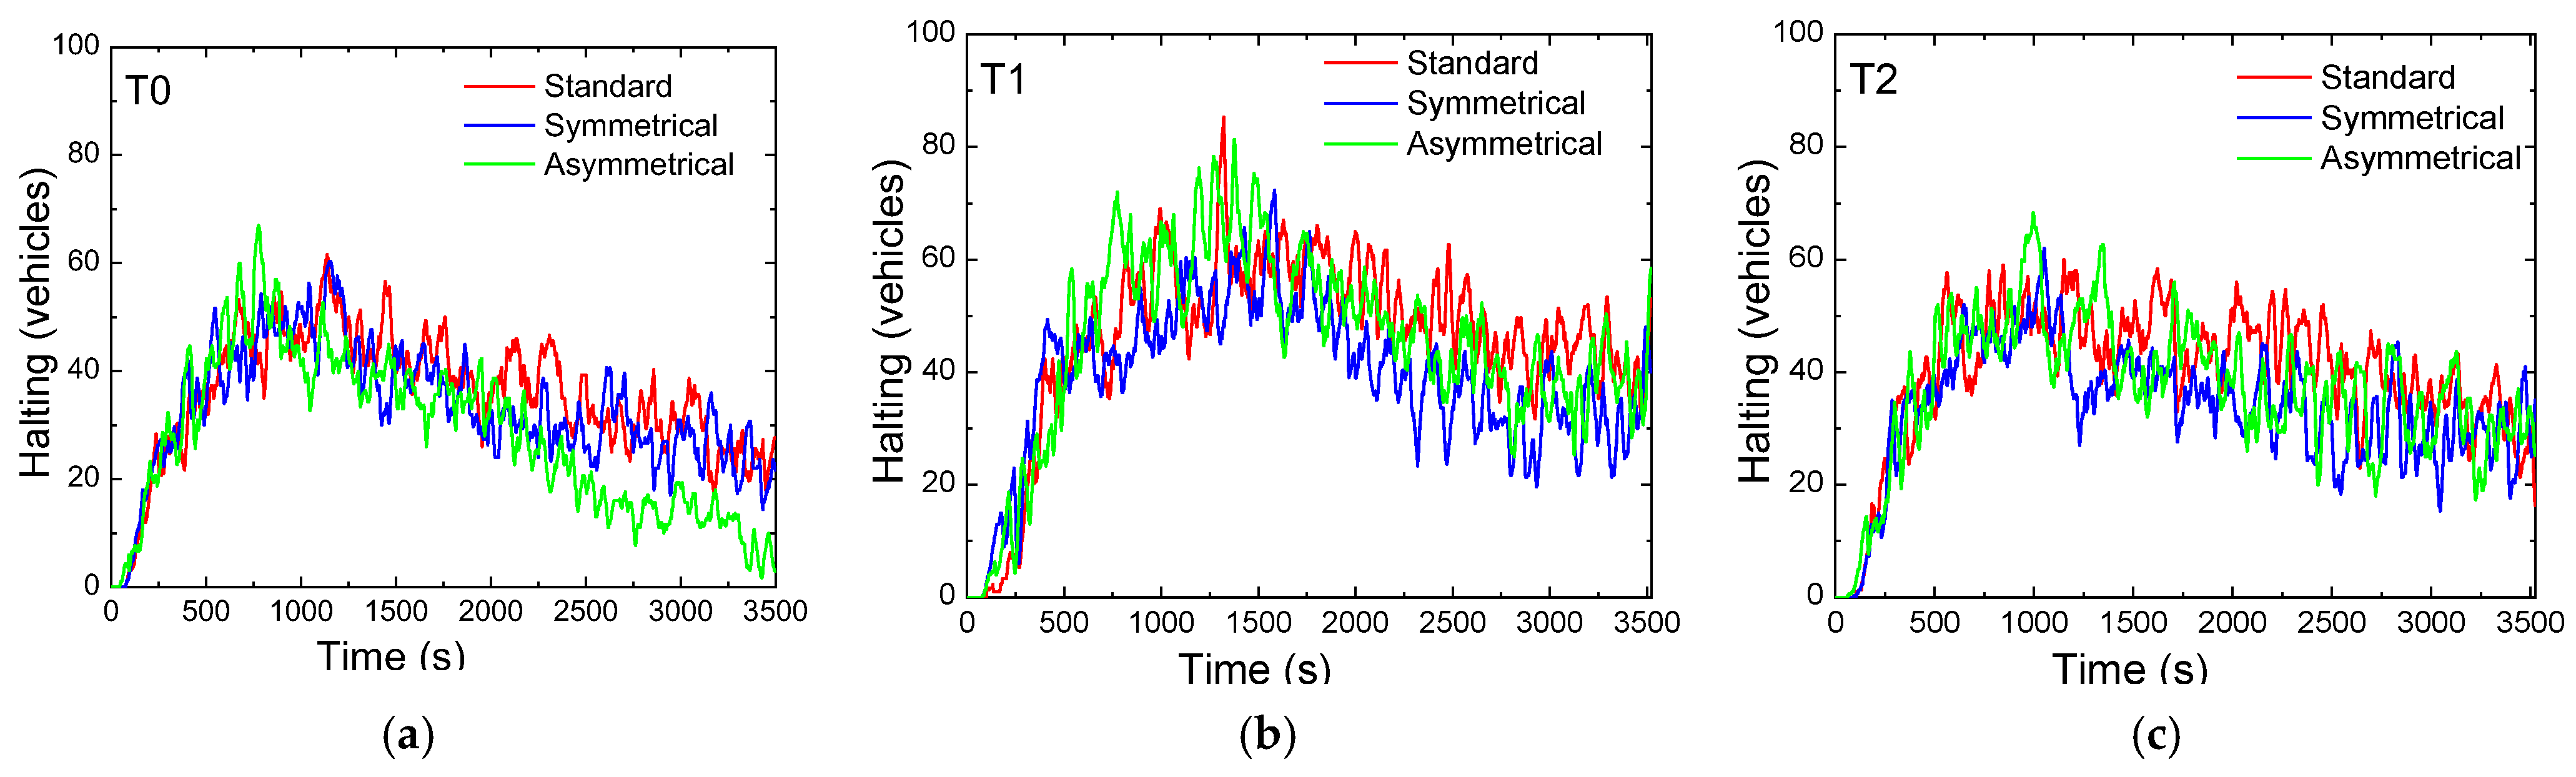
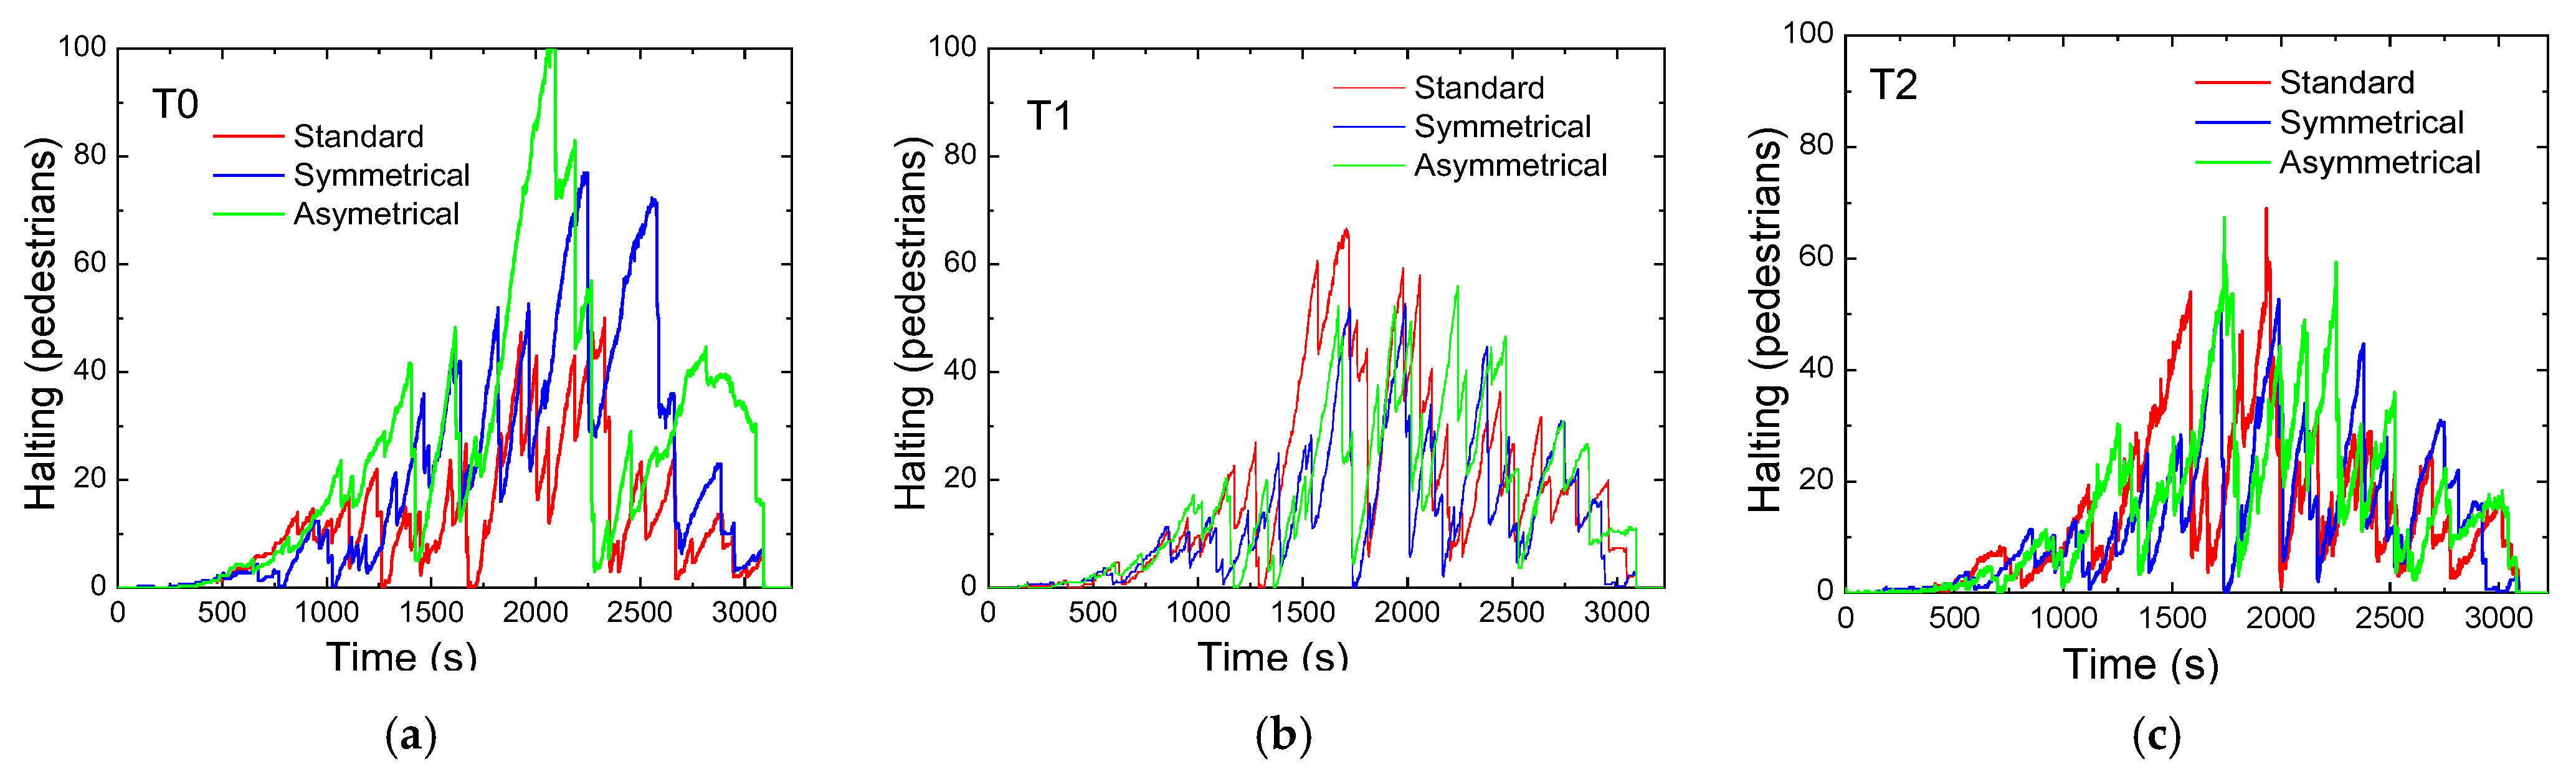
- Standard Scenario: 75% of vehicles travel straight, while 25% make turns.
- Symmetric Rerouting Scenario: Triggered under high traffic demand or incidents, 75% of vehicles are redirected through turning maneuvers to balance flow across all directions.
- Asymmetric Rerouting Scenario: Applied in situations where traffic flow at one intersection significantly affects neighboring junctions. In this case, the reward structure is adapted to prioritize global traffic efficiency by favoring specific directions.
4.1.4. Cooperative Reward Mechanisms
- Local waiting time reduction at a given intersection;
- Queue balancing across neighboring intersections;
- Pedestrian comfort metrics, such as average waiting time or number of successful crossings per cycle.
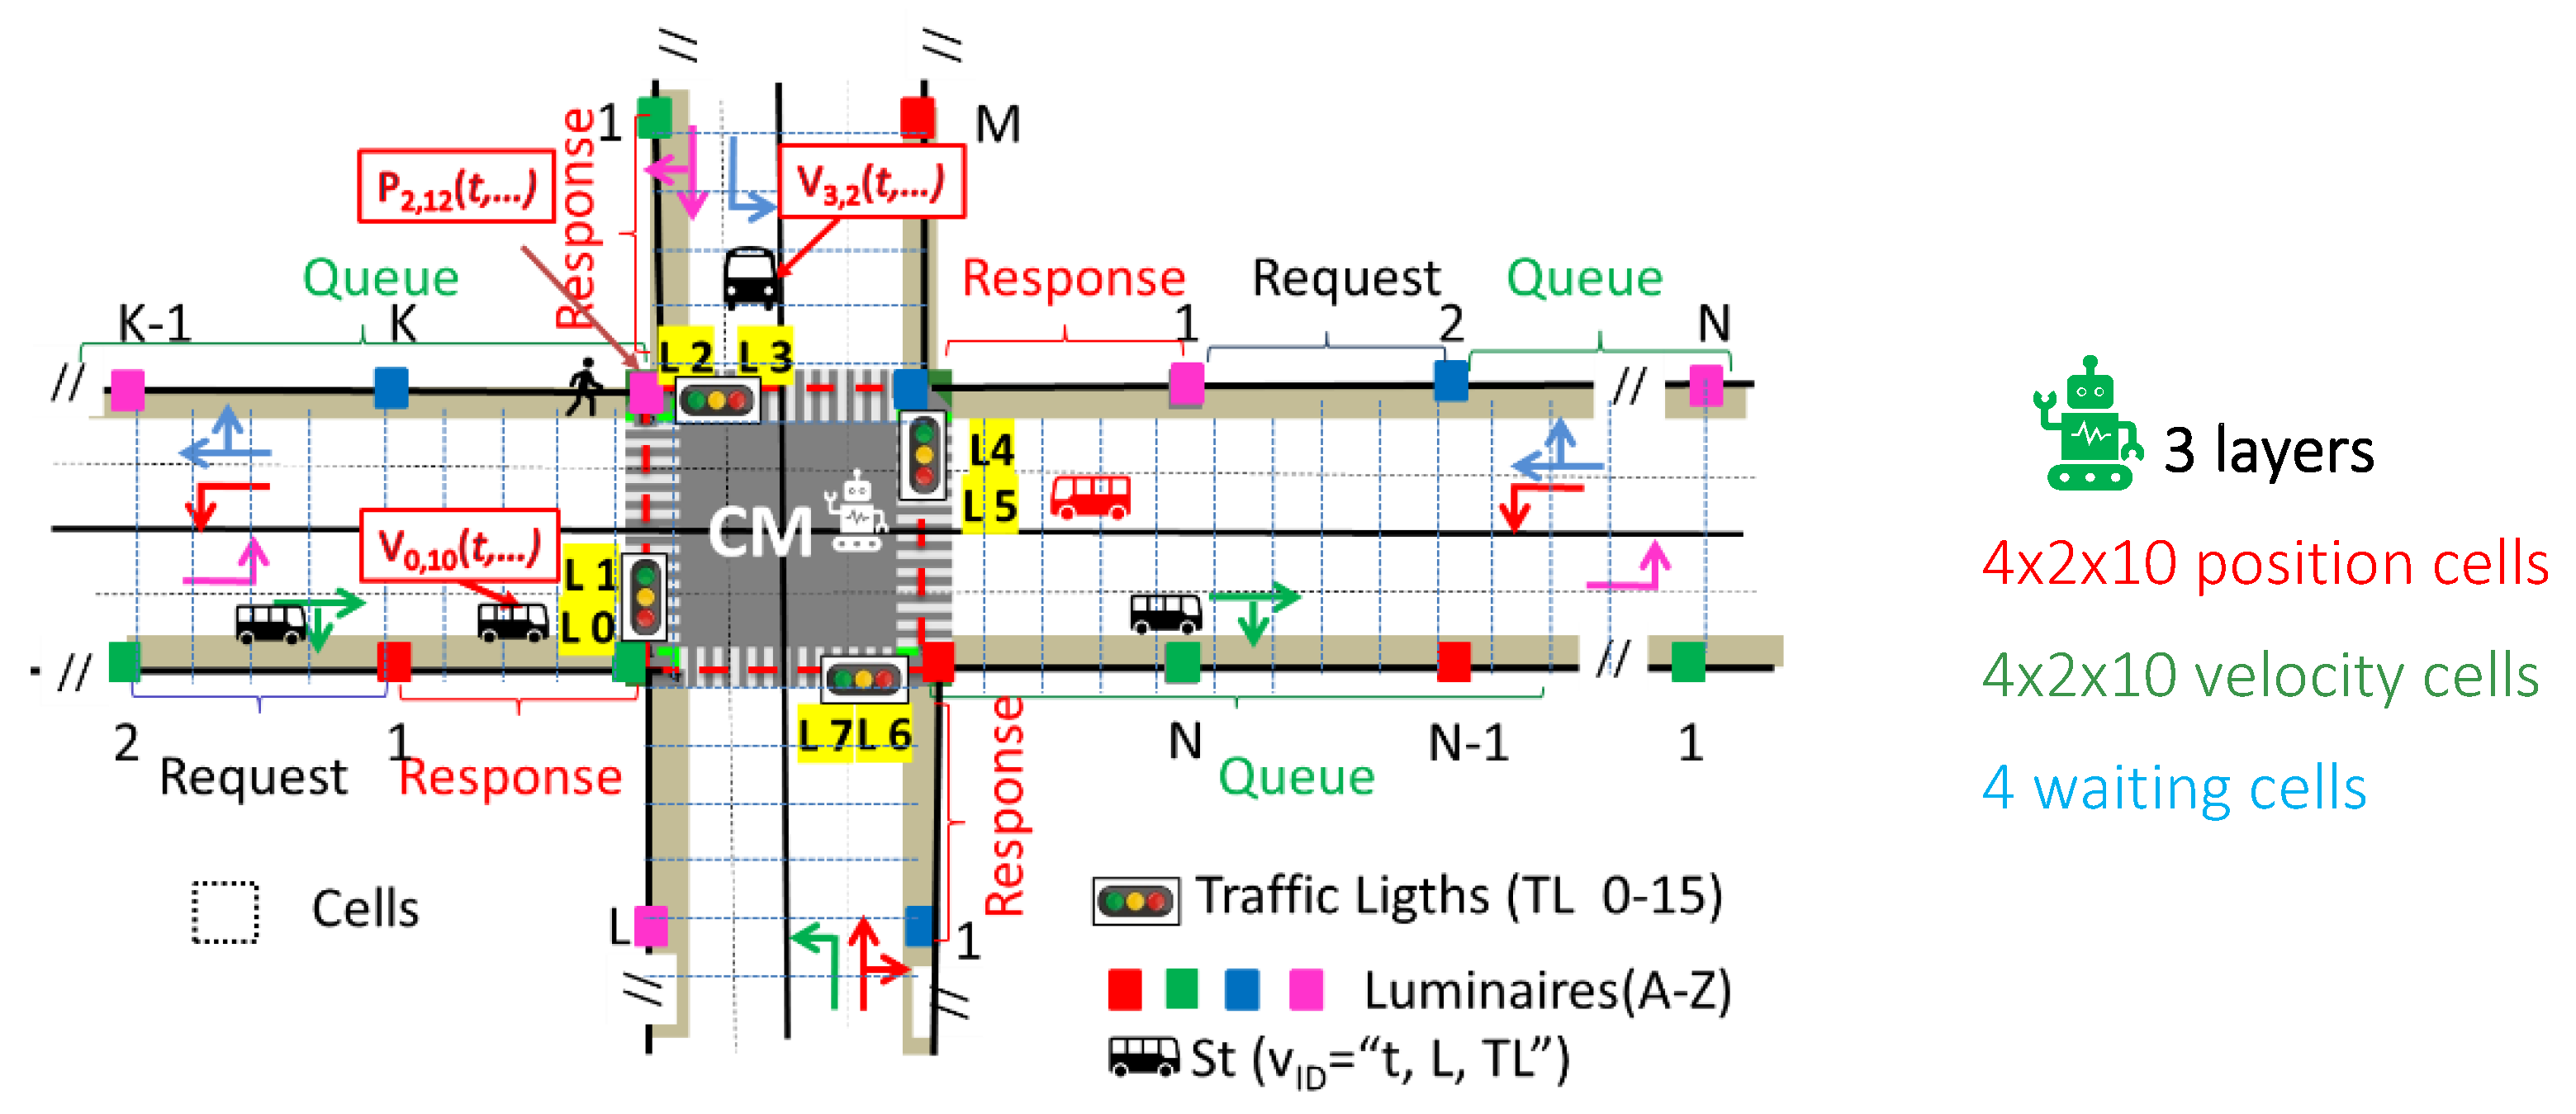
4.2. Simulation Environment and Validation
- Layer 1 consists of 80 binary cells (10 per lane), indicating vehicle presence. A value of ‘1’ represents an occupied cell, while ‘0’ indicates an empty cell.
- Layer 2 mirrors the structure of the first layer and encodes the normalized speed of vehicles in each corresponding cell, if present.
- Layer 3 includes 4 cells representing pedestrian waiting zones, capturing the number of pedestrians waiting for their crossing phase to become active.
4.3. Rerouting Techniques: Network Training and Testing
4.4. Global Agent Decisions
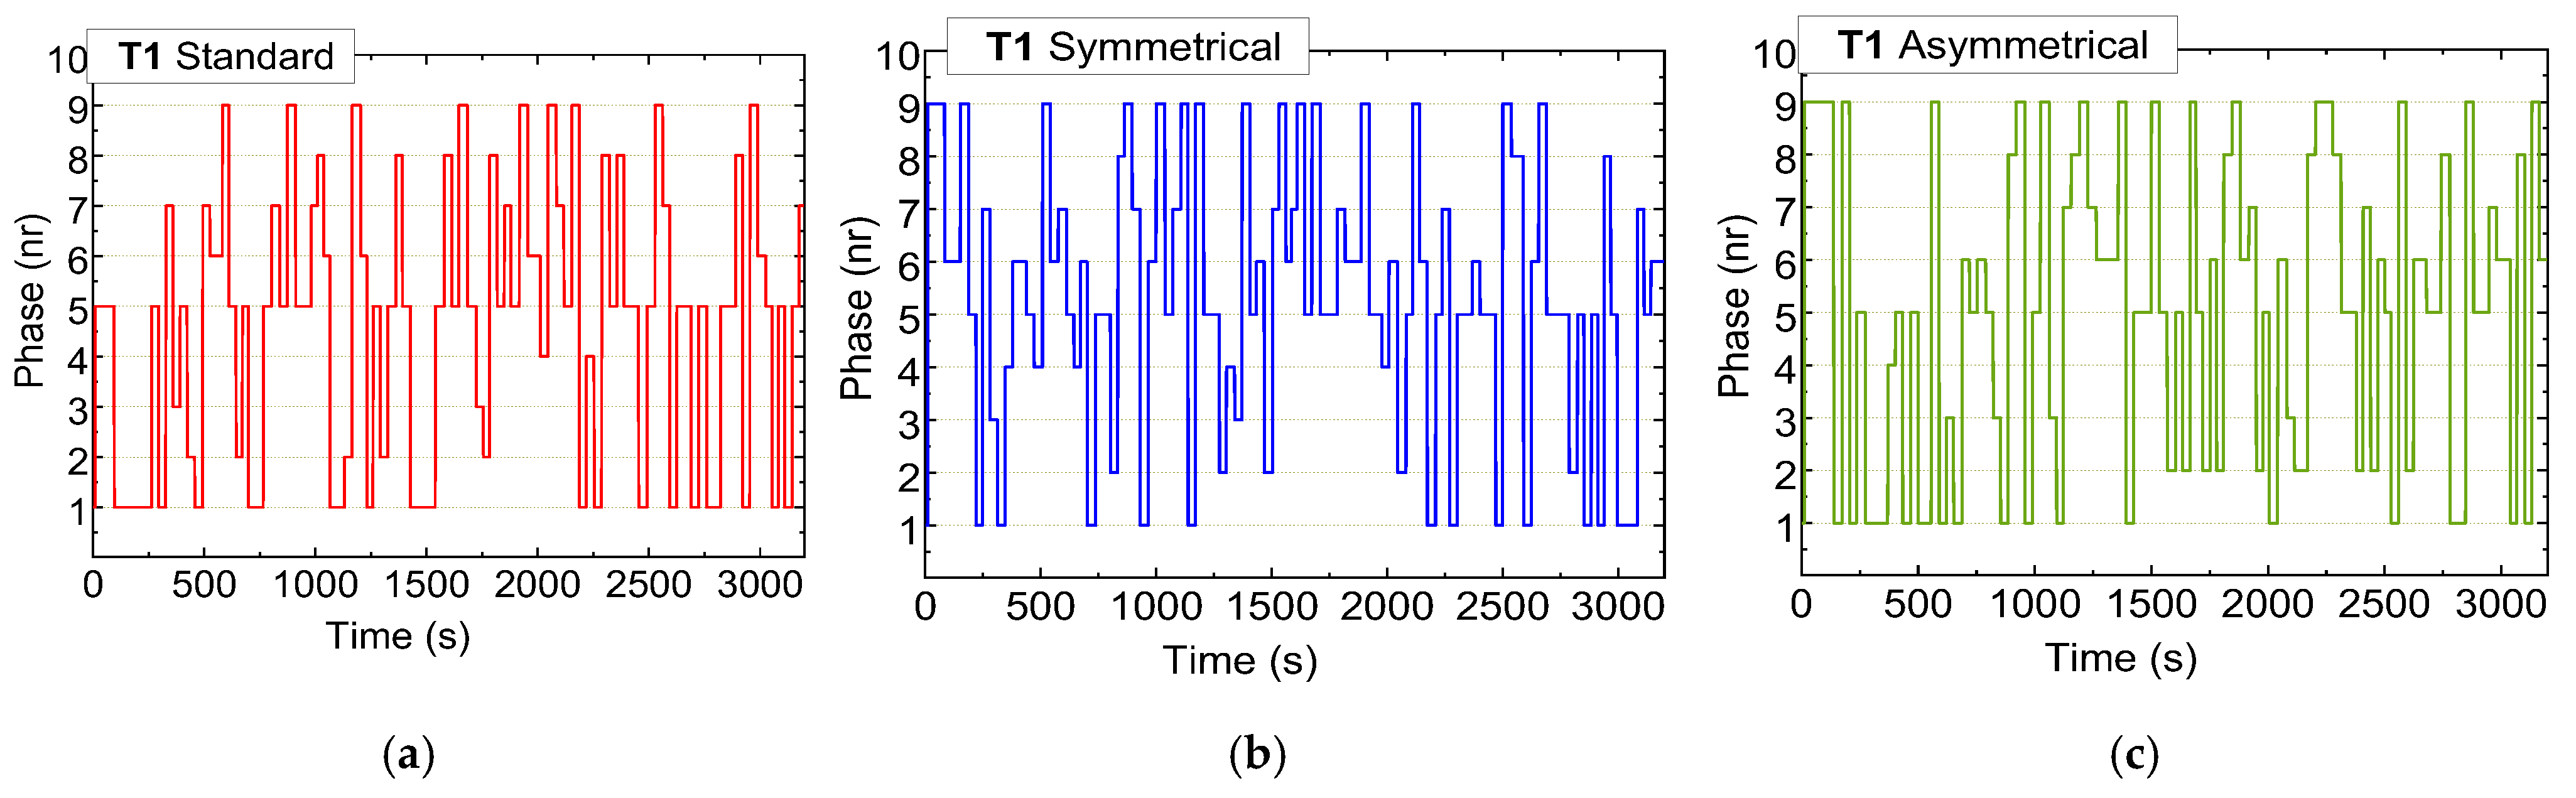
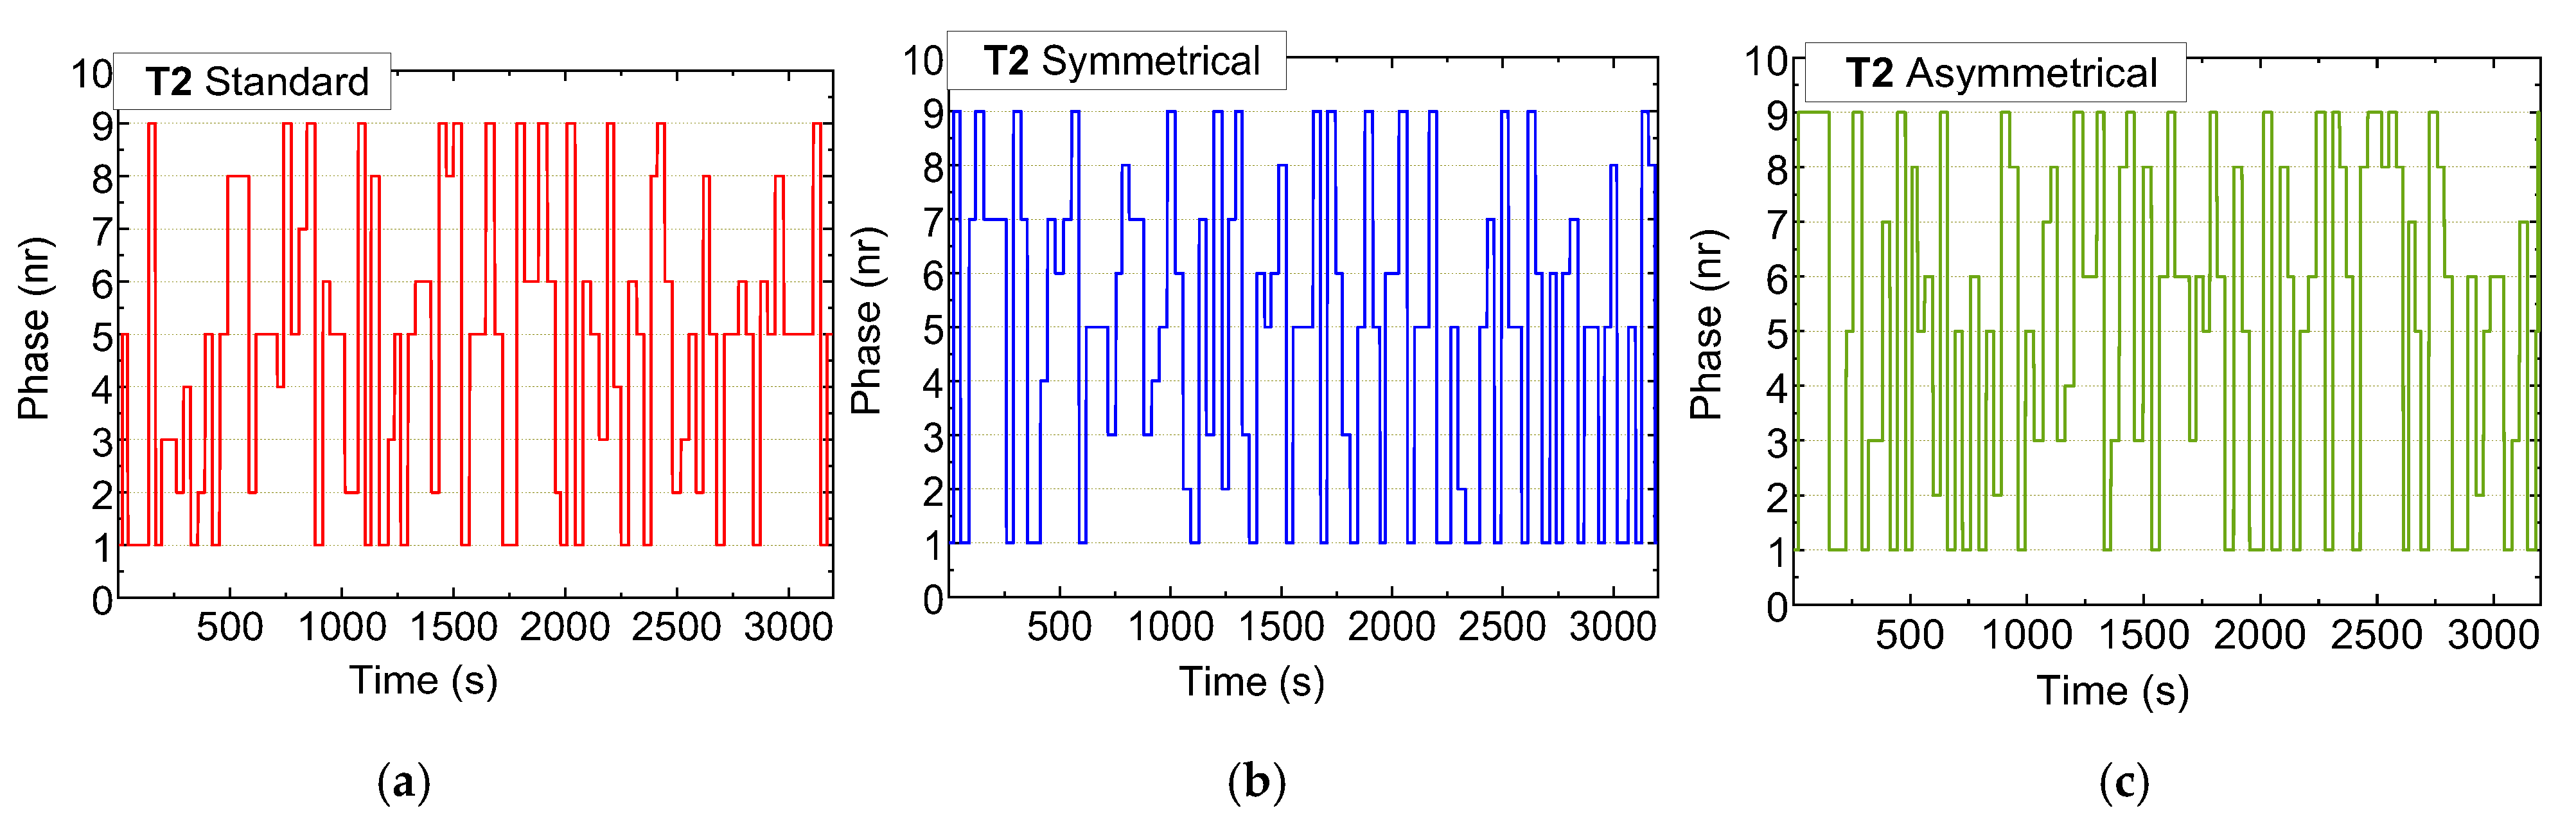
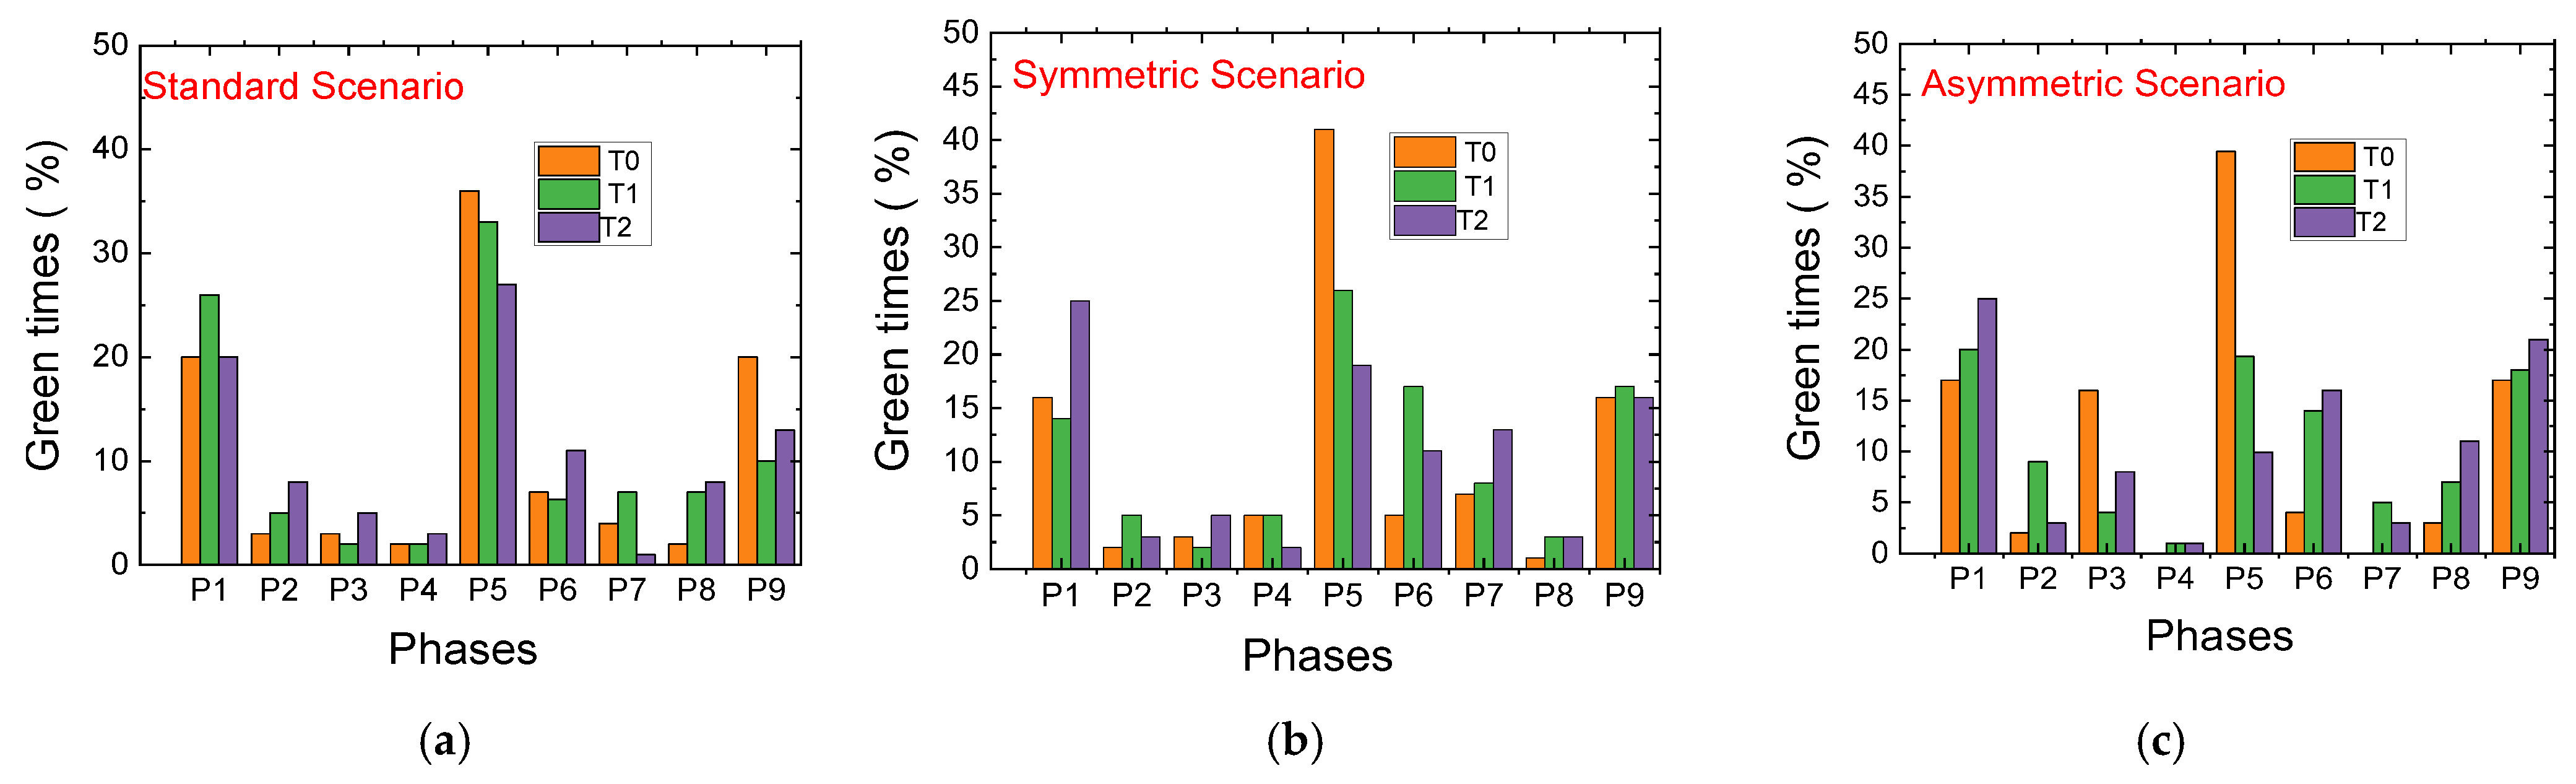
4.5. Comparative Analysis of Standard and Rerouting Scenarios: Activations and Traffic Management Strategies
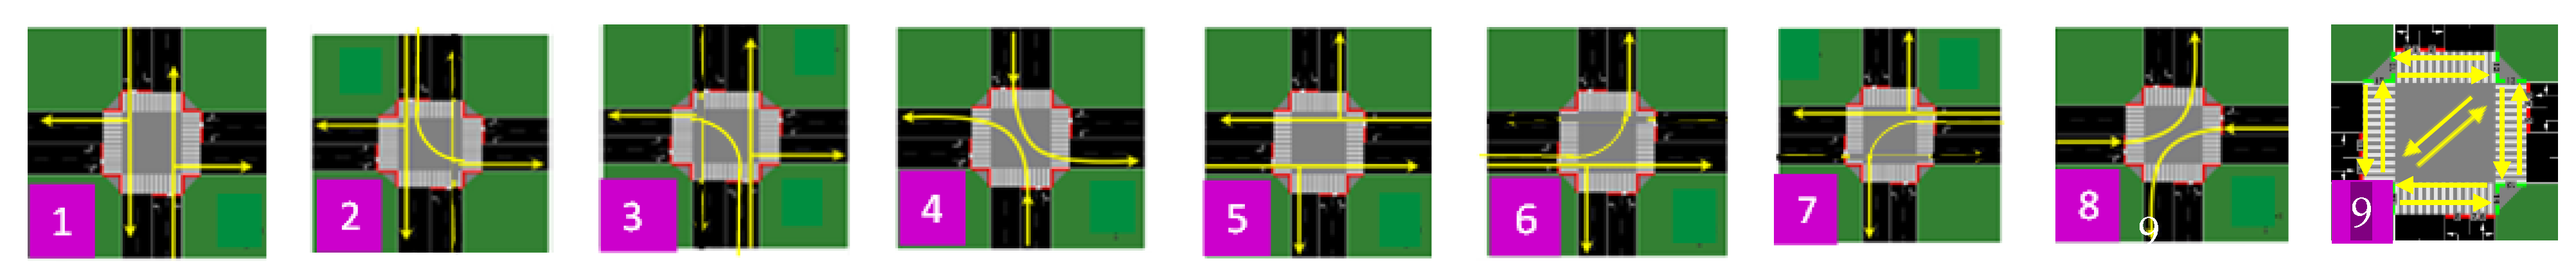
- Phase 1 (N-S): Traffic Flow Control
- Standard Scenario: Activated approximately 20% of the time, particularly increasing at Terminal T1 to prevent overload at Terminal T2.
- Rerouting Scenario: Displays a 5% reduction in activation at the first two terminals, while increasing activation at T2. This prioritization helps manage traffic flow along the critical 200 m stretch between T1 and T2, dynamically balancing traffic demands.
- Phase 5 (W-E): Vehicle Storage and Congestion Management
- Standard Scenario: Activated around 30% of the time, with T0 seeing the highest activation due to the larger 400 m stretch suitable for vehicle storage. Activation drops significantly at T1 and T2, where the shorter 200 m distance requires stricter congestion control.
- Symmetric Rerouting Scenario: Shows a 20% reduction in activation at T1 and T2, reflecting measures to limit vehicle flow to 15 vehicles on the shorter stretch. This highlights rerouting strategies that emphasize congestion management.
- Asymmetric Rerouting Scenario: Prioritizes E > W traffic. At T0, activation increases to 40%, efficiently clearing vehicles from the 400 m road. At T1 and T2, activation drops to 20% and 10%, reflecting greater caution to maintain the 15-vehicle limit on shorter roads.
- Phase P9: Pedestrian Flow Optimization
- Standard Scenario: Pedestrian phases are activated 10–20% of the time, with T0 having the highest rate at 20%, leading to higher pedestrian accumulation.
- Rerouting Scenarios: Pedestrian phase activation decreases at T0 and increases at other terminals, prioritizing vehicle flow while optimizing pedestrian navigation.
- Phase 6: Clearing Vehicles on 200 m Stretches
- Standard Scenario: Activated 13% of the time at T2 to maintain smooth traffic flow from the 400 m stretch.
- Rerouting Scenarios: Activation slightly increases at T1 and T2 through micro-control measures, reducing vehicle buildup and improving flow with rerouting strategies.
- Phase 7: Opposite Direction Traffic Management
- Symmetric Rerouting Scenario: Activation increases to complement rerouting strategies, ensuring balanced traffic flow across intersections and enhancing network-wide performance.
- Reduced congestion through micro-control and rerouting strategies.
- Balanced flow across intersections by prioritizing directions or redistributing traffic.
- Improved pedestrian flow optimization without sacrificing vehicle throughput.
- Enhanced management of shorter roads using vehicle limits and activation thresholds.
5. Adaptive Reward Mechanism with Horizontal and Vertical Shared Arteries and Pedestrian Integration
5.1. Environment Mapping
5.2. Environment Mapping Strategy
5.3. Adaptive Reward Mechanism
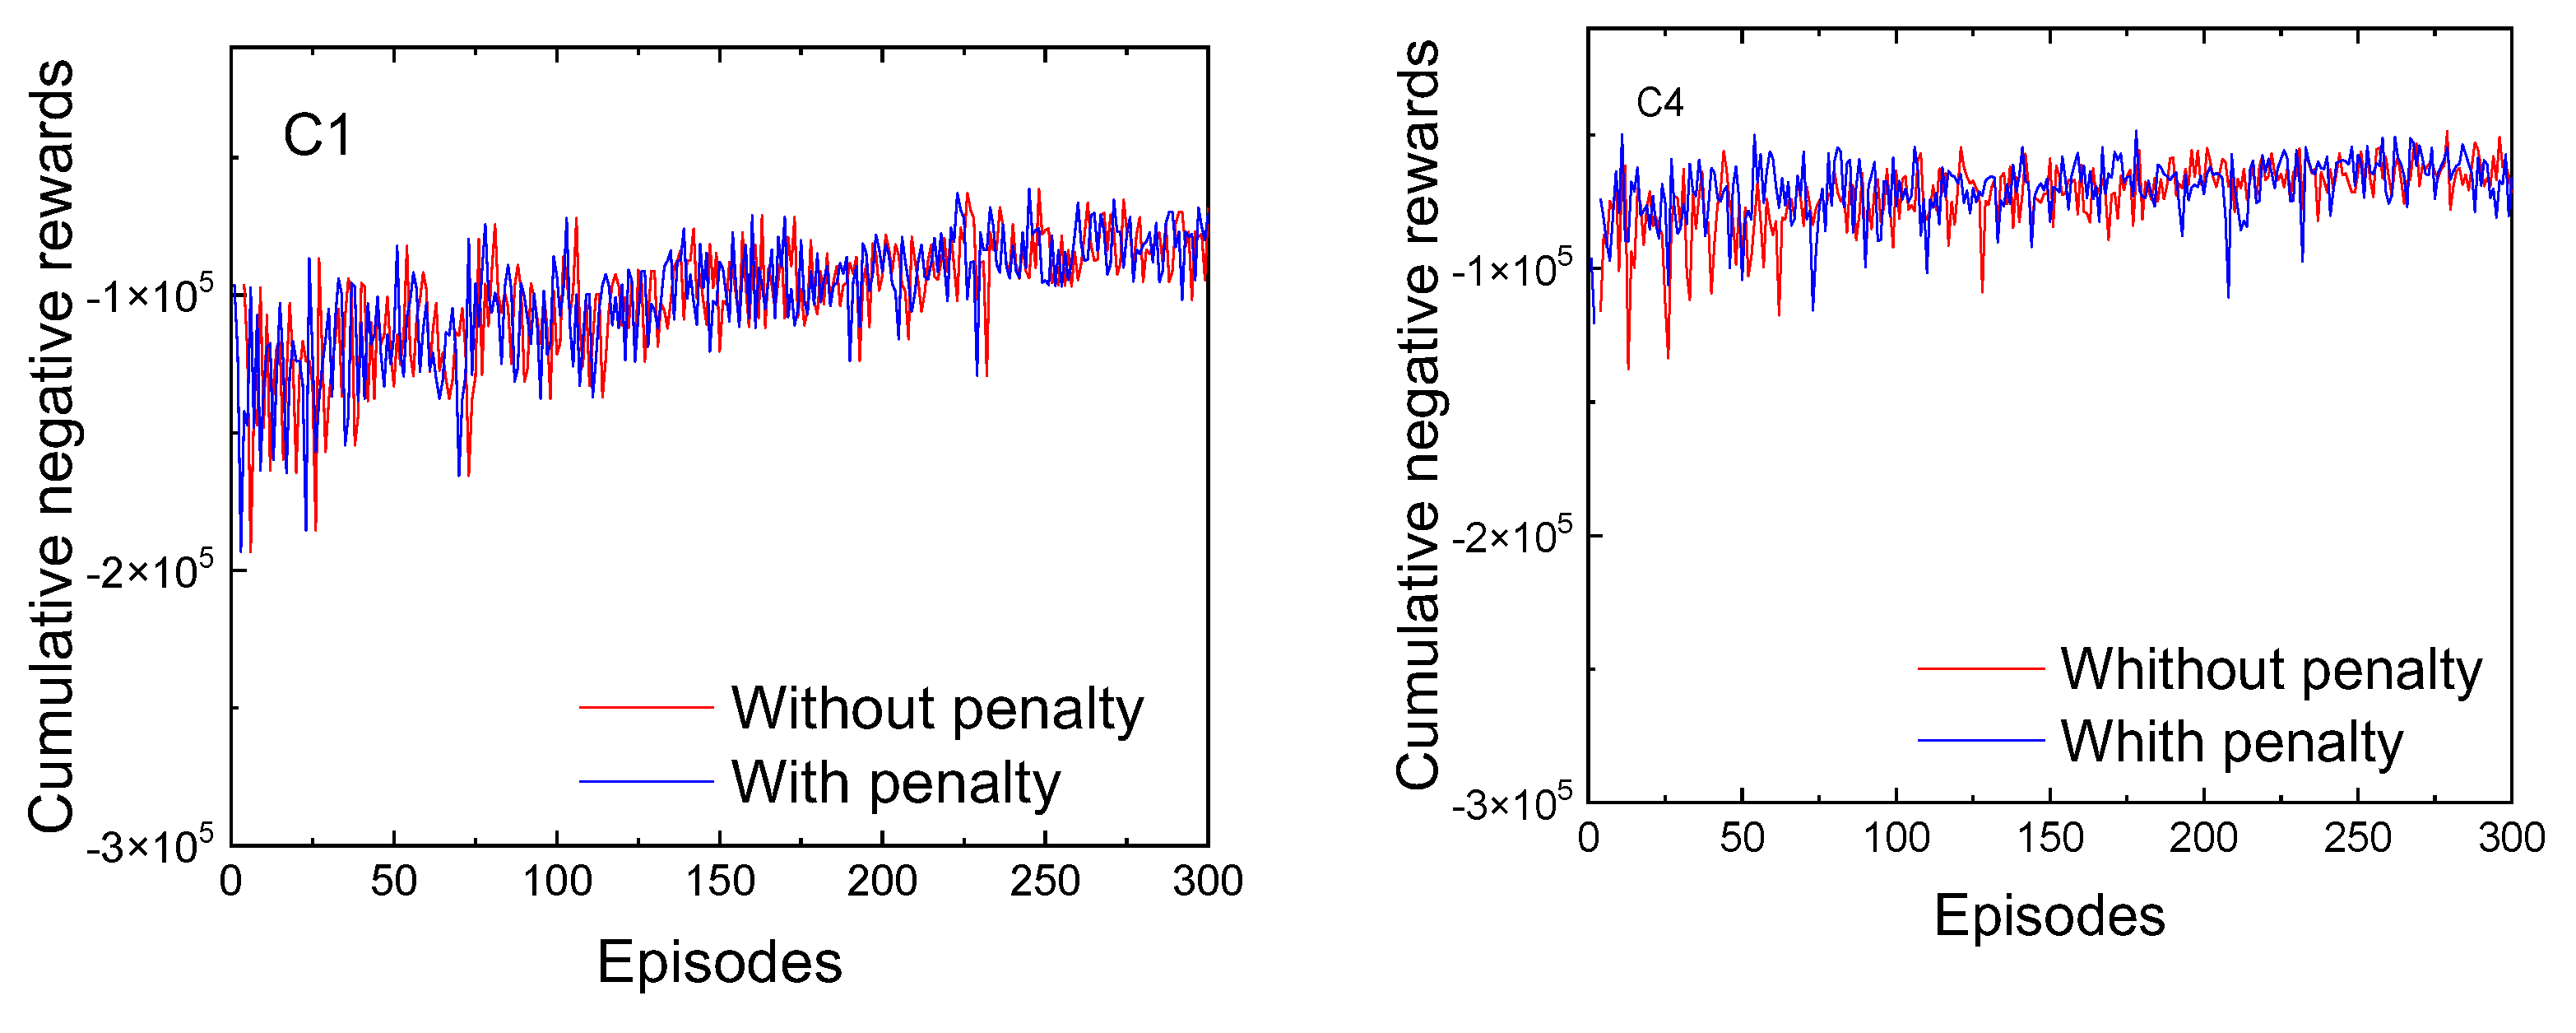
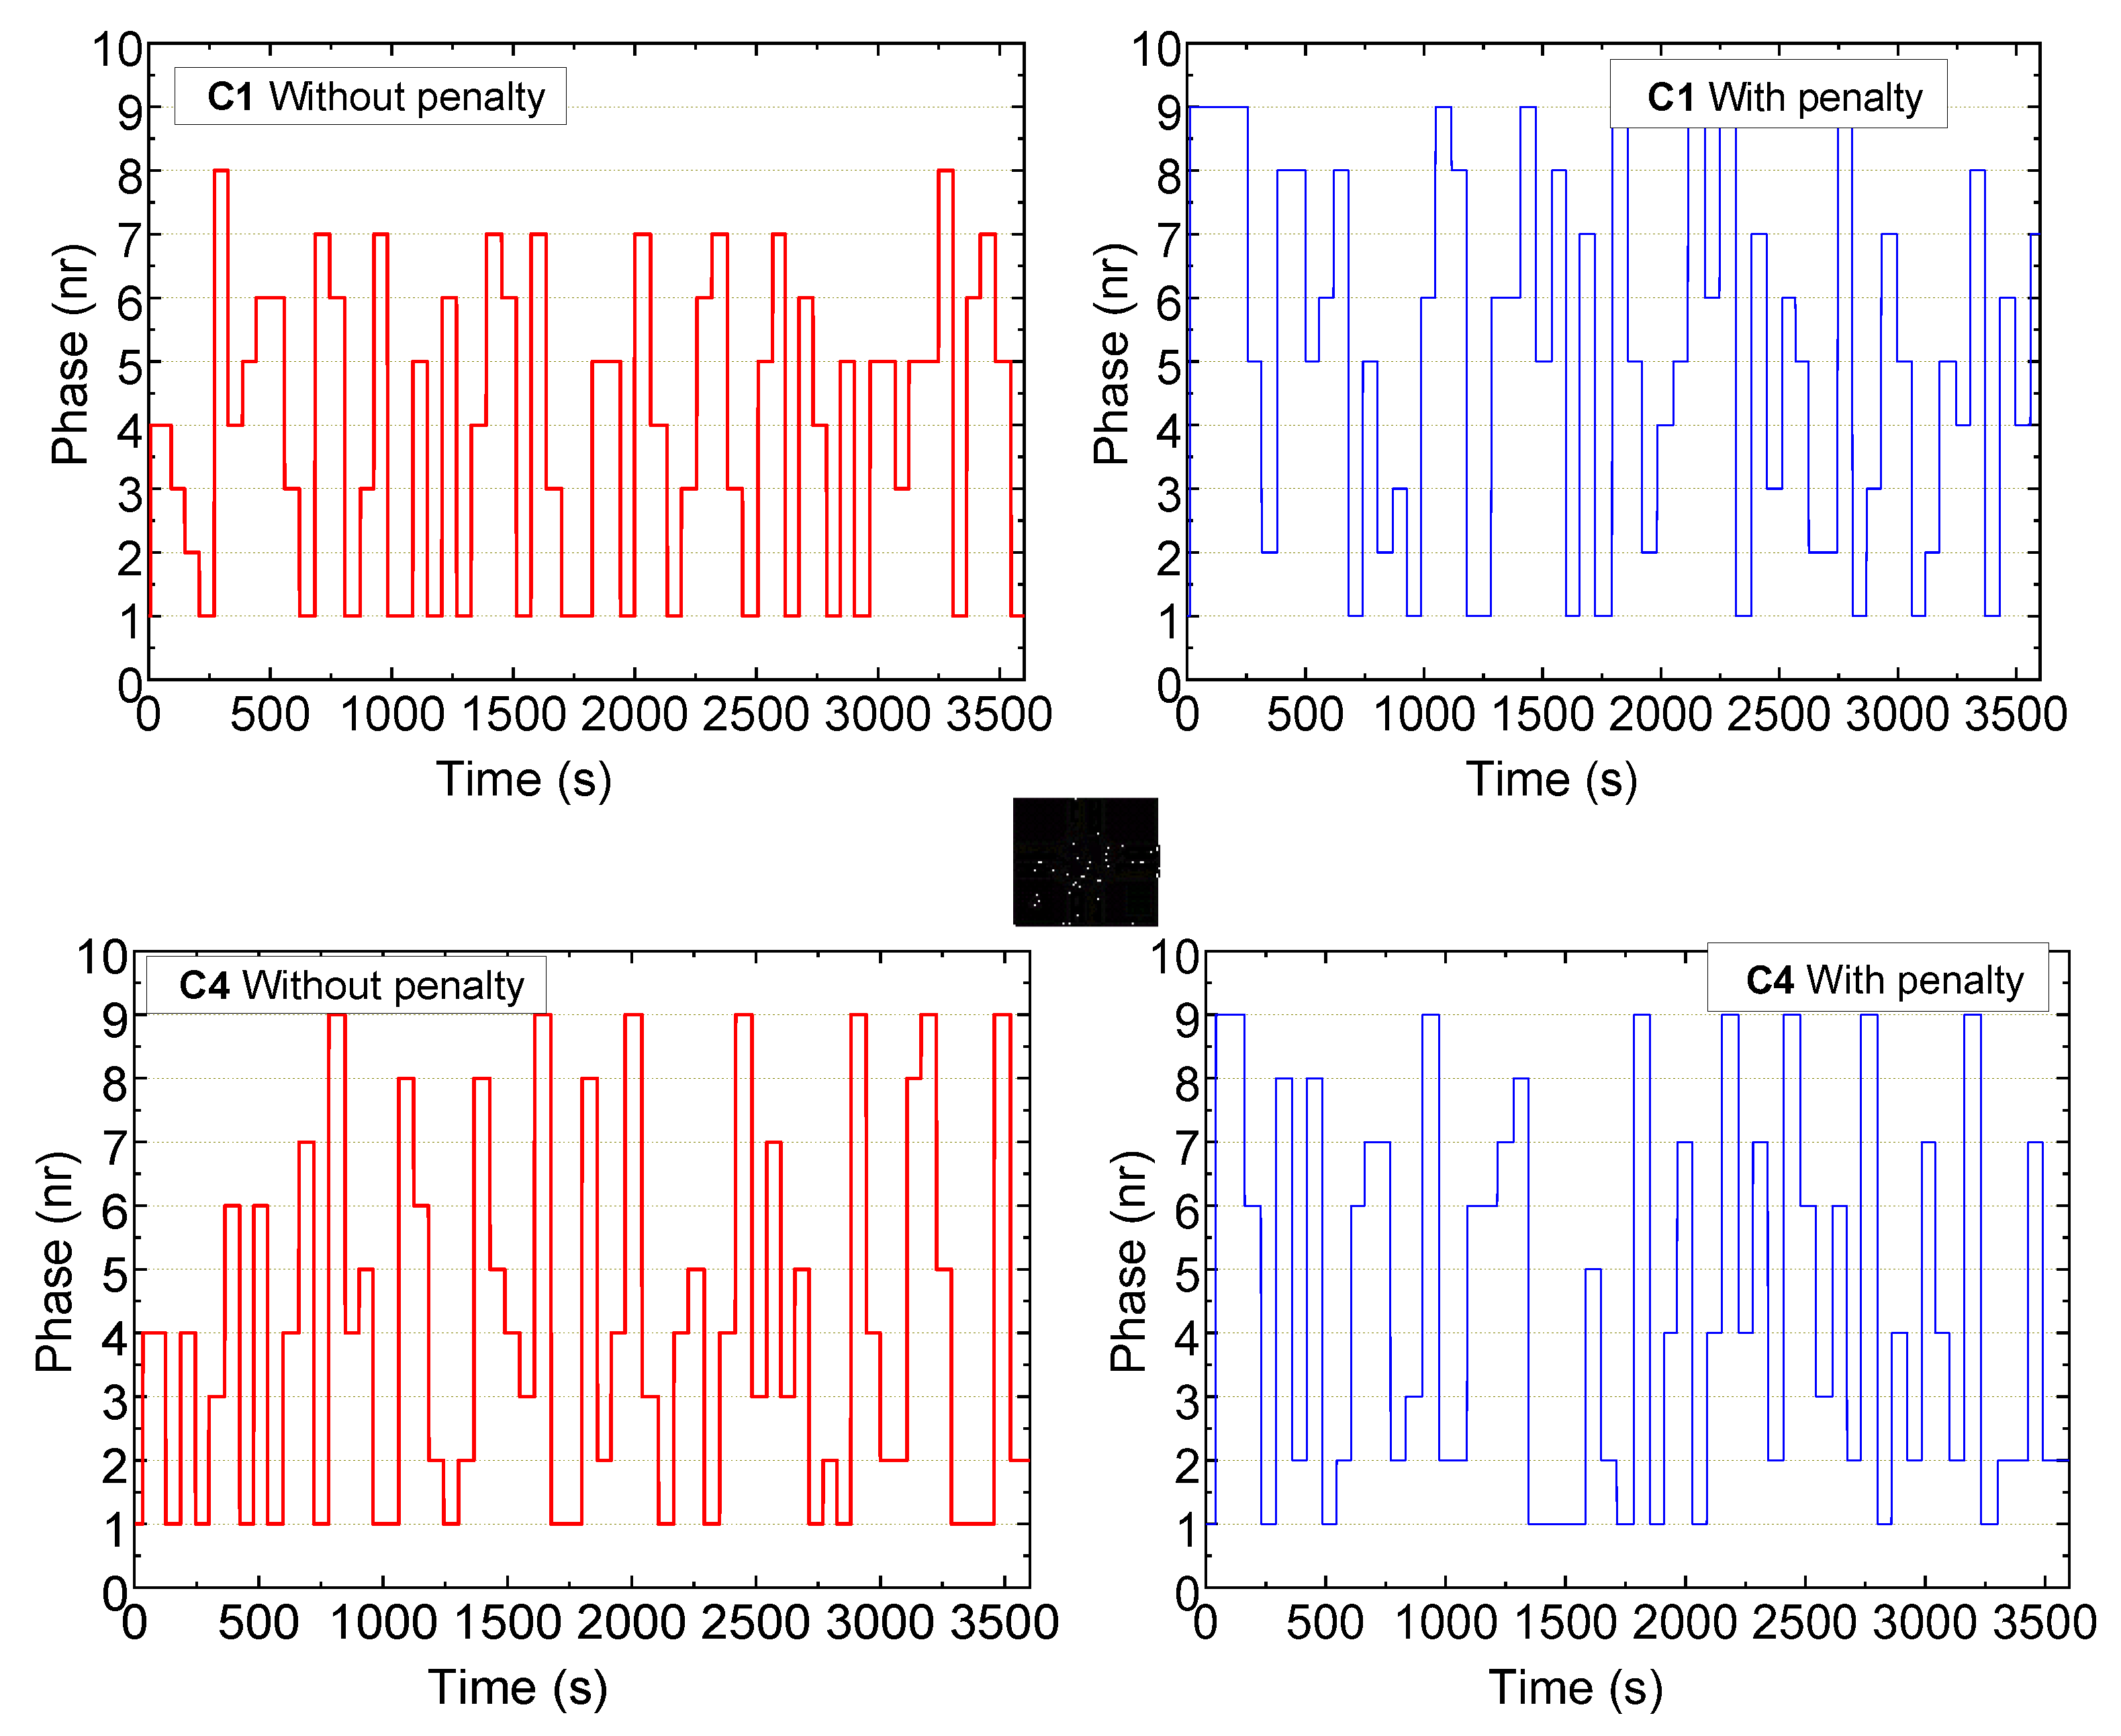
5.4. Performance Evaluation
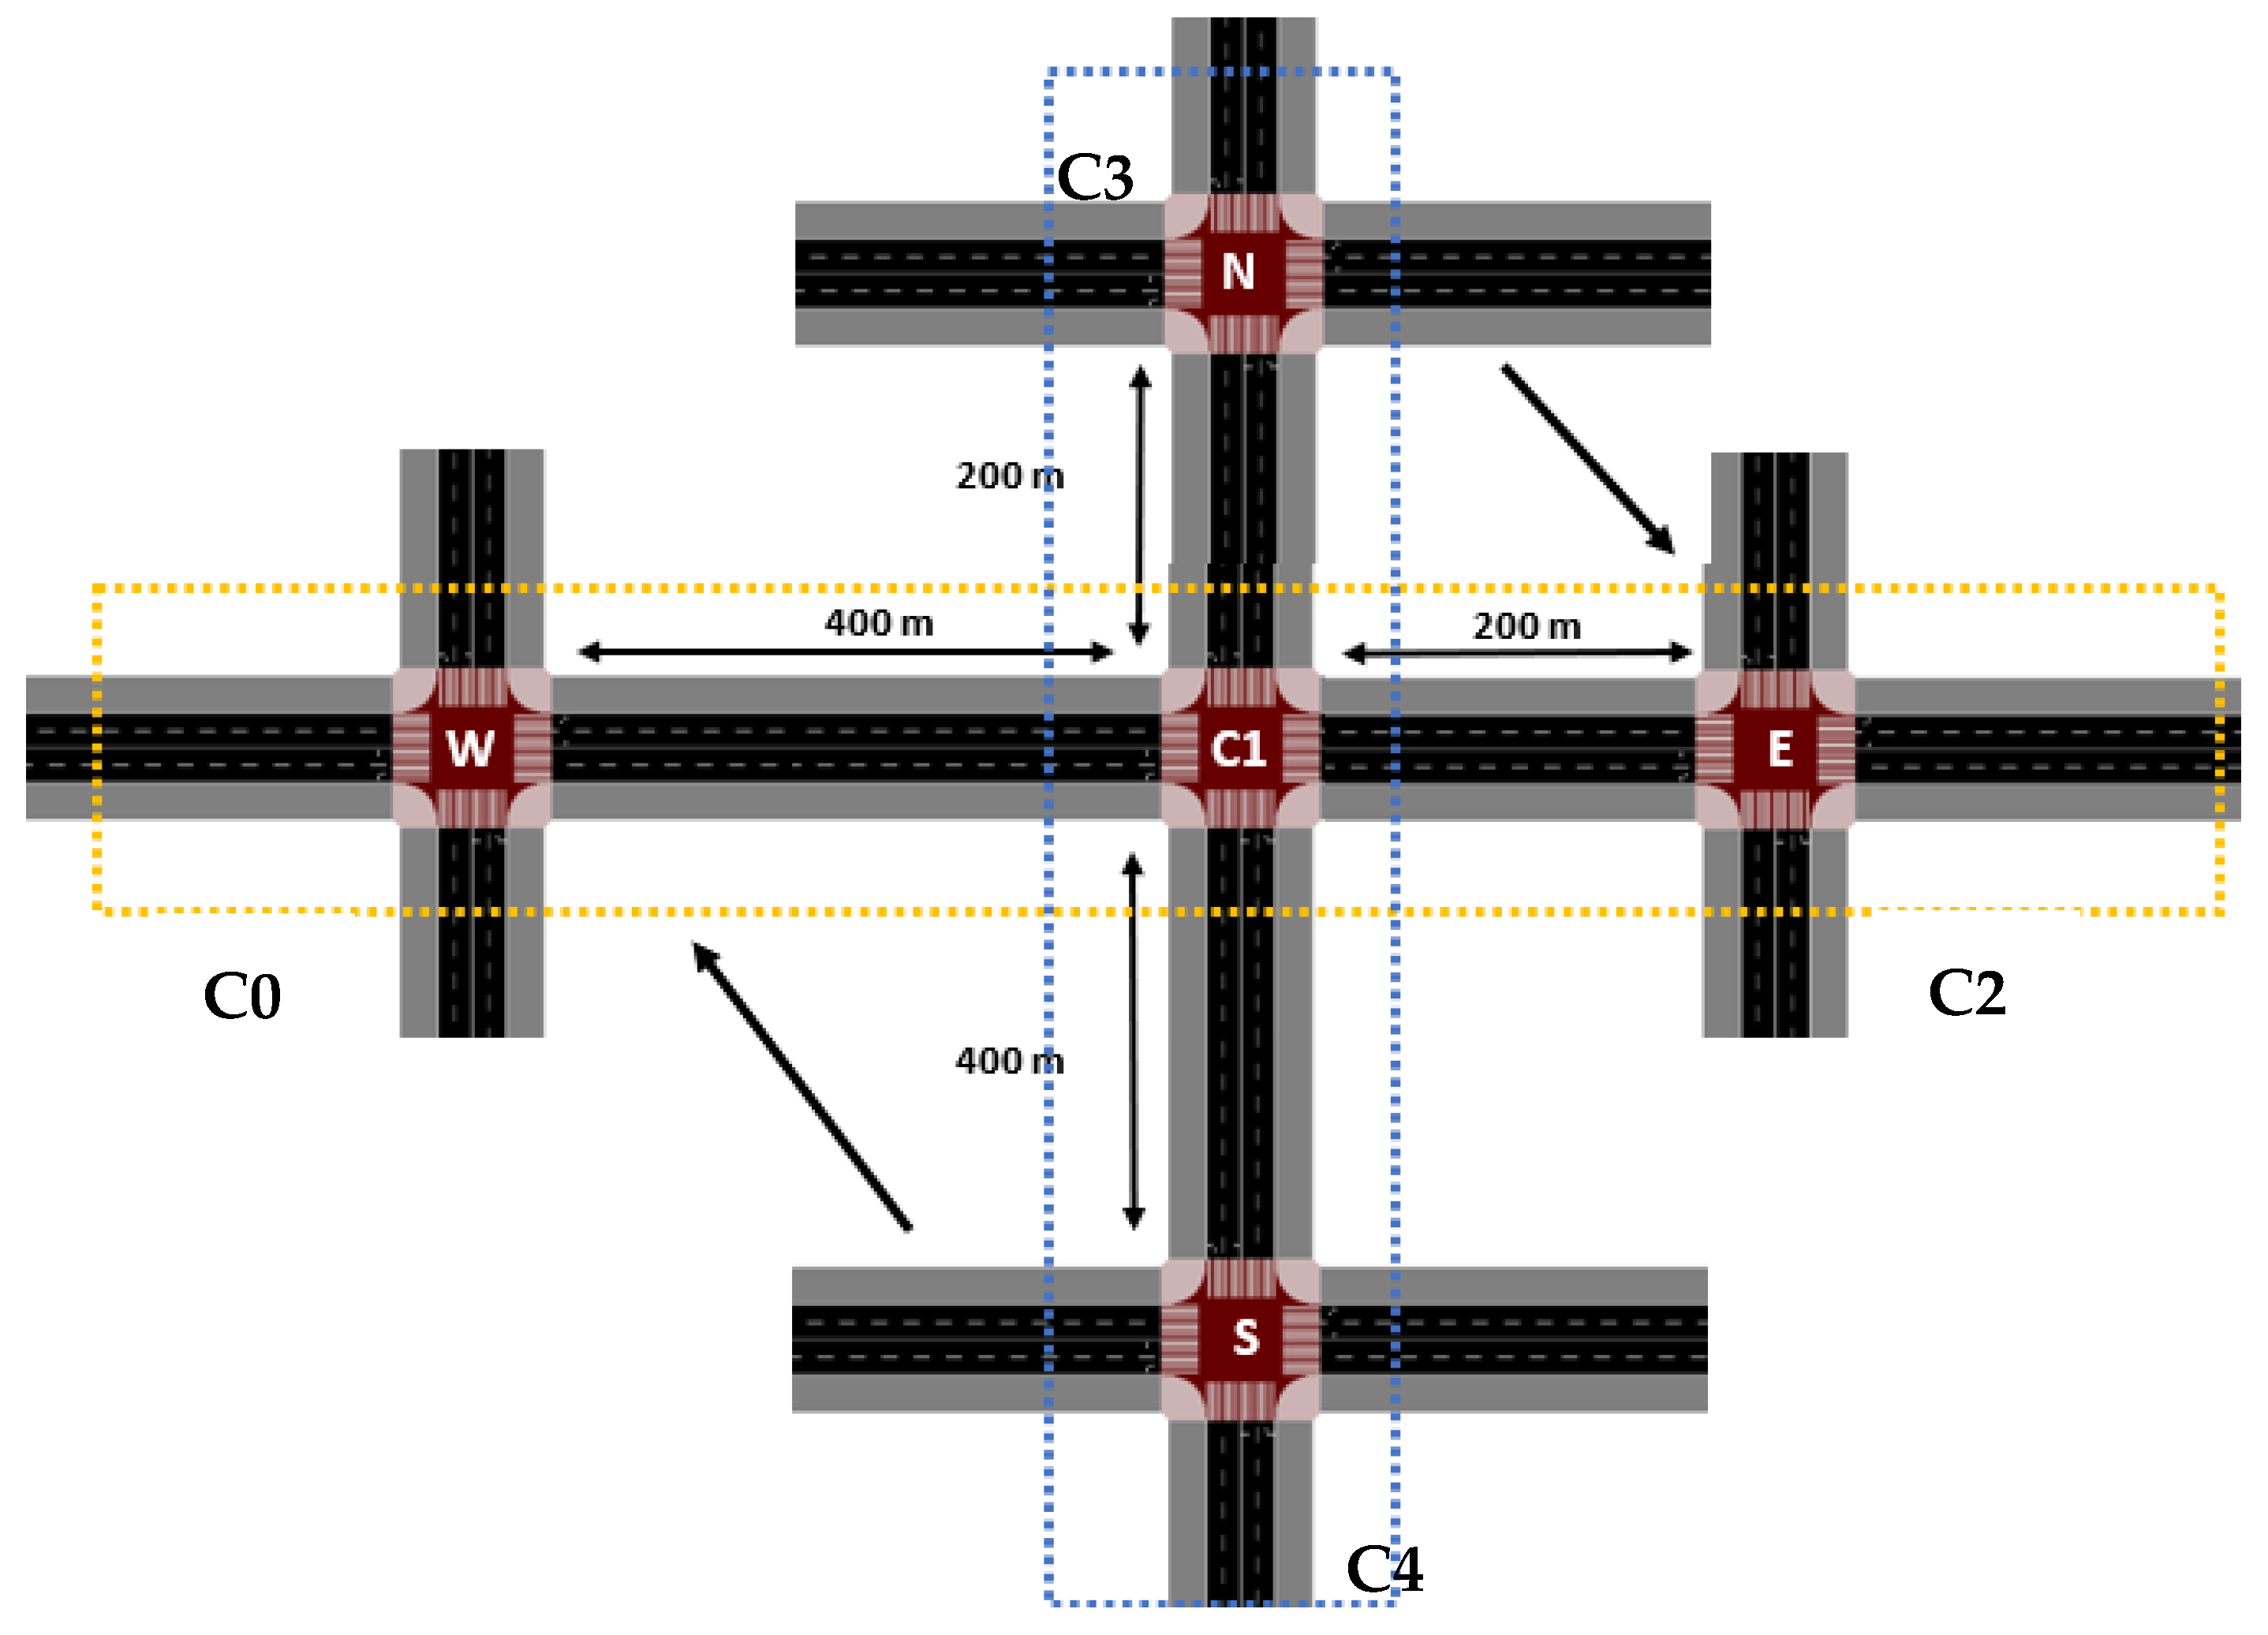
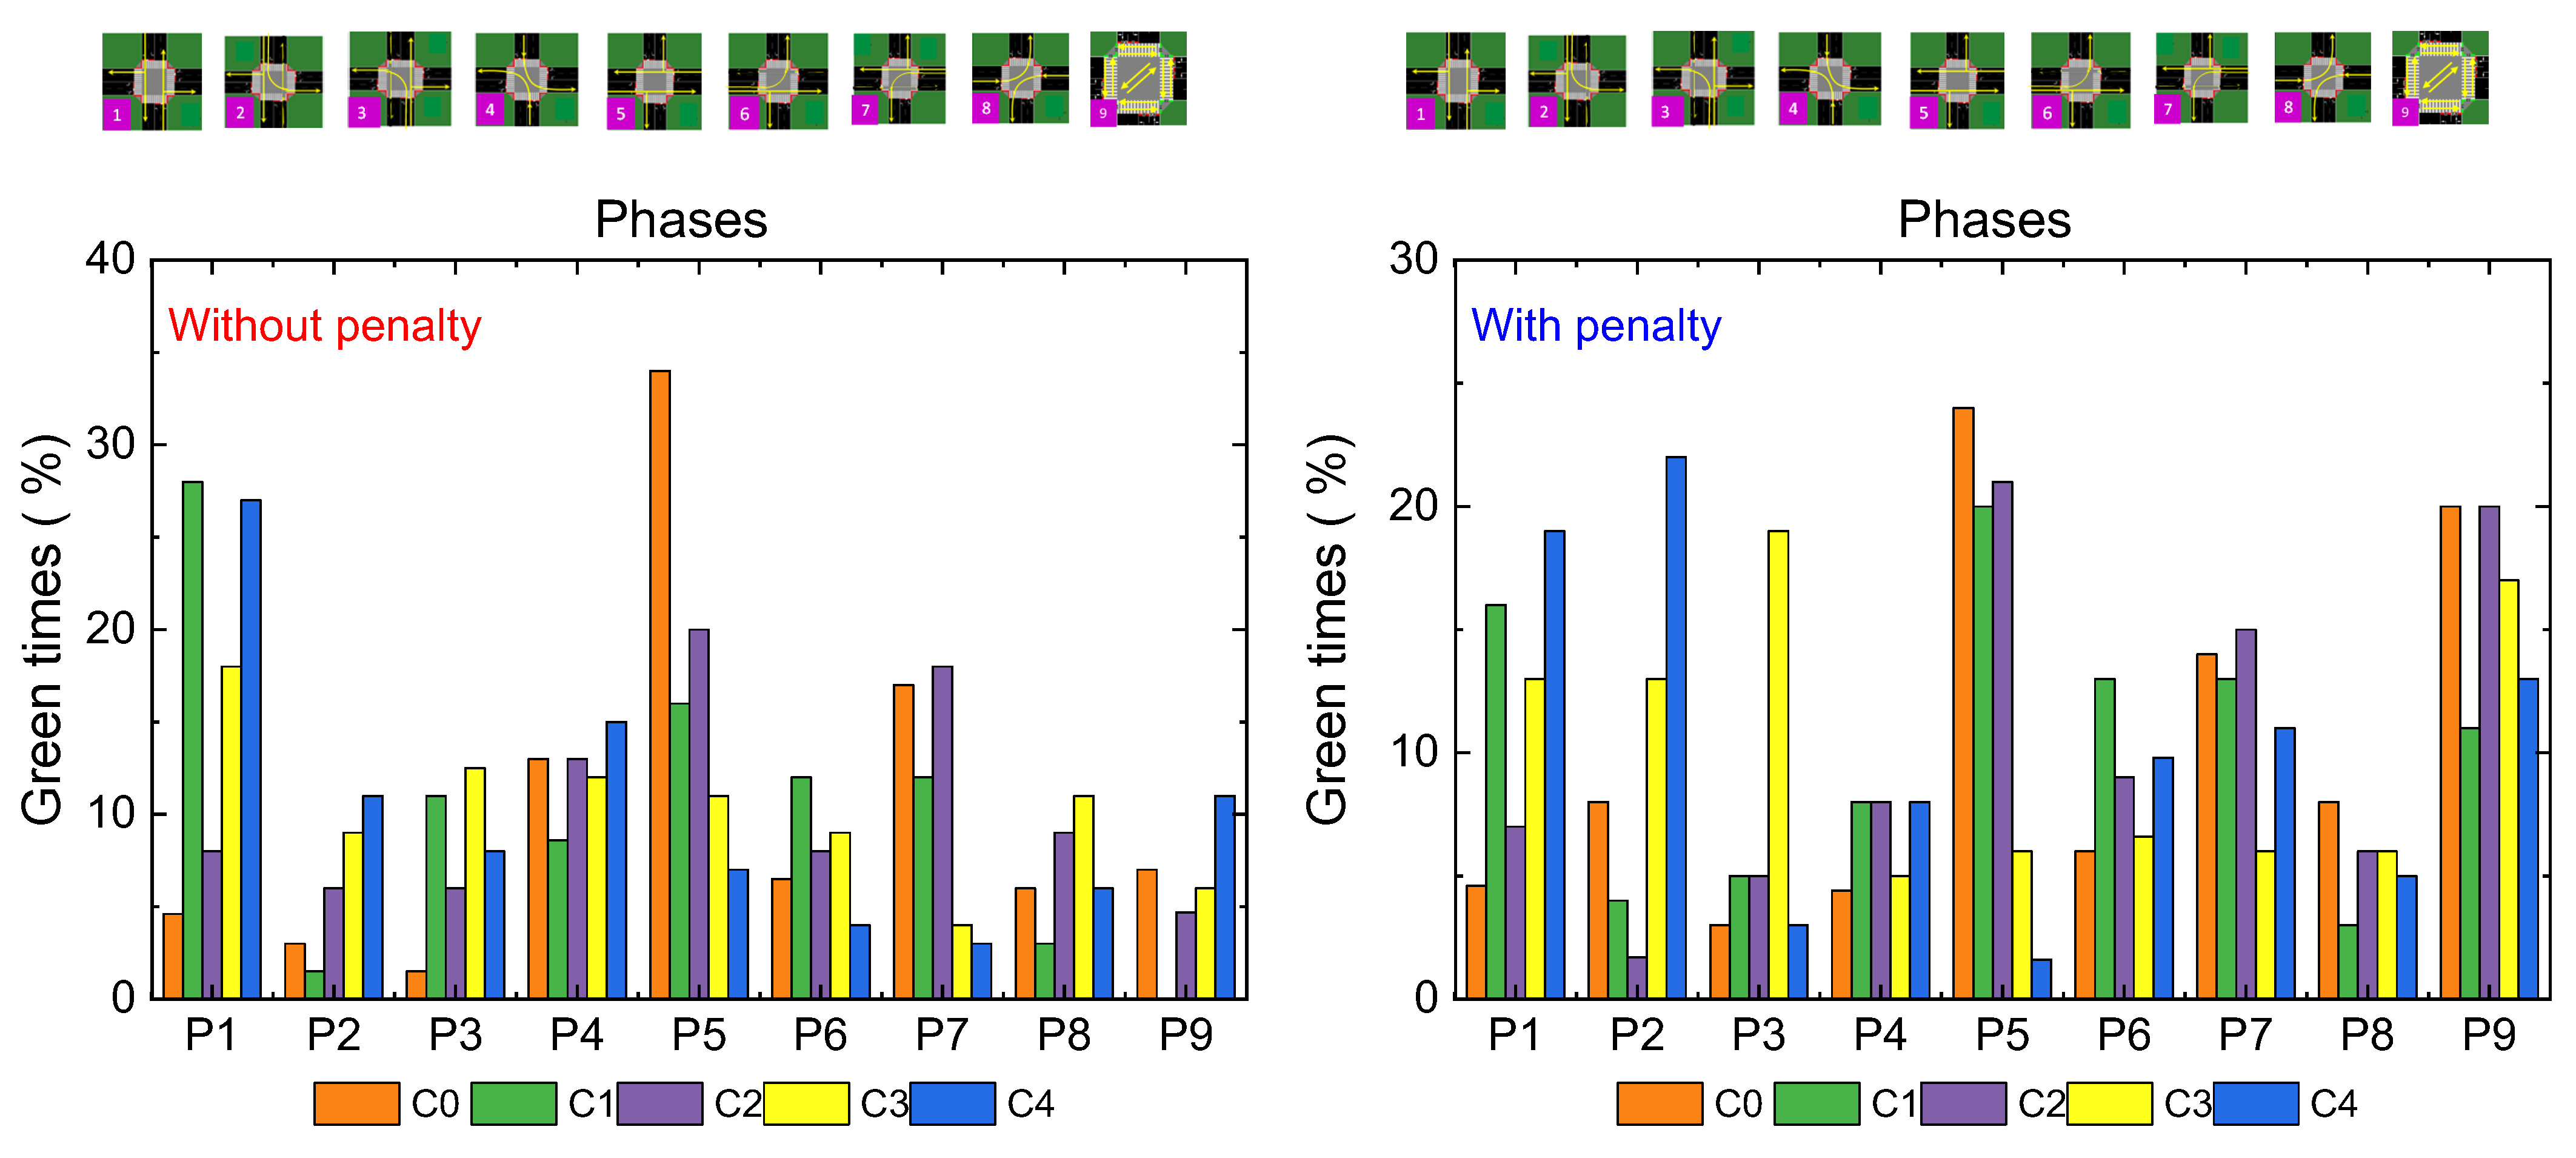
- Phase 1 (N-S): Traffic Flow Control
- Without penalization, Phase 1 shows high green time allocation, particularly at C1 (28%) and C4 (27%), indicating a strong emphasis on maintaining uninterrupted north–south vehicle flow.
- With penalization, there is a significant reduction in green time at C1 (from 28% to 16%) and at C4 (from 27% to 19%), which allowed for more balanced signal timing and increased allocation to pedestrian phases.
- At C0 and C3 (located 400 m from C1), green time for Phase 1 remains stable (~4.6%) in both scenarios, which is expected as these intersections primarily react to local traffic demand rather than being central nodes in the control logic.
- Phase 5 (W-E): Vehicle Storage and Congestion Management
- Without penalization, Phase 5 dominates green time at C0 (34%) and is substantial at C2 (20%), reflecting the need to handle side traffic and vehicle accumulation.
- With penalization, a marked decrease is observed in C0 (from 34% to 24%) and especially in C4 (from 7% to 1.6%), suggesting that this time was reallocated to address pedestrian traffic needs.
- Interestingly, at C1, Phase 5 increases from 16% to 20%, likely compensating for the increased activation of pedestrian phases by providing additional clearance time for transversal vehicle flow. This adjustment reflects the system’s ability to rebalance traffic dynamics under new constraints.
- Phase 6: Clearing Vehicles on 200-Meter Segments
- Without penalization, green time allocation ranges from 8% to 12%, with C1 at 12%, highlighting the need to maintain smooth transitions across short links.
- With penalization, green time in C1 slightly increases to 13% and remains stable in C2 (from 8% to 9%), confirming that even with a shift toward pedestrian prioritization, the system still ensures effective clearing of short-distance vehicle flows.
- This result reinforces that network responsiveness to short-segment congestion is preserved under the penalized reward scheme, avoiding traffic buildup in high-density zones.
- Phase 7: Opposite Direction Traffic Management
- Without penalization, Phase 7 maintains moderate but consistent green time allocation, particularly at C0 (17%), C1 (12%), and C2 (18%).
- With penalization, green time in C1 increases slightly to 13%, and remains solid in C2 (15%), reflecting the system’s capacity to adaptively maintain balanced flow in opposite directions.
- -
- Phase 1 and Phase 5 experience notable reductions, enabling more responsive pedestrian management.
- -
- Phase 6 and Phase 7 are maintained or slightly enhanced, ensuring no adverse impact on short-distance flow or bidirectional traffic control, particularly critical given the proximity of intersections (200–400 m).
5.5. Implications for Airport Environments
5.6. Main Challenges Expected During Real-World Deployment
- VLC Interference in High-Luminance Environments
- Installation Constraints in Large Terminal Spaces
- Real-Time Response Delays in Pedestrian–Vehicle Interactions
6. Conclusions and Future Work
Author Contributions
Funding
Institutional Review Board Statement
Data Availability Statement
Acknowledgments
Conflicts of Interest
References
- Yang, C.; Shao, H.R. WiFi-based indoor positioning. IEEE Commun. Mag. 2015, 53, 150–157. [Google Scholar] [CrossRef]
- Lin, X.Y.; Ho, T.W.; Fang, C.C.; Yen, Z.S.; Yang, B.J.; Lai, F. A mobile indoor positioning system based on iBeacon technology. In Proceedings of the 2015 37th Annual International Conference of the IEEE Engineering in Medicine and Biology Society (EMBC), Milan, Italy, 25–29 August 2015; pp. 4970–4973. [Google Scholar]
- Huang, C.H.; Lee, L.H.; Ho, C.C.; Wu, L.L.; Lai, Z.H. Real-time rfid indoor positioning system based on kalman filter drift removal and heron-bilateration location estimation. IEEE Trans. Instrum. Meas. 2015, 64, 728–739. [Google Scholar] [CrossRef]
- Hassan, N.U.; Naeem, A.; Pasha, M.A.; Jadoon, T.; Yuen, C. Indoor positioning using visible led lights: A survey. ACM Comput. Surv. 2015, 48, 1–32. [Google Scholar] [CrossRef]
- Harle, R. A survey of indoor inertial positioning systems for pedestrians. Commun. Surv. IEEE Commun. Surveys Tuts. 2013, 15, 1281–1293. [Google Scholar] [CrossRef]
- Liu, M.; Siegwart, R. Dp-fact: Towards topological mapping and scene recognition with color for omnidirectional camera. in Robotics and Automation (ICRA). In Proceedings of the 2012 IEEE International Conference on Robotics and Automation, Saint Paul, MN, USA, 14–18 May 2012; pp. 3503–3508. [Google Scholar]
- Vieira, M.; Vieira, M.A.; Galvão, G.; Louro, P.; Vieira, P.; Fantoni, A. Optimizing Indoor Airport Navigation with Advanced Visible Light Communication Systems. Sensors 2024, 24, 5445. [Google Scholar] [CrossRef]
- Cherubini, A.; Chaumette, F. A redundancy-based approach for obsta-cle avoidance in mobile robot navigation. In Proceedings of the 2010 IEEE/RSJ International Conference on Intelligent Robots and Systems, Taipei, Taiwan, 18–22 October 2010; pp. 5700–5705. [Google Scholar]
- Vieira, M.; Vieira, M.A.; Louro Vieira, P. Light-emitting diodes aided indoor localization using visible light communication technology. Opt. Eng. 2018, 57, 087105. [Google Scholar] [CrossRef]
- Oh, S.H.; Kim, J.G. Indoor Positioning by Double Deep Q-Network in VLC-Based Empty Office Environment. Appl. Sci. 2024, 14, 3684. [Google Scholar] [CrossRef]
- Affan, A.; Asif, H.M.; Tarhuni, N. Machine-Learning-Based Indoor Localization under Shadowing Condition for P-NOMA VLC Systems. Sensors 2023, 23, 5319. [Google Scholar] [CrossRef]
- Abdalmajeed, A.M.M.; Mahmoud, M.; El-Fikky, A.E.R.A.; Fayed, H.A.; Aly, M.H. Improved Indoor Visible Light Positioning System Using Machine Learning. Opt. Quant. Electron. 2023, 55, 209. [Google Scholar] [CrossRef]
- Ozgur, E.; Dinc, E.; Akan, O.B. Communicate to illuminate: State-of-the-art and research challenges for visible light communications. Phys. Commun. 2015, 17, 72–85. [Google Scholar]
- Panta, K.; Armstrong, J. Indoor localisation using white LEDs. Electron. Lett. 2012, 48, 228–230. [Google Scholar] [CrossRef]
- Komiyama, T.; Kobayashi, K.; Watanabe, K.; Ohkubo, T.; Kurihara, Y. Study of visible light communication system using RGB LED lights. In Proceedings of the SICE Annual Conference, Tokyo, Japan, 13–18 September 2011; pp. 1926–1928. [Google Scholar]
- Wang, Y.; Wang, Y.; Chi, N.; Yu, J.; Shang, H. Demonstration of 575-Mb/s downlink and 225-Mb/s uplink bi-directional SCM-WDM visible light communication using RGB LED and phosphor-based LED. Opt. Express 2013, 21, 1203–1208. [Google Scholar] [CrossRef] [PubMed]
- Tsonev, D.; Chun, H.; Rajbhandari, S.; McKendry, J.; Videv, S.; Gu, E.; Haji, M.; Watson, S.; Kelly, A.; Faulkner, G.; et al. A 3-Gb/s single-LED OFDM-based wireless VLC link using a Gallium Nitride μLED. IEEE Photon. Technol. Lett. 2014, 26, 637–640. [Google Scholar] [CrossRef]
- O’Brien, D.; Minh, H.L.; Zeng, L.; Faulkner, G.; Lee, K.; Jung, D.; Oh, Y.; Won, E.T. Indoor visible light communications: Challenges and prospects. Proc. SPIE 2008, 7091, 709106. [Google Scholar]
- Monteiro, E.; Hranilovic, S. Constellation design for color-shift keying using interior point methods. In Proceedings of the 2012 IEEE Globecom Workshops, Anaheim, CA, USA, 3–7 December 2012; pp. 1224–1228. [Google Scholar]
- Vieira, M.A.; Louro, P.; Vieira, M.; Fantoni, A.; Steiger-Garção, A. Light-activated amplification in Si-Ctandem devices: Acapacitive active filter model. IEEE Sens. J. 2012, 12, 1755–1762. [Google Scholar] [CrossRef]
- Jovicic, A.; Li, J.; Richardson, T. Visible light communication: Opportunities, challenges and the path to market. Commun. Mag. 2013, 51, 26–32. [Google Scholar] [CrossRef]
- Vieira, M.A.; Vieira, M.; Louro, P.; Vieira, P.; Fantoni, A. Vehicular Visible Light Communication for Intersection Management. Signals 2023, 4, 457–477. [Google Scholar] [CrossRef]
- Zhou, J.; Luo, Y.; Zhu, H. Deep reinforcement learning-enabled secure visible light communication against eavesdropping. IEEE Access 2019, 7, 103292–103301. [Google Scholar] [CrossRef]
- Chen, C.; Shen, X.; Jiang, C. Deep reinforcement learning-based adaptive handover mechanism for hybrid VLC and RF networks. IEEE Trans. Wirel. Commun. 2021, 20, 7358–7371. [Google Scholar] [CrossRef]
- Kolat, M.; Kővári, B.; Bécsi, T.; Aradi, S. Multi-Agent Reinforcement Learning for Traffic Signal Control: A Cooperative Approach. Sustainability 2023, 15, 3479. [Google Scholar] [CrossRef]
- Kwon, M.; ElSayed-Aly, I.; Feng, L. Adaptive Reward Design for Reinforcement Learning in Complex Robotic Tasks. arXiv 2024, arXiv:2412.10917. [Google Scholar]
- Rahman, M.M.; Kaiser, M.S. Adaptive reward-based deep reinforcement learning for energy-efficient UAV navigation. Sensors 2020, 20, 6251. [Google Scholar] [CrossRef]
- Prashanth, L.; Bhatnagar, S. Reinforcement learning with average cost for adaptive control of traffic lights at intersections. In Proceedings of the 2011 14th International IEEE Conference on Intelligent Transportation Systems (ITSC), Washington, DC, USA, 5–7 October 2011; pp. 1640–1645. [Google Scholar] [CrossRef]
- Ma, H.; Sima, K.; Vo, T.V.; Fu, D.; Leong, T. Reward Shaping for Reinforcement Learning with An Assistant Reward Agent. In Proceedings of the 41st International Conference on Machine Learning Research, Vienna, Austria, 21–27 July 2024; Volume 235, pp. 33925–33939. Available online: https://proceedings.mlr.press/v235/ma24l.html (accessed on 15 March 2025).
- Vieira, M.A.; Galvão, G.; Vieira, M.; Louro, P.; Vestias, M.; Vieira, P. Enhancing Urban Intersection Efficiency: Visible Light Communication and Learning-Based Control for Traffic Signal Optimization and Vehicle Management. Symmetry 2024, 16, 240. [Google Scholar] [CrossRef]
- Young, S.B. Evaluation of Pedestrian Walking Speeds in Airport Terminals. Transp. Res. Rec. 1999, 1674, 20–26. [Google Scholar] [CrossRef]
- Alam, M.D.J.; Habib, M.A.; Holmes, D. Pedestrian movement simulation for an airport considering social distancing strategy. Transp. Res. Interdiscip. Perspect. 2022, 13, 100527. [Google Scholar] [CrossRef]
- Fauzan, A.; Mazlina, A.; Majid, M.A.; Allegra, M. A Review on Human Pedestrian Movement System Using Agent-Based Simulation and Discrete Event Simulation. J. Comput. Theor. Nanosci. 2018, 24, 7290–7294. [Google Scholar] [CrossRef]
- Kim, D.; Quaini, A. A 2D kinetic model for crowd dynamics with disease contagion. arXiv 2021, arXiv:2107.11401, 11401. [Google Scholar]
- Zhu, F.; Lv, Y.; Chen, Y.; Wang, X.; Xiong, G.; Wang, F.-Y. Parallel transportation systems: Toward IoT-enabled smart urban traffic control and management. IEEE Trans. Intell. Transp. Syst. 2020, 21, 4063–4071. [Google Scholar] [CrossRef]
- Vieira, M.; Vieira, M.A.; Galvão, G.; Louro, P.; Véstias, M.; Vieira, P. Enhancing Urban Intersection Efficiency: Utilizing Visible Light Communication and Learning-Driven Control for Improved Traffic Signal Performance. Vehicles 2024, 6, 666–692. [Google Scholar] [CrossRef]
- Tampuu, A.; Matiisen, T.; Kodelja, D.; Kuzovkin, I.; Korjus, K.; Aru, J.; Aru, J.; Vicente, R. Multiagent cooperation and competition with deep reinforcement learning. PLoS ONE 2017, 12, e0172395. [Google Scholar] [CrossRef]
- Foerster, J.N.; Assael, Y.M.; de Freitas, N.; Whiteson, S. Learning to communicate with deep multi-agent reinforcement learning. Adv. Neural Inf. Process. Syst. 2016, 29, 2137–2145. [Google Scholar]
- Oroojlooyjadid, A.; Hajinezhad, D. A review of cooperative multi-agent deep reinforcement learning. Appl. Intell. 2022, 53, 1–46. [Google Scholar] [CrossRef]
- Vieira, M.; Vieira, M.A.; Galvão, G.; Louro, P.; Vieira, P.; Fantoni, A. Enhancing Indoor Navigation in Multi-Terminal Airports through Visible Light Communication Signals. In Proceedings of the SPIE 12999, Optical Sensing and Detection VIII, 129991N, Strasbourg, France, 7–12 April 2024. [Google Scholar] [CrossRef]
- Alvarez Lopez, P.; Behrisch, M.; Bieker-Walz, L.; Erdmann, J.; Flötteröd, Y.-P.; Robert Hilbrich, R. Microscopic Traffic Simulation using SUMO. In Proceedings of the 21st IEEE International Conference on Intelligent Transportation Systems, Maui, HI, USA, 4–7 November 2018; pp. 2575–2582. [Google Scholar]
- Reza, S.; Ferreira, M.C.; Machado, J.J.M.; Tavares, J.M.R.S. A citywide TD-learning based intelligent traffic signal control for autonomous vehicles: Performance evaluation using SUMO. Expert Systems 2025, 42, e13301. [Google Scholar] [CrossRef]
- Chai, R.; Hou, Y.; Fu, B.; He, Y. Simulation Modeling of Typical Urban Traffic Congestion Areas Based on SUMO. In Proceedings of the 2023 6th International Conference on Information Communication and Signal Processing (ICICSP), Xi’an, China, 23–25 September 2023; pp. 853–859. [Google Scholar] [CrossRef]
- Ahmed, M.S.; Burry, J. Evaluating the effectiveness of smart traffic lights using SUMO and machine learning-based traffic predictions. Transp. Policy 2021, 110, 82–94. [Google Scholar] [CrossRef]


| SOF 5 bits | Time 6 + 6 + 6 bits | Flag 3 bits | COM 4bits | Position 4 + 4 bits | Payload 4 + 4 + 4 + 4 + 4 + 4 bits | ||||||||||
|---|---|---|---|---|---|---|---|---|---|---|---|---|---|---|---|
| L2D | Sync | Hour | Min | Sec | END | 1 | y | x | 0000 + 0000 | EOF | |||||
| D2D | Sync | Hour | Min | Sec | END | 2 | y | x | Lane (0–7) | Device (nr) | Device IDy | Device IDx | Nr. behind | …… | EOF |
| D2I | Sync | Hour | Min | Sec | END | 3 | y | x | TL (0–15) | Device (nr). | Device IDy | Device IDx | Nr. behind | …… | EOF |
| I2D | Sync | Hour | Min | Sec | END | 4 | y | x | TL (0–15) | Device ID | Device IDy | Device IDx | Nr. behind | …… | EOF |
| P2I | Sync | Hour | Min | Sec | END | 5 | y | x | TL (0–15) | N,S,E,W. | …… | EOF | |||
| I2P | Sync | Hour | Min | Sec | END | 6 | y | x | TL (0–15) | Phase | …… | EOF | |||
 | ||||||||||
| Standard (% Green Time) | Symmetrical (% Green Time) | Asymmetrical (% Green Time) | ||||||||
| T0 | T1 | T2 | T0 | T1 | T2 | T0 | T1 | |||
| P1 | 20% | 26% | 20% | P1 | 16% | 14% | 25% | P1 | 17% | 20% |
| P2 | 3% | 5% | 8% | P2 | 2% | 5% | 3% | P2 | 2% | 9% |
| P3 | 3% | 2% | 5% | P3 | 3% | 2% | 5% | P3 | 16% | 4% |
| P4 | 2% | 2% | 3% | P4 | 5% | 5% | 2% | P4 | 0% | 1% |
| P5 | 36% | 33% | 27% | P5 | 41% | 26% | 19% | P5 | 39% | 19% |
| P6 | 7% | 6% | 11% | P6 | 5% | 17% | 11% | P6 | 4% | 14% |
| P7 | 4% | 7% | 1% | P7 | 7% | 8% | 13% | P7 | 0% | 5% |
| P8 | 2% | 7% | 8% | P8 | 1% | 3% | 3% | P8 | 3% | 7% |
| P9 | 20% | 10% | 13% | P9 | 16% | 17% | 16% | P9 | 17% | 18% |
| Phase | Intersection | Without Penalization (%) | With Penalization (%) | Relative Change (%) |
|---|---|---|---|---|
| Phase 1 (N–S) | C1 | 28.0 | 16.0 | ↓ 42.9% |
| Phase 1 (N–S) | C4 | 27.0 | 19.0 | ↓ 29.6% |
| Phase 1 (N–S) | C0 | 4.6 | 4.6 | 0.0% |
| Phase 1 (N–S) | C3 | 4.6 | 4.6 | 0.0% |
| Phase 5 (W–E) | C0 | 34.0 | 24.0 | ↓ 29.4% |
| Phase 5 (W–E) | C2 | 20.0 | 20.0 | 0.0% |
| Phase 5 (W–E) | C4 | 7.0 | 1.6 | ↓ 77.1% |
| Phase 5 (W–E) | C1 | 16.0 | 20.0 | ↑ 25.0% |
| Phase 6 | C1 | 12.0 | 13.0 | ↑ 8.3% |
| Phase 6 | C2 | 8.0 | 9.0 | ↑ 12.5% |
| Phase 7 | C0 | 17.0 | 14.0 | ↓ 17.6% |
| Phase 7 | C1 | 12.0 | 13.0 | ↑ 8.3% |
| Phase 7 | C2 | 18.0 | 15.0 | ↓ 16.7% |
Disclaimer/Publisher’s Note: The statements, opinions and data contained in all publications are solely those of the individual author(s) and contributor(s) and not of MDPI and/or the editor(s). MDPI and/or the editor(s) disclaim responsibility for any injury to people or property resulting from any ideas, methods, instructions or products referred to in the content. |
© 2025 by the authors. Licensee MDPI, Basel, Switzerland. This article is an open access article distributed under the terms and conditions of the Creative Commons Attribution (CC BY) license (https://creativecommons.org/licenses/by/4.0/).
Share and Cite
Vieira, M.; Vieira, M.A.; Galvão, G.; Louro, P.; Fantoni, A.; Vieira, P.; Véstias, M. Enhancing Airport Traffic Flow: Intelligent System Based on VLC, Rerouting Techniques, and Adaptive Reward Learning. Sensors 2025, 25, 2842. https://doi.org/10.3390/s25092842
Vieira M, Vieira MA, Galvão G, Louro P, Fantoni A, Vieira P, Véstias M. Enhancing Airport Traffic Flow: Intelligent System Based on VLC, Rerouting Techniques, and Adaptive Reward Learning. Sensors. 2025; 25(9):2842. https://doi.org/10.3390/s25092842
Chicago/Turabian StyleVieira, Manuela, Manuel Augusto Vieira, Gonçalo Galvão, Paula Louro, Alessandro Fantoni, Pedro Vieira, and Mário Véstias. 2025. "Enhancing Airport Traffic Flow: Intelligent System Based on VLC, Rerouting Techniques, and Adaptive Reward Learning" Sensors 25, no. 9: 2842. https://doi.org/10.3390/s25092842
APA StyleVieira, M., Vieira, M. A., Galvão, G., Louro, P., Fantoni, A., Vieira, P., & Véstias, M. (2025). Enhancing Airport Traffic Flow: Intelligent System Based on VLC, Rerouting Techniques, and Adaptive Reward Learning. Sensors, 25(9), 2842. https://doi.org/10.3390/s25092842