Article

Hydrothermal Synthesis of Zinc Stannate Nanoparticles for the Electrochemical Detection of Organophosphate Pesticide—Parathion-Ethyl

by
Loganathan Vagismathi
and
Sea-Fue Wang
*
Department of Materials and Mineral Resources Engineering, National Taipei University of Technology, Taipei 106, Taiwan
*
Author to whom correspondence should be addressed.
Sensors 2025, 25(9), 2837; https://doi.org/10.3390/s25092837
Submission received: 16 March 2025 / Revised: 27 April 2025 / Accepted: 28 April 2025 / Published: 30 April 2025

Abstract

:
This work focuses on developing a Zn2SnO4-based electrochemical sensor for detecting parathion-ethyl (EP), a toxic organophosphorus pesticide. Monitoring such hazardous compounds is essential to ensure environmental and food safety. Zn2SnO4, known for its excellent electrical conductivity, catalytic activity, simple synthesis process, and eco-friendly nature, was utilized as an electrode material to enhance the detection of EP. Zn2SnO4 was synthesized via a hydrothermal method and characterized using XRD to confirm its crystalline structure. Zn2SnO4 was subsequently modified onto a glassy carbon electrode (GCE), enabling the study of its electrochemical properties and interaction with EP. River water and carrot samples were collected, pretreated, and analyzed for EP detection to evaluate real-world applicability. Electrochemical detection of EP using differential pulse voltammetry (DPV) showed a linear response in the concentration range of 0.01–78.4 μM, with a detection limit of 0.0059 µM. The sensor demonstrated excellent repeatability and selectivity in the presence of potential interferents. Real sample analysis confirmed the sensor’s effectiveness, achieving satisfactory recovery rates in river water and carrot samples. The high surface area and conductivity of Zn2SnO4 significantly enhanced the electrochemical response, validating its potential for reliable EP detection in environmental and agricultural samples.

1. Introduction

The widespread use of insecticides, pesticides, and acaricides is essential for protecting food crops from damage caused by insects and pests. Pesticides are classified based on their chemical structure, including organophosphates, organochlorines, carbamates, neonicotinoids, and pyrethroids [1,2]. Each group has unique properties that determine its application and environmental impact [3]. Parathion-ethyl (EP), a potent organophosphorus pesticide (OPP), is widely used to control a variety of agricultural and household pests, including aphids, capsids, leaf miners, sawflies, and weevils [4]. The chemical formula for EP is C10H14NO5PS, and it is known by various names, such as O, O-Diethyl-O(p-nitrophenyl) phosphorothioate, parathion-ethyl, di-EP, and locally as “Folidol”. It is commonly applied to crops such as vegetables, string beans, and rice [5]. While EP is highly effective in controlling pests, its use has raised significant health and environmental concerns due to its toxicity. The United States Environmental Protection Agency (US EPA) has classified EP as a highly hazardous chemical under the Acute Toxicity category [6].
Additionally, it is considered a carcinogen due to its potential to cause long-term adverse health effects. The toxic mechanism of EP is linked to its action as a potent acetylcholinesterase (AChE) inhibitor. AChE is a critical enzyme in the nervous system, responsible for breaking down acetylcholine, a neurotransmitter essential for proper neural communication [5,6,7]. When EP inhibits AChE, acetylcholine accumulates at synaptic junctions, disrupting regular neural activity. This leads to neurological dysfunction in pests and poses severe health risks to humans. Acute exposure to EP can cause symptoms such as impaired concentration, reduced motor and cognitive function, anxiety, confusion, tremors, seizures, and, in severe cases, death [8]. Chronic, low-level exposure to EP remains less understood but is particularly concerning for vulnerable populations, such as young children and fetuses, whose nervous systems are still developing. These groups are at higher risk due to their rapid brain growth and limited ability to metabolize and detoxify chemicals. Animal studies have further emphasized the harmful effects of organophosphate exposure during critical developmental periods, highlighting the need for caution in using such pesticides. The widespread use of EP has contaminated food, water, and soil, creating significant risks for human health and ecosystems. The persistence of EP in the environment, coupled with its high toxicity, makes it one of the primary causes of pesticide poisoning. As a result, the use of EP has been restricted or even discontinued in many regions worldwide [8,9]. Regulatory bodies like the European Union have set strict guidelines to limit exposure to this harmful pesticide. The European Union Pesticides Database has established the maximum residue limit (MRL) for EP at 0.01 ppm, reflecting growing concerns about its toxicity. Similarly, the US EPA has defined MRLs for various organophosphates, ranging from 0.01 ppm to 3 ppm, depending on the specific pesticide and the type of food [10]. For EP, it is critical to ensure compliance with these limits to minimize the risks to public health. Long-term exposure to EP has also been linked to a range of severe medical conditions. Research has suggested that prolonged exposure may contribute to the development of diseases such as Parkinson’s disease, asthma, attention deficit hyperactivity disorder (ADHD), and certain types of cancer. These medical conditions further underscore the importance of regulating EP residues in food, water, and the environment [11]. Therefore, effectively monitoring and detecting EP residues is essential to protect public health.
Conventional methods for detecting EP and other organophosphorus pesticides include techniques such as gas chromatography (GC), high-performance liquid chromatography (HPLC), and capillary electrophoresis (CE). While these methods are known for their high sensitivity, selectivity, and reproducibility, they also have significant drawbacks. For instance, sample preparation can be time-consuming and labor-intensive, instrumentation can be expensive, and these methods often require toxic and volatile solvents [5,6,7,8,9,10,11]. Additionally, GC is unsuitable for polar or thermally labile compounds, and HPLC requires multiple processing steps, making the overall process more complex and costly. In contrast, electrochemical detection has emerged as a promising alternative for monitoring EP residues. Electrochemical sensors are known for their simplicity, cost-effectiveness, high sensitivity, and stability [12,13,14]. Nitroaromatic compounds are electrochemically active, and their reducible nitro group allows for detecting various analytes at low concentrations [15,16]. Electrochemical sensors have become increasingly popular due to their adaptability and ability to provide reliable and real-time detection of analytes [17].
Recent advancements in nanomaterials have further enhanced the performance of these sensors. Nanomaterial-modified electrodes offer a larger active surface area, enhanced nano-porous structures, and high loading capacity, all of which contribute to improved sensitivity and accuracy in detection [18]. The efficiency of an electrochemical sensor largely depends on the properties of the working electrode surface. For the effective detection of EP, it is crucial to modify the electrode with a catalyst that exhibits excellent electrochemical properties. This ensures the sensor interacts effectively with the analyte, enabling precise and sensitive detection [19]. In previous studies, Huang et al. reported the electrochemical detection of alkyl parathion, achieving a limit of detection (LOD) of 0.172 µM using a Pd/MWCNTs-modified electrode for the determination of methyl and ethyl parathion [2]. Similarly, Wei et al. developed an Al-doped mesoporous cellular foam-modified electrode for the detection of parathion pesticides, also achieving a LOD of 0.0172 µM [3]. These findings highlight the effectiveness of modified electrode materials in enhancing the sensitivity and selectivity of pesticide detection. Based on the literature, we used Zn2SnO4 to detect EP.
Current developments in zinc stannate (Zn2SnO4) in electrode materials and surface modifications have significantly improved the performance of electrochemical sensors designed for analyte detection [20]. Zn2SnO4 is a versatile spinel-type material with a three-dimensional cubic structure, and it has gained significant attention in various applications, such as lithium-ion batteries, gas sensors, and photocatalysis. The crystal structure of Zn2SnO4 belongs to the Fd3m space group, and the material is composed of zinc (Zn2+) and oxygen (O2−) ions occupying tetrahedral and octahedral sites, respectively. At the same time, stannum (Sn4+) resides within oxygen octahedra. This unique configuration, combined with oxygen vacancies, enhances the adsorption of target analytes, making Zn2SnO4 an excellent material for electrochemical sensing applications [21,22,23]. Sol–gel offers good mixing but needs calcination and may cause agglomeration. Co-precipitation and combustion are scalable but lack precision and require high temperatures. The hydrothermal method excels, with high crystallinity, morphology control, and purity and is eco-friendly, optimizing Zn2SnO4 performance [24]. The hydrothermal method is favored for its simplicity and ability to produce high-purity materials with controlled nanostructures [25,26].
Zn2SnO4 nanocomposites have been explored for detecting hazardous compounds, but their application in electrochemical sensing of nitroaromatic compounds like EP remains underexplored. This presents an opportunity for further research.
In this study, zinc stannate (Zn2SnO4) nanopowder was synthesized using a simple hydrothermal method, demonstrating enhanced electrochemical properties for the sensitive and selective detection of EP under ambient conditions. The sensor showed lower detection limits and good reproducibility, making it ideal for real-time monitoring of EP in environmental and agricultural samples. Zn2SnO4 is a multifunctional metal oxide semiconductor (MOS) material known for its high electron mobility, lightweight nature, and strong thermal and chemical stability. Furthermore, Zn2SnO4 nanostructures enhance electrochemical sensing with increased active surface area, active sites, and efficient mass/electron transport. The material’s superior performance offers great promise for detecting hazardous substances like EP, contributing to food safety and public health protection.

2. Experimental Sections

2.1. Chemical and Reagents

All chemicals, including zinc nitrate hexahydrate, tin (IV) chloride pentahydrate, cetyltrimethylammonium bromide, n-butylamine, potassium ferrocyanide (K4[Fe(CN)6]·3H2O, potassium ferricyanide (K3[Fe(CN)6]), and the analyte, EP, were of analytical grade and obtained from Sigma Aldrich, Alfa Aesar and Showa Chemical Industry Co., Ltd. and were used as received without additional purification. Sodium phosphate dibasic (Na2HPO4, ≥99%) and sodium dihydrogen phosphate (NaH2PO4, ≥99%) were employed to prepare a 0.1 M phosphate buffer (PB) solution, which served as the supporting electrolyte for all electrochemical experiments. Distilled water (DI) was used to make the solutions. Prior to use, glassware was thoroughly cleaned with ethanol to ensure contaminant-free experiments. A measure of 5 mM ferricyanide [Fe(CN)6]3−/4− solution was prepared by adding potassium ferrocyanide (K4[Fe(CN)6]·3H2O) and potassium ferricyanide (K3[Fe(CN)6]) in 0.1 M KCl. Further details regarding electrolyte preparation and instrumentation are available in the Supplementary Information.

2.2. Instrumentation

The Zn2SnO4 nanomaterial was characterized using various analytical techniques. The phase composition was determined through X-ray diffraction (XRD) analysis using a Bruker 2D Phaser instrument. The crystal structure was visualized with the help of Vesta software (version 3.90.5a). Fourier-transform infrared (FT-IR) spectroscopy was performed using a PerkinElmer spectrometer within the range of 400–4000 cm−1 to identify functional groups and molecular structures. These characterization techniques provided insights into the physical properties of the synthesized material. The electrochemical performance was evaluated using a CHI 1211c electrochemical workstation, employing cyclic voltammetry (CV) in a conventional three-electrode setup. A glassy carbon electrode (GCE) with a surface area of 0.072 cm2 served as the working electrode, while a saturated Ag/AgCl electrode and a platinum wire functioned as the reference and counter electrodes, respectively.

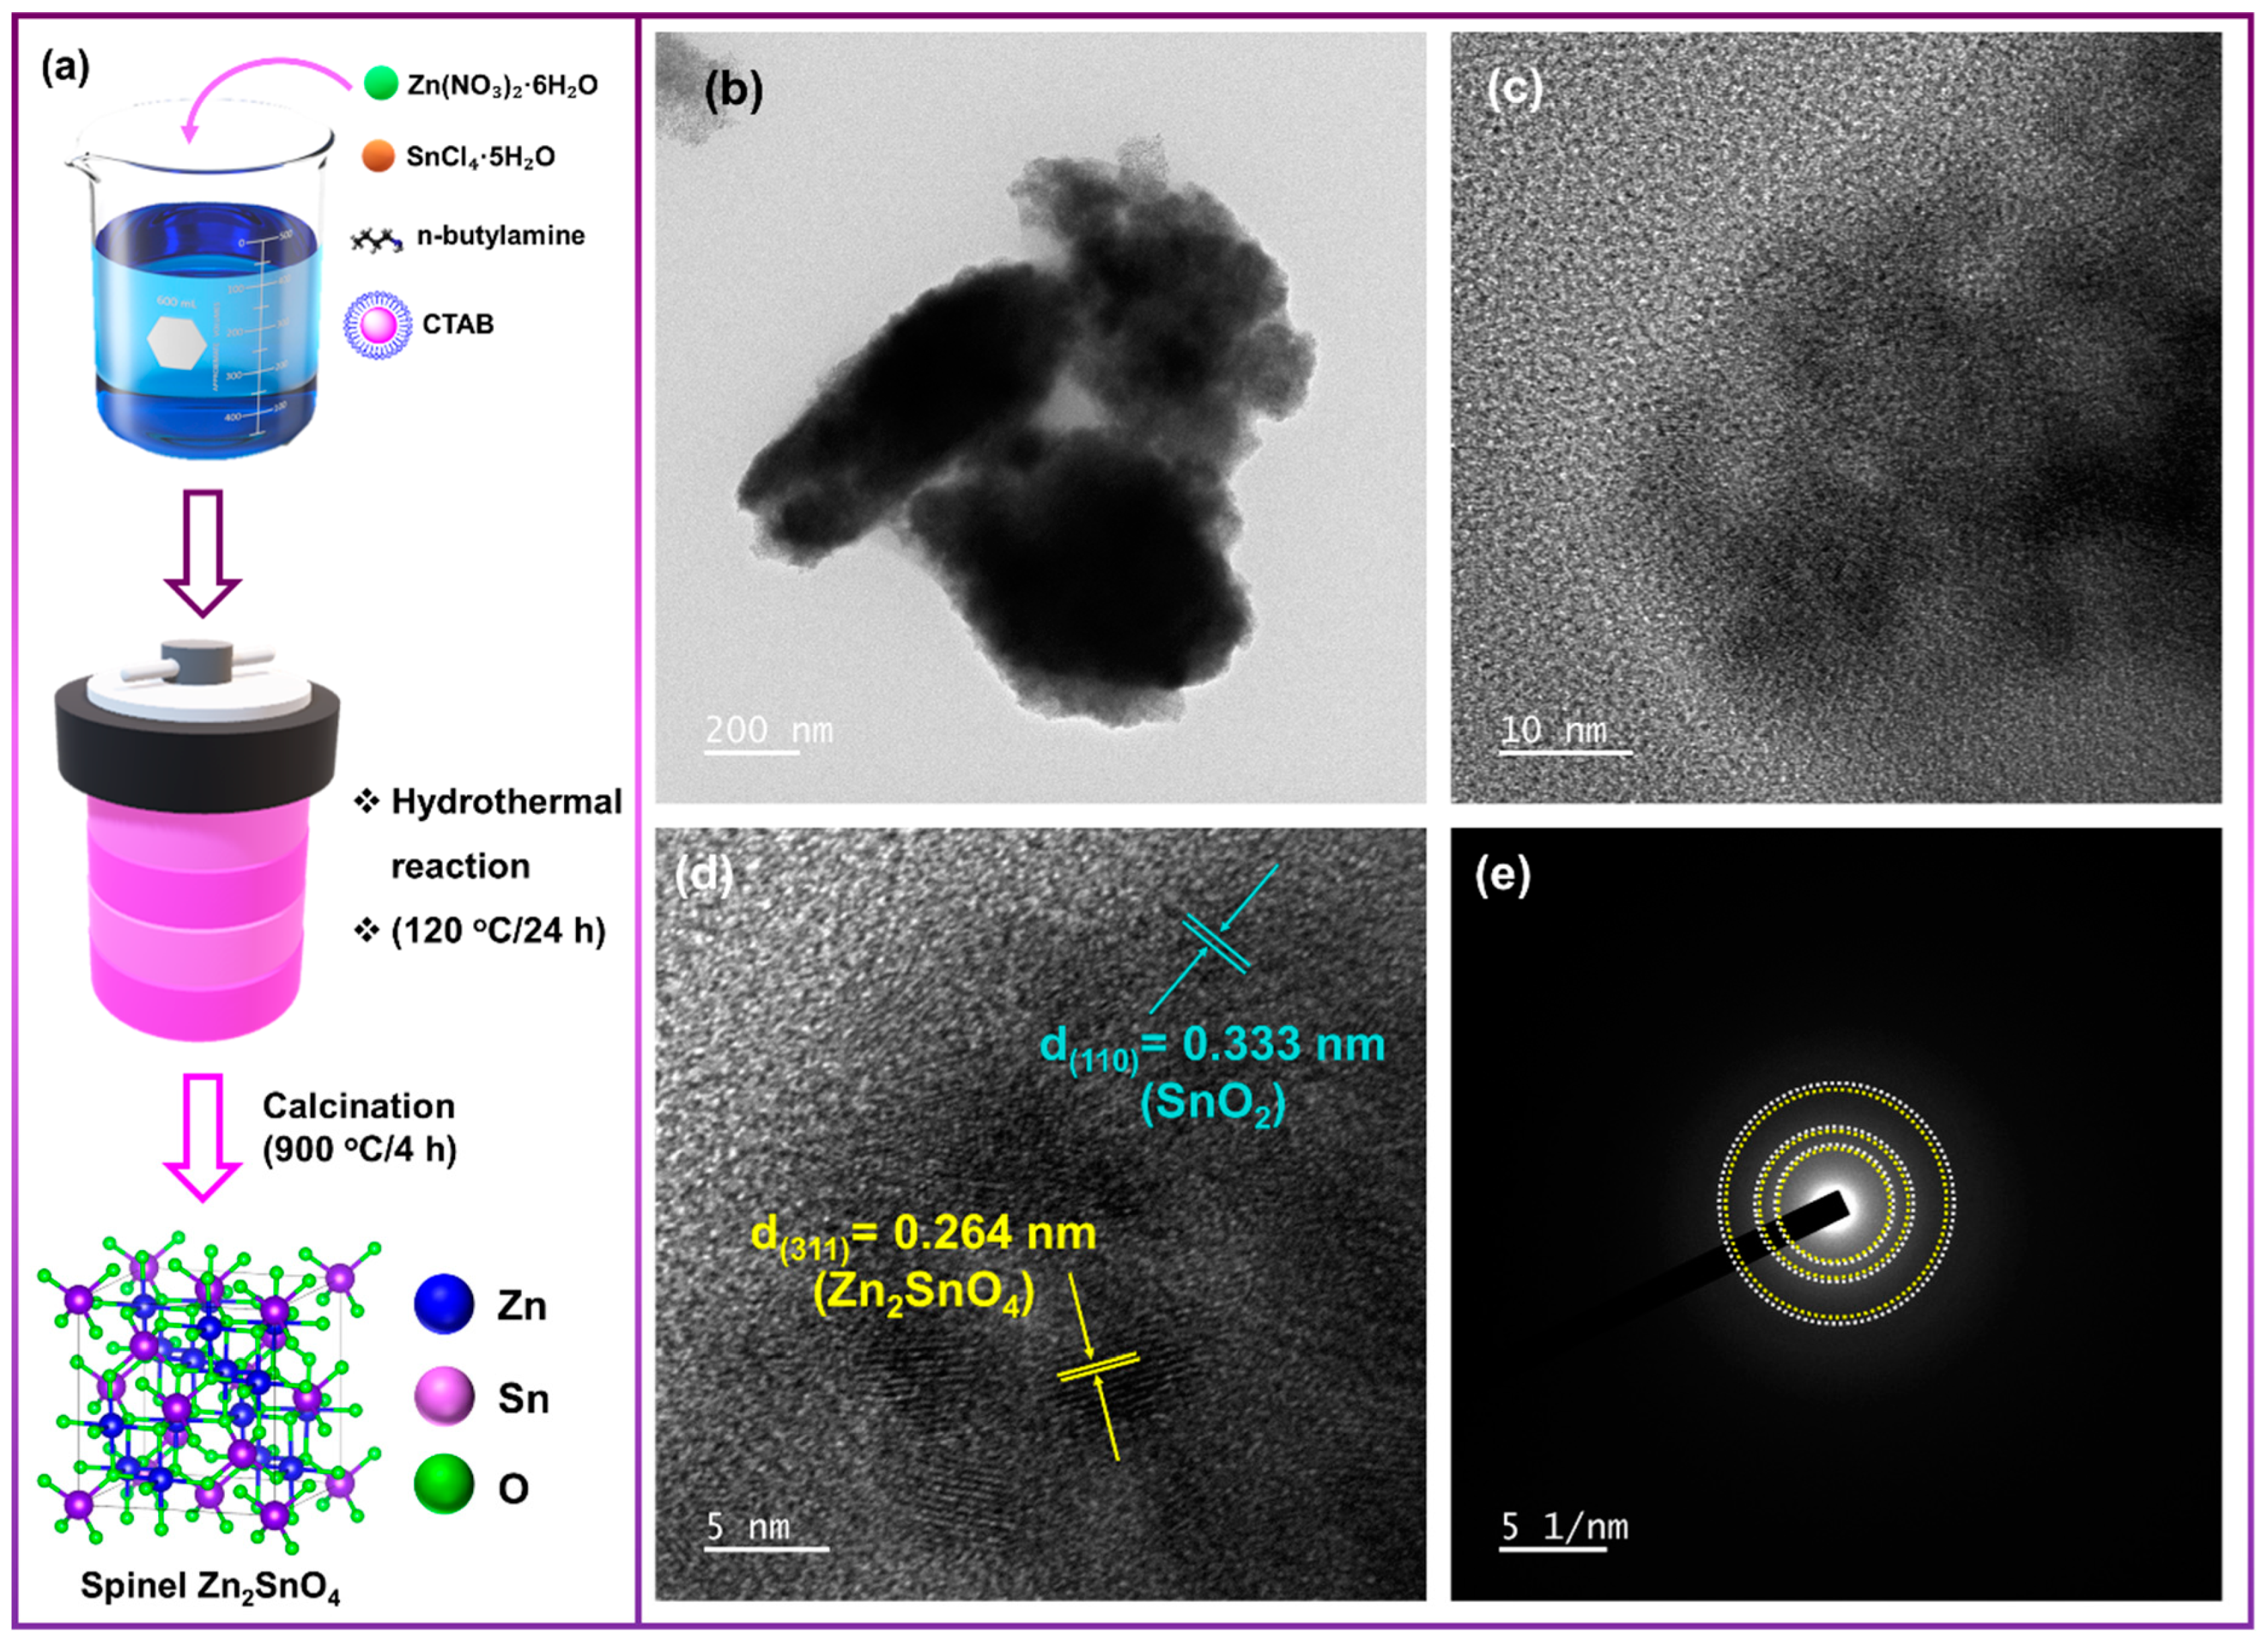
2.3. Synthesis of Electrocatalyst Zn2SnO4/SnO2 by Hydrothermal Method

A 0.1 M solution of zinc nitrate hexahydrate (Zn(NO3)2·6H2O) and a 0.05 M solution of tin(IV) chloride pentahydrate (SnCl4·5H2O) were prepared and stirred at room temperature until completely dissolved in 150 mL of DI water. To this mixture, 5 mM of cetyltrimethylammonium bromide (CTAB) and 1 g of n-butylamine were added under continuous stirring to form a homogeneous solution. This solution was transferred to a Teflon-lined autoclave and subjected to hydrothermal treatment at 120 °C for 24 h. The resultant product was washed three times with deionized water and ethanol. Then, the washed product was then dried at 90 °C for 12 h and calcined at 900 °C for 4 h to obtain Zn2SnO4/SnO2 as the electrocatalyst (Figure 1a).

2.4. Electrode Surface Modifications

Drop casting is a simple and efficient method for fabricating modified electrodes using suitable electrode materials. In this process, 2 mg of the synthesized Zn2SnO4/SnO2 nanoparticles were dispersed in 1 mL of deionized water through sonication for 15 min to ensure a uniform suspension. Prior to modification, a glassy carbon electrode (GCE) was polished with 0.05 μm alumina powder to remove any surface impurities and achieve a smooth surface. A measure of 4–10 μL of the Zn2SnO4 nanoparticle suspension was carefully pipetted from the prepared suspension onto the polished GCE. Upon application, the droplet experienced a surface tension gradient that induced an outward convective flow, referred to as Marangoni flow, driven by interfacial forces. As the inward Marangoni flow exceeded the outward capillary flow, the solute concentrated at the center of the droplet, promoting the adsorption of Zn2SnO4/SnO2 particles onto the electrode surface. The modified electrode was dried at 80 °C for 3 min to ensure adhesion and prepared for subsequent electrochemical experiments.

2.5. Optimization of the Detection System

CV and differential pulse voltammetry (DPV) techniques were used to detect EP using a three-electrode system, in which modified Zn2SnO4/SnO2/GCE was the working electrode and platinum wire and Ag/AgCl electrodes served as reference and counter electrodes, respectively. The DPV measurements were performed using a CHI1211C electrochemical workstation with a step potential of 0.004 V, a pulse amplitude of 0.05 V, and a pulse width of 0.025 s. The pulse period was set to 0.05 s, with a quiet time of 2 s, and the potential range spanned from 0.4 V to −1.2 V The electrochemical response was recorded in a PB at different pH levels. The scan rate and concentration dependence were analyzed to evaluate sensor performance.

3. Results and Discussions

3.1. Transmission Electron Microscopy (TEM) Analysis

To examine the Zn2SnO4/SnO2 sample’s morphology, transmission electron microscope (TEM) analysis has been characterized. The Zn2SnO4/SnO2 sample’s TEM images are shown in Figure 1b–d. Examining the sample with a TEM image at a greater magnification reveals that it comprises monodisperse microspheres. This confirms that the nanoparticles comprise aggregated nanoparticles with diameters ranging from approximately ≈5 to 10 nanometers. Figure 1d displays a TEM image of the Zn2SnO4/SnO2. The successful formation of the Zn2SnO4/SnO2 heterojunction is indicated by the HRTEM images of the sample, which show that the d-spacing of ≈0.264 nm plane corresponds to the (311) crystal planes of Zn2SnO4/SnO2 [27] (Figure 1d) and that the d-spacing of the ≈0.333 nm plane corresponds to the (110) crystal planes of SnO2 [28]. The SAED pattern of the Zn2SnO4/SnO2 heterostructure, as shown in Figure 1e, indicates the polycrystalline nature the sample and the SAED pattern’s diffraction rings can be linked to (311) and (220) for Zn2SnO4/SnO2 and (110) and (200) for SnO2 [29].

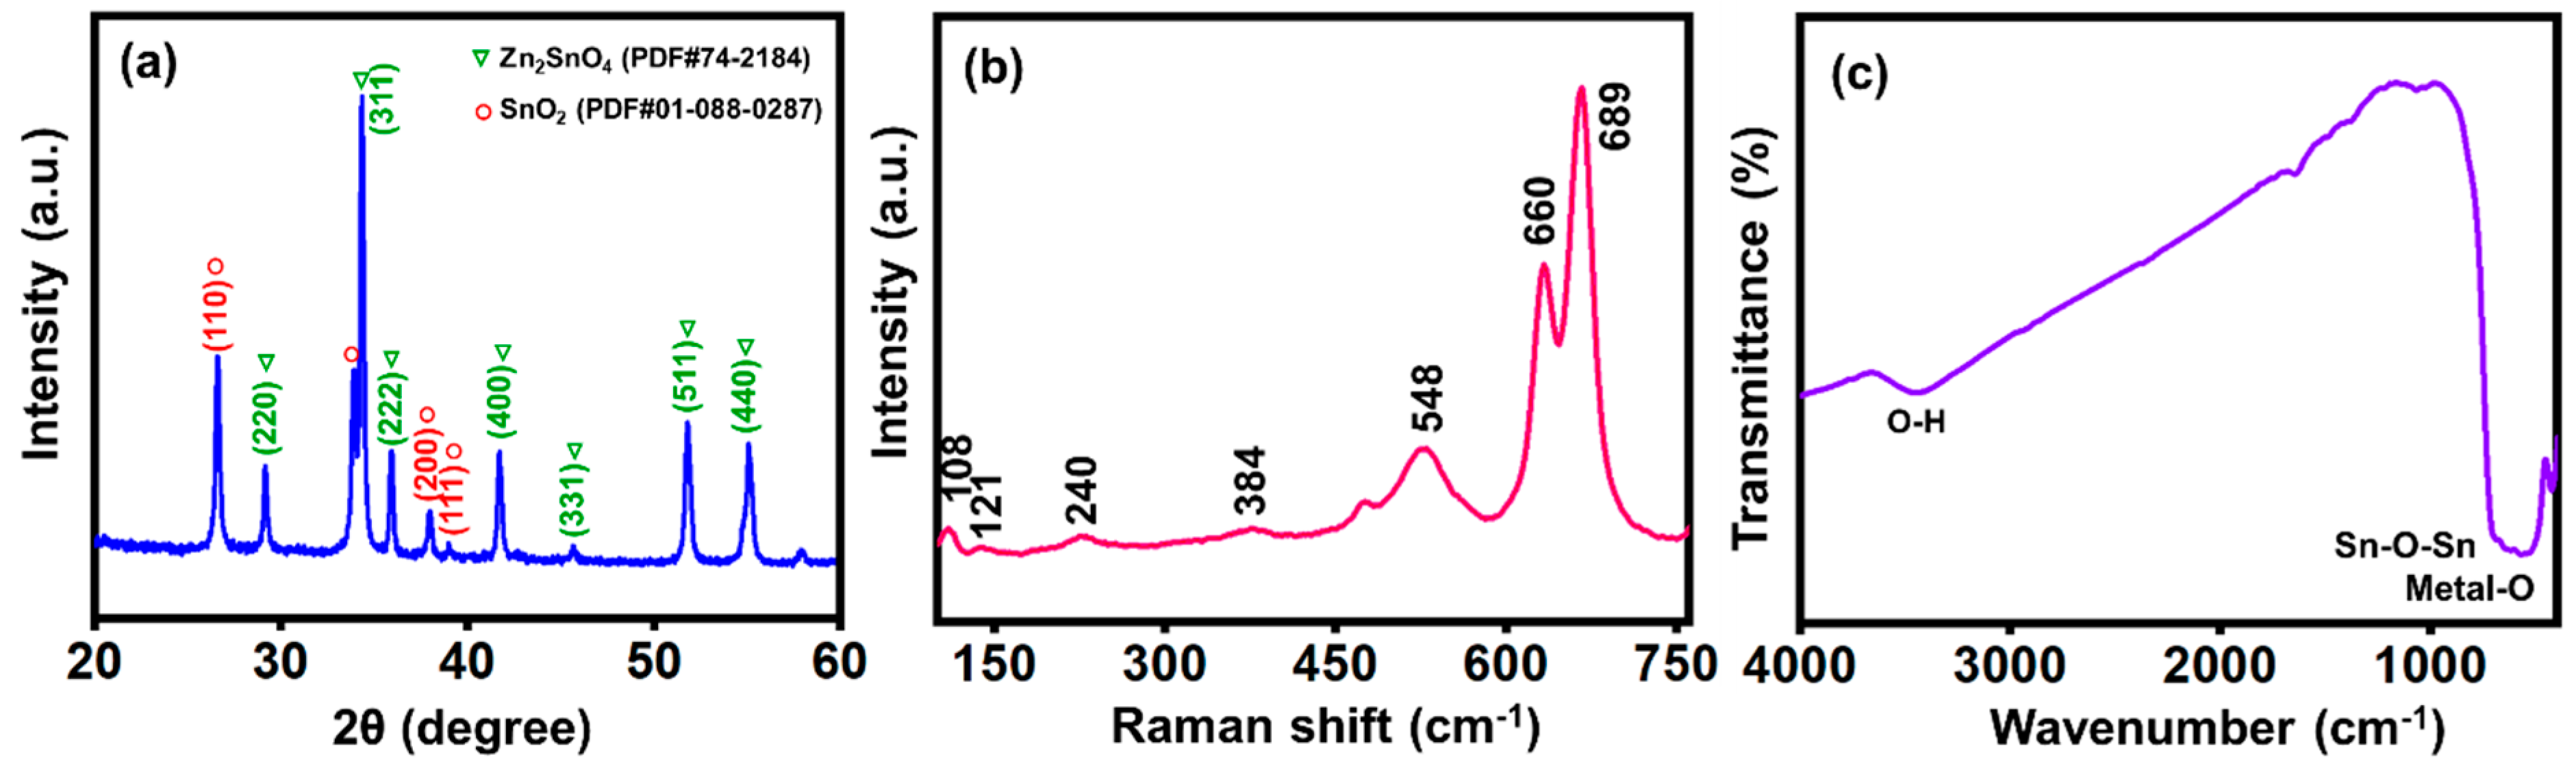
3.2. X-Ray Diffraction (XRD) Analysis

The structural properties of the Zn2SnO4/SnO2 sample were analyzed using X-ray diffraction Fi(XRD), and the results are shown in Figure 2a. The XRD pattern of the Zn2SnO4/SnO2 sample exhibited distinct peaks consistent with the reference code 74-2184 [22], corresponding to a cubic crystal system and space group Fd-3m. The identified peaks for Zn2SnO4 were located at 2theta values of 29°, 34°, 36°, 42°, 53°, and 56°, corresponding to the (220), (311), (222), (400), (511), and (440) planes, confirming the formation of Zn2SnO4. In addition to the Zn2SnO4 peaks, there were two or three weak peaks corresponding to SnO2 at around 27°, 38°, and 53°, which are associated with the (110), (200), and (111) planes, respectively [22]. These peaks suggest a minor presence of SnO2 in the sample, confirming that Zn2SnO4 was synthesized with a slight impurity or incomplete conversion of the SnO2 precursor.

3.3. Raman Spectroscopy Analysis

Raman spectroscopy was employed to provide further insights into the structural features of Zn2SnO4/SnO2 shown in Figure 2b, and it was allotted to T2u, B1g, F2g, Eg, A2u, B2g, and A1g symmetries. The peaks observed at 108 cm−1 and 121 cm−1 were associated with T2u and B1g modes, respectively. Raman modes observed at 240 cm−1 and 384 cm−1 correspond to the E(LO) phonon and F2g modes. A peak at 548 cm−1 is attributed to the internal vibrations of the oxygen tetrahedron. The band at 660 cm−1 arises from the Zn-O bonds symmetric stretching in the SnO4 tetrahedra (inverse Zn2SnO4). Additionally, the peak at 689 cm−1 corresponds to the A2u mode. The existence of the Zn2SnO4/SnO2 occurs solely in a heterostructure, as demonstrated by all of these Raman modes [22].

3.4. Fourier-Transform Infrared Spectroscopy (FTIR) Analysis

The Zn2SnO4/SnO2 samples were analyzed using FTIR spectroscopy, with the spectrum shown in Figure 2c. The Zn2SnO4/SnO2 sample exhibited characteristic stretching vibration at 586 cm−1 which is attributed to the vibration of the metal–oxygen bond. Additionally, a band at 880 cm−1 corresponds to the stretching vibration of the Sn–O bond. A broad stretching vibration at 3305 cm−1 is attributed to the O–H bond stretching, indicating the presence of absorbed water molecules on the sample’s surface, further confirmed by a peak at 1646 cm−1. These Raman and FTIR results confirm the presence of both Zn2SnO4 and a few peaks of SnO2 in the sample [22,23].

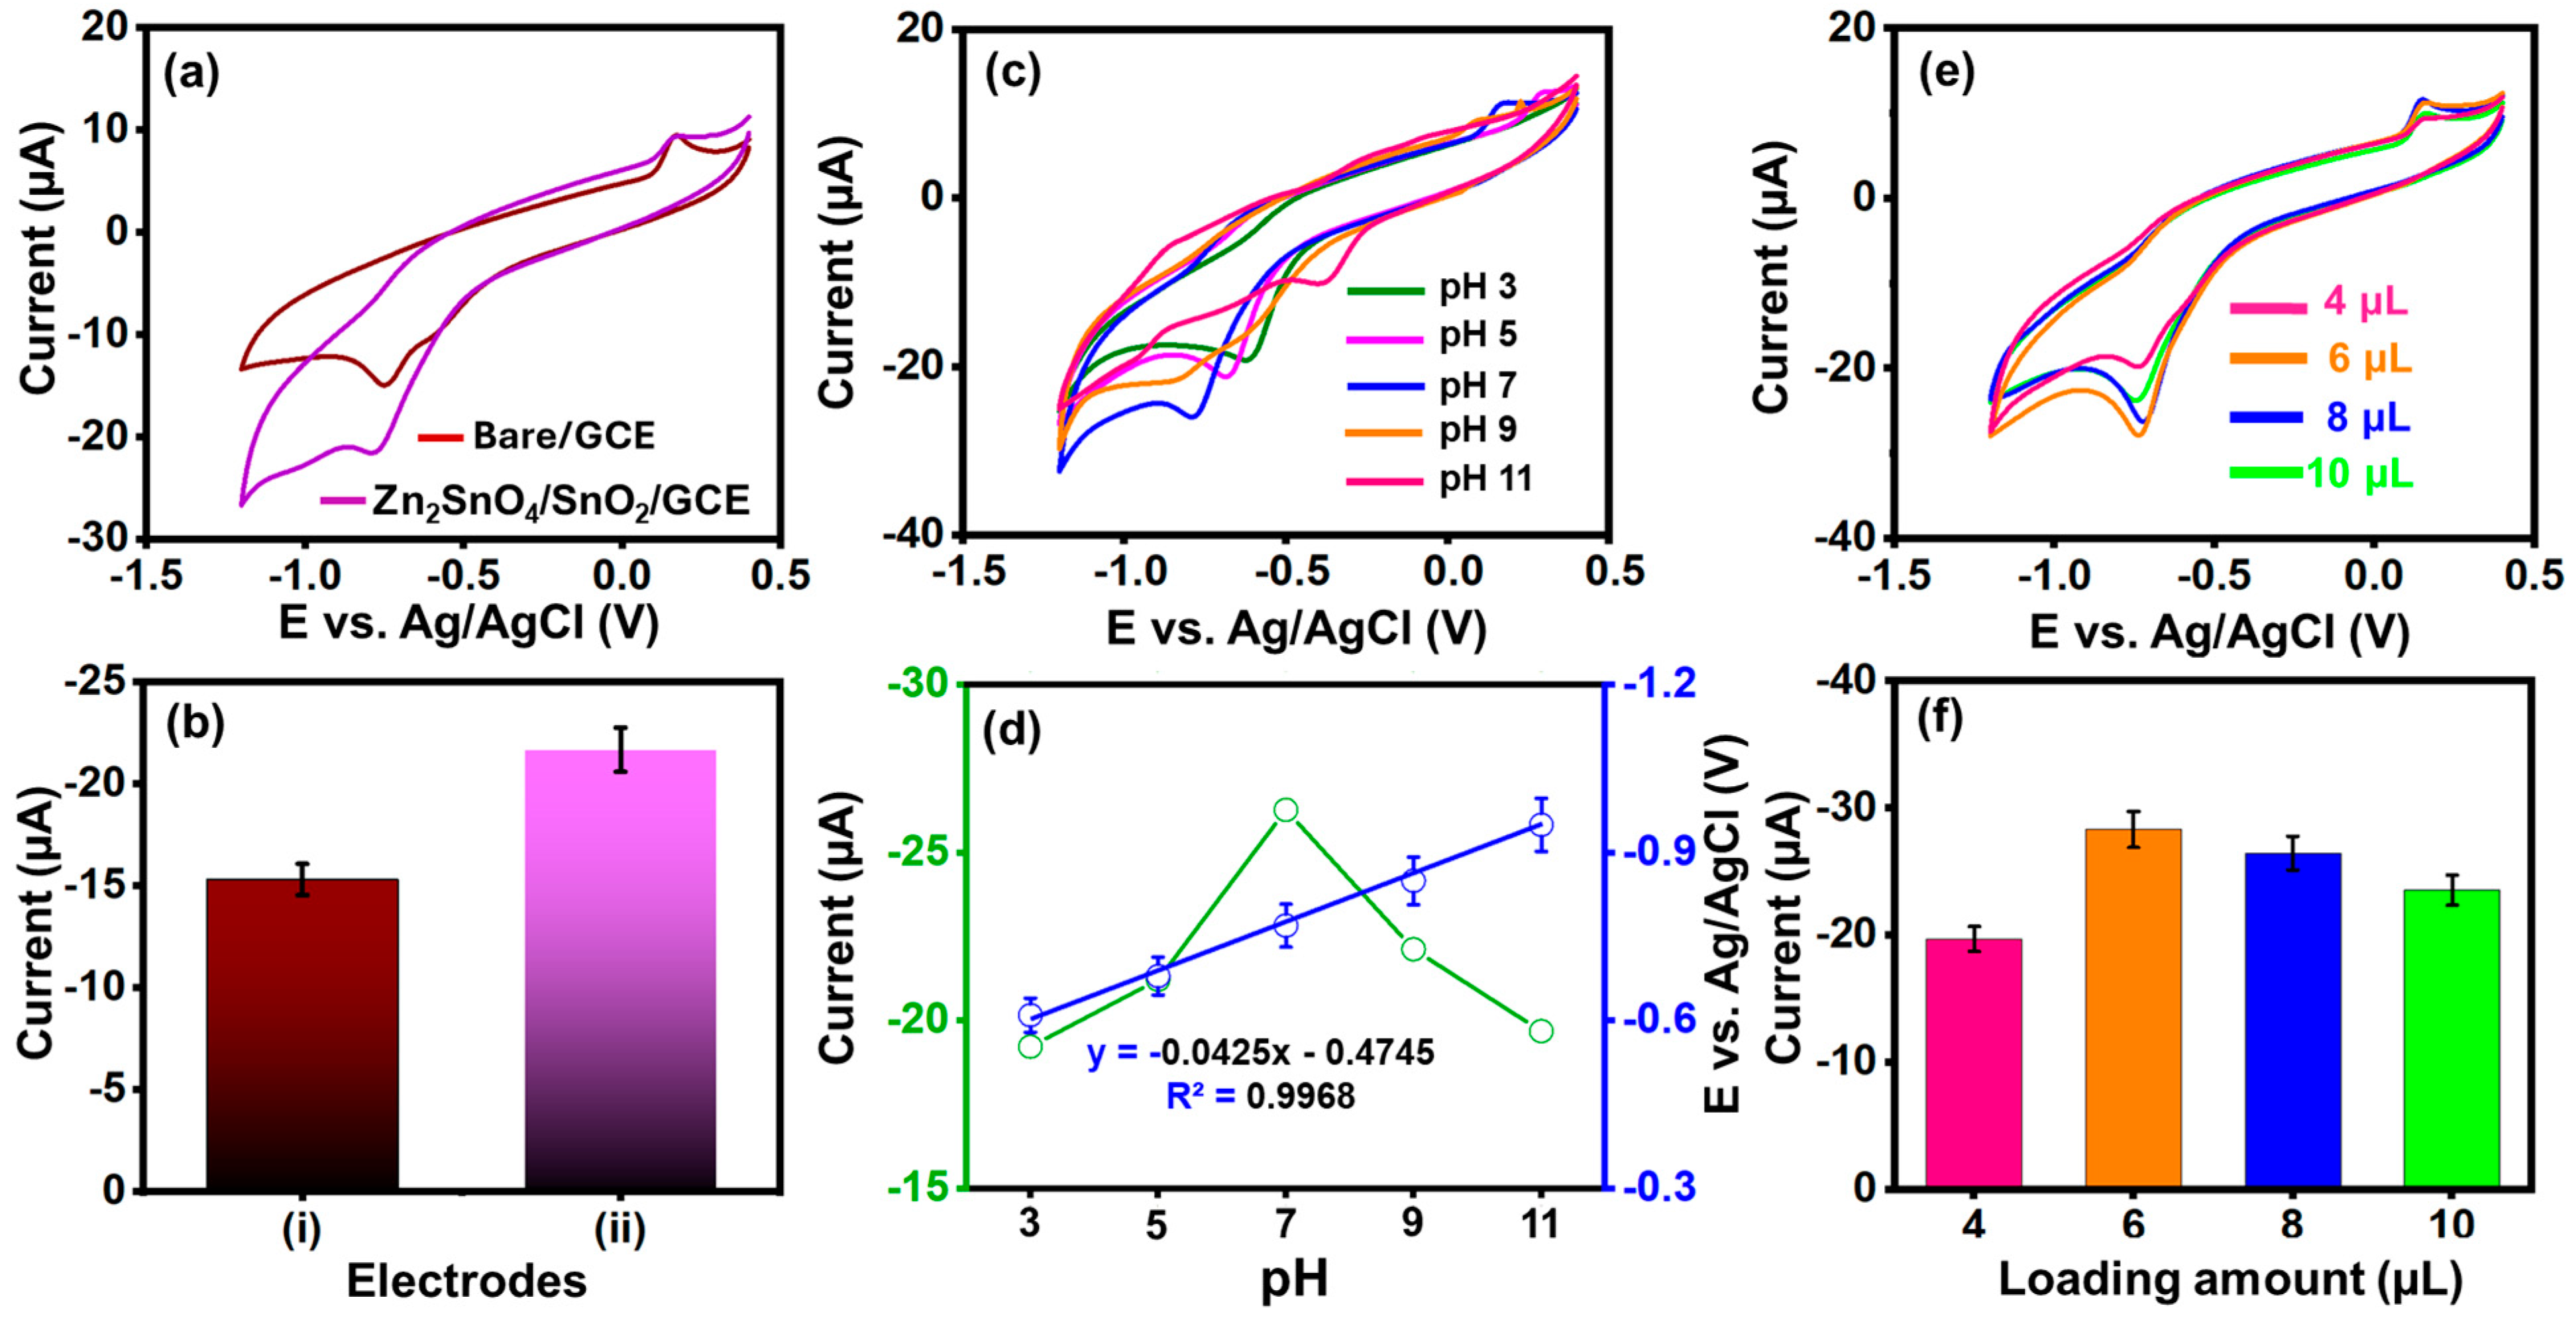
3.5. Electro-Catalytic Behaviors of Zn2SnO4/SnO2 Through Redox Probe

The electrochemical performance of the Zn2SnO4/SnO2-modified electrode was assessed through electrochemical impedance spectroscopy (EIS) in a 0.1 M KCl solution containing 5 mM [Fe(CN)6]3−/4−. The Nyquist plot and the corresponding Randles circuit model shown in Figure S1 demonstrate the charge transfer characteristics at the electrode-electrolyte interface. The unmodified GCE exhibited a higher charge transfer resistance (Rct) of approximately 55.99 Ω, whereas the Zn2SnO4/SnO2-modified electrode displayed a significantly lower Rct of 38.13 Ω, indicating enhanced electrical conductivity and improved electron transfer kinetics. The reduction in Rct suggests that Zn2SnO4/SnO2 facilitates better charge transport due to its increased electroactive surface area and efficient electron mobility. The electroactive behavior of the bare electrode and the modified electrode was evaluated through signal amplification in cyclic voltammetry studies conducted in 5 mM [Fe(CN)6]4−/[Fe(CN)6]3− redox solution containing 0.1 M KCl. The CV profile, depicted in Figure 3a, has distinct redox peaks for each modified electrode, resulting from the reversible electron transfer of the [Fe(CN)6]4−/[Fe(CN)6]3− redox pair. The bare GCE showed inferior redox performance of Ipa = 75.93 µA at Epa = 0.34 V and Ipc = −62.86 µA at Epc = 0.13 V compared to the modified electrode, attributed to the lack of additional pathways for efficient electron transfer that would enhance the reversible redox reaction. Upon modification, the GCE surface and the ionic aqueous environment within the interlayer region considerably improved electrochemical activity, as demonstrated by the notable increase in current of Ipa = 91.28 µA at Epa = 0.31 V and Ipc = −76.35 µA at Epc = 0.137 V for the Zn2SnO4/SnO2/GCE (Figure 3b). The electrochemical behavior of Zn2SnO4/SnO2/GCE was investigated by varying the scan rate from 0.02 Vs−1 to 0.2 Vs−1 using cyclic voltammetry in the same electrolyte used for other modified electrodes. As shown in Figure 3c, the redox peak currents increased proportionally with the applied square root of the scan rate, indicating a diffusion-controlled electrochemical process. The corresponding linear plots for the anodic and cathodic peak currents versus the square root of the scan rate are presented in Figure 3d.
These high correlation coefficients confirm the linear relationship between the peak currents and the square root of the scan rate, reflecting efficient electron transfer kinetics at the Zn2SnO4/SnO2/GCE surface. Using the obtained data and the Randles–Sevcik equation (Equation (1)), the electroactive surface area of the Zn2SnO4/SnO2/GCE was calculated, further demonstrating its enhanced electrochemical performance. Ip represents the redox peak current response in the above equation, while n denotes the number of electrons involved in the electrochemical reaction.
I p = 2.69 × 10 5 n 2 / 3 A D 1 / 2 v 1 / 2 C
The parameter A corresponds to the electroactive surface area, D is the diffusion coefficient (considered constant), C represents the electrolyte concentration, and ν is the applied scan rate. Using Equation (1), the calculated electroactive surface area for the Zn2SnO4/SnO2/GCE was found to be 0.076 cm2, highlighting the enhanced electron transfer properties due to surface modification.

3.6. Electrochemical Behaviors of Zn2SnO4/SnO2/GCE Towards EP Detection

The electrochemical behavior of EP was systematically investigated using CV at bare GCE and Zn2SnO4/SnO2/GCE. The CV measurements were conducted in 0.1 M PB solution containing EP at a scan rate of 0.05 Vs−1. Figure 4a shows the CV responses for both bare and Zn2SnO4/SnO2/GCE. The results highlight the comparative performance of the electrodes in the presence of EP, illustrating differences in their electrochemical responses. The CV profiles, shown in Figure 4b, display the peak current responses for the bare GCE and Zn2SnO4/SnO2/GCE in the presence of EP, recorded within the potential window of 0.4 V to −1.2 V at a scan rate of 0.05 Vs−1. The bare GCE exhibits a peak current of −15.11 μA, while the Zn2SnO4/SnO2/GCE shows a significantly higher peak current of −21.87 μA. This indicates that the bare GCE demonstrates limited electron transfer between the electrode and electrolyte, resulting in a lower reduction peak current. In contrast, the Zn2SnO4/SnO2/GCE substantially enhances the current response, suggesting that the modification improves the electrochemical performance. This improvement can be attributed to the increased active surface area provided by the Zn2SnO4/SnO2/GCE nanostructures, facilitating better interaction with the electrolyte. Additionally, the high conductivity of Zn2SnO4/SnO2/GCE promotes more efficient electron transfer, further enhancing the electrochemical response. Thus, the Zn2SnO4/SnO2/GCE modification significantly improves the electrode’s ability to detect EP, as evidenced by the higher reduction peak current compared to the bare GCE. Figure 4b presents a bar diagram comparing the reduction peak currents for the bare GCE and Zn2SnO4/SnO2/GCE, further illustrating the enhanced performance of the Zn2SnO4/SnO2/GCE.

3.7. Effect of Supporting Electrolyte

The choice of supporting electrolytes plays a crucial role in determining the electrochemical performance of Zn2SnO4/SnO2/GCE-modified electrodes for EP detection. For the effect of pH, a study was conducted using Zn2SnO4/SnO2/GCE in the presence of 150 μM EP, with the supporting electrolyte adjusted to pH levels ranging from 3 to 11 at a fixed scan rate of 0.05 Vs−1. As shown in Figure 4c, the reduction peak current increased progressively as the pH of the medium increased from 3 to 11, reaching its maximum at a neutral pH of 7. Beyond this, at pH 11, the peak current diminished. These findings indicate that the shift in the reduction peak as a function of pH is typically due to the protonation or deprotonation of electroactive species. More protons are available in acidic conditions, which can facilitate electron transfer, shifting the peak to more positive potentials. Conversely, fewer protons are available in basic conditions, making the reduction process more difficult and shifting the peak to more negative potentials. The results demonstrate that a neutral pH of 7 provides the most favorable environment for the reduction process, offering the highest current response and stable electrochemical performance. Figure 4d plots the reduction peak currents and potentials at different pH values. Based on these observations, pH 7 was the optimal condition for the supporting electrolyte in subsequent electrochemical applications. As a result, variations in the electrochemical reaction were observed through changes in the CV response potential and current, which directly influenced the electron transfer kinetics. The relationship between current and potential as a function of pH is illustrated in Figure 4d. By correlation with a Nernst equation, theoretical values are almost closer to our experimental slope value of −0.042 V pH−1, which accounts for the involvement of an equal no. of protons in electrochemical reactions and establishes the relationship between peak potential and pH. The corresponding Nernst equation is applied for a response involving m protons and n electrons. As the pH increases, the peak potential shifts negatively, confirming that the electrochemical process involves proton loss. The corresponding linear equation is given by y = −0.0425pH − 0.4745, with a correlation coefficient of R2 = 0.9968.

3.8. Effect of Catalyst Loading Amount

The influence of varying the loading amounts of Zn2SnO4/SnO2/GCE on the modified GCE was examined in the presence of 150 μM EP. The CV profiles for different loading amounts of Zn2SnO4/SnO2/GCE ranging from 4 to 10 μL are presented in Figure 4e. As the loading increased, the reduction peak current gradually enhanced, indicating improved electrochemical activity. However, further increasing the loading amount beyond 6 μL, up to 10 μL, resulted in a decline in peak current. The electrochemical response increases with catalyst loading up to 6 μL, beyond which a decrease in peak current was observed due to particle aggregation, which hinders electron transfer between the electrode surface and the electrolyte. The highest reduction peak current of Ipc = −21.87 μA was observed with an optimal loading of 6 μL (Figure 4f). Thus, a 6 μL loading amount was selected as the optimum condition for subsequent electrochemical studies.

3.9. Impact of Different Concentration and Scan Rates

The electrochemical performance of Zn2SnO4/SnO2/GCE was evaluated through CV in 0.1 M phosphate buffer (pH 7.0) with incremental additions of EP. Figure 5a illustrates the CV profiles recorded at a fixed scan rate of 0.05 Vs−1 as the concentration of EP was increased sequentially between 50 μM and 350 μM. The results reveal a consistent rise in the cathodic peak current with each addition of EP, demonstrating the effective interaction between the analyte and the modified electrode surface. Additionally, the unique properties of the Zn2SnO4/SnO2/GCE heterostructure enhance the cathodic peak current by reducing capacitance and preventing fouling effects. This antifouling behavior stems from the synergistic interactions between the Zn2SnO4/SnO2/GCE heterostructure and the electrode surface, ensuring a stable and reproducible performance. The efficacy of the Zn2SnO4/SnO2/GCE modification in accurately detecting EP is further demonstrated in Figure 5b, which presents a clear linear relationship between the EP concentration and the corresponding cathodic peak current. This linearity is described by a strong correlation coefficient and the regression equation provided Equation (2).
I p c ( µ A ) = 0.0697 E P ( μ M ) 15.479 ,   R 2 = 0.9978
Furthermore, in observing the kinetic behavior of Zn2SnO4/SnO2/GCE, CV analysis was performed in 0.1 M phosphate buffer (pH 7.0) by varying the scan rate from 0.02 Vs−1 to 0.2 Vs−1, as illustrated in Figure 5c. The CV profiles show a notable increase in reduction peak current with an increase in scan rate, highlighting the electrode’s ability to facilitate rapid electron transfer. The kinetic analysis indicates that the Zn2SnO4/SnO2/GCE follows a surface-controlled process. The direct proportionality between the cathodic peak current and the scan rate, a hallmark of surface-dominated electron transfer mechanisms, supports this observation. The unique properties of Zn2SnO4/SnO2-modified GCE, such as its enhanced electron transport capabilities, high active surface area, and efficient ion exchange, contribute to its superior electrochemical performance. The linear relationship between the cathodic peak current and the scan rate is represented in Figure 5d. The regression equation and corresponding correlation coefficient value for the Zn2SnO4/SnO2/GCE are expressed in Equation (3).
I p c µ A = 61.235   v ( V s 1 ) 18.454 ,   R 2 = 0.9923
Scheme 1 shows that a sharp cathodic peak (Epc(i)) at −0.71 V was found in the first cycle, which conforms with the literature reports. This peak was caused by the reduction in the nitro group of EP (EP-NO2), which resulted in its hydroxylamine derivatives (EP-NHOH). In the first cycle’s reverse part, a redox peak (ii) is associated with the nitroso group (EP-NO) formed by the oxidation of EP-NHOH. Furthermore, this two-electron-transfer process, which can be reversed, formed a peak reduction (ii) throughout the subsequent CV potential scan.

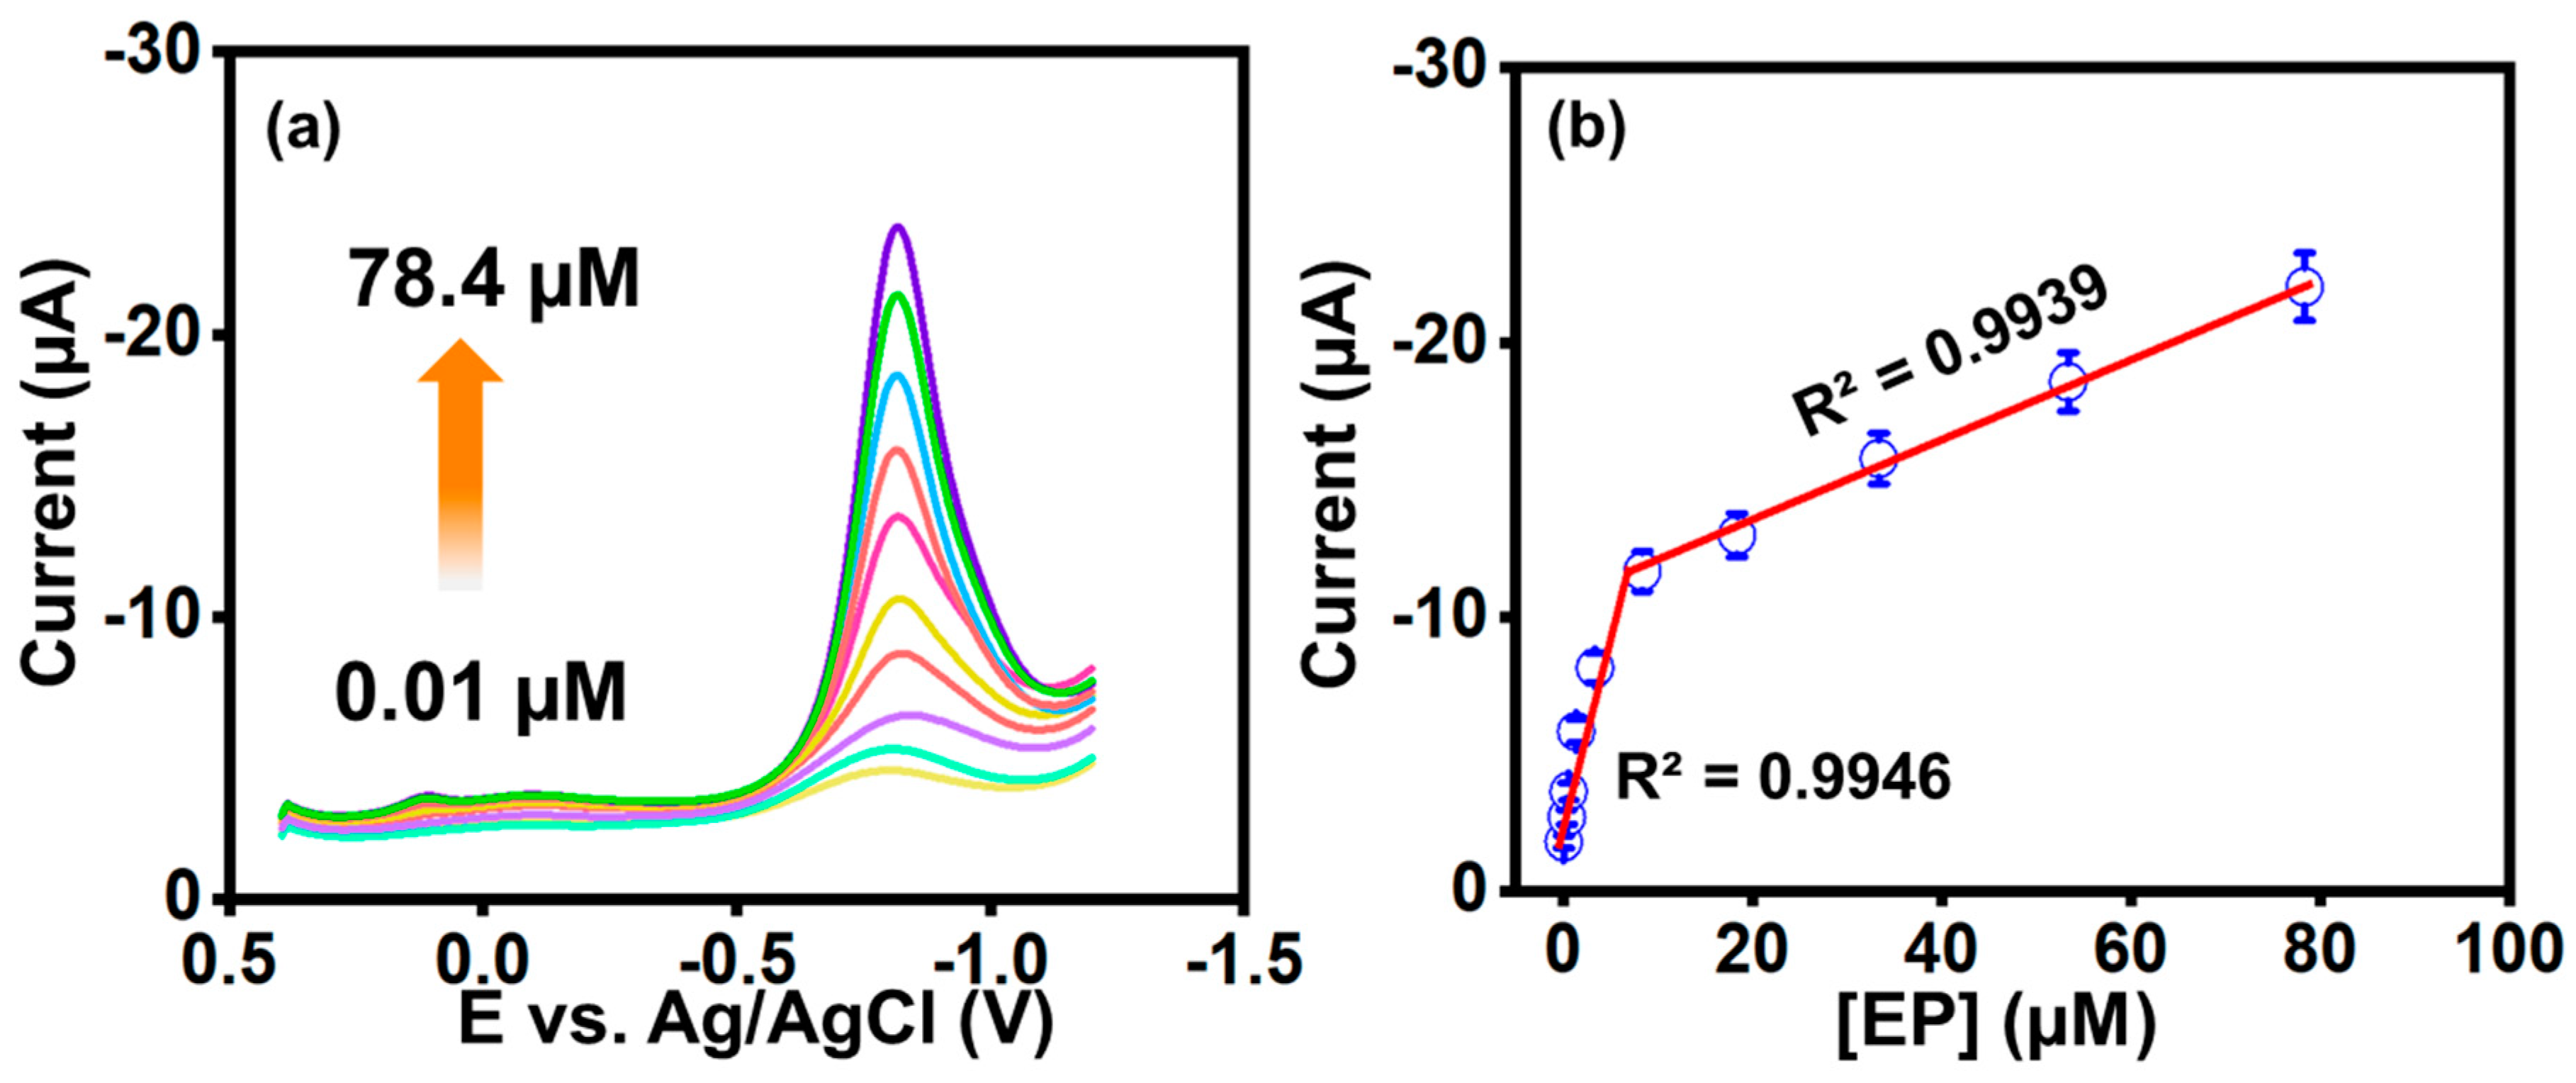
3.10. Differential Pulse Voltammetry (DPV) Analysis

The electrochemical detection of EP was investigated using differential pulse voltammetry (DPV) for its enhanced selectivity and sensitivity over CV. Electrochemical analysis was performed at low concentrations to ensure precise detection of EP. A 0.01–78.4 µM concentration range of EP was analyzed using a Zn2SnO4/SnO2/GCE in a 0.1 M PB solution with a three-electrode system. The DPV results showed a gradual increase in the reduction peak current with increasing EP concentration, indicating enhanced response due to the effective interaction of the analyte with the modified electrode surface. These DPV responses are depicted in Figure 6a, with the corresponding calibration plots for lower and higher concentration ranges, as shown in Figure 6b, to determine the limit of detection (LOD). The LOD was calculated using Equation (4).
L O D = 3 S / σ
Here, S represents the standard deviation from the DPV responses and σ is the slope derived from the calibration plot. The calculated LOD for EP detection using Zn2SnO4/SnO2/GCE was 0.0059 µM. The performance of this study was compared with previously reported electrochemical sensors, focusing on the modified electrodes, LOD, and linear detection ranges, as summarized in Table 1. These results highlight the effectiveness of the Zn2SnO4/SnO2/GCE in the sensitive and precise detection of EP.

3.11. Selectivity, Repeatability, and Reproducibility Study

To assess sensor selectivity, the DPV method was performed in the presence of common interfering compounds including Parathion methyl, quercetin, 4-nitrophenol, theobromine, 2-nitrophenol, roxarsone, and mercury ions, which are similar to EP compound (Figure S2). A concentration of 100 μM EP along with 200 μM of the interferents was used. The modified electrode Zn2SnO4/SnO2/GCE exhibited excellent selectivity toward the target analyte, even in the presence of structurally similar or commonly interfering substances. The higher current response for the analyte suggests strong surface interaction and favorable electron transfer dynamics. This indicates that the sensor can distinguish the analyte with high specificity, making it a reliable tool for selective detection. The durability of the fabricated Zn2SnO4/SnO2/GCE for EP detection was evaluated through repeatability and reproducibility analyses. The repeatability study was carried out using the CV technique, with four consecutive measurements conducted in the presence of 20 µM EP (Figure S3a). The results demonstrated consistent and stable responses across all measurements, confirming the Zn2SnO4/SnO2/GCE reliability for 20 μM EP detection with the RSD values of ±3.79%. The study used three independently fabricated Zn2SnO4/SnO2/GCE under identical experimental conditions to assess reproducibility. The results revealed minimal variation in the reduction in current responses across the electrodes, highlighting the robustness and reproducibility of the sensor fabrication process. This indicates that the Zn2SnO4/SnO2/GCE provides consistent performance for EP detection, regardless of the electrode batch (Figure S3b). The stability of the fabricated Zn2SnO4/SnO2/GCE was assessed using cyclic voltammetry in 0.1 M PB (pH 7.0) containing 150 µM ethyl parathion at a scan rate of 0.05 Vs−1. The electrode maintained a stable current response over 40 successive cycles, suggesting strong durability and surface integrity. Approximately 75% of the original peak current was preserved, reflecting low signal drift and minimal material loss during repeated usage (Figure S3c). These results confirm the reliable repeatability, reproducibility, and cyclic stability of the Zn2SnO4/SnO2-modified electrode for the electrochemical detection of EP.

3.12. Real Sample Analysis

The electrochemical performance of Zn2SnO4/SnO2/GCE was further evaluated using real samples, such as river water and carrot samples, to assess its applicability in detecting EP in complex matrices. These real samples were pre-treated, first as the river water samples were obtained from the Xindian River in Taiwan and then pretreated using Whatman filter paper to eliminate particulate matter. Electrochemical testing of the un-spiked samples exhibited no measurable current, indicating the absence of ethyl parathion. To assess the sensor’s performance in real matrices, standard solutions of ethyl parathion were introduced into both rivers. Following this spiking, clear and concentration-dependent electrochemical responses were recorded, confirming the sensor’s effectiveness in detecting ethyl parathion within complex water samples. On the other hand, the chopped carrot sample was soaked in deionized (DI) water at a mass-to-water ratio of 1:5 for 30–60 min to allow extraction. After soaking, the mixture was centrifuged at 8000–9000 rpm for 10–15 min to obtain a pure extract. The extract was used for further analysis. The detection was carried out by progressively adding known amounts of EP to the samples and measuring the electrochemical response using Zn2SnO4/SnO2/GCE. The results, shown in Table S1 indicate that as the concentration of EP increased, a corresponding increase in the cathodic current was observed, demonstrating the electrode’s sensitivity and ability to detect EP in complex samples. The analysis was repeated for two consecutive additions, with stable and reproducible results observed in all real sample analyses.

4. Conclusions

In this study, Zn2SnO4/SnO2/GCE was successfully developed and applied for the electrochemical detection of EP. The unique structural and electrochemical properties of Zn2SnO4/SnO2/GCE, including its high active surface area, enhanced conductivity, and catalytic activity, facilitated the efficient detection of EP with higher sensitivity and a low detection limit of 0.0059 µM. The electrode demonstrated excellent repeatability, stability, and selectivity, even in the presence of potential interferents. Furthermore, the Zn2SnO4/SnO2/GCE was tested on real samples such as river water and carrot extracts, where it showed reliable recovery rates, highlighting its potential for practical applications in environmental and agricultural monitoring. The results confirm that the Zn2SnO4/SnO2/GCE sensor is a promising tool for rapid, sensitive, and selective detection of pesticide residues, contributing to the advancement of electrochemical sensing technologies for environmental safety and food quality control.

Supplementary Materials

The following supporting information can be downloaded at: https://www.mdpi.com/article/10.3390/s25092837/s1, Figure S1: EIS of bare GCE, Zn2SnO4/SnO2 modified electrode in 0.1 M KCl and 5 mM [Fe(CN)6]3−,4−; Figure S2: Interfering analysis of Zn2SnO4/SnO2 modified electrodes in 0.1 M PB in the presence of 20 µM (1) EP with the presence of co-interfering compounds such as (2) Parathion methyl, (3) quercetin, (4) 4-nitrophenol, (5) theobromine, (6) 2-nitrophenol, (7) roxarsone and (8) Hg2+; Figure S3: (a) Repeatability (b) reproducibility and (c) cyclic stability analysis of Zn2SnO4/SnO2 modified electrodes in 0.1 M PB in the presence of 20 µM EP; Table S1: Recovery ranges of EP in spiked samples.

Author Contributions

Conceptualization, L.V. and S.-F.W.; methodology, L.V.; validation, L.V. and S.-F.W.; formal analysis, L.V. and S.-F.W.; investigation, L.V.; resources, L.V. and S.-F.W.; data curation, L.V.; writing—original draft preparation, L.V.; writing—review and editing, L.V. and S.-F.W.; visualization, L.V. and S.-F.W.; supervision, S.-F.W.; project administration, S.-F.W.; funding acquisition, S.-F.W. All authors have read and agreed to the published version of the manuscript.

Funding

The authors are thankful to the Ministry of Science and Technology (Special Research Project-MOST-108-2221-E-027-063) and National Taipei University of Technology, Taiwan, for the research grants.

Institutional Review Board Statement

Not applicable.

Informed Consent Statement

Not applicable.

Data Availability Statement

Data sharing not applicable.

Conflicts of Interest

The authors declare no conflicts of interest.

References

  1. Kogularasu, S.K.; Sriram, B.; Chang-Chien, G.P.; Wang, S.F.; Ahammad, F.N.U.; Billey, W.; Platero, J.S.; Soundappan, T.; Sekhar, P. Advances in Electrochemical Sensors: Improving Food Safety, Quality, and Traceability. ECS Sens. Plus 2024, 3, 020605. [Google Scholar]
  2. Huang, B.; Zhang, W.D.; Chen, C.H.; Yu, Y.X. Electrochemical determination of methyl parathion at a Pd/MWCNTs-modified electrode. Microchim. Acta 2010, 171, 57–62. [Google Scholar] [CrossRef]
  3. Wei, L.; Huang, X.; Yan, F.; Zheng, L.; Wang, J.; Xie, L.; Ya, Y. Al-doped mesoporous cellular foam modified electrode as sensor for the detection of parathion pesticide. Int. J. Electrochem. Sci. 2019, 14, 1986–1996. [Google Scholar] [CrossRef]
  4. Piovesan, J.V.; Haddad, V.F.; Pereira, D.F.; Spinelli, A. Magnetite nanoparticles/chitosan-modified glassy carbon electrode for non-enzymatic detection of the endocrine disruptor parathion by cathodic square-wave voltammetry. J. Electroanal. Chem. 2018, 823, 617–623. [Google Scholar] [CrossRef]
  5. Mutharani, B.; Ranganathan, P.; Chen, S.M.; Karuppiah, C. Enzyme-free electrochemical detection of nanomolar levels of the organophosphorus pesticide paraoxon-ethyl by using a poly(N-isopropyl acrylamide)-chitosan microgel decorated with palladium nanoparticles. Microchim. Acta 2019, 186, 167. [Google Scholar]
  6. Wei, X.H.; Li, C.; Wang, C.; Lin, S.; Wu, J.; Guo, M.J. Rapid and destructive adsorption of paraoxon-ethyl toxin via a self-detoxifying hybrid electrospun nanofibrous membrane. Chem. Eng. J. 2018, 351, 31–39. [Google Scholar] [CrossRef]
  7. Zhao, L.; Deng, C.; Xue, S.; Liu, H.; Hao, L.; Zhu, M. Multifunctional g-C3N4/Ag NPs intercalated GO composite membrane for SERS detection and photocatalytic degradation of paraoxon-ethyl. Chem. Eng. J. 2020, 402, 126223. [Google Scholar]
  8. Deo, R.P.; Wang, J.; Block, I.; Mulchandani, A.; Joshi, K.A.; Trojanowicz, M.; Scholz, F.; Chen, W.; Lin, Y. Determination of organophosphate pesticides at a carbon nanotube/organophosphorus hydrolase electrochemical biosensor. Anal. Chim. Acta 2005, 530, 185–189. [Google Scholar] [CrossRef]
  9. Wang, J.; Chen, L.; Mulchandani, A.; Mulchandani, P.; Chen, W. Remote biosensor for in-situ monitoring of organophosphate nerve agents. Electroanal. Int. J. Devoted Fundam. Pract. Asp. Electroanal. 1999, 11, 866–869. [Google Scholar]
  10. Eyer, F.; Meischner, V.; Kiderlen, D.; Thiermann, H.; Worek, F.; Haberkorn, M.; Felgenhauer, N.; Zilker, T.; Eyer, P. Human parathion poisoning: A toxicokinetic analysis. Toxicol. Rev. 2003, 22, 143–163. [Google Scholar] [CrossRef]
  11. Kokulnathan, T.; Wang, T.J.; Ahmed, F. Construction of two-dimensional molybdenum carbide based electrocatalyst for real-time monitoring of parathion-ethyl. J. Environ. Chem. Eng. 2021, 9, 106537. [Google Scholar] [CrossRef]
  12. Pilvenyte, G.; Ratautaite, V.; Boguzaite, R.; Ramanavicius, S.; Chen, C.F.; Viter, R.; Ramanavicius, A. Molecularly imprinted polymer-based electrochemical sensors for the diagnosis of infectious diseases. Biosensors 2023, 13, 620. [Google Scholar] [CrossRef] [PubMed]
  13. Qian, L.; Durairaj, S.; Prins, S.; Chen, A. Nanomaterial-based electrochemical sensors and biosensors for the detection of pharmaceutical compounds. Biosens. Bioelectron. 2021, 175, 112836. [Google Scholar] [CrossRef] [PubMed]
  14. Meskher, H.; Ragdi, T.; Thakur, A.K.; Ha, S.; Khelfaoui, I.; Sathyamurthy, R.; Sharshir, S.W.; Pandey, A.K.; Saidur, R.; Singh, P.; et al. A review on CNTs-based electrochemical sensors and biosensors: Unique properties and potential applications. Crit. Rev. Anal. Chem. 2024, 54, 2398–2421. [Google Scholar] [CrossRef]
  15. Radha, A.; Wang, S.F. Strontium stannate nanoparticles decorated on graphitic carbon nitride sheets for the electrochemical detection of 3-nitro-L-tyrosine. Environ. Sci. Nano 2024, 11, 4337–4347. [Google Scholar] [CrossRef]
  16. Akila, B.; Kanna Sharma, T.S.; Sakthinathan, S.; Jana, J.; George, M.; Chiu, T.W.; Choi, W.M. Synthesis of Functionalized Boron Nitride Decorated on Erbium Vanadate (ErVO4) Composite for Electrochemical Detection of Nitrofurazone in Environmental Samples. ACS Sustain. Chem. Eng. 2024, 12, 6473–6484. [Google Scholar] [CrossRef]
  17. Saha, C.; Bhushan, M.; Singh, L.R. Pesticide sensing using electrochemical techniques: A comprehensive review. J. Iran. Chem. Soc. 2023, 20, 243–256. [Google Scholar] [CrossRef]
  18. Sharma, T.S.K.; Jana, J.; Bhamu, K.C.; Song, J.; Sivaselvam, S.; Van Tam, T.; Kang, S.G.; Chung, J.S.; Hur, S.H.; Choi, W.M. Rational synthesis of alkaline earth metal vanadates: Structural origin of MgVO3 honeycomb lattice system and its electrochemical analysis for the detection of sulfadiazine. Chem. Eng. J. 2023, 464, 142673. [Google Scholar] [CrossRef]
  19. Alagumalai, K.; Shanmugam, R.; Chen, S.M.; Thirumalraj, B.; Haidyrah, A.S.; Karuppiah, C. Impact of gadolinium oxide with functionalized carbon nanosphere: A portable advanced electrocatalyst for pesticide detection in aqueous environmental samples. Talanta 2022, 238, 123028. [Google Scholar] [CrossRef]
  20. Hu, J.; Xiong, X.; Guan, W.; Tan, C. Hollow mesoporous SnO2/Zn2SnO4 heterojunction and RGO decoration for high-performance detection of acetone. ACS Appl. Mater. Interfaces 2022, 14, 55249–55263. [Google Scholar] [CrossRef]
  21. Young, D.L.; Williamson, D.L.; Coutts, T.J. Structural characterization of zinc stannate thin films. J. Appl. Phys. 2002, 91, 1464–1471. [Google Scholar] [CrossRef]
  22. Sukanya, R.; Balamurugan, K.; Chen, S.M.; Rajakumaran, R.; Muthupandi, K.; Shim, J.J.; Breslin, C.B. Fabrication of a selective sensor amplification probe modified with multi-component Zn2SnO4/SnO2 heterostructured microparticles as a robust electrocatalyst for electrochemical detection of antibacterial drug secnidazole. Materials 2021, 14, 6700. [Google Scholar] [CrossRef] [PubMed]
  23. Wang, D.; Wang, W.; Zhu, Z.; Sun, P.; Ma, J.; Lu, G. Phase investigation on zinc–tin composite crystallites. RSC Adv. 2013, 3, 12084–12087. [Google Scholar] [CrossRef]
  24. Ali, M.B.; Barka-Bouaifel, F.; Elhouichet, H.; Sieber, B.; Addad, A.; Boussekey, L.; Férid, M.; Boukherroub, R. Hydrothermal synthesis, phase structure, optical and photocatalytic properties of Zn2SnO4 nanoparticles. J. Colloid Interface Sci. 2015, 457, 360–369. [Google Scholar]
  25. Zhu, H.; Yang, D.; Yu, G.; Zhang, H.; Jin, D.; Yao, K. Hydrothermal synthesis of Zn2SnO4 nanorods in the diameter regime of sub-5 nm and their properties. J. Phys. Chem. B 2006, 110, 7631–7634. [Google Scholar] [CrossRef]
  26. Zeng, J.; Xin, M.; Li, K.; Wang, H.; Yan, H.; Zhang, W. Transformation process and photocatalytic activities of hydrothermally synthesized Zn2SnO4 nanocrystals. J. Phys. Chem. C 2008, 112, 4159–4167. [Google Scholar] [CrossRef]
  27. Wang, Y.; Xu, F.; Sun, L.; Li, Y.; Liao, L.; Guan, Y.; Lao, J.; Yang, Y.; Zhou, T.; Wang, Y.; et al. A highly active Z-scheme SnS/Zn2SnO4 photocatalyst fabricated for methylene blue degradation. RSC Adv. 2022, 12, 31985–31995. [Google Scholar] [CrossRef]
  28. Shangguan, C.; Wei, X.; Dong, M.; Li, Y.; Zhu, L.; Wang, J.; You, R. Micro-spherical SnO2/Zn2SnO4 heterojunction for sensitive and selective detection of hydrogen sulfide. Appl. Surf. Sci. 2024, 669, 160518. [Google Scholar] [CrossRef]
  29. Liu, R.; Du, W.; Chen, Q.; Gao, F.; Wei, C.; Sun, J.; Lu, Q. Fabrication of Zn2 SnO4/SnO2 hollow spheres and their application in dye-sensitized solar cells. RSC Adv. 2013, 3, 2893–2896. [Google Scholar] [CrossRef]
  30. Xu, C.; Wu, K.; Hu, S.; Cui, D. Electrochemical detection of parathion at a glassy-carbon electrode modified with hexadecane. Anal. Bioanal. Chem. 2002, 373, 284–288. [Google Scholar] [CrossRef] [PubMed]
  31. Liu, X. Electrochemical sensor for determination of parathion based on electropolymerization poly(safranine) film electrode. Int. J. Electrochem. 2011, 2011, 986494. [Google Scholar] [CrossRef]
Figure 1. (a) Schematic illustration of the synthesis of Zn2SnO4/SnO2 nanoparticles. (bd) Different magnification images of Zn2SnO4/SnO2 heterostructures. (d) Lattice fringes and (e) SAED patterns of Zn2SnO4/SnO2 heterostructures.
Sensors 25 02837 g001
Figure 2. (a) The XRD pattern of cubic Zn2SnO4/SnO2 heterostructure. (b) Raman and (c) FTIR spectrum of Zn2SnO4/SnO2 heterostructure.
Sensors 25 02837 g002
Figure 3. (a,b) CV profiles of bare GCE and Zn2SnO4/SnO2/GCE were shown in a solution containing 5 mM [Fe(CN)6]3−/4− and 0.1 M KCl. (c) CV measurements of Zn2SnO4/SnO2/GCE at different scan rates (0.02 Vs−1 to 0.22 Vs−1) in 5 mM [Fe(CN)6]3−/4− and 0.1 M KCl and linear plot of peak current vs. square root of the scan rates (d).
Sensors 25 02837 g003
Figure 4. (a) CV profiles of bare and Zn2SnO4-modified electrodes in 150 µM EP and (b) bar diagrams of peak current show an improvement in current response with the (i) bare/GCE and (ii) Zn2SnO4/SnO2/GCE-modified electrode. (c) CV profiles of Zn2SnO4/SnO2/GCE-modified electrode at different pH values and (d) the plots of peak current (green) and peak potential (blue) vs. pH. (e) CV profiles of Zn2SnO4/SnO2/GCE with different loading amounts (4, 6, 8, and 10 μL) and (f) bar diagrams of peak current reveal that the 6 μL loading amount produces the maximum current response, while 4, 8, and 10 μL result in lower current responses. All experiments were performed in 0.1 M phosphate buffer (pH 7.0) at a scan rate of 0.05 Vs−1, except pH study.
Sensors 25 02837 g004
Figure 5. (a) CV curves of Zn2SnO4/SnO2/GCE at different concentrations of EP show an increase in peak currents with higher concentrations and (b) the calibration plot of current versus concentration display a clear linear relationship, ensuring reliable quantification. (c) CV curves at various scan rates for 150 µM EP in pH 7.0 show a proportional increase in peak current with the scan rate and (d) the linear plot of current (µA) versus scan rate (Vs−1).
Sensors 25 02837 g005
Scheme 1. The electrochemical reduction/oxidation reaction of EP at Zn2SnO4/SnO2/GCE.
Sensors 25 02837 sch001
Figure 6. (a) DPV curves of Zn2SnO4/SnO2/GCE with the concentration range of EP from 0.01 to 78.4 µM in a 0.1 M PB solution and (b) the linear plot of peak current vs. EP concentration.
Sensors 25 02837 g006
Table 1. Comparison of analytical results for the detection of EP with the proposed electrode.
MaterialsLinear Ranges (µM)LOD (µM)Ref.
CS-FeO0.34–4.460.187 µM[4]
AA-P3TAA0.5–1000.5 µM[6]
Silver nanoparticle-modified electrode0.0412–7.900.0412 µM[30]
Carbon nanoparticles and halloysite nanoclay modified CPE0.0012–4.810.00038 µM[31]
Zn2SnO4/SnO2/GCE0.01–8.7; 8.7–78.40.0059 µMThis work
Disclaimer/Publisher’s Note: The statements, opinions and data contained in all publications are solely those of the individual author(s) and contributor(s) and not of MDPI and/or the editor(s). MDPI and/or the editor(s) disclaim responsibility for any injury to people or property resulting from any ideas, methods, instructions or products referred to in the content.

