
Validity of the Quarq Cycling Power Meter

 , , and
Abstract
1. Introduction
2. Materials and Methods
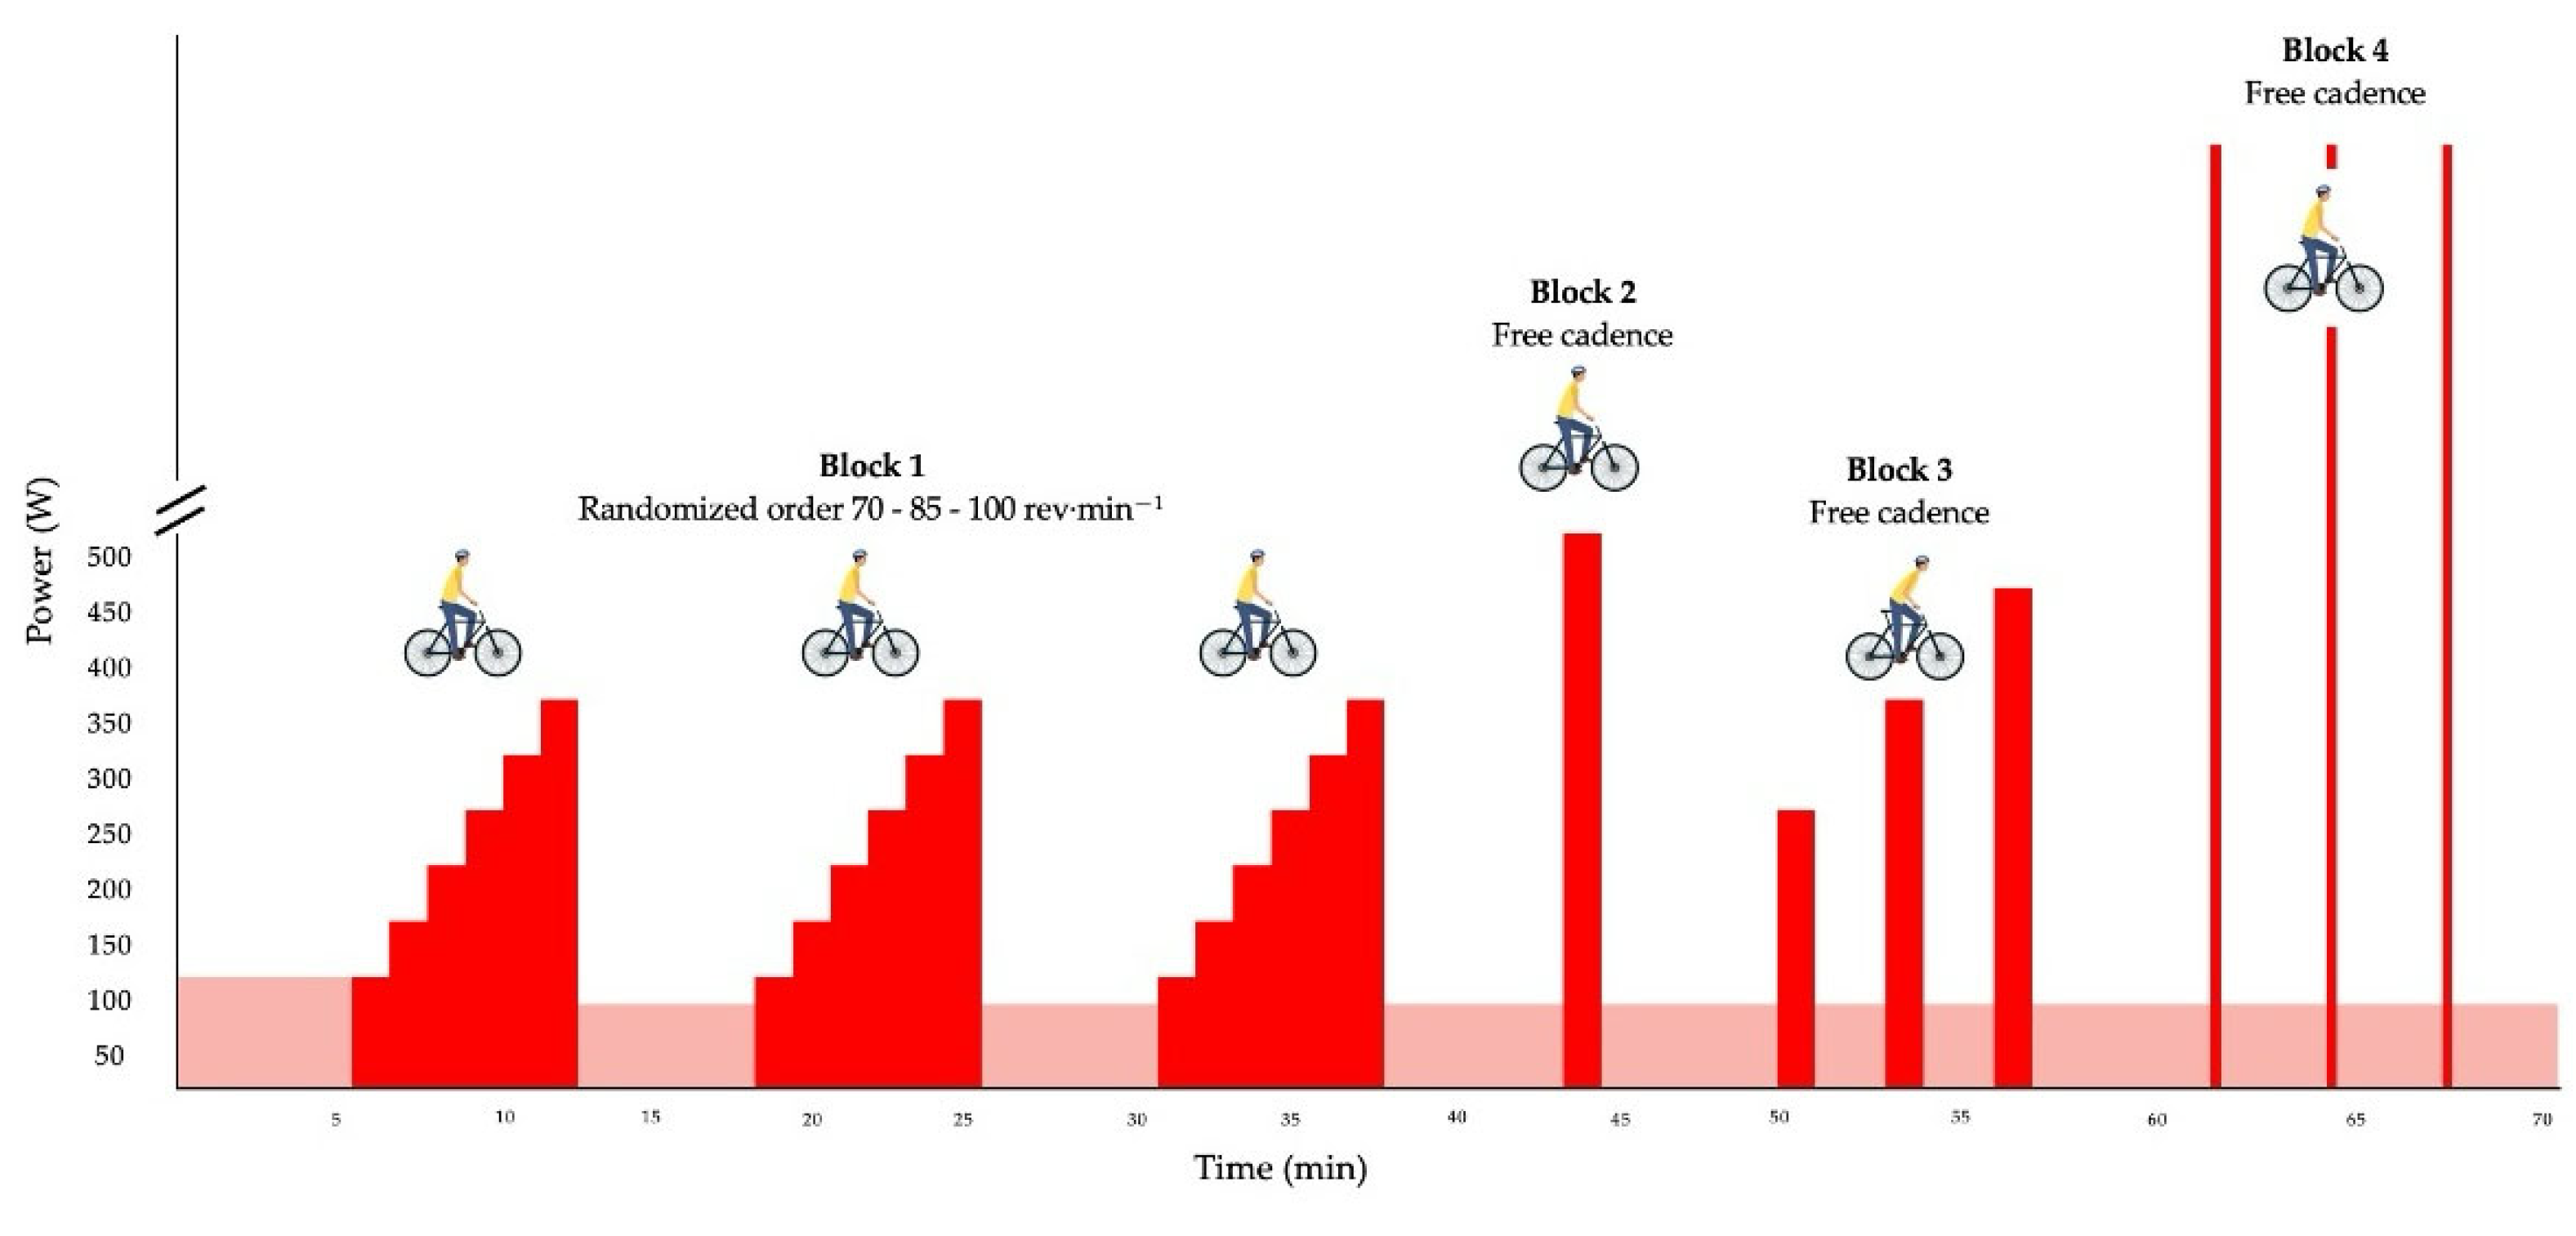
2.1. Experimental Approach to the Problem
2.2. Participants
2.3. Procedures
2.4. Data Analysis
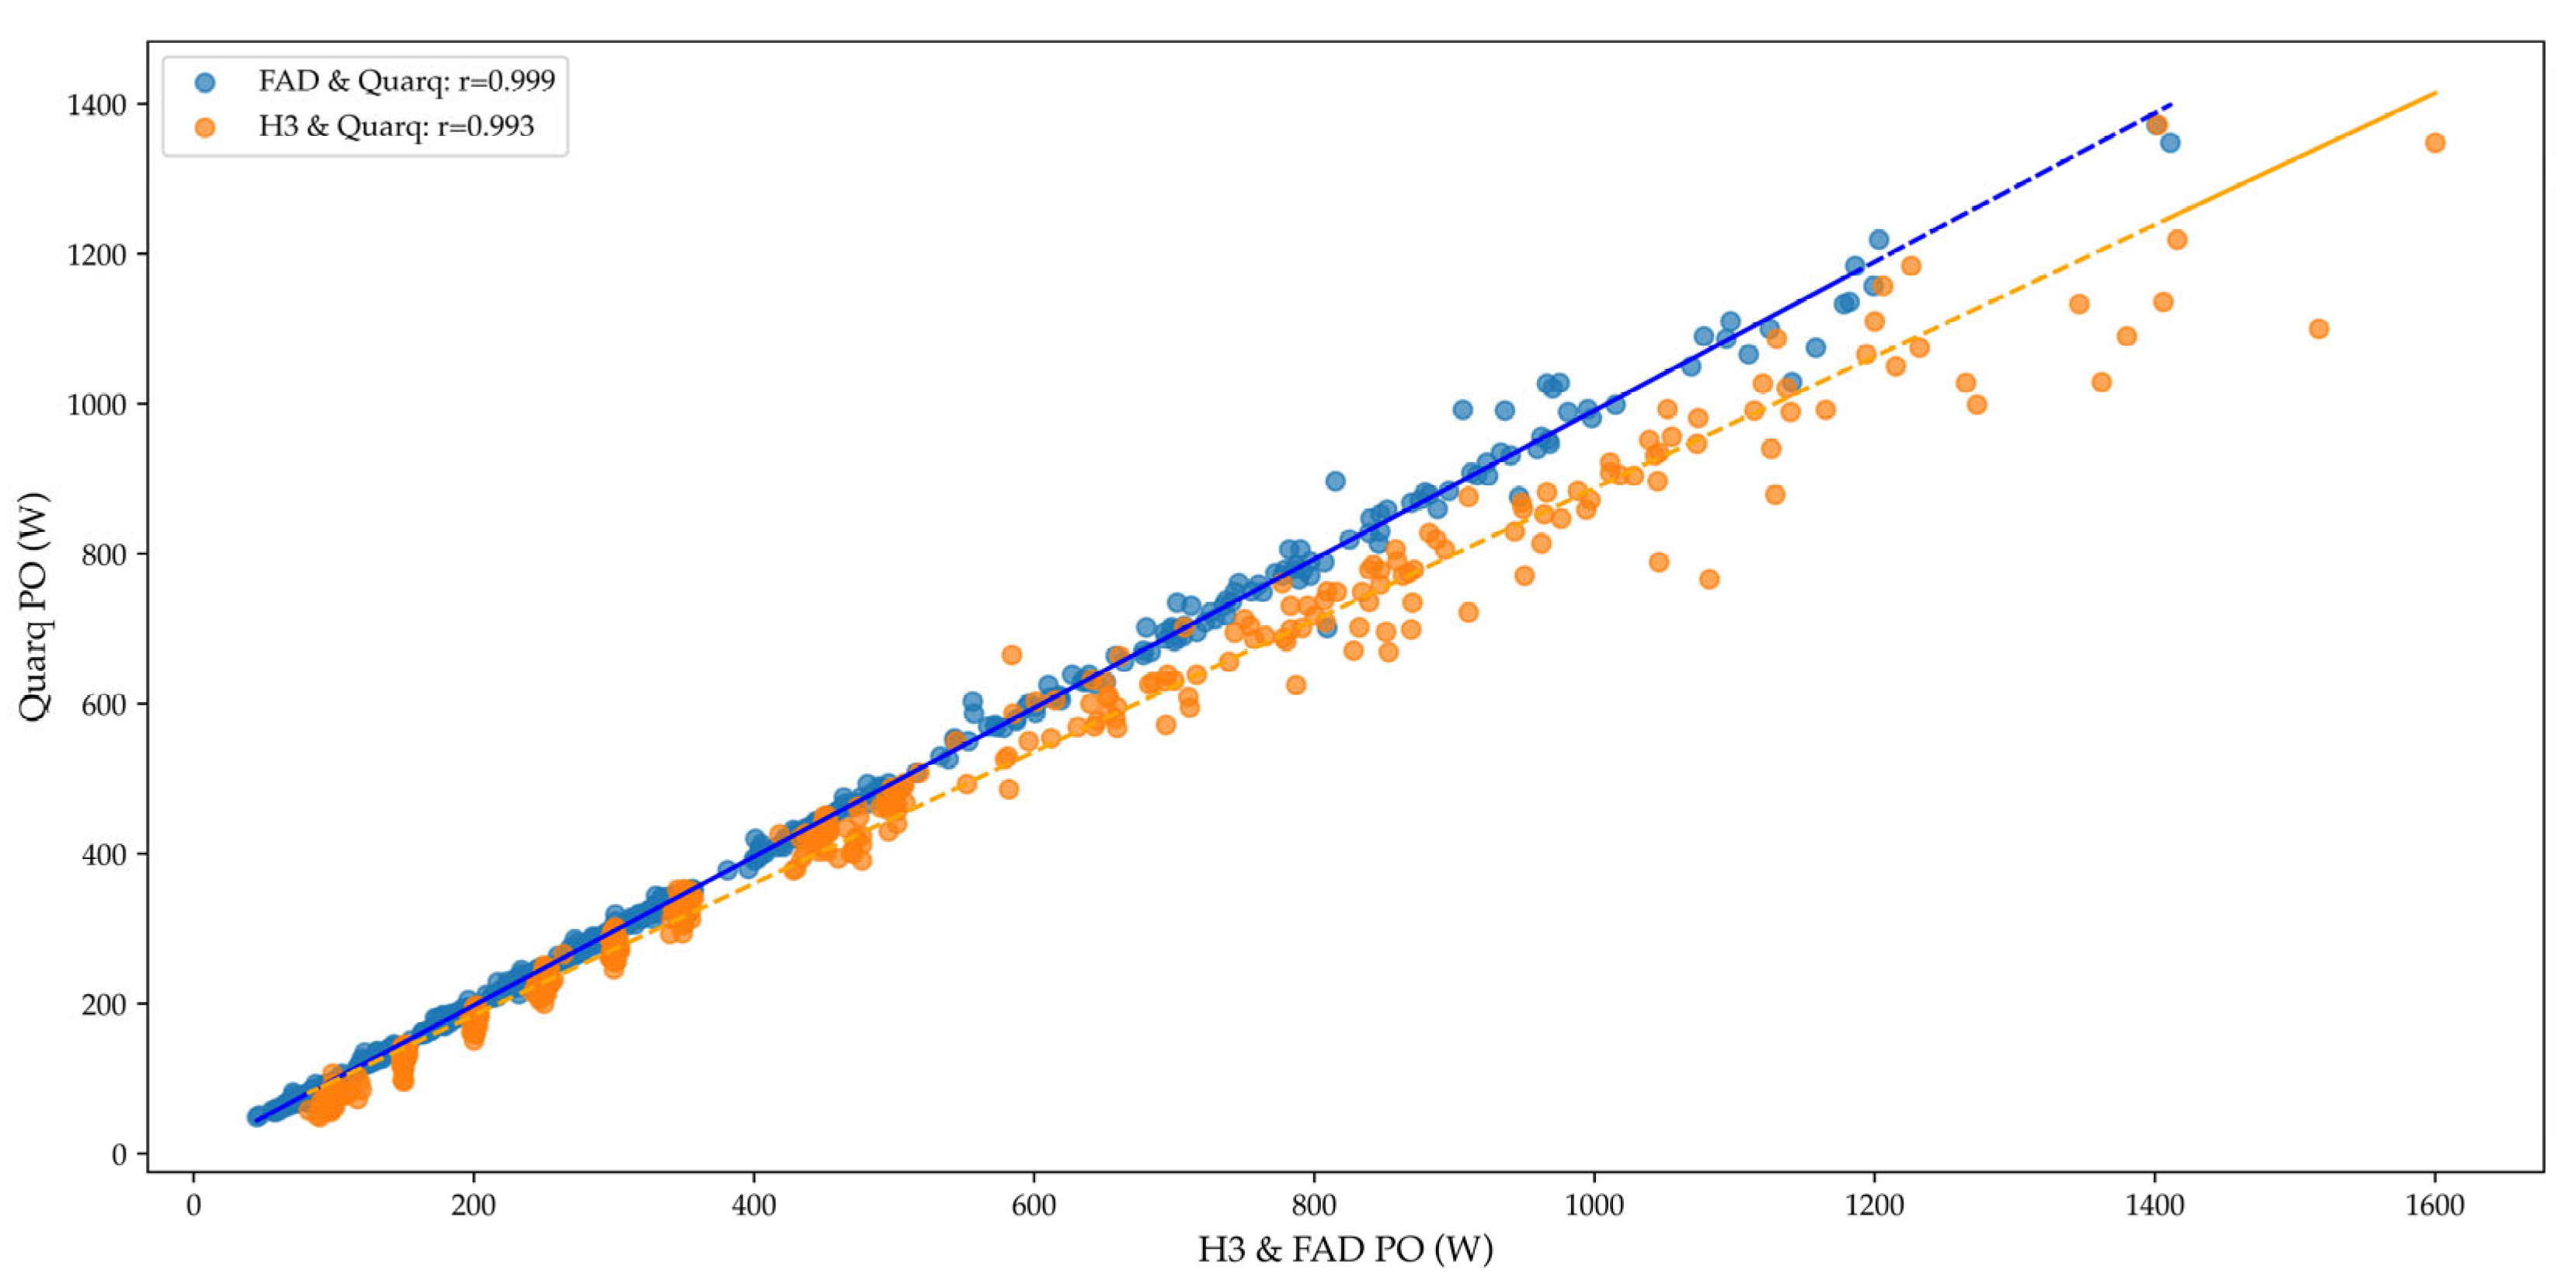
3. Results
4. Discussion
5. Conclusions
Author Contributions
Funding
Institutional Review Board Statement
Informed Consent Statement
Data Availability Statement
Acknowledgments
Conflicts of Interest
References
- Mujika, I. Quantification of training and competition loads in endurance sports: Methods and applications. Int. J. Sports Physiol. Perform 2017, 12, S2-9–S2-17. [Google Scholar] [CrossRef] [PubMed]
- Lillo-Bevia, J.R.; Pallarés, J.G. Validity and reliability of the cycleops hammer cycle ergometer. Int. J. Sports Physiol. Perform 2018, 13, 853–859. [Google Scholar] [CrossRef] [PubMed]
- Sitko, S.; Cirer-Sastre, R.; Corbi, F.; López-Laval, I. Power assessment in road cycling: A narrative review. Sustainability 2020, 12, 5216. [Google Scholar] [CrossRef]
- Bouillod, A.; Soto-Romero, G.; Grappe, F.; Bertucci, W.; Brunet, E.; Cassirame, J. Caveats and recommendations to assess the validity and reliability of cycling power meters: A systematic scoping review. Sensors 2022, 22, 386. [Google Scholar] [CrossRef]
- Valenzuela, P.L.; Montalvo-Perez, A.; Alejo, L.B.; Castellanos, M.; Gil-Cabrera, J.; Talavera, E.; Lucia, A.; Barranco-Gil, D. Are unilateral devices valid for power output determination in cycling? insights from the favero assioma power meter. Int. J. Sports Physiol. Perform 2022, 17, 484–488. [Google Scholar] [CrossRef]
- Linnamo, V. Sensor Technology for Sports Monitoring. Sensors 2023, 23, 572. [Google Scholar] [CrossRef]
- Quarq. Available online: https://www.sram.com/en/quarq (accessed on 28 October 2024).
- Miller, M.C.; Macdermid, P.W.; Fink, P.W.; Stannard, S.R. Agreement between powertap, quarq and stages power meters for cross-country mountain biking. Sports Technol. 2015, 8, 44–50. [Google Scholar] [CrossRef]
- Montalvo-Pérez, A.; Alejo, L.B.; Valenzuela, P.L.; Castellanos, M.; Gil-Cabrera, J.; Talavera, E.; Lucia, A.; Barranco-Gil, D. Validity of the favero assioma duo power pedal system for measuring power output and cadence. Sensors 2021, 21, 2277. [Google Scholar] [CrossRef]
- Rodríguez-Rielves, V.; Lillo-Beviá, J.R.; Buendía-Romero, Á.; Martínez-Cava, A.; Hernández-Belmonte, A.; Courel-Ibáñez, J.; Pallarés, J.G. Are the assioma favero power meter pedals a reliable tool for monitoring cycling power output? Sensors 2021, 21, 2789. [Google Scholar] [CrossRef]
- Jones, S.L.P.; Passfield, L. The dynamic calibration of bicycle power measuring cranks. Eng. Sport. 1998, 265–274. Available online: https://kar.kent.ac.uk/id/eprint/27863 (accessed on 2 February 2025).
- Balmer, J.; Bird, S.R.; Davison, R.R.; Doherty, M.; Smith, P.M. Mechanically braked wingate powers: Agreement between SRM, corrected and conventional methods of measurement. J. Sports Sci. 2004, 22, 661–667. [Google Scholar] [CrossRef]
- Ozkaya, O.; Balci, G.A.; As, H.; Vardarli, E. The test-retest reliability of new generation power indices of wingate all-out test. Sports 2018, 6, 31. [Google Scholar] [CrossRef]
- Hopkins, W.G. Measures of reliability in sports medicine and science. Sports Med. 2000, 30, 1–15. [Google Scholar] [CrossRef] [PubMed]
- Spreadsheets for Analysis of Validity and Reliability. Available online: https://www.sportsci.org/2015/ValidRely.htm (accessed on 28 October 2024).
- Hopkins, W.G.; Marshall, S.W.; Batterham, A.M.; Hanin, J. Progressive statistics for studies in sports medicine and exercise science. Med. Sci. Sports Exerc. 2009, 41, 3–13. [Google Scholar] [CrossRef] [PubMed]
- Bertucci, W. Analysis of the agreement between the fortius cycling ergometer and the powertap powermeter PO during time trials of 6 and 30 min. Comput. Methods Biomech. Biomed. Eng. 2012, 15, 212–214. [Google Scholar] [CrossRef]
- Dickinson, T.; Wright, J. The reliability and accuracy of the garmin vector 3 power pedals. Proc. Inst. Mech. Eng. Part P J. Sports Eng. Technol. 2021, 235, 70–74. [Google Scholar] [CrossRef]
- Yeh, M.C.; Chen, W.H.; Lu, S.T.; Chen, C.H.; Liu, Y.C.; Liu, C. Validity of the favero assioma duo power pedal system in maximal-effort cycling tests. Int. J. Sports Physiol. Perform 2022, 17, 800–805. [Google Scholar] [CrossRef]
- Frémeaux, M.; Bouillod, A.; Brunet, E.; Soto-Romero, G.; Grappe, F. Accuracy and reproducibility of the new cycleops hammer direct drive trainer. J. Sci. Cycl. 2017, 6, 23–24. [Google Scholar]
- Bertucci, W.; Duc, S.; Villerius, V.; Pernin, J.N.; Grappe, F. Validity and reliability of the powertap mobile cycling powermeter when compared with the SRM device. Int. J. Sports Med. 2005, 26, 868–873. [Google Scholar] [CrossRef]
- Bouillod, A.; Pinot, J.; Soto-Romero, G.; Bertucci, W.; Grappe, F. Validity, sensitivity, reproducibility, and robustness of the powertap, stages, and garmin vector power meters in comparison with the SRM device. Int. J. Sports Physiol. Perform 2017, 12, 1023–1030. [Google Scholar] [CrossRef]
- Novak, A.R.; Dascombe, B.J. Agreement of power measures between garmin vector and SRM cycle power meters. Meas. Phys. Educ. Exerc. Sci. 2016, 20, 167–172. [Google Scholar] [CrossRef]
- Pallarés, J.G.; Lillo-Bevia, J.R. Validity and reliability of the powertap P1 pedals power meter. J. Sports Sci. Med. 2018, 17, 305–311. [Google Scholar] [PubMed]
- Hopkins, W.G. A New View of Statistics. Available online: https://www.sportsci.org/resource/stats/newview.html (accessed on 2 February 2025).
- Paton, C.D.; Hopkins, W.G. Tests of cycling performance. Sports Med. 2001, 31, 489–496. [Google Scholar] [CrossRef] [PubMed]
- Maier, T.; Schmid, L.; Müller, B.; Steiner, T.; Wehrlin, J. Accuracy of cycling power meters against a mathematical model of treadmill cycling. Int. J. Sports Med. 2017, 38, 456–461. [Google Scholar] [CrossRef] [PubMed]
- Valenzuela, P.L.; Muriel, X.; van Erp, T.; Mateo-March, M.; Gandia-Soriano, A.; Zabala, M.; Lamberts, R.P.; Lucia, A.; Barranco-Gil, D.; Pallarés, J.G. The Record Power Profile of Male Professional Cyclists: Normative values obtained from a large database. Int. J. Sports Physiol. Perform. 2022, 17, 701–710. [Google Scholar] [CrossRef]
- Mateo-March, M.; van Erp, T.; Muriel, X.; Valenzuela, P.L.; Zabala, M.; Lamberts, R.P.; Lucia, A.; Barranco-Gil, D.; Pallarés, J.G. The record power profile in professional female cyclists: Normative values obtained from a large database. Int. J. Sports Physiol. Perform. 2022, 17, 682–686. [Google Scholar] [CrossRef]


| QUARQ (W) | FAD (W) | H3 (W) | p-Value Power Meter | Effect Size ηp2 Power Meter | p-Value Bonferroni Power Meter | p-Value PO × Power Meter | Effect Size ηp2 PO × Power Meter | p-Value Bonferroni PO × Power Meter | |||||
|---|---|---|---|---|---|---|---|---|---|---|---|---|---|
| Mean ± SD | Mean ± SD | Mean ± SD | Q-FAD | Q-H3 | FAD-Q | H3-Q | |||||||
| 70 rev·min−1 | Sitting | 100 W | 73.6 ± 12.7 | 74.7 ± 13.7 | 96.3 ± 4.6 | <0.001 | 0.516 | 0.785 | <0.001 | <0.001 | 0.318 | 1.00 | <0.001 |
| 150 W | 134.8 ± 7.2 | 136.9 ± 7.6 | 149.8 ± 0.8 | 1.00 | <0.001 | ||||||||
| 200 W | 184.3 ± 6.5 | 186.1 ± 6.8 | 199.9 ± 1.1 | 1.00 | <0.001 | ||||||||
| 250 W | 239.7 ± 6.7 | 241.3 ± 7.5 | 250.5 ± 1.1 | 1.00 | <0.001 | ||||||||
| 300 W | 290.3 ± 6.3 | 292.0 ± 7.2 | 299.9 ± 1.0 | 1.00 | <0.001 | ||||||||
| 350 W | 341.7 ± 6.8 | 343.7 ± 7.3 | 349.6 ± 1.6 | 1.00 | <0.001 | ||||||||
| 85 rev·min−1 | Sitting | 100 W | 74.2 ± 8.7 | 76.3 ± 8.5 | 99.0 ± 2.01 | <0.001 | 0.732 | 0.539 | <0.001 | <0.001 | 0.115 | 1.00 | <0.001 |
| 150 W | 129.5 ± 7.2 | 131.0 ± 7.4 | 150.4 ± 0.9 | 1.00 | <0.001 | ||||||||
| 200 W | 181.7 ± 6.7 | 183.4 ± 7.1 | 200.6 ± 1.4 | 1.00 | <0.001 | ||||||||
| 250 W | 228.2 ± 7.8 | 230.3 ± 8.1 | 250.4 ± 1.2 | 1.00 | <0.001 | ||||||||
| 300 W | 281.5 ± 8.4 | 283.7 ± 8.5 | 300.1 ± 1.5 | 1.00 | <0.001 | ||||||||
| 350 W | 333.4 ± 8.6 | 335.3 ± 9.1 | 349.7 ± 2.2 | 1.00 | <0.001 | ||||||||
| 100 rev·min−1 | Sitting | 100 W | 82.5 ± 6.5 | 85.3 ± 7.3 | 104.7 ± 6.5 | <0.001 | 0.776 | 0.181 | <0.001 | <0.001 | 0.077 | 1.00 | <0.001 |
| 150 W | 124.7 ± 11.8 | 127.5 ± 11.5 | 150.3 ± 1.2 | 1.00 | <0.001 | ||||||||
| 200 W | 172.4 ± 9.3 | 175.4 ± 9.0 | 200.5 ± 0.9 | 1.00 | <0.001 | ||||||||
| 250 W | 223.7 ± 8.9 | 227.4 ± 8.6 | 250.5 ± 1.6 | 1.00 | <0.001 | ||||||||
| 300 W | 269.4 ± 9.5 | 273.0 ± 9.5 | 300.5 ± 1.8 | 1.00 | <0.001 | ||||||||
| 350 W | 320.5 ± 10.3 | 323.8 ± 11.2 | 349.7 ± 2.2 | 1.00 | <0.001 | ||||||||
| Free | Sitting | 500 W | 450.3 ± 32.6 | 454.5 ± 31.5 | 489.5 ± 15.3 | <0.001 | 0.758 | <0.001 | <0.001 | <0.001 | - | - | - |
| Free | Standing | 250 W | 227.2 ± 13.1 | 232.9 ± 14.9 | 249 ± 4.2 | <0.001 | 0.413 | 0.322 | <0.001 | <0.001 | 0.004 | 1.00 | <0.001 |
| 350 W | 327.4 ± 12.7 | 331.9 ± 14.5 | 348.4 ± 3.4 | 1.00 | <0.001 | ||||||||
| 450 W | 422.3 ± 18.1 | 426.6 ± 18.8 | 444.8 ± 8.7 | 1.00 | <0.001 | ||||||||
| Free | Sitting | 10 s all-out | 775.0 ± 183.2 | 781.8 ± 182.8 | 846.0 ± 201.6 | 0.150 | 0.041 | 1.00 | 0.256 | 0.803 | 0.009 | 1.00 | 1.00 |
| 10 s all-out | 758.1 ± 165.5 | 757.9 ± 164.9 | 834.1 ± 185.3 | 1.00 | 1.00 | ||||||||
| 10 s all-out | 750.5 ± 156.6 | 753.8 ± 161 | 833.7 ± 180.0 | 1.00 | 1.00 | ||||||||
| Free | Sitting | Pmax | 894.4 ± 209.1 | 906.3 ± 221.9 | 1073.4 ± 262.3 | <0.001 | 0.767 | 0.102 | <0.001 | <0.001 | - | - | - |
| TEM (W) | CV% | Pearson r-Value | CCI | Bland–Altman (Bias ± DE Bias) | ||||||||
|---|---|---|---|---|---|---|---|---|---|---|---|---|
| FAD-Q | H3-Q | FAD-Q | H3-Q | FAD-Q | H3-Q | FAD-Q | H3-Q | FAD-Q | H3-Q | |||
| 70 rev·min−1 | Sitting | 100 W | 2.73 | 3.5 | 3.68% | 4.12% | 0.981 | 0.662 | 0.979 | 0.429 | 1.1 ± 2.8 LoA (−4.3 to 6.5) | 22.7 ± 10.3 LoA (−2.5 to 43.0) |
| 150 W | 2.50 | 0.79 | 1.84% | 0.55% | 0.948 | 0.127 | 0.949 | 0.028 | 2.1 ± 2.5 LoA (−2.7 to 6.9) | 15.0 ± 7.1 LoA (1.0 to 29.0) | ||
| 200 W | 2.40 | 1.14 | 1.30% | 0.60% | 0.941 | 0.197 | 0.941 | 0.069 | 1.8 ± 2.36 LoA (−2.9 to 6.4) | 15.6 ± 6.4 LoA (3.1 to 28.1) | ||
| 250 W | 2.52 | 1.09 | 1.05% | 0.45% | 0.96 | 0.291 | 0.942 | 0.097 | 1.55 ± 2.50 LoA (−3.4 to 6.5) | 10.8 ± 6.4 LoA (−1.9 to 23.4) | ||
| 300 W | 2.67 | 0.99 | 0.92% | 0.34% | 0.933 | 0.077 | 0.927 | 0.024 | 1.7 ± 2.7 LoA (−3.5 to 7) | 9.6 ± 6.3 LoA (−2.7 to 21.9) | ||
| 350 W | 2.25 | 1.64 | 0.66% | 0.47% | 0.955 | −0.009 | 0.954 | −0.004 | 2.0 ± 2.22 LoA (−2.4 to 6.4) | 7.9 ± 7.0 LoA (−5.8 to 21.6) | ||
| 85 rev·min−1 | Sitting | 100 W | 3.68 | 1.89 | 4.89% | 2.20% | 0.907 | 0.383 | 0.910 | 0.226 | 2.1 ± 3.8 LoA (−5.3 to 9.4) | 25.9 ± 5.9 LoA (14.41 to 37.39) |
| 150 W | 2.92 | 0.87 | 2.24% | 0.62% | 0.924 | 0.267 | 0.927 | 0.066 | 1.6 ± 2.9 LoA (−4.1 to 7.3) | 20.7 ± 7.1 LoA (6.9 to 34.6) | ||
| 200 W | 3.10 | 1.42 | 1.70% | 0.74% | 0.906 | 0.098 | 0.907 | 0.040 | 1.7 ± 3.1 LoA (−4.3 to 7.7) | 18.9 ± 6.7 LoA (5.9 to 32) | ||
| 250 W | 3.27 | 1.24 | 1.43% | 0.52% | 0.921 | 0.158 | 0.923 | 0.049 | 2.1 ± 3.2 LoA (−4.3 to 8.4) | 22.3 ± 7.7 LoA (7.1 to 37.4) | ||
| 300 W | 4.00 | 1.47 | 1.42% | 0.51% | 0.891 | 0.114 | 0.894 | 0.039 | 2.2 ± 4.0 LoA (−5.7 to 10.1) | 18.6 ± 8.3 LoA (2.3 to 34.9) | ||
| 350 W | 3.80 | 2.2 | 1.14% | 0.64% | 0.915 | 0.128 | 0.916 | 0.062 | 1.9 ± 3.8 LoA (−5.4 to 9.3) | 16.3 ± 8.6 LoA (0.6 to 33.1) | ||
| 100 rev·min−1 | Sitting | 100 W | 3.51 | 6.17 | 4.19% | 6.59% | 0.884 | 0.377 | 0.882 | 0.383 | 2.74 ± 3.5 LoA (−4 to 9.5) | 22.1 ± 7.3 LoA (7.83 to 36.4) |
| 150 W | 3.66 | 1.05 | 2.9% | 0.76% | 0.951 | 0.543 | 0.953 | 0.114 | 2.8 ± 3.7 LoA (−4.4 to 10.1) | 25.6 ± 11.2 LoA (3.7 to 47.5) | ||
| 200 W | 3.04 | 0.93 | 1.75% | 0.50% | 0.945 | 0.180 | 0.947 | 0.036 | 3.0 ± 3.1 LoA (−3.1 to 9.1) | 28.1 ± 9.2 LoA (10.1 to 46.2) | ||
| 250 W | 3.90 | 1.59 | 1.73% | 0.67% | 0.899 | 0.099 | 0.902 | 0.035 | 3.7 ± 4.0 LoA (−4.1 to 11.6) | 26.8 ± 8.9 LoA (9.4 to 44.2) | ||
| 300 W | 3.52 | 1.81 | 1.30% | 0.64% | 0.934 | 0.256 | 0.936 | 0.098 | 3.5 ± 3.5 LoA (−3.4 to 10.4) | 31.0 ± 9.2 LoA (13 to 49.1) | ||
| 350 W | 3.73 | 2.14 | 1.17% | 0.64% | 0.946 | 0.356 | 0.944 | 0.151 | 3.3 ± 3.7 LoA (−3.9 to 10.6) | 29.2 ± 9.7 LoA (10.1 to 48.2) | ||
| Free | Sitting | 500 W | 4.80 | 8.5 | 1.06% | 1.81% | 0.989 | 0.843 | 0.989 | 0.659 | 4.2 ± 4.9 LoA (−5.4 to 13.9) | 39.1 ± 21.4 LoA (−2.8 to 81.1) |
| Free | Standing | 250 W | 5.61 | 3.18 | 2.44% | 1.33% | 0.931 | 0.666 | 0.926 | 0.392 | 5.7 ± 5.6 LoA (−5.2 to 16.7) | 21.8 ± 10.8 LoA (0.6 to 42.9) |
| 350 W | 7.02 | 2.61 | 2.13% | 0.77% | 0.883 | 0.666 | 0.879 | 0.341 | 4.5 ± 6.9 LoA (−9.0 to 18.0) | 21.00 ± 10.8 LoA (−0.1 to 42.1) | ||
| 450 W | 6.86 | 7.32 | 1.62% | 1.69% | 0.935 | 0.576 | 0.937 | 0.458 | 4.3 ± 6.8 LoA (−9.0 to 17.6) | 22.5 ± 15.0 LoA (−6.8 to 51.9) | ||
| Free | Sitting | 10-s all-out | 33.01 | 45.31 | 4.24% | 5.59% | 0.985 | 0.976 | 0.985 | 0.973 | 6.8 ± 32.6 LoA (−57.1 to 70.8) | 71.0 ± 46.5 LoA (−20.2 to 162.2) |
| 10-s all-out | 22.22 | 34.15 | 2.93% | 4.29% | 0.991 | 0.984 | 0.992 | 0.979 | −0.2 ± 21.9 LoA (−43.2 to 42.8) | 76.0 ± 37.5 LoA (2.5 to 149.6) | ||
| 10-s all-out | 23.25 | 30.56 | 3.09% | 3.86% | 0.990 | 0.986 | 0.990 | 0.978 | 3.4 ± 23.0 LoA (−41.53 to 48.5) | 83.2 ± 36.6 LoA (11.5 to 155.0) | ||
| Free | Sitting | Pmax | 28.16 | 92.57 | 3.13% | 9.41% | 0.992 | 0.940 | 0.991 | 0.920 | 11.90 ± 29.8 LoA (−46.6 to 70.4) | 179 ± 98.2 LoA (−13.5 to 371.5) |
Disclaimer/Publisher’s Note: The statements, opinions and data contained in all publications are solely those of the individual author(s) and contributor(s) and not of MDPI and/or the editor(s). MDPI and/or the editor(s) disclaim responsibility for any injury to people or property resulting from any ideas, methods, instructions or products referred to in the content. |
© 2025 by the authors. Licensee MDPI, Basel, Switzerland. This article is an open access article distributed under the terms and conditions of the Creative Commons Attribution (CC BY) license (https://creativecommons.org/licenses/by/4.0/).
Share and Cite
Oteo-Gorostidi, J.; Camara, J.; Ojanguren-Rodríguez, D.; Iriberri, J.; Vadillo-Ventura, I.; Montalvo-Pérez, A. Validity of the Quarq Cycling Power Meter. Sensors 2025, 25, 2717. https://doi.org/10.3390/s25092717
Oteo-Gorostidi J, Camara J, Ojanguren-Rodríguez D, Iriberri J, Vadillo-Ventura I, Montalvo-Pérez A. Validity of the Quarq Cycling Power Meter. Sensors. 2025; 25(9):2717. https://doi.org/10.3390/s25092717
Chicago/Turabian StyleOteo-Gorostidi, Jon, Jesús Camara, Diego Ojanguren-Rodríguez, Jon Iriberri, Iván Vadillo-Ventura, and Almudena Montalvo-Pérez. 2025. "Validity of the Quarq Cycling Power Meter" Sensors 25, no. 9: 2717. https://doi.org/10.3390/s25092717
APA StyleOteo-Gorostidi, J., Camara, J., Ojanguren-Rodríguez, D., Iriberri, J., Vadillo-Ventura, I., & Montalvo-Pérez, A. (2025). Validity of the Quarq Cycling Power Meter. Sensors, 25(9), 2717. https://doi.org/10.3390/s25092717