Article

CMOS-Based Implantable Multi-Ion Image Sensor for Mg2+ Measurement in the Brain

Department of Electrical and Electronic Information Engineering, Toyohashi University of Technology, Toyohashi 441-8122, Aichi, Japan
*
Author to whom correspondence should be addressed.
Sensors 2025, 25(8), 2595; https://doi.org/10.3390/s25082595
Submission received: 9 March 2025 / Revised: 31 March 2025 / Accepted: 18 April 2025 / Published: 20 April 2025
(This article belongs to the Section Biosensors)

Abstract

:

Highlights

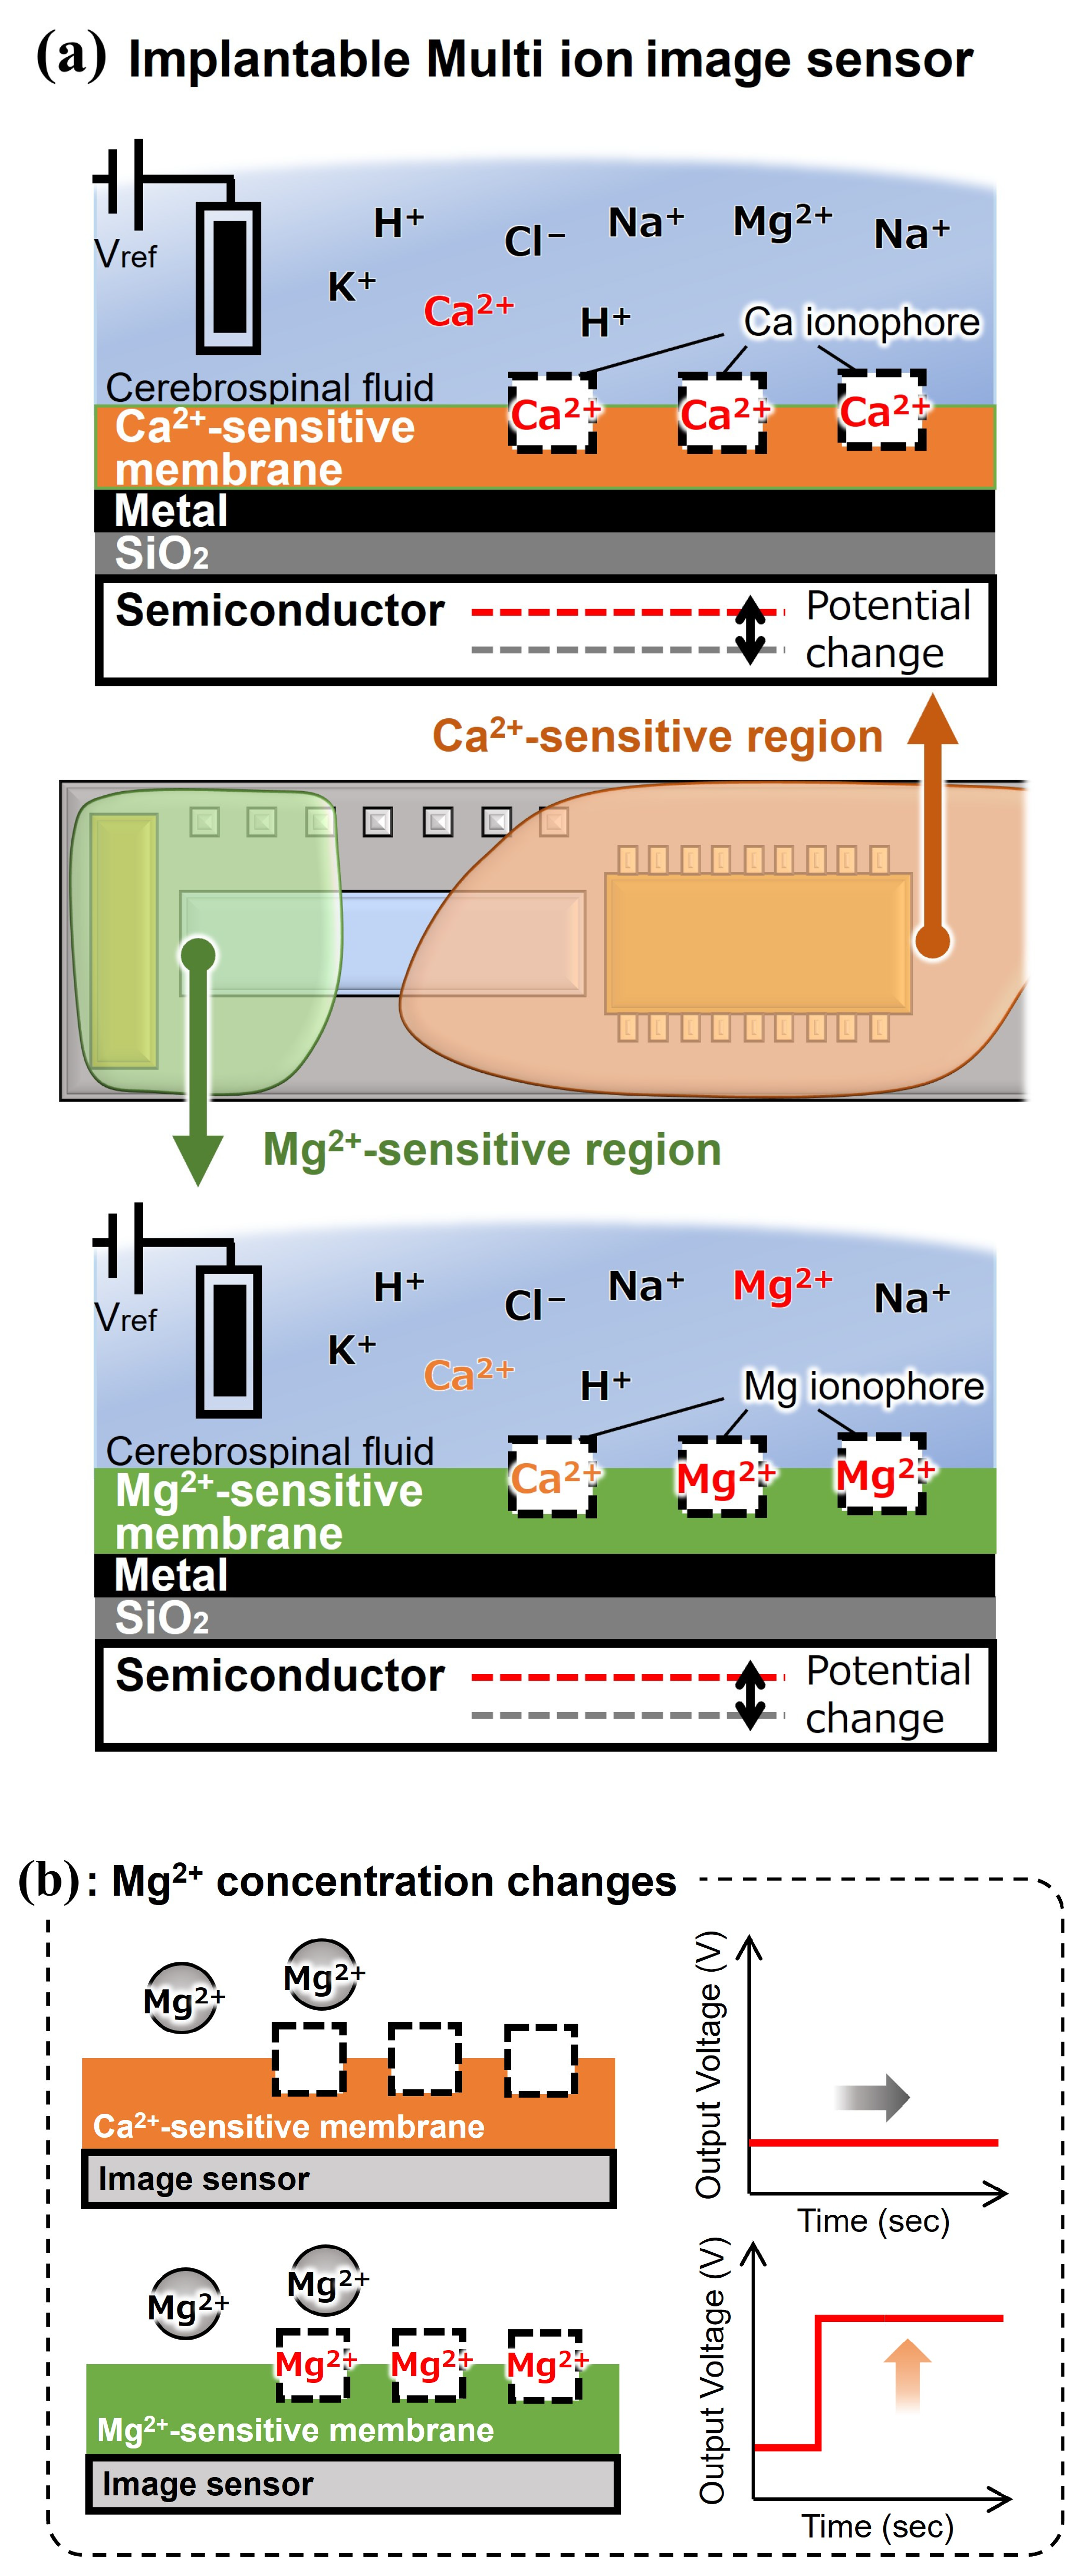
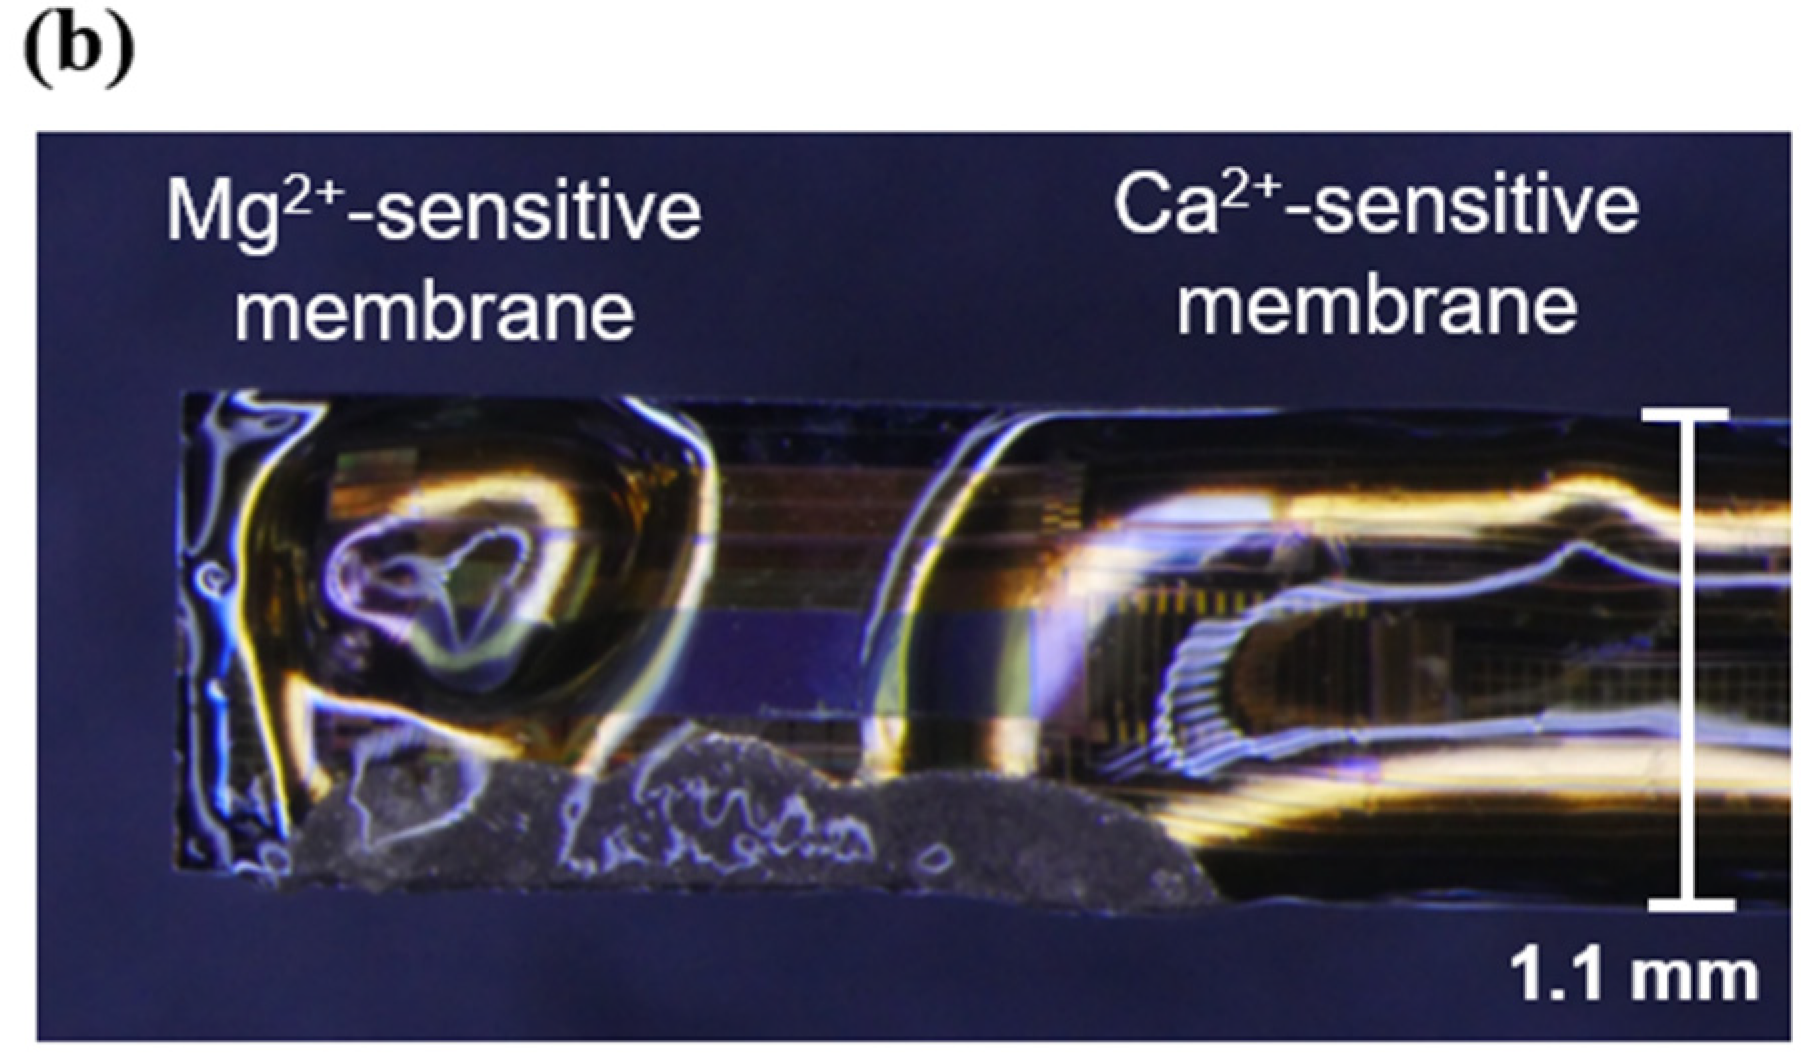
  • An implantable multi-ion image sensor equipped with magnesium-(Mg2+) and calcium-(Ca2+)-sensitive membranes was successfully fabricated.
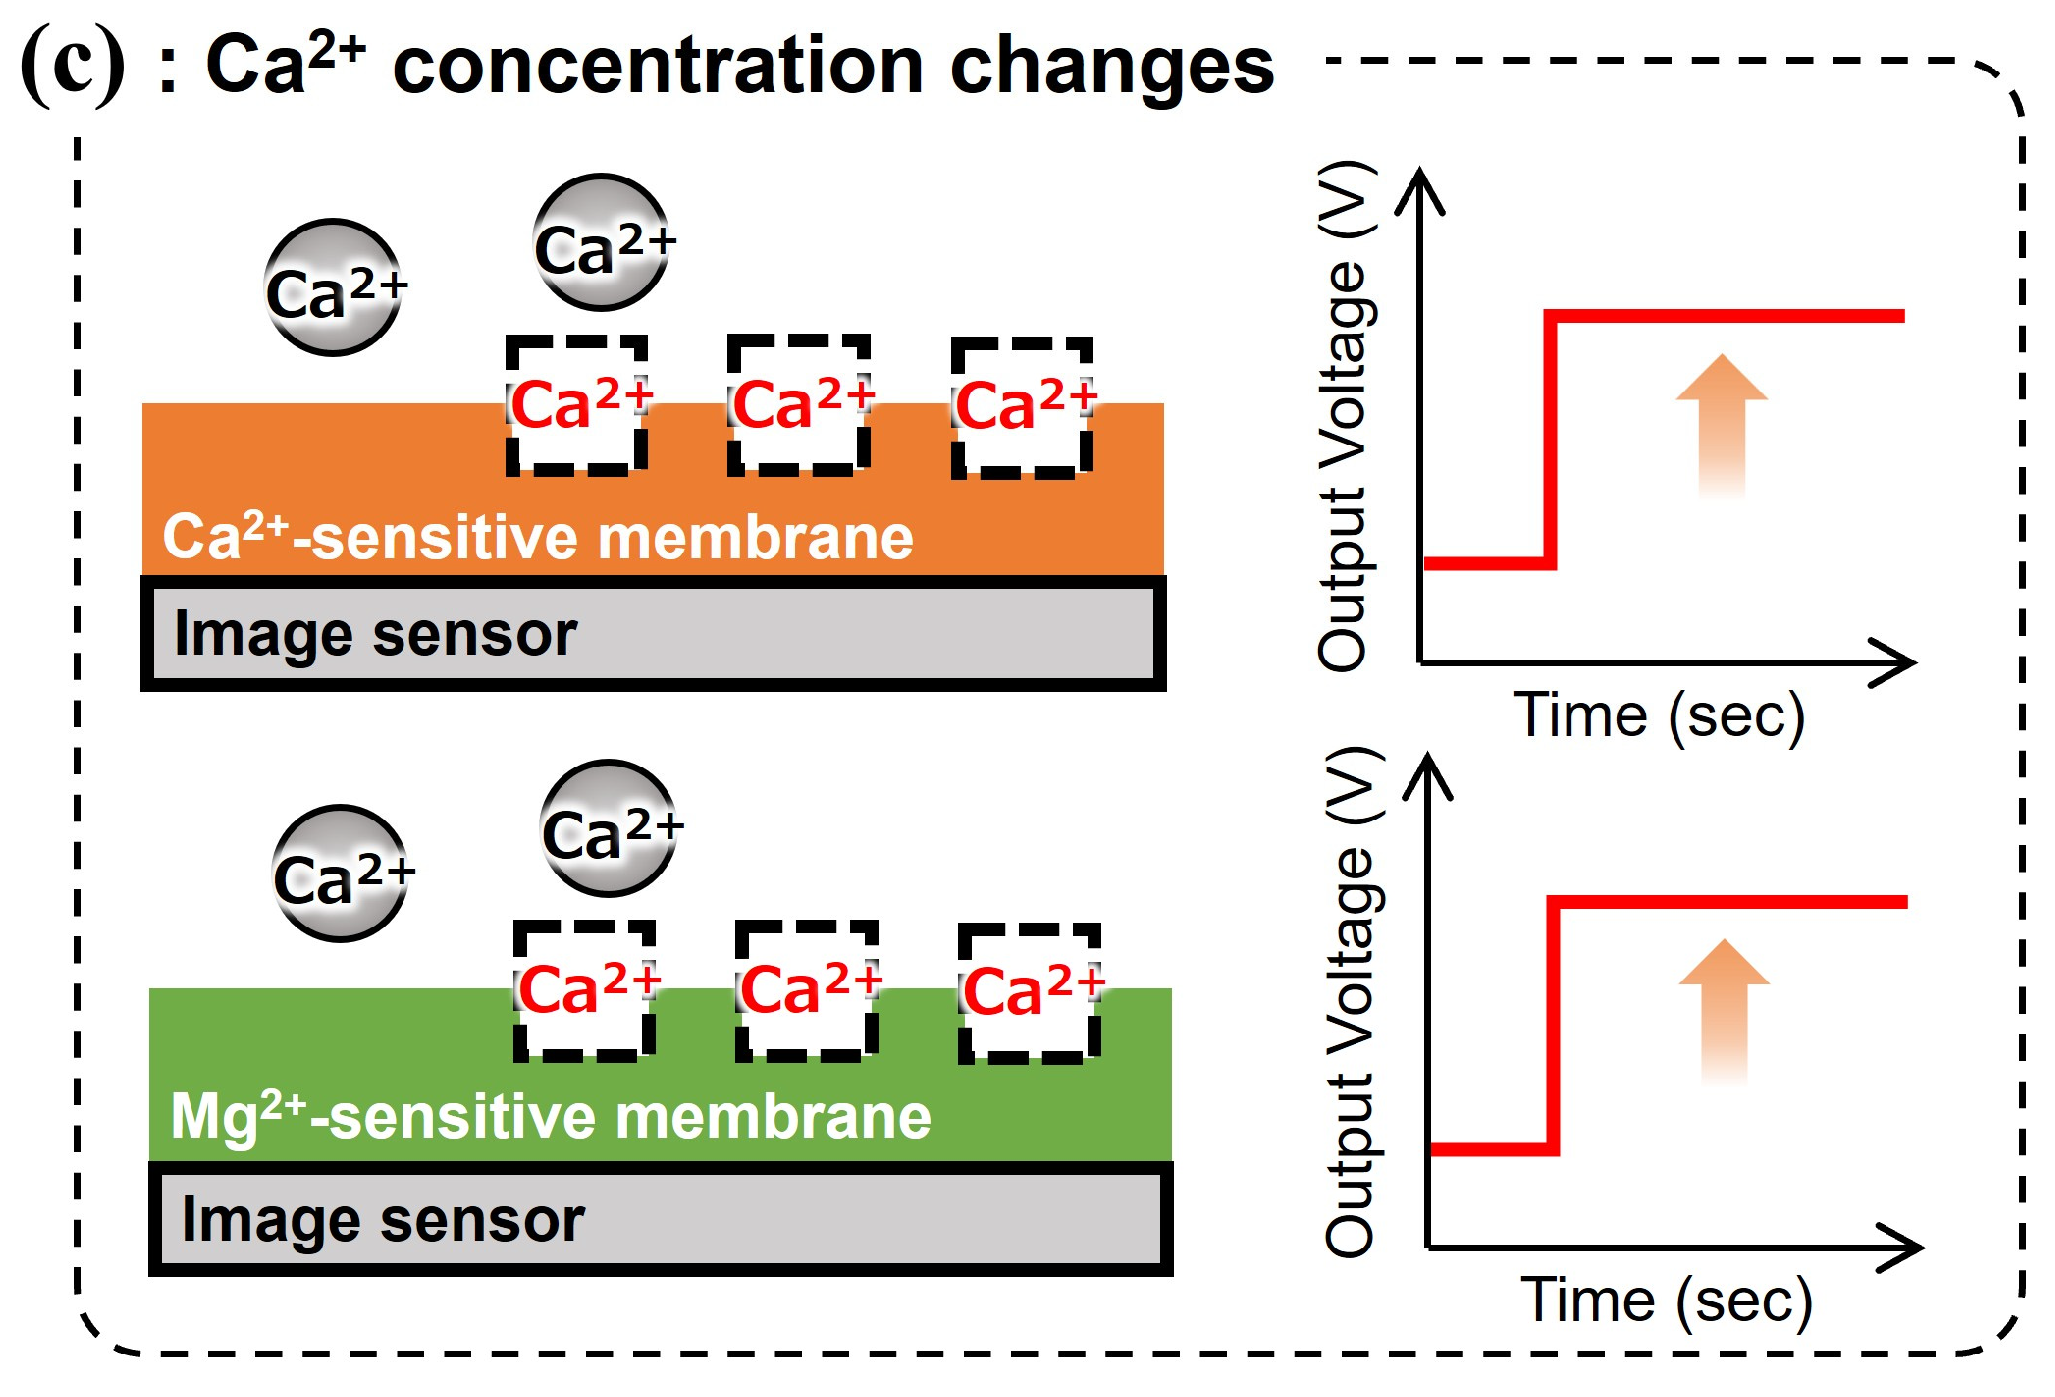
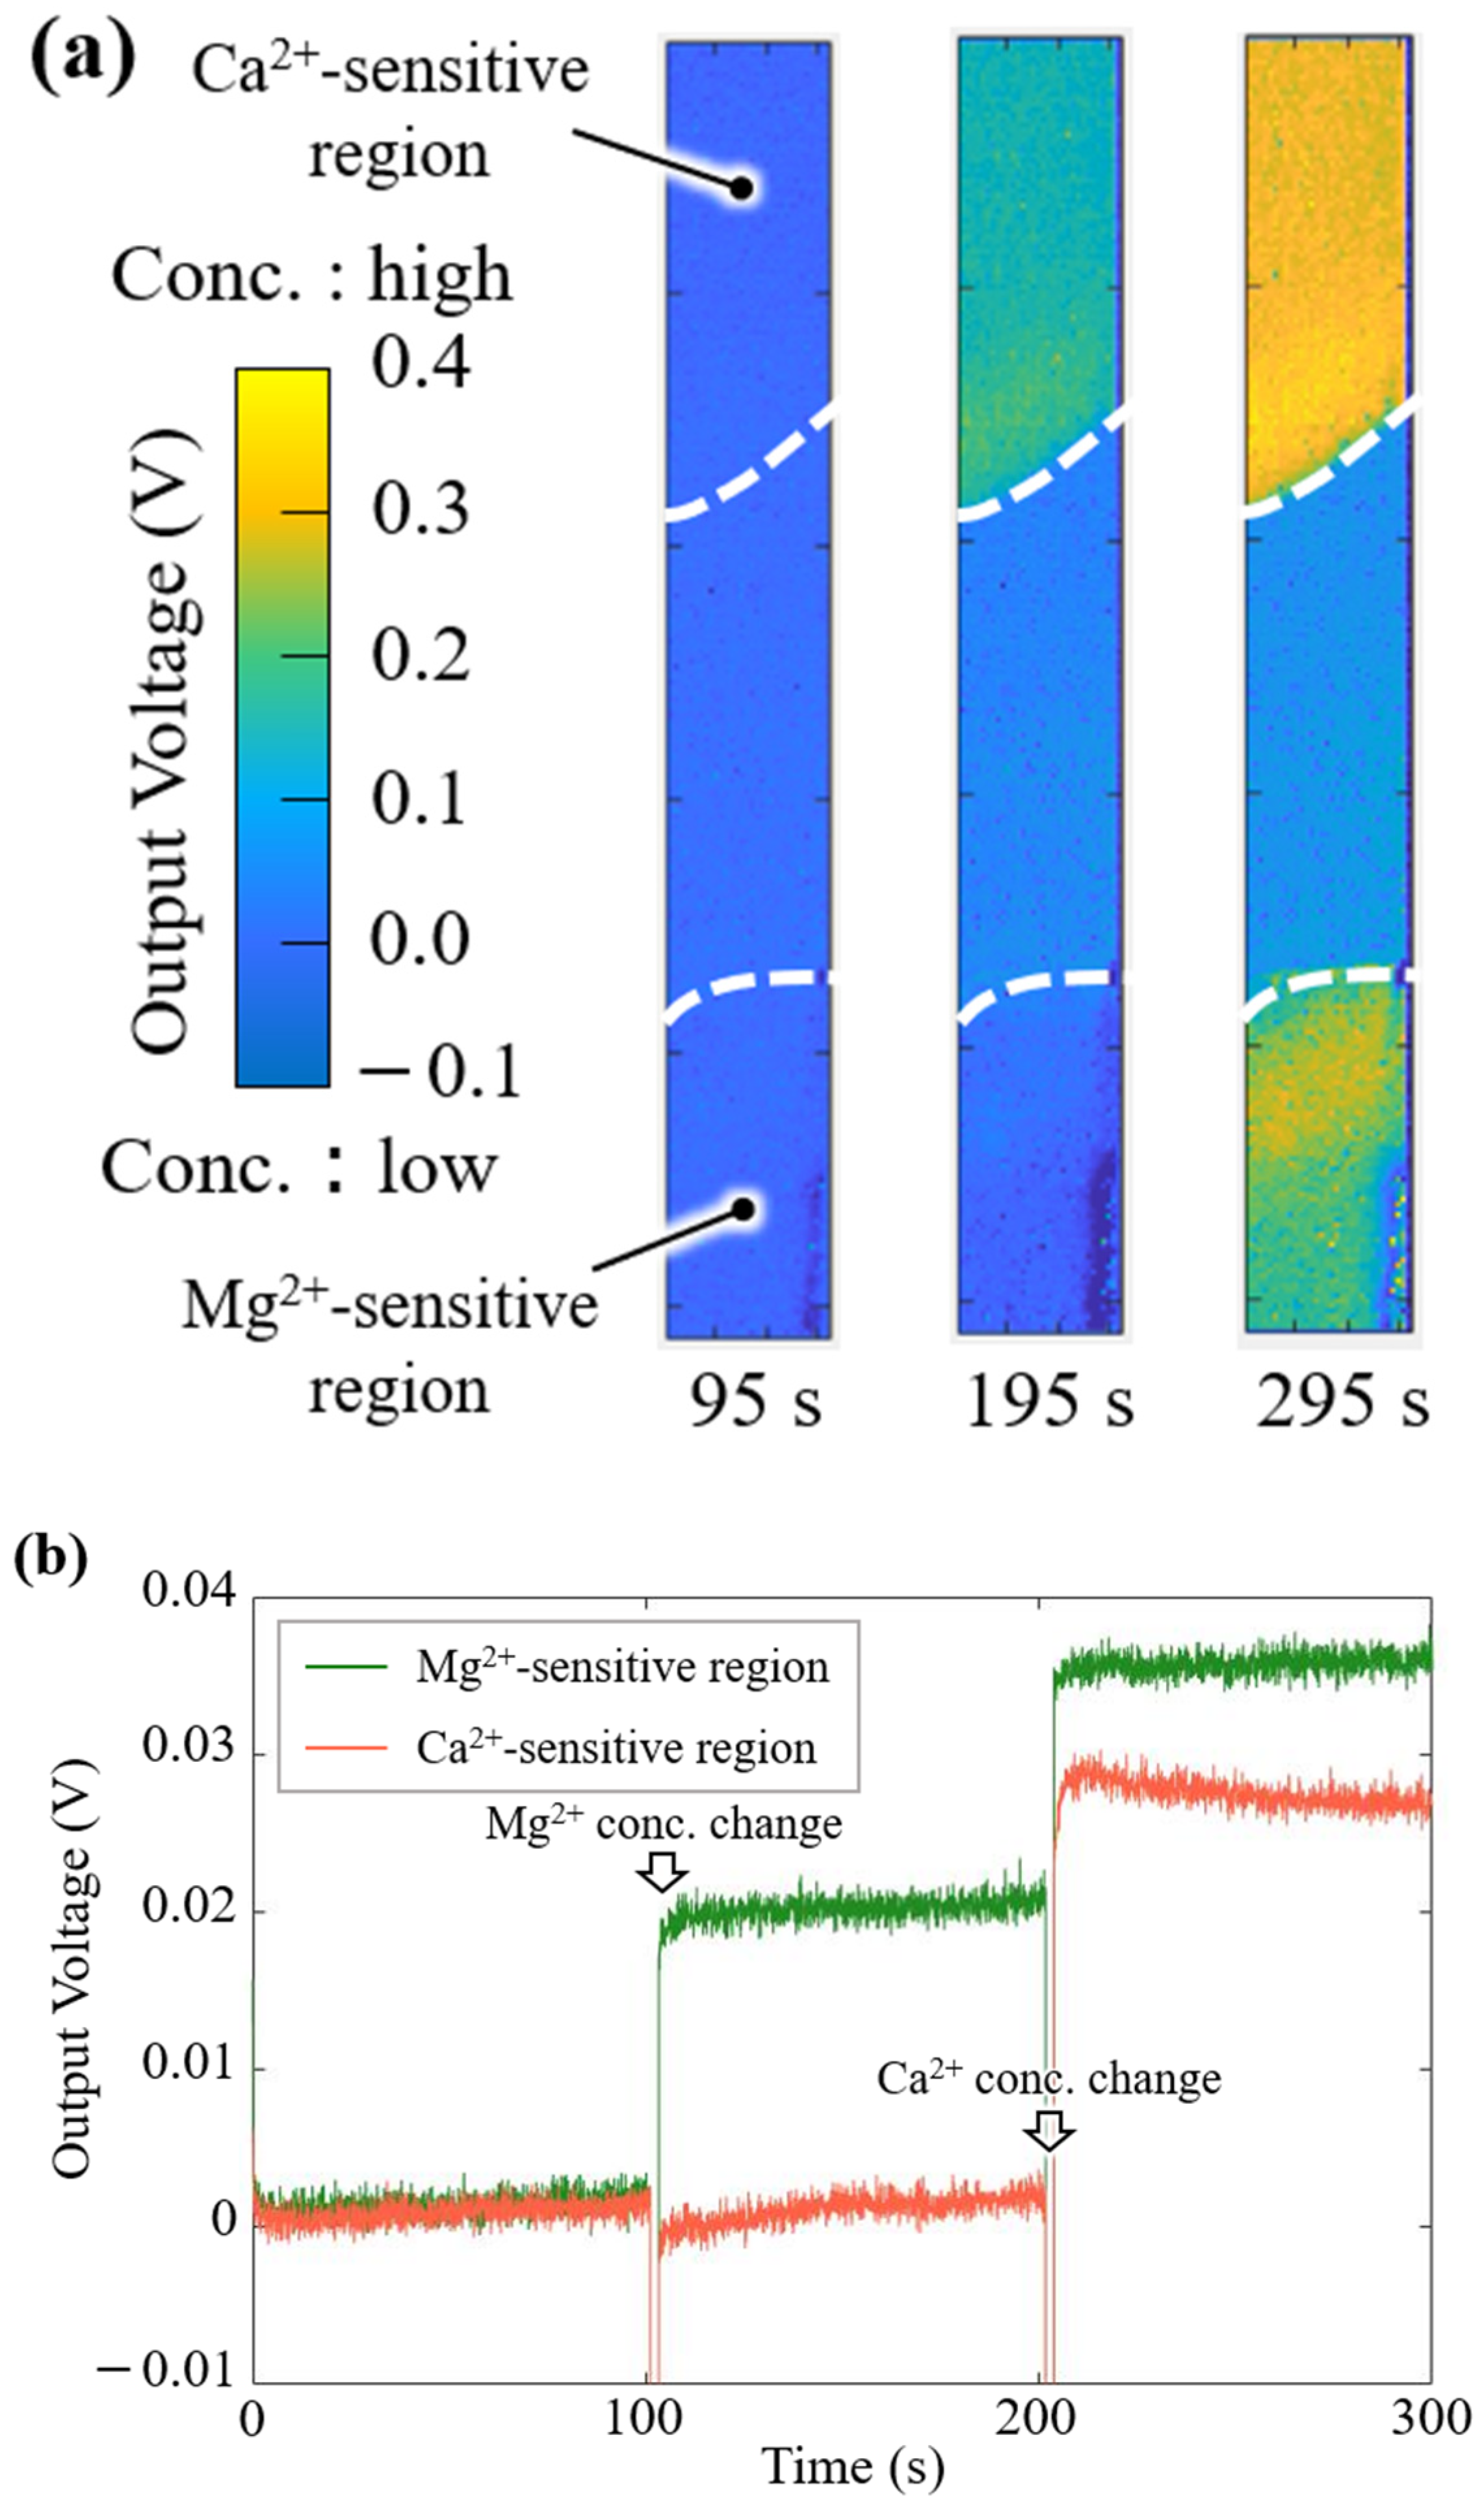
  • Selective Mg2+ measurement and multi-imaging of Mg2+ and Ca2+ were demonstrated.

Abstract

An implantable multi-ion image sensor equipped with magnesium ion (Mg2+)-and calcium ion (Ca2+)-sensitive membranes was fabricated for the selective measurement of extracellular Mg2+ in the brain, and the sensor performance was evaluated. This sensor complements the low selectivity of the Mg2+-sensitive membrane for Ca2+ by depositing a Ca2+-sensitive membrane in addition to the Mg2+-sensitive membrane on a CMOS (Complementary Metal Oxide Semiconductor)-based potentiometric sensor array with 5.65 × 4.39 µm2 pitch, enabling selective measurement of Mg2+ and Ca2+. Characterization of the sensor confirmed a Ca2+ sensitivity of 26.5 mV/dec and Mg2+ sensitivity of 19 mV/dec. Based on validation experiments with varying concentrations of Mg2+ and Ca2+, selective Ca2+ and Mg2+ measurements were successfully achieved. Furthermore, real-time imaging of Mg2+ and Ca2+ and quantification of their concentration changes were performed. The developed sensor may be successfully applied for extracellular multi-ion imaging of Mg2+ and Ca2+ in the living brain.

1. Introduction

Neurotransmitters and ions in the brain have been linked to neurological diseases and are essential for understanding brain functions [1,2]. Whereas normal brain functions are performed by the complex interplay of these transmitters, it has been suggested that abnormal transmission and changes in their concentration induce neurological disorders, such as Alzheimer’s disease and epilepsy [3,4].
In recent years, the aging of Japanese society has been one of the most pressing social issues, and the percentage of elderly people in Japan in 2022 was 29.0%. This is well above the 7.0% percentage of elderly people that defines an aging society. Excessive aging is accompanied by an increasing prevalence of memory-related neurological diseases, such as dementia and Parkinson’s disease. Numerous studies have highlighted the association of magnesium ions (Mg2+) with dementia, which impairs attention, memory, and psychomotor functions [5,6]. In one of these studies, the intraperitoneal administration of 270 mg/kg magnesium sulfate in rats during inhibitory avoidance training improved their impaired learning ability [7]. However, most of these studies have shown experimental results; the sites and pathways of action of Mg2+ are poorly understood, and their mechanisms must be elucidated before they can be applied in biomedicine.
In recent years, imaging studies have been actively conducted to observe the interior of animal brains under in vivo conditions. If extracellular Mg2+ in the brains of living individuals can be visualized and analyzed in real time, it is expected to significantly contribute to the elucidation of neurological diseases and drug discovery [8,9]. Fluorescence imaging [10] and nuclear magnetic resonance [11] are mainly used to observe cells in vivo and measure ion concentrations in the brain. However, these techniques have problems such as “difficulty in observing the original activity of living organisms due to labeling”, “difficulty in long-term observation”, “low spatio-temporal resolution”, and “high cost”. Therefore, it is crucial to develop imaging technology to visualize and analyze information in the brains of living individuals in a simple and precise manner.
As an alternative approach, the polyvinyl chloride (PVC) membrane-based Mg2+-sensitive electrode [12,13,14] using an ion recognition ionophore has been reported. These electrochemical devices enable the label-free real-time recording of Mg2+ response in a solution. Additionally, various types of ions, such as potassium ion (K+) [15], calcium ion (Ca2+) [16], and sodium ion (Na+) [17], can be detected by changing an ionophore corresponding to a target molecule. However, these ion-selective electrodes are not suitable for the spatiotemporal analysis of ion distributions due to a single-point recording.
Our group has developed a 23.55 µm pitch implantable potentiometric biosensor that enables label-free real-time imaging of hydrogen ions (H+) distribution [18]. Using this sensor, we previously demonstrated the imaging of changes in extracellular proton dynamics in a living mouse brain [19]. Furthermore, the sensor’s pixel pitch was achieved at 5.65 × 4.39 µm2 in recent years, showing a potential for high spatiotemporal H+ imaging [20]. Furthermore, we succeeded in measuring calcium ions (Ca2+) by immobilizing ionophores on a sensor that selectively detected specific ions [21]. However, the measurement of Mg2+, which has been pointed out to be closely related to memory, has not been demonstrated.
In this study, an Mg2+-sensitive film that can measure Mg2+ and a Ca2+-sensitive film that can complement the low selectivity of the Mg2+-sensitive film were deposited on an implantable image sensor to fabricate an implantable multi-ion image sensor that can selectively measure Mg2+ in the brain. The output characteristics of the fabricated sensor were evaluated. In addition, selective response evaluation experiments were conducted to examine measurement performance.

2. Materials and Methods

2.1. Materials and Chemicals

Polyvinyl chloride (PVC), 2-Nitrophenyl octyl ether (NPOE), tetrakis-boric acid sodium salt (TFPB), tetrahydrofuran (THF), sodium chloride (99.5%), potassium chloride (99.5%), calcium chloride (95%), magnesium chloride, and D-glucose (98%) were purchased from Wako Pure Chemical Industries Ltd. (Osaka, Japan). Calcium ionophore V (K23E1), sodium, and magnesium ionophore I (ETH 1117) were purchased from Sigma-Aldrich (St. Louis, MO, USA). 4-(2-hydroxyethyl) piperazine-1-ethanesulfonate (HEPES) (>99%) was purchased from Dojindo Laboratories (Tokyo, Japan), and all other reagents were prepared using deionized water (18.2 MΩ) produced with a Milli-Q water system (Tokyo, Japan).

2.2. Implantable Ion Image Sensor

Figure 1 shows the general shape and performance of the implantable ion image sensor developed by our research group. This sensor was fabricated by the 0.35 µm CMOS technology. It is designed to be inserted into a living brain and to reduce invasiveness, and the thickness and width of the sensor entry point are 100 µm and 1.1 mm, respectively. As shown in Table 1, it has an array sensor with a pixel size of 5.65 × 4.39 µm 2 and a pixel structure of 256 × 32 pixels, which is sufficient for high-resolution imaging, since the neuronal cell body is about 10~30 µm. A Ta2O5 membrane, functioning as a pH-sensitive film, was deposited onto the array.
In addition, a frame rate of 14.1 fps provides a high spatiotemporal resolution. This study aimed to measure extracellular Mg2+ in the living brain by depositing a sensitive membrane containing ionophores that trap specific ions on a potential array sensor.

2.3. Proposal of a Multi-Ion Image Sensor

To date, our group has been able to measure ions such as Ca2+ and K+. Ionophores that can selectively capture the ions to be measured are contained in a polyvinyl chloride (PVC) film solution, and the ion dynamics in the liquid can be measured in real time by depositing the ionophores on the sensor.
Mg2+ ionophores that can selectively capture Mg2+, the measurement target in this study, also exist. We have been working on the fabrication of an Mg2+ image sensor by depositing a Mg2+-sensitive film containing these ionophores on the sensing area of an ion image sensor (Figure 2).
We also confirmed that the fabricated Mg2+ image sensor is responsive to Mg2+. However, the Mg2+-sensitive membrane shows high selectivity for brain-coexisting ions such as H+, K+, and Na+ and high response sensitivity to Ca2+, which fluctuates in the brain, resulting in inadequate selectivity. This may be because Ca2+ is a divalent cation like Mg2+, and due to the Hofmeister series, the hydrophilic radius of Mg2+ is larger than that of Ca2+, making it difficult for the molecular structure of the magnesium ionophore to selectively recognize only Mg2+. Therefore, we propose a method in which a Ca2+-sensitive membrane that shows high selectivity for coexisting ions in the brain, including Mg2+, is painted over the sensing area to form a Mg2+-sensitive membrane and a Ca2+-sensitive membrane region. Using this method, when the Mg2+ concentration changed, only the Mg2+-sensitive area responded. When the Ca2+ concentration changed, both sensitive areas responded (Figure 3). In other words, the high selectivity of the Ca2+-sensitive membrane complements the low selectivity of the Mg2+-sensitive membrane for Ca2+. It is expected to discriminate between Mg2+- and Ca2+-dependent potential changes occurring in the Mg2+-sensitive membrane.

2.4. Sensor Fabrication

In this study, Mg2+-and Ca2+-sensitized films were formed regionally on a 32 × 256 pixel puncture-type sensor with a pixel pitch of 5.65 × 4.39 µm. Prior to the membrane fabrication, Mg2+ and Ca2+ membrane solutions were prepared according to previous reports [21,22]. In the Mg2+-sensitive membrane solution, 33.9 mg of 2-nitrophenyl octyl ether (NPOE), 3.1 mg of tetrakis-boric acid sodium salt (TFPB), 16.8 mg of PVC, and 3.1 mg of magnesium ionophore (magnesium ionophore I: Sigma-Aldrich) are dissolved in 0.3 mL of tetrahydrofuran (THF). In the Ca2+-sensitive membrane solution, 70.6 mg of NPOE, 0.85 mg of TFPB, 28.6 mg of PVC, and 2.85 mg of calcium ionophore (calcium ionophore V: Sigma–Aldrich) were dissolved in 0.4 mL of THF. The amount of THF, which determines the viscosity of the solution, was two to three times lower in the film-sensitive solution used in this study than that used in previous studies. Previous studies showed a dependence between the ion sensitivity and thickness of the sensitized film, and the thickness of the film was made sufficiently thick by repeatedly coating the sensitized film solution. However, when forming two types of sensitive films in a small area, the expansion and mixing of each sensitive area due to overcoating can be problematic; therefore, the viscosity of the sensitive film solution was increased in this study.
The resulting mixtures were applied to an implantable ion image sensor to form sensitive areas, as shown in Figure 4a. After formation, the films were dried at room temperature (25 °C) for 12 h. A micrograph of the sensor chip surface after the PVC membrane formation is shown in Figure 4b. The Mg2+- and Ca2+-sensitive membranes were separately deposited on the pixel area.

2.5. Evaluation of the Ion Response Characteristics in Each Sensitive Region

To confirm the concentration dependence of the Mg2+- and Ca2+-sensitive regions in the fabricated implantable multi-ion image sensor, measurement solutions were prepared by varying the concentration of each ion in a buffer solution that mimicked the brain. The tip of the fabricated sensor was immersed in a buffer solution for at least 6 h to obtain a sensitive membrane. As shown in Figure 5, the ion response characteristics to changes in the concentrations of sodium ions (Na+), K+, and H+, in addition to Mg2+ and Ca2+, which are the measurement targets, were measured by changing the sensor every 60 s in a Petri dish filled with a concentration measurement solution. The composition of the base buffer solution is potassium chloride (KCl): 2.5 mM, sodium chloride (NaCl): 150 mM, calcium chloride (CaCl2): 2 mM, magnesium chloride (MgCl2): 1 mM, glucose: 10 mM, and hydroxyethylpiperazine ethane sulfonic acid (HEPES): 10 mM, and the pH is about 7 pH. The concentration of the ions to be measured varies from 10−6 to 10−1 M in 1-digit increments, and the pH varies from 7 to 8 pH in 0.5 pH increments.

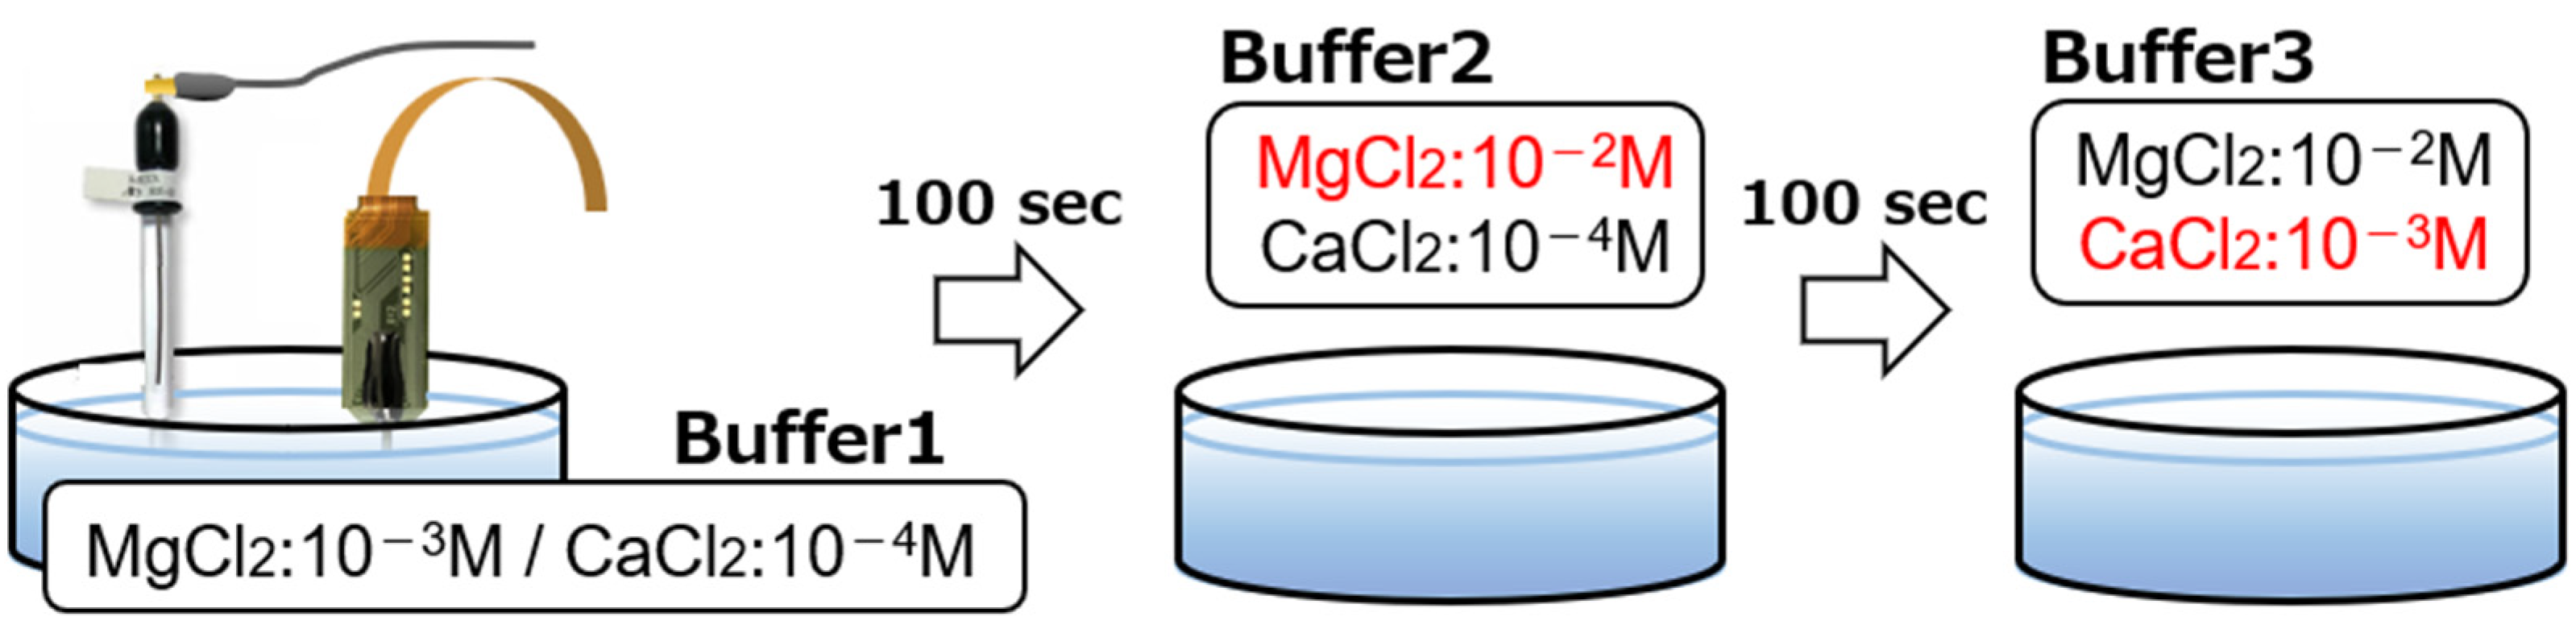
2.6. Simultaneous Measurement of the Mg2+ and Ca2+ Response

To verify the performance of the implantable multi-ion image sensor in the detection of Mg2+ concentration changes and for quantitative measurements, the potential response was measured by varying the concentrations of Ca2+ and Mg2+ in the buffer solution. The three buffers used were the same as those used in Section 2.3 for the base. Buffer 1 contained MgCl2 at 10−3 M and CaCl2 at 10−4 M, buffer 2 contained MgCl2 at 10−2 M and CaCl2 at 10−4 M, and buffer 3 contained MgCl2 at 10−2 M and CaCl2 at 10−3 M. At the start of the measurement, the sensor was inserted into buffer solution 1. After 100 s, the sensor was transferred to buffer solution 2 and, after another 100 s, to buffer solution 3 (Figure 6). Therefore, it is possible to evaluate the response of this sensor to the Mg2+ concentration change in the transition from buffer solution 1 to buffer solution 2 and to the Ca2+ concentration change in the transition from buffer solution 2 to buffer solution 3.

3. Results and Discussion

3.1. Evaluation Results of Ion Response Characteristics in Each Sensing Region

The concentration dependences of the Mg2+- and Ca2+-sensitive regions for each ion are shown in Figure 7. As shown in Figure 7a, the output voltage (VOut) for the Mg2+-sensitive region increased from 10−2 to M and showed slightly lower sensitivity to Mg2+ (19 mV/dec). In the concentration range of 10−4 to 10−1 M Ca2+, the sensitivity was measured to be 29.2 mV/dec. This result shows that the Mg2+-sensitive membrane has low selectivity for Ca2+, as described in Section 2.3. As shown in Figure 7a, the limit of detection for the Mg2+-sensitive membrane is higher than 10 mM, because the VOut signal of the sensor was saturated less than approximately 10 mM. This indicates that the Mg2+ ionophore-entrapped membrane cannot detect extracellular Mg2+ fluctuation (~1 mM) due to influence of the interfering ions. Therefore, an improvement of the sensor performance for Mg2+ detection is necessary due to the limit of detection for Mg2+ being higher than 10 mM at this time. Conversely, VOut for the Mg2+-sensitive membrane had almost no change for the different concentrations of H+, K+, and Na+. Following these experimental results, further investigation of the Mg2+ sensor performance for Ca2+ is required for applying physiological conditions. On the other hand, the VOut for the Ca2+-sensitive region showed a Ca2+ response with increasing Ca2+ concentrations, with a sensitivity of 26.5 mV/dec, showing high selectivity to H+, K+, Na+, and Mg2+ (Figure 7b). The theoretical sensitivity exhibited by the sensitive region when measuring divalent ions is 29.6 mV/dec, according to Nernst’s formula, which tends to decrease the sensitivity. This decrease in sensitivity is thought to be due to ions other than the target ion in the buffer solution (in the case of the Mg2+-sensitive region, H+, K+, Na+, and Ca2+), which act as interfering ions and prevent the ionophores in the sensitized membrane from capturing ions. This indicates that the Mg2+-sensitive region fabricated in this study is susceptible to Ca2+. Also, it was ensured that the fabricated sensor functions to measure Mg2+ and Ca2+ without briefly releasing both membranes from the pixel electrode and can be used basically multiple times in an aqueous solution.

3.2. Demonstration Results of Selective Multi-Ion Measurement

To demonstrate the simultaneous imaging of Mg2+ and Ca2+ responses and the quantitative measurement of the concentration change, visualization experiments were performed using Mg2+ and Ca2+ solutions. Figure 8a shows the imaging results for the Mg2+ and Ca2+ responses. The ΔVOut of the sensor is shown as an absolute value with a 0.5 V scale by a color bar: the yellow color indicates a high concentration of Mg2+ and Ca2+, and the blue color indicates a low concentration. The output image of the Mg2+-sensitive region changed with the Mg2+ concentration. Additionally, the images of both sensitive regions were observed soon after the addition of the Ca2+ solution.
Figure 8b shows the biosensor response to changes in the Mg2+ and Ca2+ concentrations. The VOut change (ΔVOut) in the Mg2+-sensitive membrane increased for the concentration change of Mg2+, whereas the ΔVOut in the Ca2+-sensitive membrane hardly changed. After the Ca2+ solution was added dropwise, the ΔVOut for both the Mg2+- and Ca2+-sensitive membranes immediately increased, and these sensor signals reached saturated levels.
From these experimental results, and since there was no response less than 10−2 M for Mg2+, as described in Section 3.1, this originates from the concentration levels of interfering ion Ca2+, i.e., it should be considered that the lower detectable Mg2+ concentration depends on the concentration of Ca2+.
Having confirmed that the discrimination of the measured ion species was successful, we checked whether quantitative concentration derivation was possible from the response to changes in the concentration of each ion. Deriving the Mg2+ concentration (CMg) and Ca2+ concentration (CCa) after the concentration change from the potential response (ΔVMg and ΔVCa) obtained from the potential response in Figure 8b and the sensor sensitivity (SMg and SCa) obtained from the characterization in Section 3.1, the following is obtained.
CMg = ΔVMg/SMg = 18 mV/19 mV/dec = 8.85 mM
CCa = ΔVCa/SCa = 26 mV/26.5 mV/dec = 0.98 mM
After the concentration change, the theoretical concentrations were 10 mM for Mg2+ and 1 mM for Ca2+. The Mg2+- and Ca2+-sensitive regions were 88.5% and 98%, respectively, in terms of accuracy.
In an experiment to improve memory in mice with a diet containing magnesium, it was reported that the concentration of Mg2+ in the brain changed by about 15%. Because the general Mg2+ concentration in the brain is 1 mM, it is thought that a minute concentration change of about 0.15 mM is produced [23]. Using this sensor, the concentration change would be about 0.13 mM, assuming an error occurs. This change is detected as a potential change of 1 mV, sufficient to capture the noise of 0.5 mVrms during in vivo measurement.
These results indicated that the Ca2+-sensitive region can compensate for the low selectivity for Ca2+ in the Mg2+-sensitive region. From these experiments and the quantitative evaluation results, the real-time imaging of Mg2+ concentration changes, discrimination from Ca2+, and quantification of the concentration changes were successfully demonstrated. In addition, a pixel region exposed between the two membrane formation areas functioned as a pH sensor. However, if Mg2+ is changing in one part of the sensor and Ca2+ in another, the target ion concentration change cannot be measured accurately at this stage, because the two membranes were coated a little too distant in the array. Thus, the development of a membrane patterning technique is required for multi-analyte detection of Mg2+ and Ca2+ with high spatial resolution toward future bioimaging applications.
Based on our proposed method, the Mg2+ and Ca2+ imaging and quantitative determination were particularly demonstrated under the specific ion concentration by controlling the Mg2+ and Ca2+ concentrations. However, we cannot use it to solve the problem, the Mg2+-sensitive membrane shows almost no response for real biological Mg2+ fluctuations in the presence of Ca2+ 2 mM, like the extracellular concentration level. To overcome this problem, improvement in the Mg2+ sensor performance is necessary by investigating an ionophore and other materials for biological experiments as future works.

4. Conclusions

We fabricated a 32 × 256 pixels implantable multi-ion image sensor using Mg2+- and Ca2+-sensitive regions. The resulting Mg2+-sensitive region on the array showed an output voltage change of 19 mV/dec between 10−2 M to 10−1 M Mg2+, 29.2 mV/dec for Ca2+ in the range of 10−4 M to 10−1 M, and 26.5 mV/dec for Ca2+, indicating reasonable sensitivity for the coexisting ions. In the selective response evaluation experiment, the high selectivity of the Ca2+-sensitive region complemented the low selectivity of the Mg2+-sensitive region, and we verified whether Mg2+ concentration changes could be selectively detected. The results showed that the discrimination of Mg2+ and Ca2+ concentration changes was possible, demonstrating real-time imaging and quantification of Mg2+ and Ca2+ concentration changes.
Although we succeeded in visualizing changes in Mg2+ and Ca2+ concentrations on the fabricated sensor device, future investigation for improving the Mg2+-sensitive performance is required for biological experiments. If the physiological Mg2+ fluctuation of less than 1 mM can be measured, simultaneous Mg2+ and Ca2+ mapping and multianalyte detection in the brain can be expected by applying inkjet devices and semiconductor technology to paint sensor pixels with a sensitized membrane.

Author Contributions

Conceptualization, K.S.; Methodology, Y.N., H.D. and T.H.; Software, Y.N. and Y.K.; Validation, Y.N. and T.H.; Writing—Original Draft Preparation, Y.N. and H.D.; Writing—Review and Editing, H.D. and Y.-J.C., K.T., T.N. and K.S.; Project Administration, K.S.; Funding Acquisition, K.S. All authors have read and agreed to the published version of the manuscript.

Funding

This research was funded by MEXT X-NICS JPJ011438 and JSPS Grants-in-Aid for Scientific Research (JP23H00182 and JP22H04926).

Institutional Review Board Statement

Not applicable.

Informed Consent Statement

Not applicable.

Data Availability Statement

The data are not publicly available due to privacy or ethical restrictions.

Conflicts of Interest

The authors declare no conflicts of interest.

References

  1. D’Adamo, M.C.; Liantonio, A.; Conte, E.; Pessia, M.; Imbrici, P. Ion channels involvement in neurodevelopmental disorders. Neuroscience 2020, 440, 337–359. [Google Scholar] [CrossRef] [PubMed]
  2. Teleanu, R.I.; Niculescu, A.-G.; Roza, E.; Vladâcenco, O.; Grumezescu, A.M.; Teleanu, D.M. Neurotransmitters-Key factors in neurological and neurodegenerative disorders of the central nervous system. Int. J. Mol. Sci. 2022, 23, 5954. [Google Scholar] [CrossRef] [PubMed]
  3. Akyuz, E.; Polat, A.K.; Eroglu, E.; Kullu, I.; Angelopoulou, E.; Paudel, Y.N. Revisiting the role of neurotransmitters in epilepsy: An updated review. Life Sci. 2021, 265, 118826. [Google Scholar] [CrossRef]
  4. Andersen, J.V.; Schousboe, A.; Verkhratsky, A. Astrocyte energy and neurotransmitter metabolism in Alzheimer’s disease: Integration of the glutamate/GABA-glutamine cycle. Prog. Neurobiol. 2022, 217, 102331. [Google Scholar] [CrossRef]
  5. Xu, P.; Cui, D.; Jin, M.; Sun, L. Magnesium ions and dementia. J. Neurorestoratology 2024, 12, 100094. [Google Scholar] [CrossRef]
  6. Wilmott, L.A.; Thompson, L.T. Sex- and dose-dependent effects of post-trial calcium channel blockade by magnesium chloride on memory for inhibitory avoidance conditioning. Behav. Brain Res. 2013, 257, 49–53. [Google Scholar] [CrossRef]
  7. Lamhot, V.B.; Khatib, N.; Ginsberg, Y.; Anunu, R.; Richter-Levin, G.; Weiner, Z.; Ross, M.G.; Divon, M.Y.; Hallak, M.; Beloosesky, R. Magnesium sulfate prevents maternal inflammation–induced impairment of learning ability and memory in rat offspring. Am. J. Obstet. Gynecol. 2015, 213, 851.e1–851.e8. [Google Scholar] [CrossRef]
  8. Huang, Y.; Yu, Q.; Chen, Z.; Wu, W.; Zhu, Q.; Lu, Y. In vitro and in vivo correlation for lipid-based formulations: Current status and future perspectives. Acta Pharm. Sin. B 2021, 11, 2469–2487. [Google Scholar] [CrossRef]
  9. Mollentze, J.; Durandt, C.; Pepper, M.S. An in vitro and in vivo comparison of osteogenic differentiation of human mesenchymal stromal/stem cells. Stem Cells Int. 2021, 2021, 9919361. [Google Scholar] [CrossRef]
  10. Lindenburg, L.; Vinkenborg, J.; Oortwijn, J.; Aper, J.A.; Merkx, M. MagFRET: The first genetically encoded fluorescent Mg2+ sensor. PLoS ONE 2013, 8, e82009. [Google Scholar] [CrossRef]
  11. Barker, P.; Butterworth, E.; Boska, M.; Nelson, J.; Welch, K.M.A. Magnesium and pH imaging of the human brain at 3.0 tesla. Magn. Reson. Med. 1999, 41, 400–406. [Google Scholar] [CrossRef]
  12. Baniwal, S.; Chandra, S.; Panwar, A.; Singh, A.K. Poly(vinyl chloride)-based macrocyclic membrane sensors for magnesium. Talanta 1999, 50, 499–508. [Google Scholar] [CrossRef] [PubMed]
  13. Gupta, V.K.; Prasad, R.; Kumar, A. Magnesium-tetrazaporphyrin incorporated PVC matrix as a new material for fabrication of Mg2+ selective potentiometric sensor. Talanta 2004, 63, 1027–1033. [Google Scholar] [CrossRef] [PubMed]
  14. Chandra, S.; Sharma, K.; Kumar, A. Mg(Ⅱ) selective PVC membrane electrode based on methyl phenyl semicarbazone as an ionophore. J. Chem. 2012, 2013, 189464. [Google Scholar] [CrossRef]
  15. Dror, M.; Bergs, E.A.; Rhodes, R.K. Potassium ion-selective electrodes based on valinomycin/PVC overlayered solid substrates. Sens. Actuators 1987, 11, 23–26. [Google Scholar] [CrossRef]
  16. Zhao, L.; Jiang, Y.; Wei, H.; Jiang, Y.; Ma, W.; Zheng, W.; Cao, A.; Mao, L. In vivo measurement of calcium ion with solid-state ion-selective electrode by using shelled hollow carbon nanospheres as a transducing layer. Anal. Chem. 2019, 91, 4421–4428. [Google Scholar] [CrossRef]
  17. Badr, I.; Gouda, M.; Abdel-Sattar, R.; Sayour, H. Reduction of thrombogenicity of PVC-based sodium selective membrane electrodes using heparin-modified chitosan. Carbohydr. Polym. 2014, 99, 783–790. [Google Scholar] [CrossRef]
  18. Nanasaki, S.; Horiuchi, H.; Inada, H.; Nakamura, Y.; Dasai, F.; Iwata, T.; Takahashi, K.; Nabekura, J.; Sawada, K. Development of novel pH image sensor for in-vivo apprication. In Proceedings of the 19th International Conference on Solid-State Sensors, Actuators and Microsystems (Transducers 2017), Kaohsiung, Taiwan, 18–22 June 2017; pp. 43–46. [Google Scholar] [CrossRef]
  19. Horiuchi, H.; Agetsuma, M.; Ishida, J.; Nakamura, Y.; Lawrence Cheung, D.; Nanasaki, S.; Kimura, Y.; Iwata, T.; Takahashi, K.; Sawada, K.; et al. CMOS-based bio-image sensor spatially resolves neural activity-dependent proton dynamics in the living brain. Nat. Commun. 2020, 11, 712. [Google Scholar] [CrossRef]
  20. Sakamoto, K.; Madokoro, M.; Horiuchi, H.; Ishida, J.; Horio, T.; Kimura, Y.; Hizawa, T.; Choi, Y.-J.; Takahashi, K.; Noda, T.; et al. Needle-type 5 µm pixel pitch pH-image sensor and imaging of proton emissions in the cerebral cortex. In Proceedings of the 21st International Conference on Solid-State Sensors, Actuators and Microsystems (Transducers 2021), Orlando, FL, USA, 20–24 June 2021; pp. 271–274. [Google Scholar]
  21. Doi, H.; Horio, T.; Shigetomi, E.; Parajuli, B.; Shinozaki, Y.; Noda, T.; Takahashi, K.; Hattori, T.; Koizumi, S.; Sawada, K. Label-free real-time imaging of extracellular Ca2+ uptake in the hippocampal slice using Ca-PVC membrane based on charge-transfer-type potentiometric sensor arrays. IEEE Sens. J. 2019, 2019, 1–3. [Google Scholar]
  22. Okubo, S.; Ozeki, Y.; Yamada, T.; Saito, K.; Ishihara, N.; Yanagida, Y.; Mayanagi, G.; Washio, J.; Takahashi, N. Facile fabrication of all-solid-state ion-selective electrodes by laminating and drop-casting for multi-sensing. Electrochemistry 2022, 90, 77001. [Google Scholar] [CrossRef]
  23. Slutsky, I.; Abumaria, N.; Wu, L.J.; Huang, C.; Zhang, L.; Li, B.; Zhao, X.; Govindarajan, A.; Zhao, M.G.; Zhuo, M.; et al. Enhancement of learning and memory by elevating brain magnesium. Neuron 2010, 65, 165–177. [Google Scholar] [CrossRef]
Figure 1. Overview of an implantable pH image sensor.
Sensors 25 02595 g001
Figure 2. Implantable magnesium ion (Mg2+) image sensor: (a) overview, and (b) cross-sectional view of a single pixel.
Sensors 25 02595 g002
Figure 3. Overview and measurement concept of an implantable multi-ion image sensor: (a) outline, (b) sensor response to change in the Mg2+ concentration, and (c) sensor response to change in the calcium ion (Ca2+) concentration.
Sensors 25 02595 g003aSensors 25 02595 g003b
Figure 4. Ion-sensitive membrane deposition: (a) outline of an implantable multi-ion image sensor, and (b) micrograph of a sensor chip surface.
Sensors 25 02595 g004aSensors 25 02595 g004b
Figure 5. Experimental setup for the measurement of the concentration dependence.
Sensors 25 02595 g005
Figure 6. Measurement setup for Mg2+ and Ca2+ imaging.
Sensors 25 02595 g006
Figure 7. Concentration dependence for the chemicals: (a) the sensor response for the Mg2+ sensitivity region, and (b) the sensor response for the Ca2+ sensitivity region. The error bar means the standard deviation of the VOut signal obtained from each sensitive region.
Sensors 25 02595 g007
Figure 8. Output response of the implantable multi-ion image sensor: (a) two-dimensional images for the Mg2+ and Ca2+ concentration changes, and (b) time course of the sensor output on the Mg2+ and Ca2+ membranes.
Sensors 25 02595 g008
Table 1. Details for the sensor specification.
Process0.35 µm CMOS
Sensor size9.88 × 1.10 mm2
Sensor thickness100 µm
Sensing area1124 × 180 µm2
Pixel pitch5.65 × 4.39 µm2
Pixel array256 × 32
Frame rate14.1 fps
Disclaimer/Publisher’s Note: The statements, opinions and data contained in all publications are solely those of the individual author(s) and contributor(s) and not of MDPI and/or the editor(s). MDPI and/or the editor(s) disclaim responsibility for any injury to people or property resulting from any ideas, methods, instructions or products referred to in the content.

