
Enhancing Three-Dimensional Reconstruction Through Intelligent Colormap Selection


Abstract
1. Introduction
- A novel methodology that combines colormaps and color enhancement methods to improve 3D reconstruction;
- A heuristic approach identifying the optimal colormaps for each dataset;
- A fusion of preprocessing techniques that enhance 3D reconstruction;
- An evaluation of 3D reconstruction and the effects of colormaps and enhancement techniques using real-world datasets.
2. Related Work
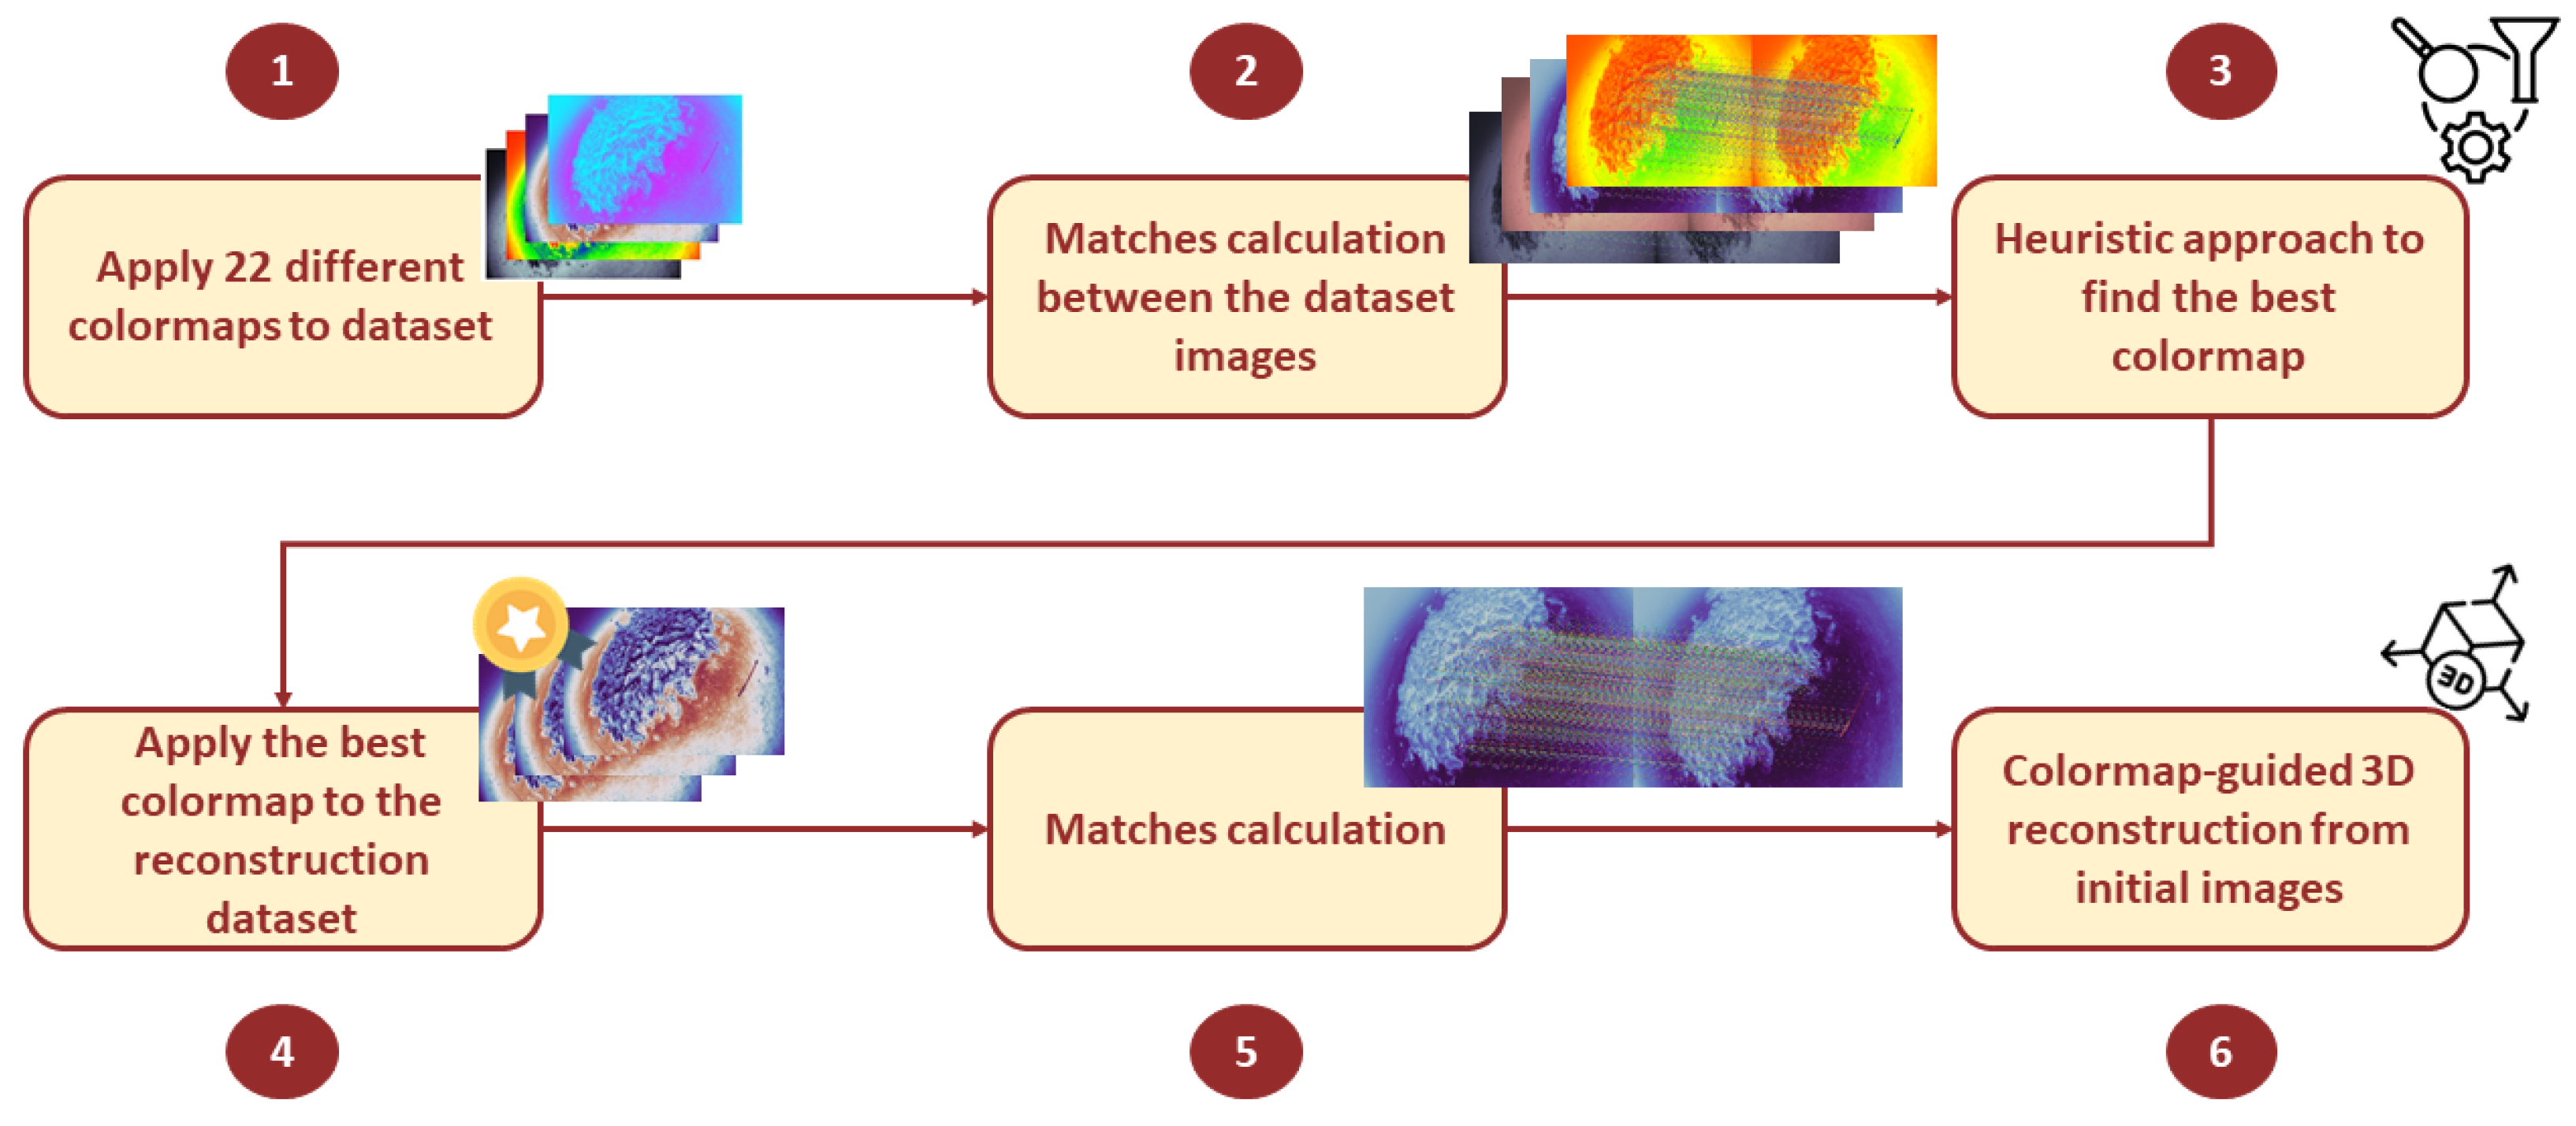
3. Enhanced 3D Reconstruction Through Intelligent Colormap Selection
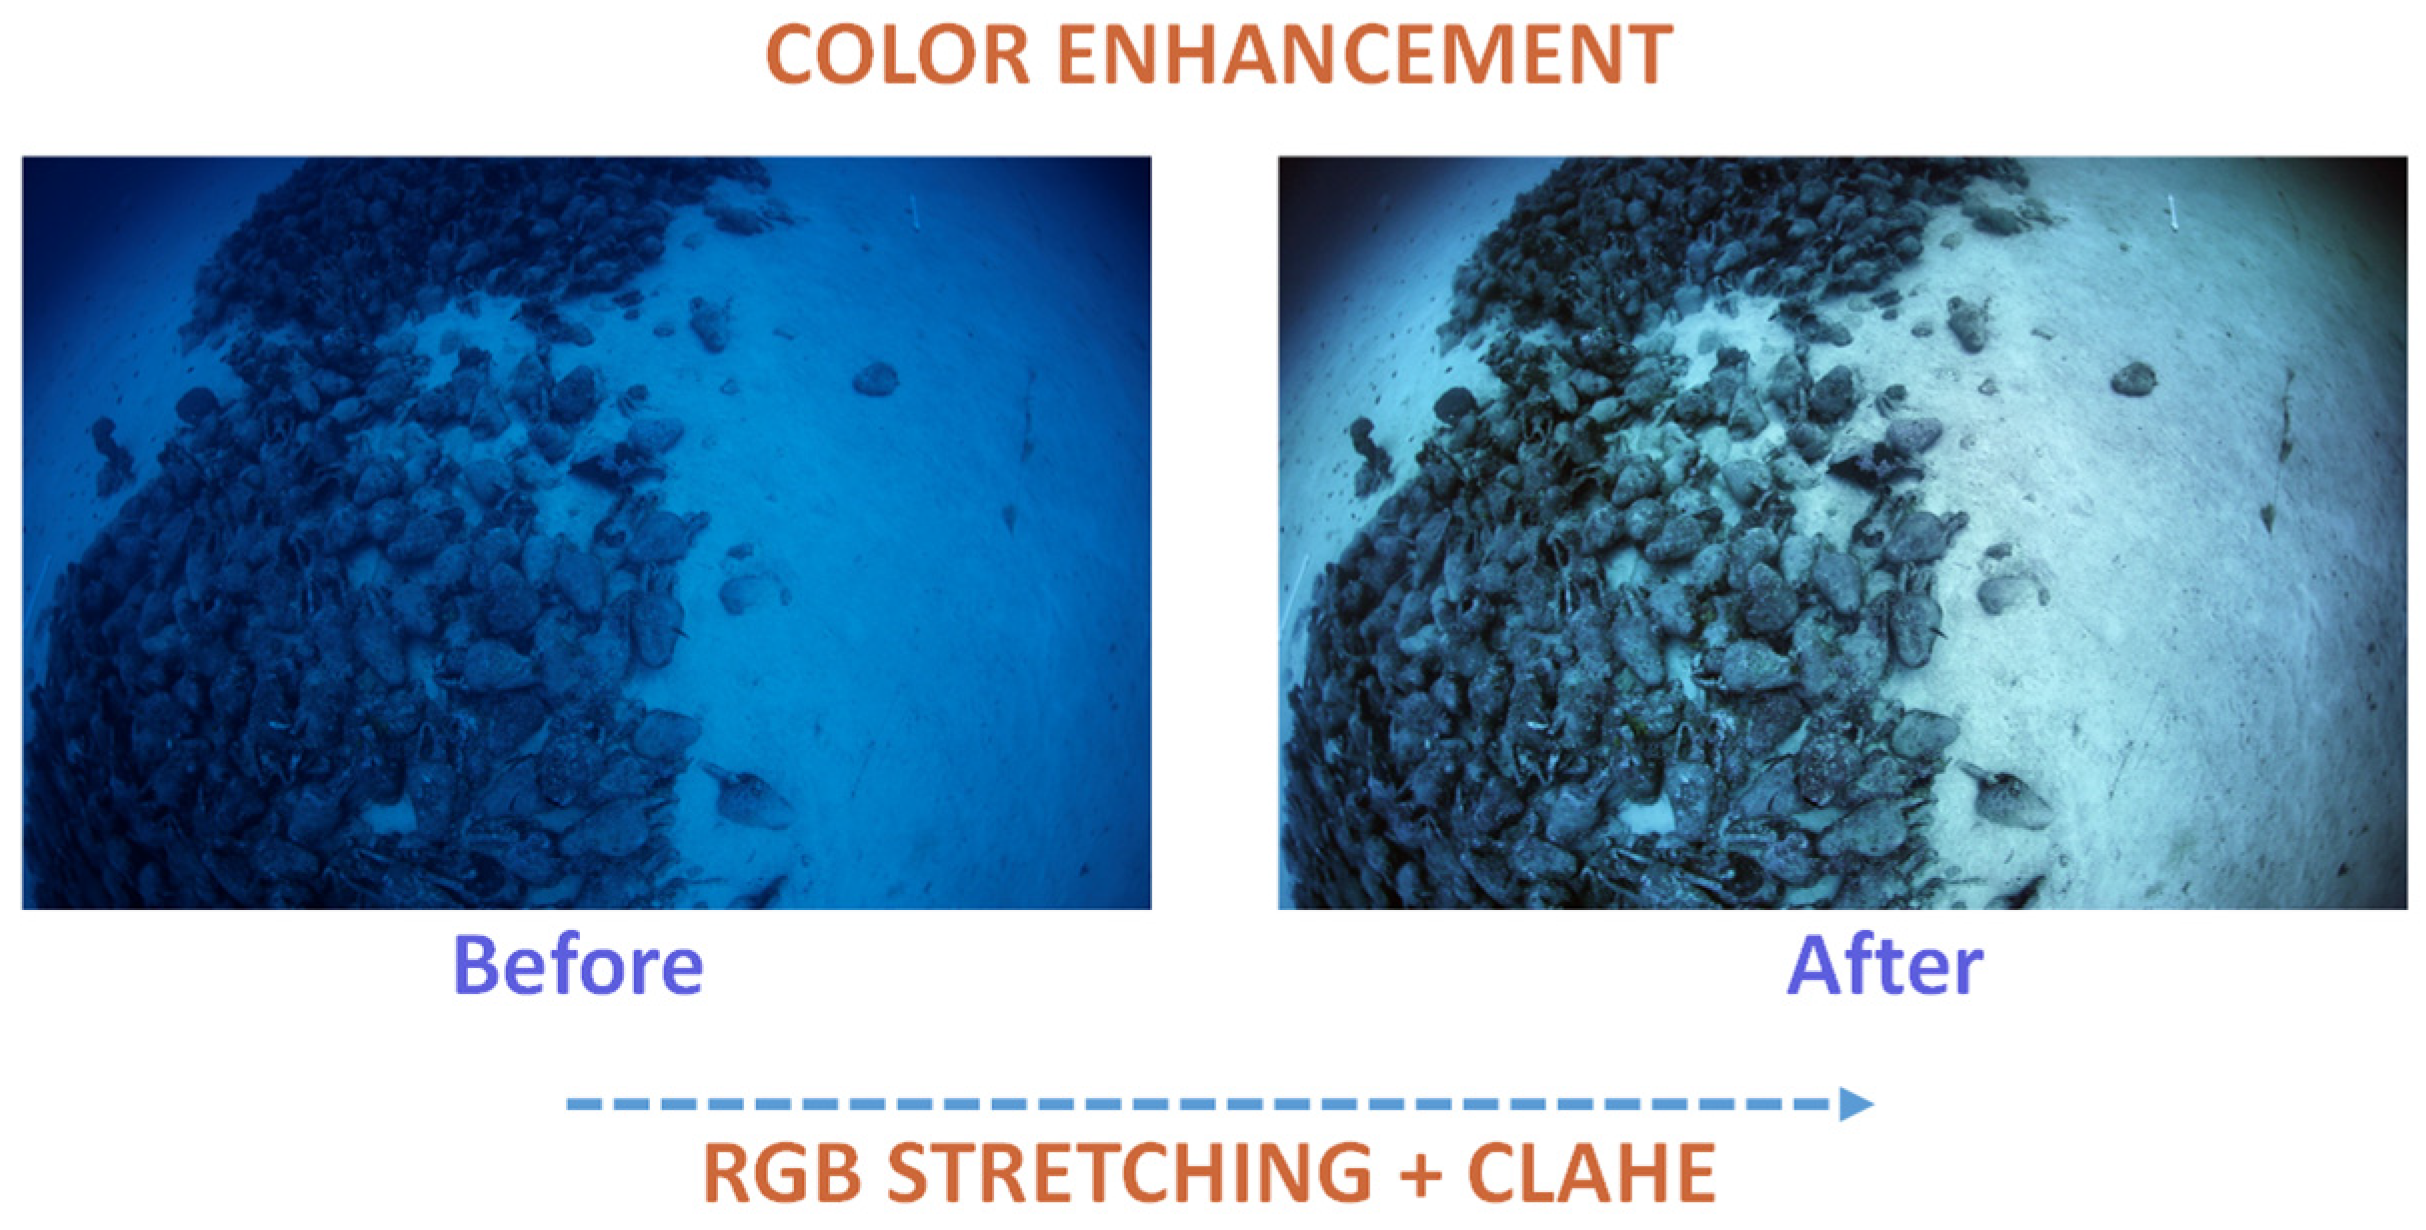
3.1. Image Enhancement
3.2. Efficient Colormap Selection Using Heuristics
| Algorithm 1: Heuristic Approach for Finding the Optimal Colormaps |
Data: Images, cmaps_list, cmaps_to_reduce
|
3.3. Enhancing 3D Reconstruction with Colormaps
3.4. Implementation Details
4. Experimental Evaluation
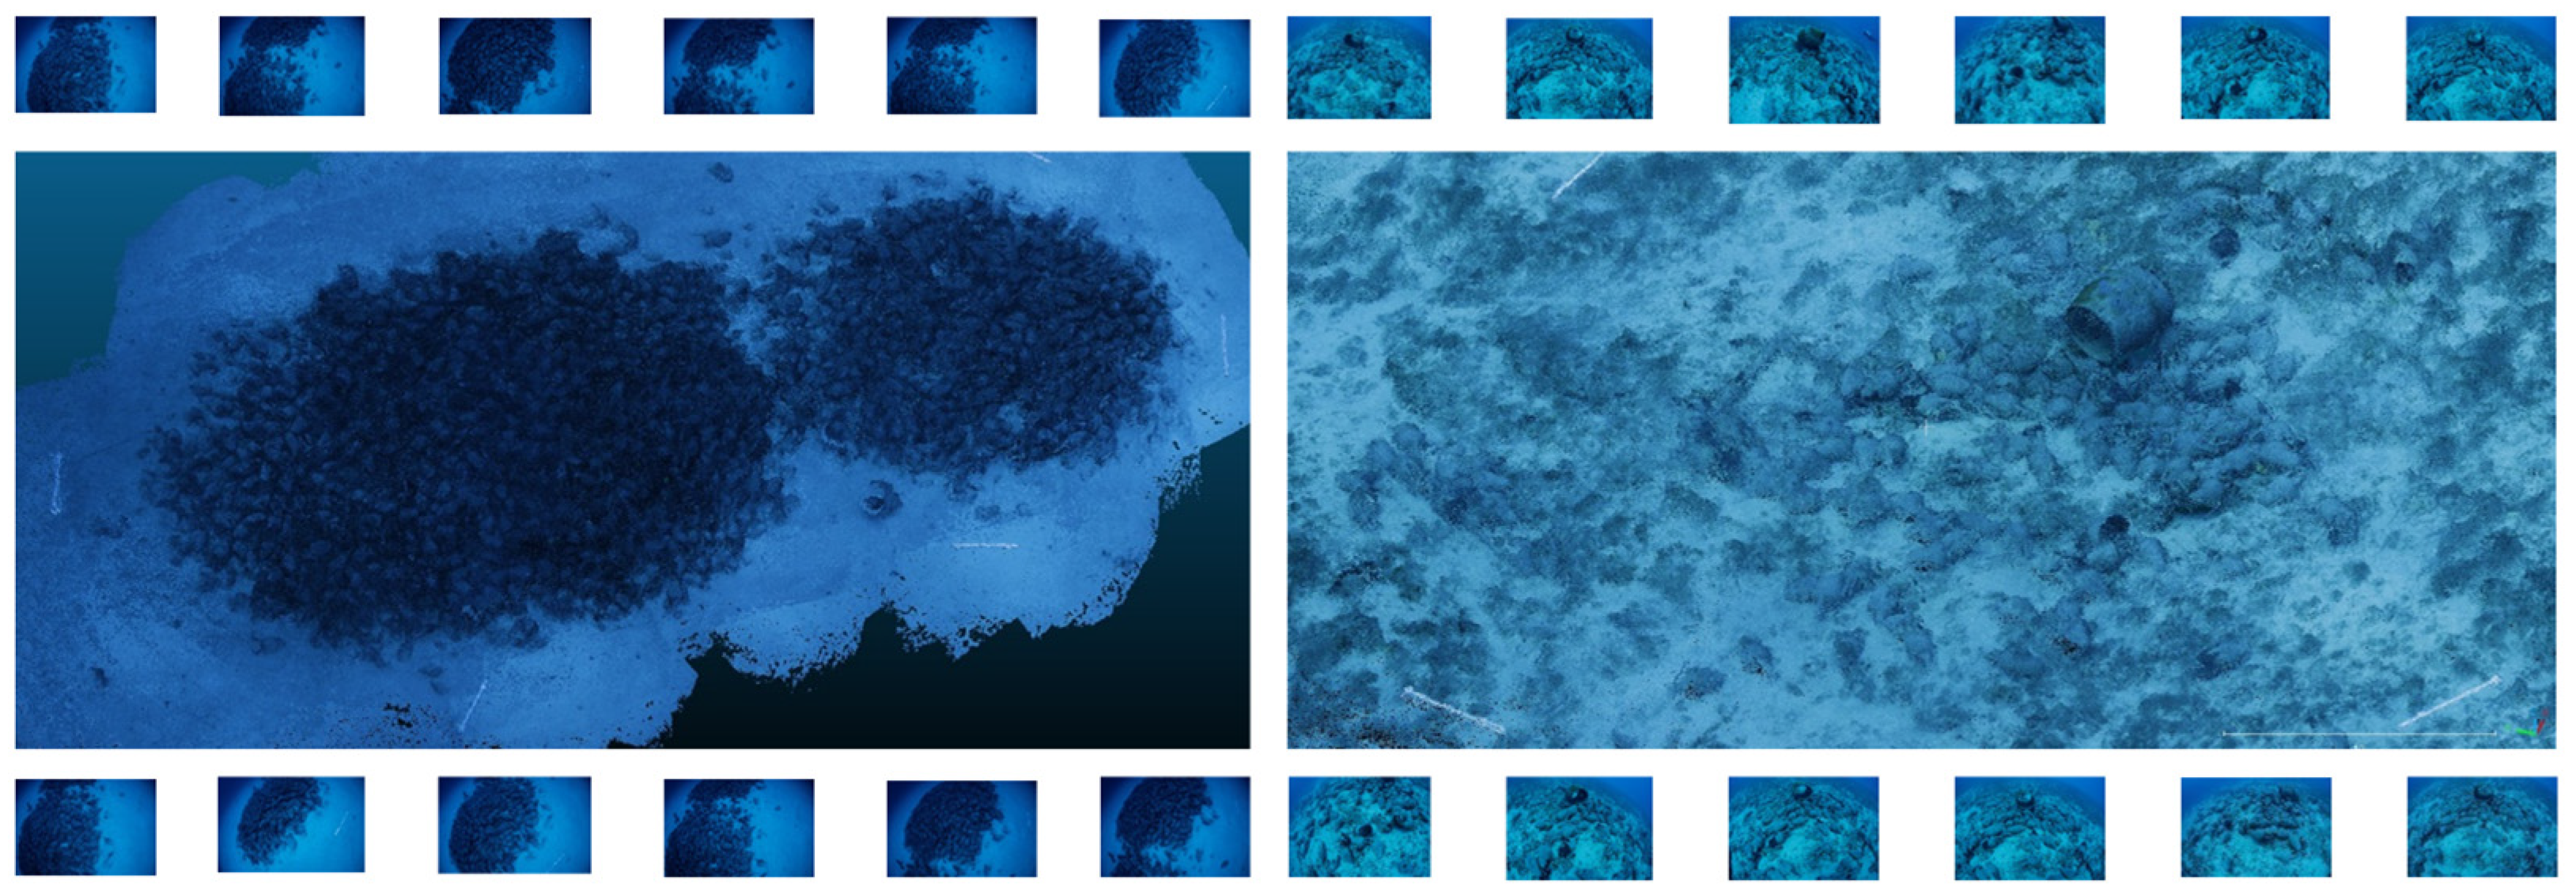
4.1. Dataset
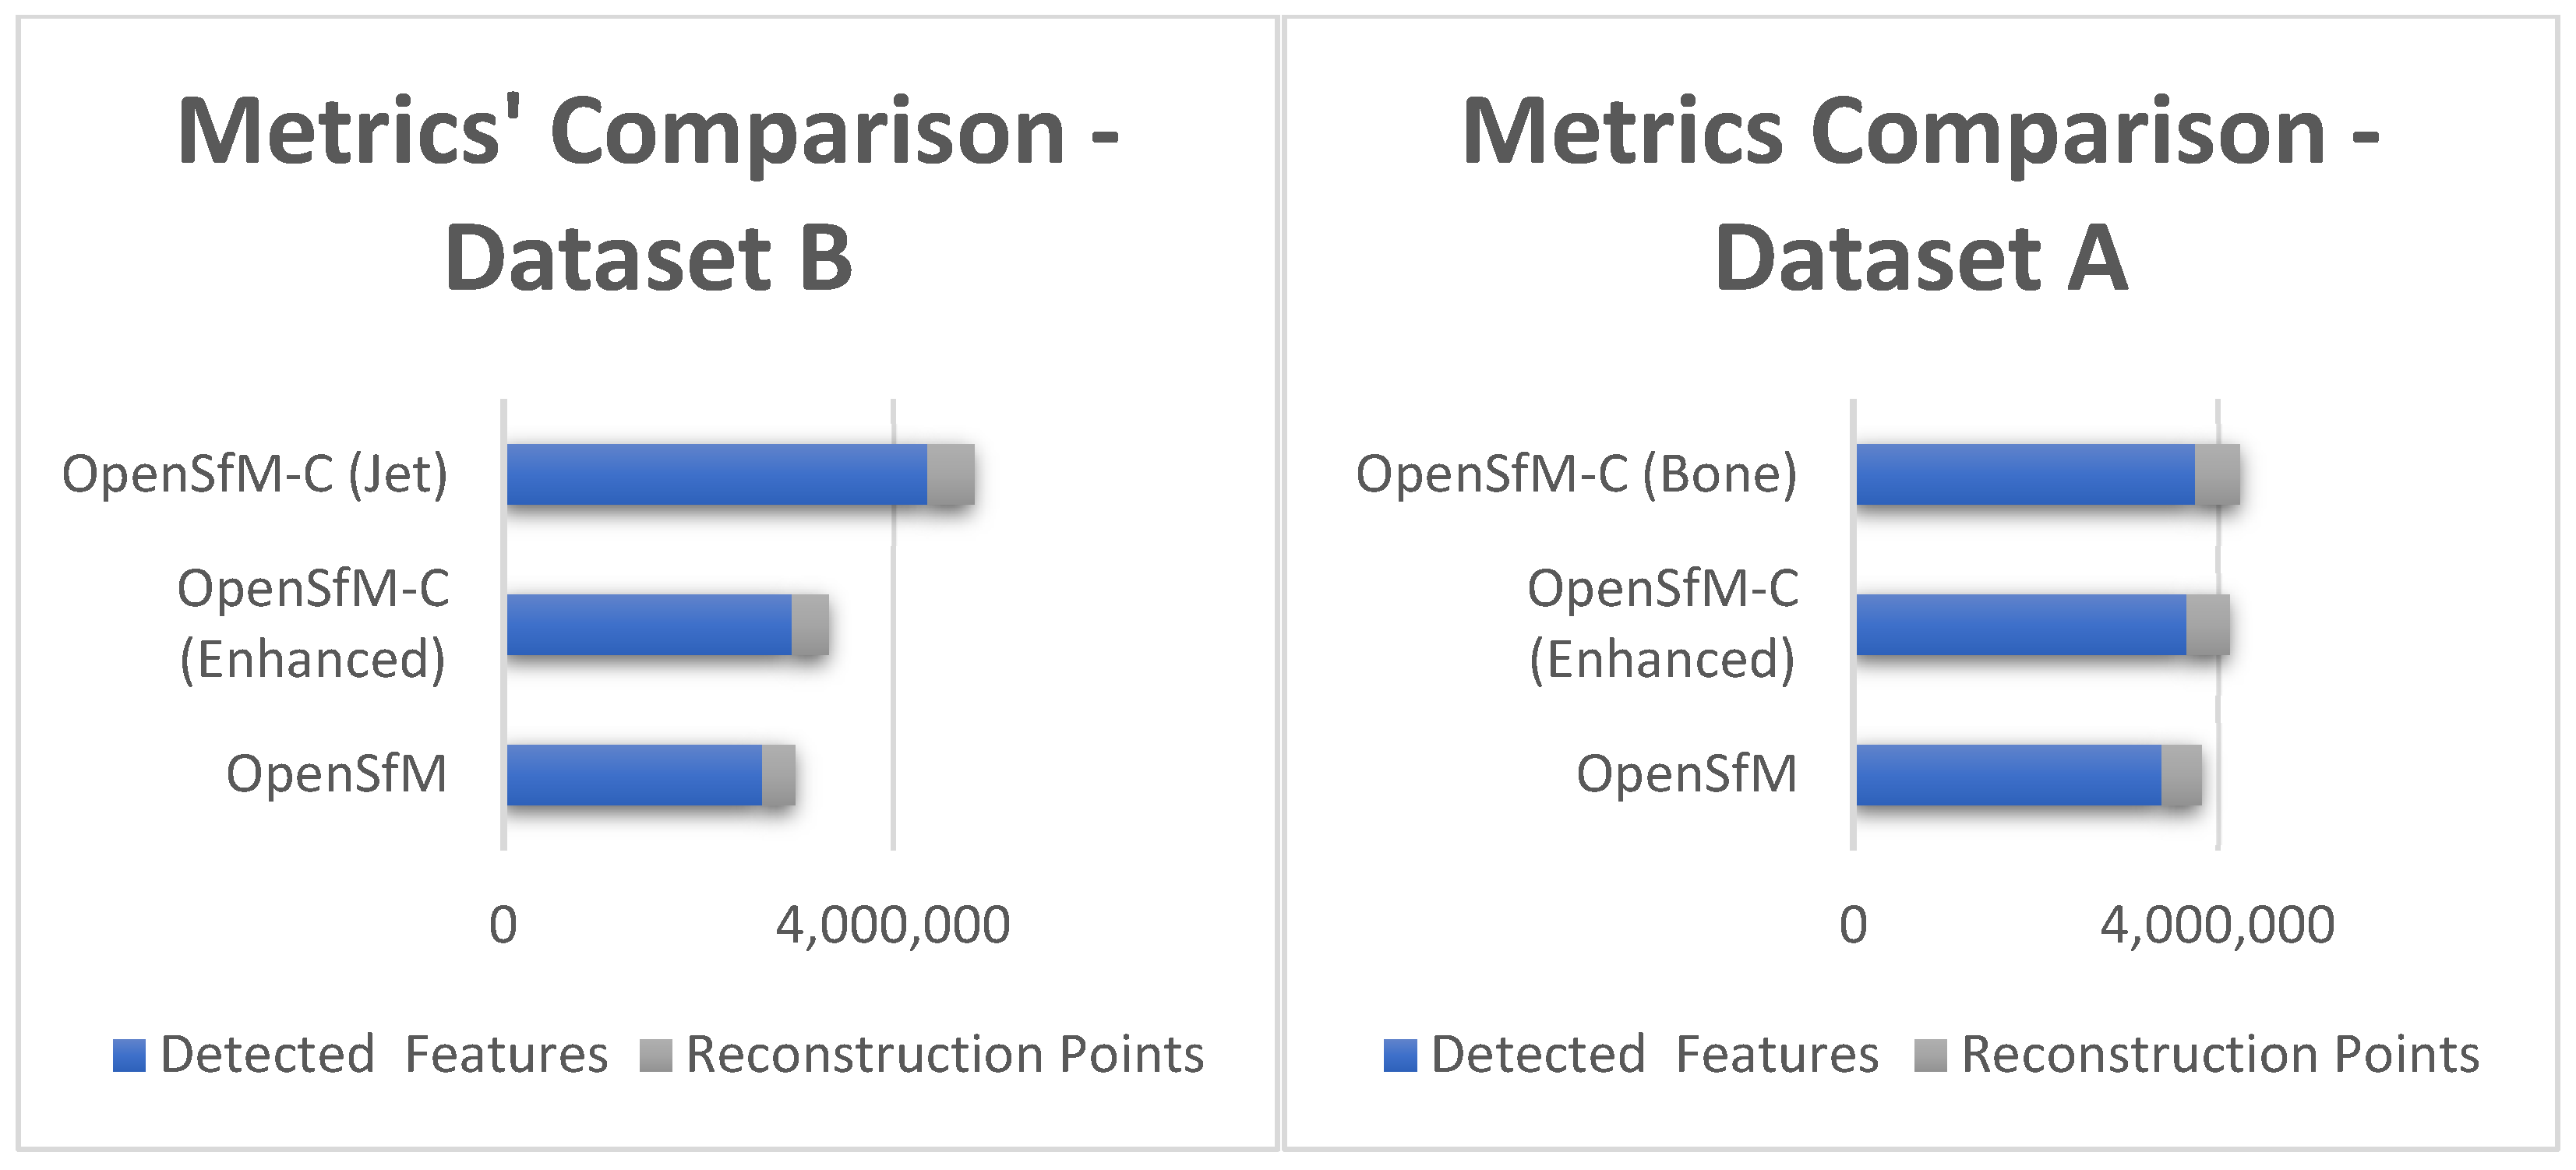
4.2. Results
5. Conclusions
Author Contributions
Funding
Institutional Review Board Statement
Informed Consent Statement
Data Availability Statement
Acknowledgments
Conflicts of Interest
References
- Dimara, A.; Psarros, D.; Vrochidis, A.; Papaioannou, A.; Krinidis, S.; Anagnostopoulos, C.N. Mixed Reality’s and 3D Modelling Role in Cultural Heritage Preservation as a Pathway to Sustainable Heritage and Management. In IFIP International Conference on Artificial Intelligence Applications and Innovations; Springer Nature: Cham, Switzerland, 2024; pp. 405–418. [Google Scholar] [CrossRef]
- Alldieck, T.; Zanfir, M.; Sminchisescu, C. Photorealistic Monocular 3D Reconstruction of Humans Wearing Clothing. In Proceedings of the IEEE/CVF Conference on Computer Vision and Pattern Recognition, New Orleans, LA, USA, 18–24 June 2022; pp. 1506–1515. [Google Scholar] [CrossRef]
- Ferdani, D.; Fanini, B.; Piccioli, M.C.; Carboni, F.; Vigliarolo, P. 3D Reconstruction and Validation of Historical Background for Immersive VR Applications and Games: The Case Study of the Forum of Augustus in Rome. J. Cult. Herit. 2020, 43, 129–143. [Google Scholar] [CrossRef]
- Schonberger, J.L.; Frahm, J.M. Structure-from-Motion Revisited. In Proceedings of the IEEE Conference on Computer Vision and Pattern Recognition, Las Vegas, NV, USA, 27–30 June 2016; pp. 4104–4113. [Google Scholar] [CrossRef]
- Snavely, N.; Seitz, S.M.; Szeliski, R. Modeling the World from Internet Photo Collections. Int. J. Comput. Vis. 2008, 80, 189–210. [Google Scholar] [CrossRef]
- Liu, Y.; Yan, Z.; Tan, J.; Li, Y. Multi-purpose oriented single nighttime image haze removal based on unified variational retinex model. IEEE Trans. Circuits Syst. Video Technol. 2022, 33, 1643–1657. [Google Scholar] [CrossRef]
- Aldeeb, N.H.; Hellwich, O. 3D Reconstruction Under Weak Illumination Using Visibility-Enhanced LDR Imagery. In Advances in Computer Vision: Proceedings of the 2019 Computer Vision Conference (CVC); Springer: Cham, Switzerland, 2020; Volume 1, pp. 515–534. [Google Scholar] [CrossRef]
- Guo, H.; Peng, S.; Lin, H.; Wang, Q.; Zhang, G.; Bao, H.; Zhou, X. Neural 3D Scene Reconstruction with the Manhattan-World Assumption. In Proceedings of the IEEE/CVF Conference on Computer Vision and Pattern Recognition, New Orleans, LA, USA, 18–24 June 2022; pp. 5511–5520. [Google Scholar] [CrossRef]
- Williams, F.; Gojcic, Z.; Khamis, S.; Zorin, D.; Bruna, J.; Fidler, S.; Litany, O. Neural Fields as Learnable Kernels for 3D Reconstruction. In Proceedings of the IEEE/CVF Conference on Computer Vision and Pattern Recognition, New Orleans, LA, USA, 18–24 June 2022; pp. 18500–18510. [Google Scholar] [CrossRef]
- Wang, D.; Cui, X.; Chen, X.; Zou, Z.; Shi, T.; Salcudean, S.; Ward, R. Multi-View 3D Reconstruction with Transformers. In Proceedings of the IEEE/CVF International Conference on Computer Vision, Montreal, QC, Canada, 10–17 October 2021; pp. 5722–5731. [Google Scholar] [CrossRef]
- Sun, J.; Xie, Y.; Chen, L.; Zhou, X.; Bao, H. NeuralRecon: Real-Time Coherent 3D Reconstruction from Monocular Video. In Proceedings of the IEEE/CVF Conference on Computer Vision and Pattern Recognition, Nashville, TN, USA, 20–25 June 2021; pp. 15598–15607. [Google Scholar] [CrossRef]
- Liu, S.L.; Guo, H.X.; Pan, H.; Wang, P.S.; Tong, X.; Liu, Y. Deep Implicit Moving Least-Squares Functions for 3D Reconstruction. In Proceedings of the IEEE/CVF Conference on Computer Vision and Pattern Recognition, Nashville, TN, USA, 20–25 June 2021; pp. 1788–1797. [Google Scholar] [CrossRef]
- Kataria, R.; DeGol, J.; Hoiem, D. Improving Structure from Motion with Reliable Resectioning. In Proceedings of the International Conference on 3D Vision, Fukuoka, Japan, 25–28 November 2020; pp. 41–50. [Google Scholar] [CrossRef]
- Chen, S.; Zhang, K.; Shi, Y.; Wang, H.; Zhu, Y.; Song, G.; Zwicker, M. PAniC-3D: Stylized Single-View 3D Reconstruction from Portraits of Anime Characters. In Proceedings of the IEEE/CVF Conference on Computer Vision and Pattern Recognition, Vancouver, BC, Canada, 17–24 June 2023; pp. 21068–21077. [Google Scholar] [CrossRef]
- Zins, P.; Xu, Y.; Boyer, E.; Wuhrer, S.; Tung, T. Data-Driven 3D Reconstruction of Dressed Humans from Sparse Views. In Proceedings of the International Conference on 3D Vision (3DV), London, UK, 1–3 December 2021; pp. 494–504. [Google Scholar] [CrossRef]
- DeGol, J.; Bretl, T.; Hoiem, D. Improved Structure from Motion Using Fiducial Marker Matching. In Proceedings of the European Conference on Computer Vision (ECCV), Munich, Germany, 8–14 September 2018; pp. 273–288. [Google Scholar] [CrossRef]
- Matsumoto, T.; Hanari, T.; Kawabata, K.; Yashiro, H.; Nakamura, K. Integration of 3D Environment Models Generated from the Sections of the Image Sequence Based on the Consistency of the Estimated Camera Trajectories. IFAC-Pap. 2023, 56, 11281–11286. [Google Scholar] [CrossRef]
- Hanari, T.; Kawabata, K.; Nakamura, K. Image Selection Method from Image Sequence to Improve Computational Efficiency of 3D Reconstruction: Analysis of Inter-Image Displacement Based on Optical Flow for Evaluating 3D Reconstruction Performance. In Proceedings of the IEEE/SICE International Symposium on System Integration (SII), Narvik, Norway, 9–12 January 2022; pp. 1041–1045. [Google Scholar] [CrossRef]
- DeBortoli, R.; Nicolai, A.; Li, F.; Hollinger, G.A. Real-Time Underwater 3D Reconstruction Using Global Context and Active Labeling. In Proceedings of the IEEE International Conference on Robotics and Automation (ICRA), Brisbane, QLD, Australia, 21–25 May 2018; pp. 6204–6211. [Google Scholar] [CrossRef]
- Guerneve, T.; Petillot, Y. Underwater 3D reconstruction using BlueView imaging sonar. In Proceedings of the IEEE OCEANS, Genova, Italy, 18–21 May 2015. [Google Scholar] [CrossRef]
- Maccarone, A.; Drummond, K.; McCarthy, A.; Steinlehner, U.K.; Tachella, J.; Garcia, D.A.; Pawlikowska, A.; Lamb, R.A.; Henderson, R.K.; McLaughlin, S.; et al. Submerged single-photon LiDAR imaging sensor used for real-time 3D scene reconstruction in scattering underwater environments. Opt. Express 2023, 31, 16690–16708. [Google Scholar] [CrossRef] [PubMed]
- Kulawiak, M.; Łubniewski, Z. 3D object shape reconstruction from underwater multibeam data and overground LiDAR scanning. Pol. Marit. Res. 2018, 2, 47–56. [Google Scholar] [CrossRef]
- Vrochidis, A.; Charalampous, P.; Dimitriou, N.; Kladovasilakis, N.; Chatzakis, M.; Georgiadis, G.; Tzovaras, D.; Krinidis, S. Automatic elevator shaft inspection using a multi-sensor measuring system and computer vision techniques. J. Build. Eng. 2024, 82, 108358. [Google Scholar] [CrossRef]
- Skarlatos, D.; Agrafiotis, P. Image-based underwater 3D reconstruction for cultural heritage: From image collection to 3D. Critical steps and considerations. In Visual Computing for Cultural Heritage; Springer: Cham, Switzerland, 2020; pp. 141–158. [Google Scholar] [CrossRef]
- Eltner, A.; Sofia, G. Structure from motion photogrammetric technique. Dev. Earth Surf. Process. 2020, 23, 1–24. [Google Scholar] [CrossRef]
- Wang, X.; Wang, C.; Liu, B.; Zhou, X.; Zhang, L.; Zheng, J.; Bai, X. Multi-view stereo in the deep learning era: A comprehensive review. Displays 2021, 70, 102102. [Google Scholar] [CrossRef]
- Calantropio, A.; Chiabrando, F. Underwater cultural heritage documentation using photogrammetry. J. Mar. Sci. Eng. 2024, 12, 413. [Google Scholar] [CrossRef]
- Kabadayı, A.; Erdoğan, A. Application of terrestrial photogrammetry method in cultural heritage studies: A case study of Seyfeddin Karasungur. Mersin Photogramm. J. 2022, 4, 62–67. [Google Scholar] [CrossRef]
- Xue, Y.; Shi, P.; Jia, F.; Huang, H. 3D reconstruction and automatic leakage defect quantification of metro tunnel based on SfM-Deep learning method. Undergr. Space 2022, 7, 311–323. [Google Scholar] [CrossRef]
- Berrett, B.E.; Vernon, C.A.; Beckstrand, H.; Pollei, M.; Markert, K.; Franke, K.W.; Hedengren, J.D. Large-scale reality modeling of a university campus using combined UAV and terrestrial photogrammetry for historical preservation and practical use. Drones 2021, 5, 136. [Google Scholar] [CrossRef]
- Thyng, K.M.; Greene, C.A.; Hetland, R.D.; Zimmerle, H.M.; DiMarco, S.F. True colors of oceanography: Guidelines for effective and accurate colormap selection. Oceanography 2016, 29, 9–13. [Google Scholar] [CrossRef]
- Zhang, H.; Zheng, R.; Zhang, W.; Shao, J.; Miao, J. An improved SIFT underwater image stitching method. Appl. Sci. 2023, 13, 12251. [Google Scholar] [CrossRef]
- Bay, H.; Ess, A.; Tuytelaars, T.; Van Gool, L. Speeded-up robust features (SURF). Comput. Vis. Image Underst. 2008, 110, 346–359. [Google Scholar] [CrossRef]
- Kalms, L.; Mohamed, K.; Göhringer, D. Accelerated embedded AKAZE feature detection algorithm on FPGA. In Proceedings of the 8th International Symposium on Highly Efficient Accelerators and Reconfigurable Technologies, Bochum, Germany, 7–9 June 2017; pp. 1–6. [Google Scholar] [CrossRef]
- Meza, J.; Marrugo, A.G.; Sierra, E.; Guerrero, M.; Meneses, J.; Romero, L.A. A structure-from-motion pipeline for topographic reconstructions using unmanned aerial vehicles and open-source software. Commun. Comput. Inf. Sci. 2018, 885, 213–225. [Google Scholar] [CrossRef]
- Aglave, P.; Kolkure, V.S. Implementation of high-performance feature extraction method using oriented fast and rotated brief algorithm. Int. J. Res. Eng. Technol. 2015, 4, 394–397. [Google Scholar] [CrossRef]


| Paper | Real Conditions | Cost-Effective | Multiple Datasets | Scalability | Effective in Poor Light |
|---|---|---|---|---|---|
| [8] Manhattan-world assumption | ✓ | ✓ | |||
| [9] Learnable kernels for reconstruction | ✓ | ||||
| [14] Reconstruction of Characters | ✓ | ✓ | ✓ | ||
| [16] Fiducial markers in OpenSfM | ✓ | ||||
| [19] Reconstruction using global context | ✓ | ✓ | ✓ | ||
| [22] Sonar and LiDAR fusion | ✓ | ✓ | |||
| [30] UAV photogrammetry | ✓ | ✓ | ✓ | ||
| Reconstruction with colormaps | ✓ | ✓ | ✓ | ✓ | ✓ |
| Methodology | Detected Features | Features per Image | Reconstruction Points |
|---|---|---|---|
| OpenSfM | 3,386,593 | 12,094 | 434,644 |
| OpenSfM-C (enhanced) | 3,654,379 | 13,051 | 473,649 |
| OpenSfM-C (bone) | 3,752,992 | 13,403 | 488,235 |
| OpenSfM-C (jet) | 3,643,488 | 13,012 | 465,777 |
| OpenSfM-C (rainbow) | 3,680,873 | 13,145 | 468,360 |
| OpenSfM-C (cool) | 3,488,480 | 12,458 | 447,819 |
| OpenSfM-C (twilight_shifted) | 3,613,958 | 12,906 | 477,289 |
| Methodology | Detected Features | Features per Image | Reconstruction Points |
|---|---|---|---|
| OpenSfM | 2,659,585 | 13,297 | 332,970 |
| OpenSfM-C (enhanced) | 2,962,642 | 14,813 | 377,214 |
| OpenSfM-C (jet) | 4,351,002 | 21,755 | 477,549 |
| OpenSfM-C (rainbow) | 4,364,635 | 21,823 | 461,357 |
| OpenSfM-C (summer) | 3,330,044 | 16,650 | 396,215 |
| OpenSfM-C (hsv) | 3,624,432 | 18,122 | 377,129 |
| OpenSfM-C (twilight_shifted) | 4,143,279 | 20,716 | 466,581 |
| 1st Experiments | 2nd Experiments | 3rd Experiments | 4th Experiments | ||||
|---|---|---|---|---|---|---|---|
| Colormap | Matches | Colormap | Matches | Colormap | Matches | Colormap | Matches |
| Jet | 2,938,449 | HSV | 1,810,393 | HSV | 1,676,203 | HSV | 1,751,360 |
| Rainbow | 2,904,357 | Jet | 1,061,223 | Jet | 1,241,391 | Jet | 1,085,490 |
| Twilight_shifted | 2,875,798 | Rainbow | 1,029,413 | Rainbow | 1,089,825 | Rainbow | 1,033,242 |
| Twilight | 2,412,982 | Twilight_shifted | 1,009,980 | Twilight_shifted | 1,062,671 | Twilight_shifted | 1,014,891 |
| 1st Experiments | 2nd Experiments | 3rd Experiments | 4th Experiments | ||||
|---|---|---|---|---|---|---|---|
| Colormap | Matches | Colormap | Matches | Colormap | Matches | Colormap | Matches |
| Jet | 3,840,136 | Rainbow | 3,892,886 | Jet | 4,002,670 | Jet | 3,636,218 |
| Twilight_shifted | 3,820,115 | Twilight | 3,588,457 | Rainbow | 3,747,480 | Twilight | 3,366,883 |
| Rainbow | 3,785,133 | Jet | 3,361,172 | Twilight | 3,724,774 | Rainbow | 3,311,165 |
| Twilight | 3,522,048 | Turbo | 2,501,619 | Twilight_shifted | 2,674,504 | Turbo | 2,539,508 |
Disclaimer/Publisher’s Note: The statements, opinions and data contained in all publications are solely those of the individual author(s) and contributor(s) and not of MDPI and/or the editor(s). MDPI and/or the editor(s) disclaim responsibility for any injury to people or property resulting from any ideas, methods, instructions or products referred to in the content. |
© 2025 by the authors. Licensee MDPI, Basel, Switzerland. This article is an open access article distributed under the terms and conditions of the Creative Commons Attribution (CC BY) license (https://creativecommons.org/licenses/by/4.0/).
Share and Cite
Vrochidis, A.; Tzovaras, D.; Krinidis, S. Enhancing Three-Dimensional Reconstruction Through Intelligent Colormap Selection. Sensors 2025, 25, 2576. https://doi.org/10.3390/s25082576
Vrochidis A, Tzovaras D, Krinidis S. Enhancing Three-Dimensional Reconstruction Through Intelligent Colormap Selection. Sensors. 2025; 25(8):2576. https://doi.org/10.3390/s25082576
Chicago/Turabian StyleVrochidis, Alexandros, Dimitrios Tzovaras, and Stelios Krinidis. 2025. "Enhancing Three-Dimensional Reconstruction Through Intelligent Colormap Selection" Sensors 25, no. 8: 2576. https://doi.org/10.3390/s25082576
APA StyleVrochidis, A., Tzovaras, D., & Krinidis, S. (2025). Enhancing Three-Dimensional Reconstruction Through Intelligent Colormap Selection. Sensors, 25(8), 2576. https://doi.org/10.3390/s25082576