Association of Cut-Point Free Metrics and Common Clinical Tests Among Older Adults After Proximal Femoral Fracture

 , , , , , , ,
  , ,
, ,  , ,
on behalf of the Mobilise-D Consortium
, ,
on behalf of the Mobilise-D Consortium
Abstract
Highlights
- Clinical lower limb assessments (both subjective and objective) were more discriminative in differentiating between the four PFF recovery groups in older adults.
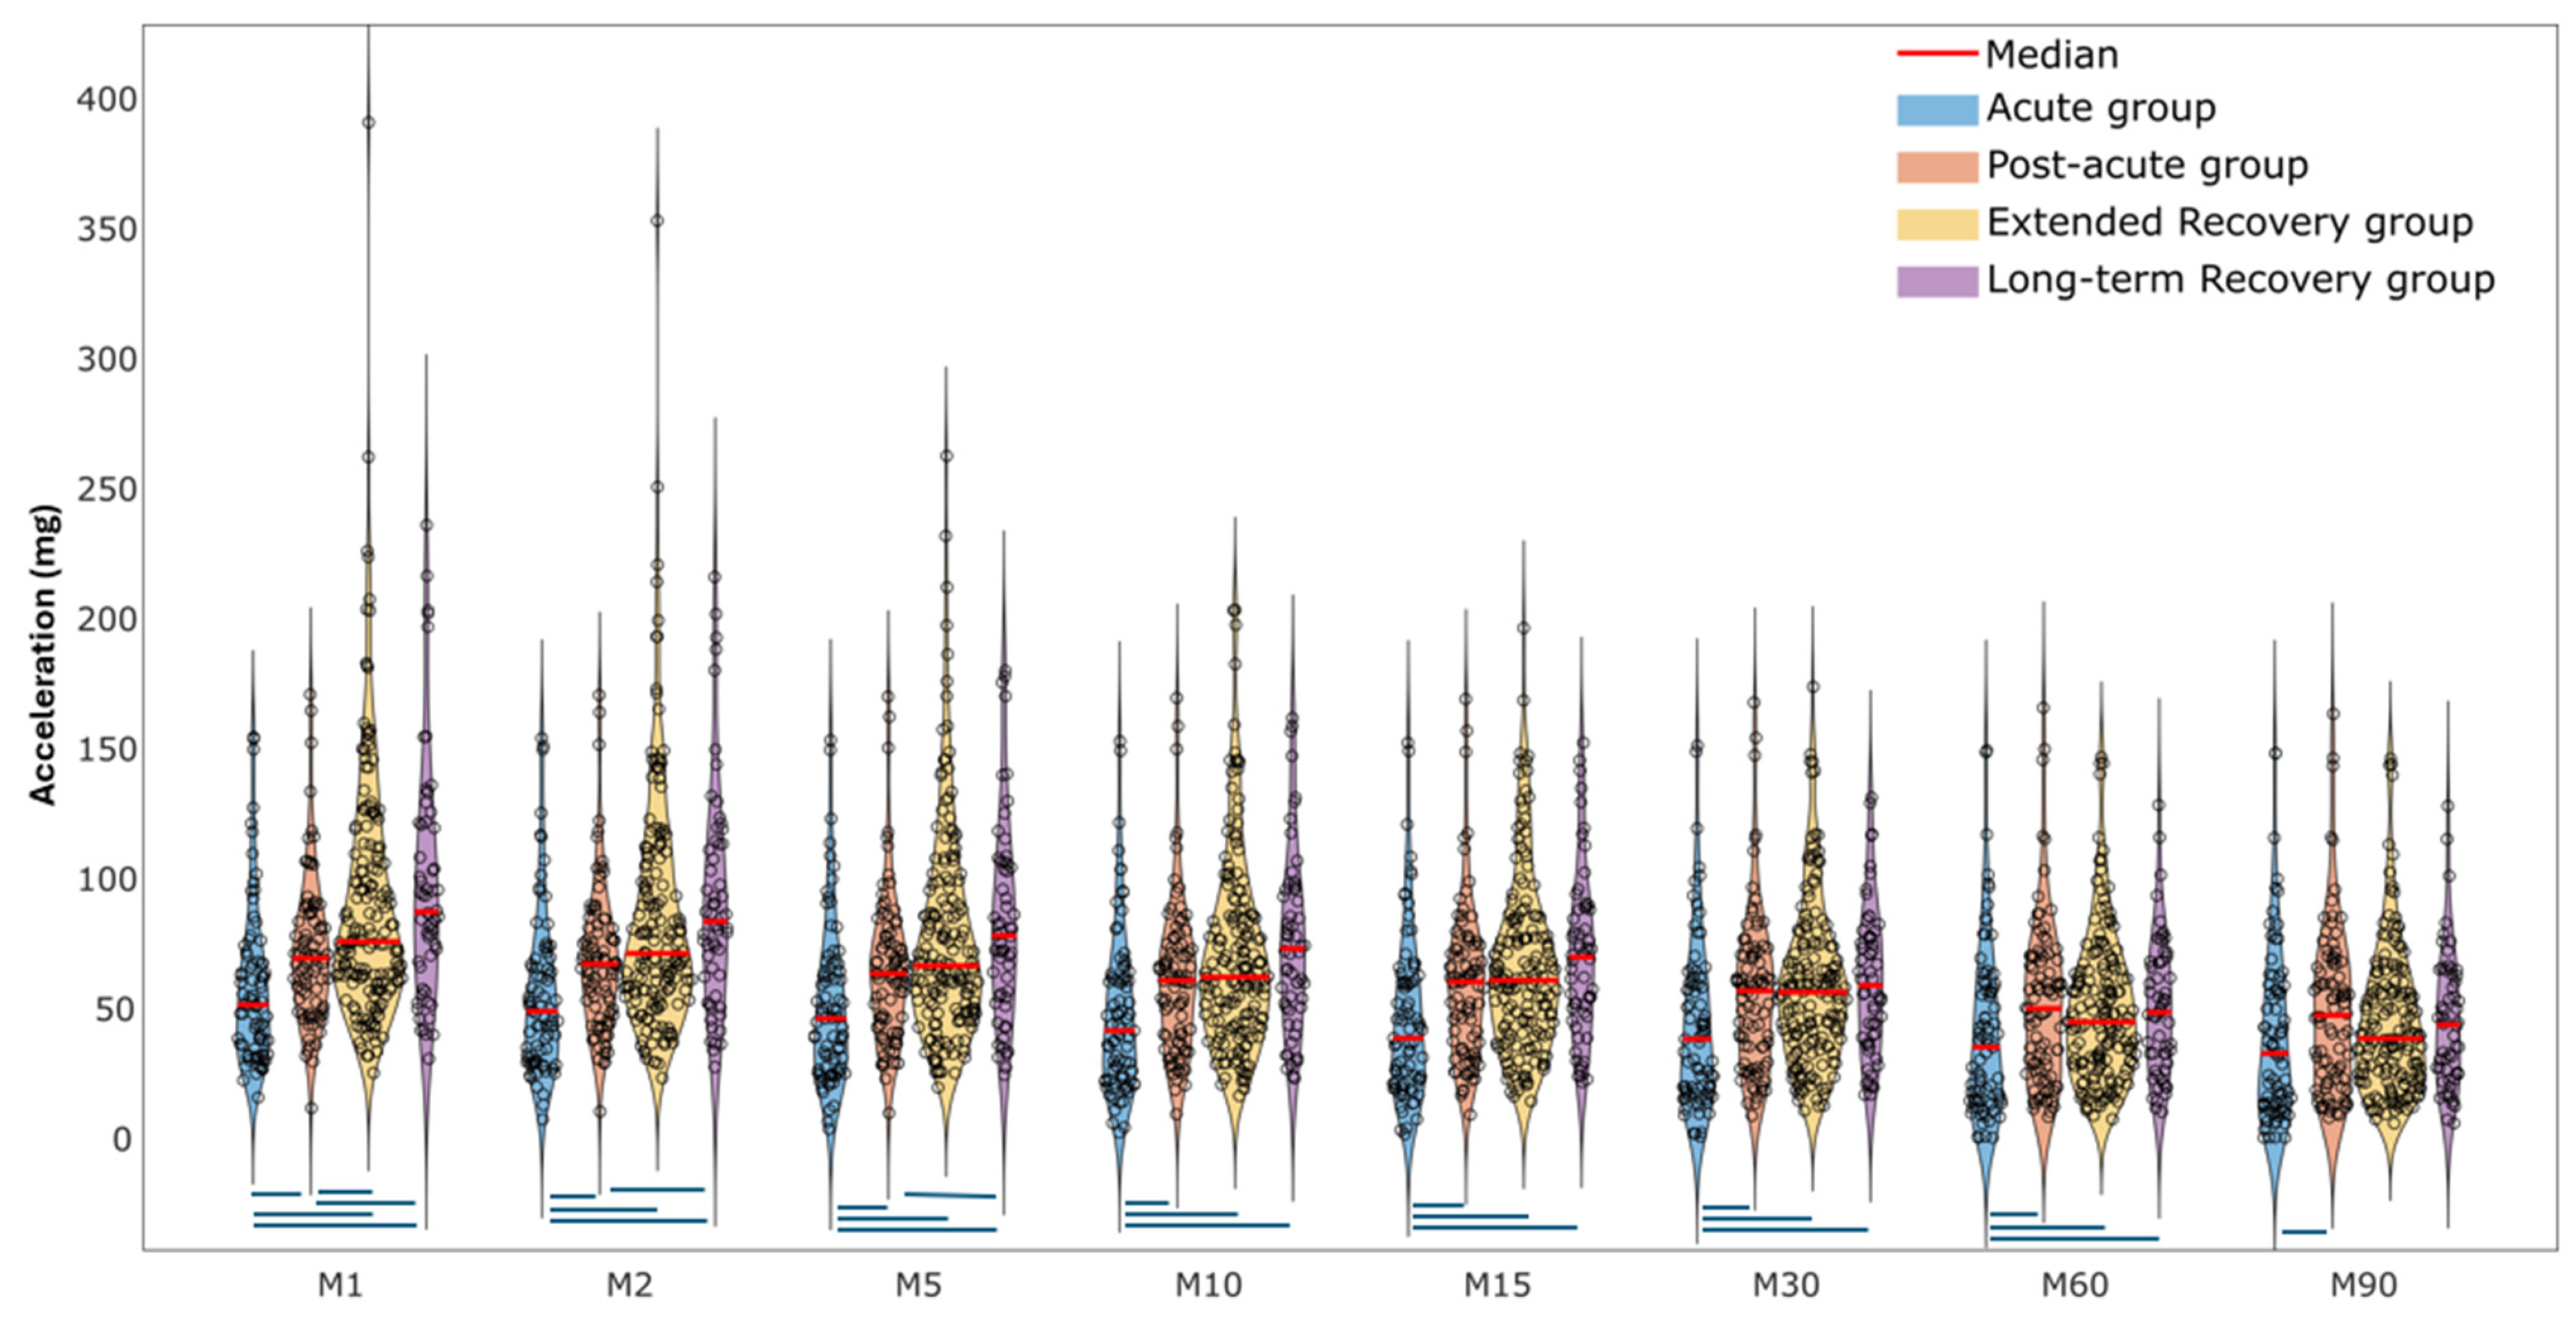
- Older adults in the acute proximal femoral fracture recovery group demonstrated lower physical activity intensity compared to those in later recovery groups, with the differences being more pronounced for shorter-duration MX metrics (M1–M5).
- The cut-point free method (e.g., MX metrics) is useful for measuring the physical activity magnitude of older adults recovering from proximal femoral fractures.
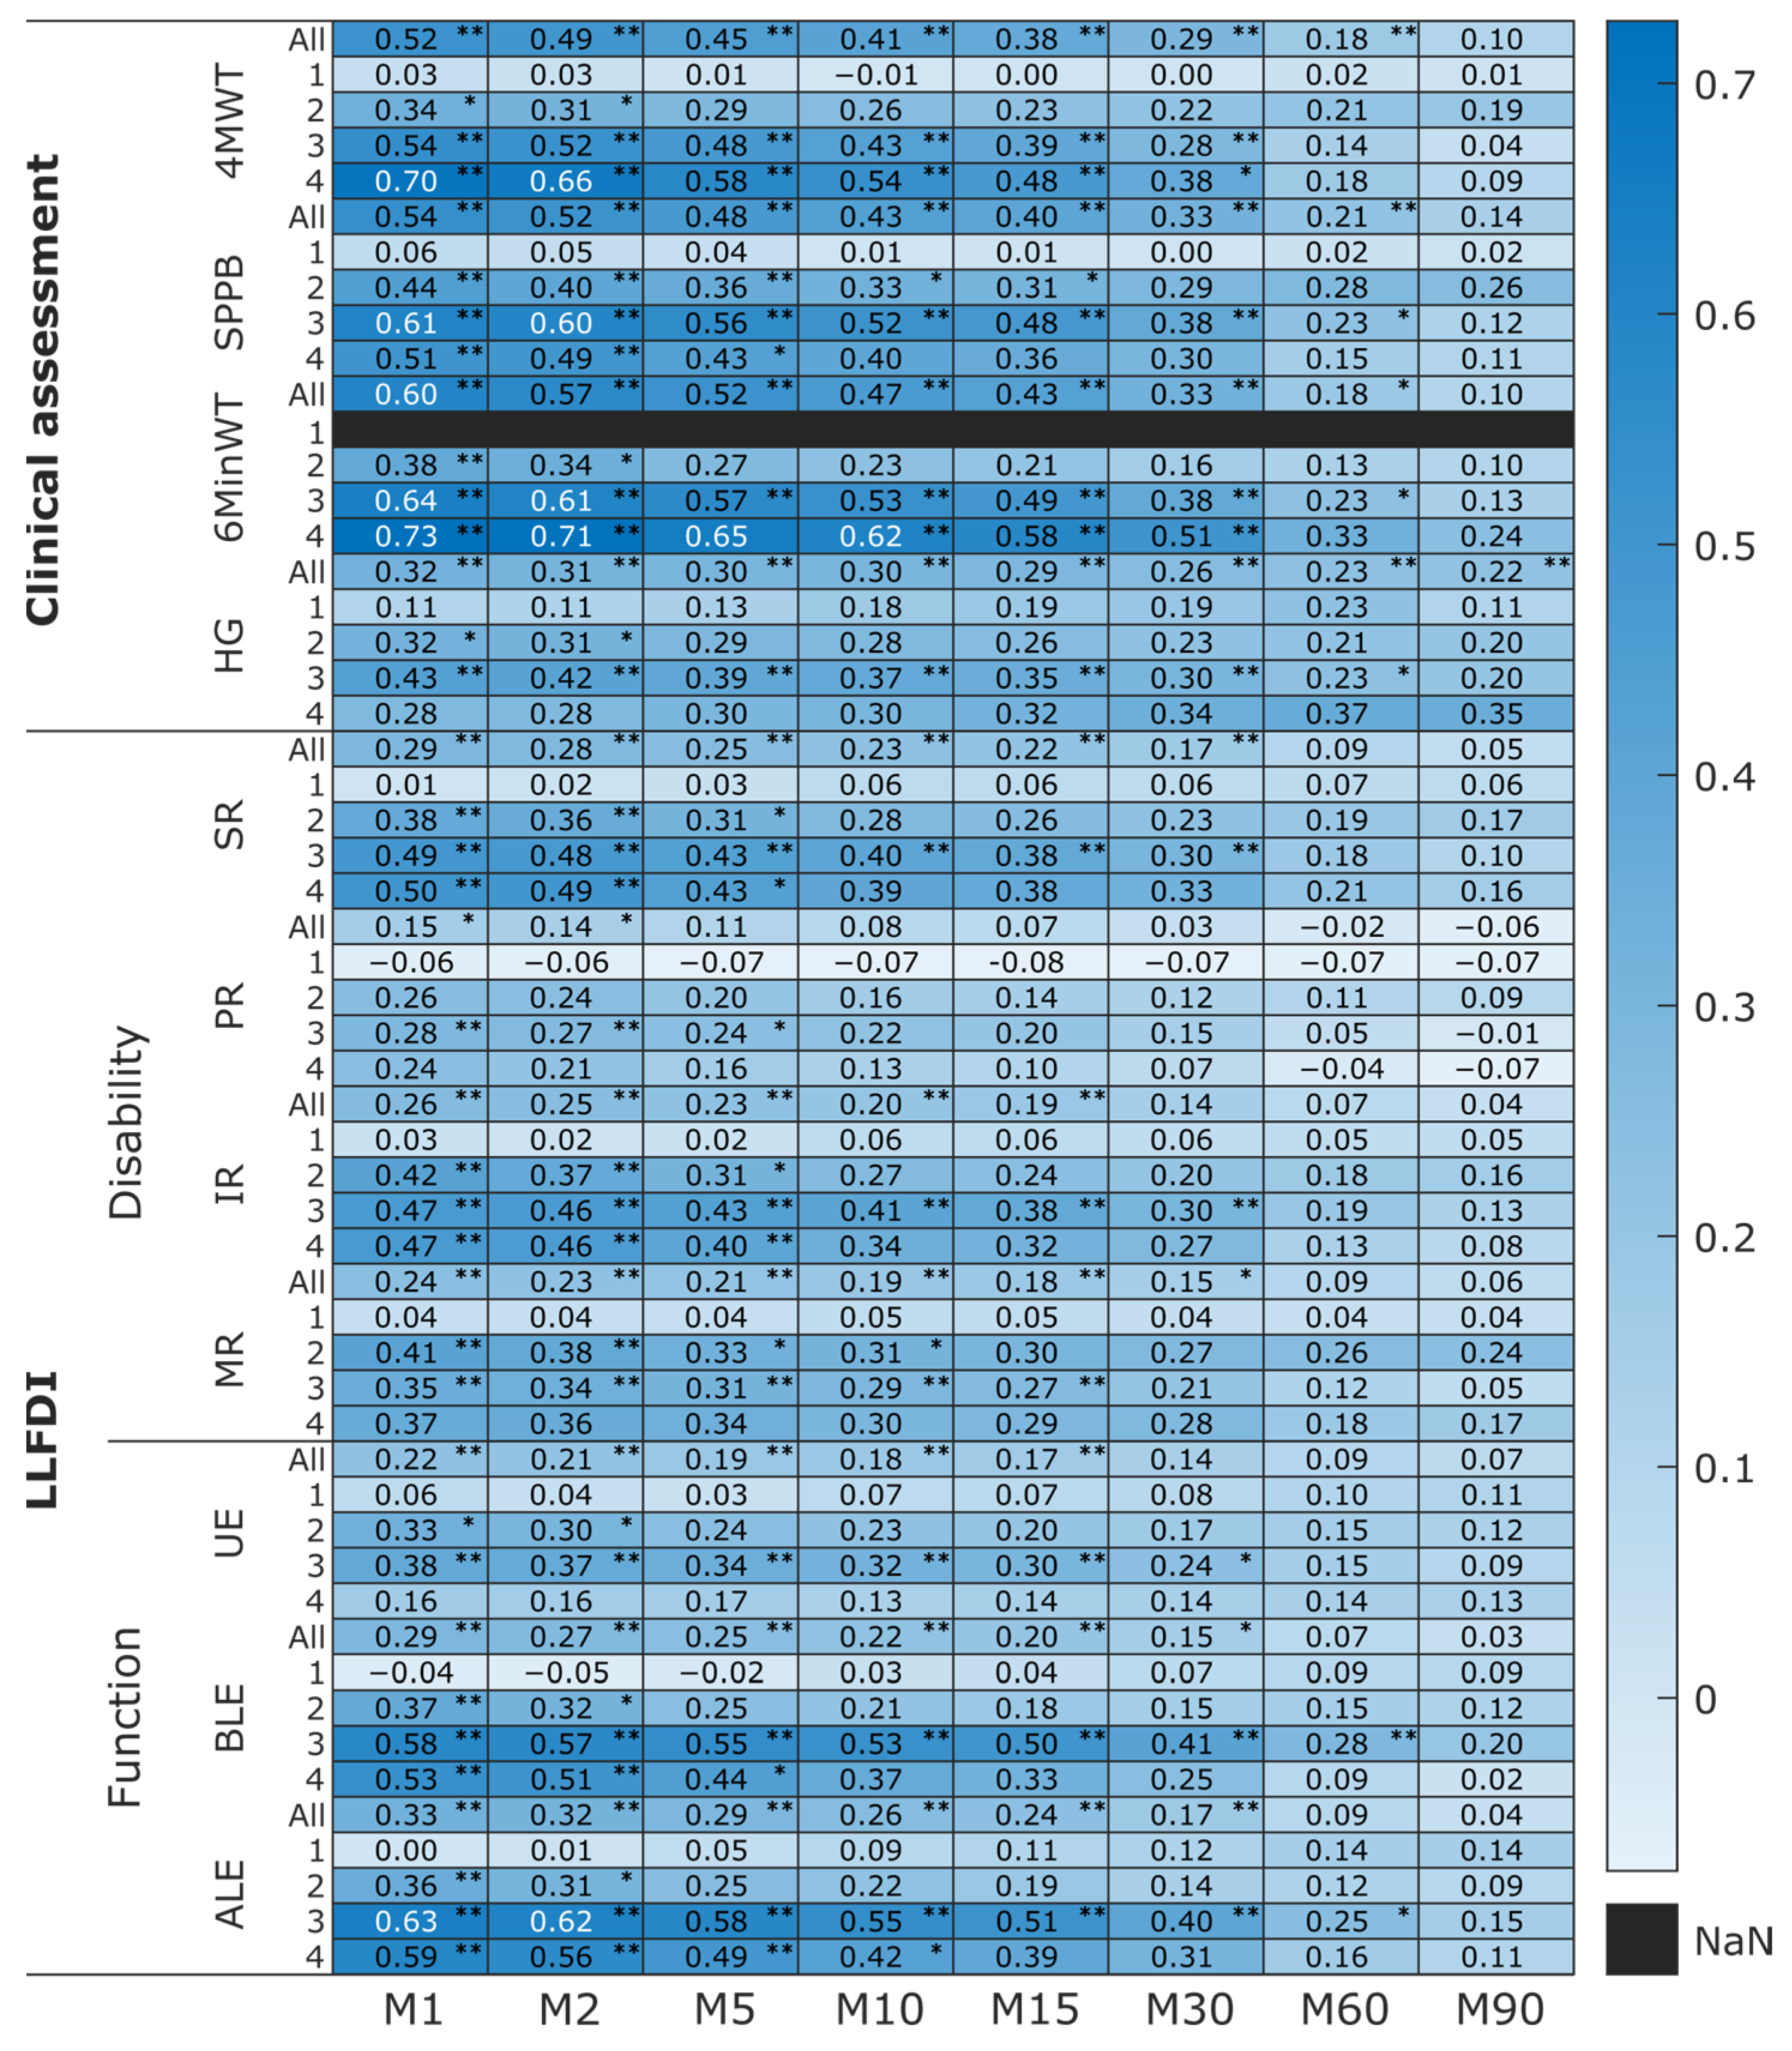
- Higher lower limb capacity and perception outcomes were strongly correlated with greater daily activity intensity, particularly in older adults at later stages of proximal femoral fracture recovery.
Abstract
1. Introduction
2. Materials and Methods
2.1. Design
2.2. Participants
2.3. Tasks and Procedures
2.3.1. Clinical Setting
2.3.2. Daily Life Setting
2.3.3. Accelerometer Processing
2.3.4. Statistical Analysis
3. Results
4. Discussion
5. Conclusions
Supplementary Materials
Author Contributions
Funding
Institutional Review Board Statement
Informed Consent Statement
Data Availability Statement
Acknowledgments
Conflicts of Interest
Abbreviations
| PFF | proximal femoral fracture |
| PA | physical activity |
| SPPB | short physical performance battery |
| 4MWT | 4 m walking test |
| 6MinWT | 6 min walking test |
| HG | hand grip |
| LLFDI | late-life function and disability Instrument |
| MVPA | moderate-to-vigorous physical activity |
| VILPA | vigorous intermittent lifestyle physical activity |
| BMI | body mass index |
| T1 | baseline assessment |
| CVS | clinical validation study |
| mg | milligravitational |
| dps | degrees per second |
References
- Bull, F.C.; Al-Ansari, S.S.; Biddle, S.; Borodulin, K.; Buman, M.P.; Cardon, G.; Carty, C.; Chaput, J.-P.; Chastin, S.; Chou, R. World Health Organization 2020 guidelines on physical activity and sedentary behaviour. Br. J. Sports Med. 2020, 54, 1451–1462. [Google Scholar] [CrossRef] [PubMed]
- Zusman, E.Z.; Dawes, M.G.; Edwards, N.; Ashe, M.C. A systematic review of evidence for older adults’ sedentary behavior and physical activity after hip fracture. Clin. Rehabil. 2018, 32, 679–691. [Google Scholar] [CrossRef] [PubMed]
- Taraldsen, K.; Polhemus, A.; Engdal, M.; Jansen, C.-P.; Becker, C.; Brenner, N.; Blain, H.; Johnsen, L.; Vereijken, B. Evaluation of mobility recovery after hip fracture: A scoping review of randomized controlled studies. Osteoporos. Int. 2024, 35, 203–215. [Google Scholar] [CrossRef]
- Xu, B.Y.; Yan, S.; Low, L.L.; Vasanwala, F.F.; Low, S.G. Predictors of poor functional outcomes and mortality in patients with hip fracture: A systematic review. BMC Musculoskelet. Disord. 2019, 20, 568. [Google Scholar] [CrossRef]
- Haley, S.M.; Jette, A.M.; Coster, W.J.; Kooyoomjian, J.T.; Levenson, S.; Heeren, T.; Ashba, J. Late life function and disability instrument: II. Development and evaluation of the function component. J. Gerontol. Ser. A Biol. Sci. Med. Sci. 2002, 57, M217–M222. [Google Scholar] [CrossRef]
- Beauchamp, M.; Hao, Q.; Kuspinar, A.; Alder, G.; Makino, K.; Nouredanesh, M.; Zhao, Y.; Mikton, C.; Thiyagarajan, J.A.; Diaz, T. Measures of perceived mobility ability in community-dwelling older adults: A systematic review of psychometric properties. Age Ageing 2023, 52, iv100–iv111. [Google Scholar] [CrossRef] [PubMed]
- McCambridge, J.; Witton, J.; Elbourne, D.R. Systematic review of the Hawthorne effect: New concepts are needed to study research participation effects. J. Clin. Epidemiol. 2014, 67, 267–277. [Google Scholar] [CrossRef]
- Stull, D.E.; Leidy, N.K.; Parasuraman, B.; Chassany, O. Optimal recall periods for patient-reported outcomes: Challenges and potential solutions. Curr. Med. Res. Opin. 2009, 25, 929–942. [Google Scholar] [CrossRef]
- Soltani, A.; Aminian, K.; Mazza, C.; Cereatti, A.; Palmerini, L.; Bonci, T.; Paraschiv-Ionescu, A. Algorithms for walking speed estimation using a lower-back-worn inertial sensor: A cross-validation on speed ranges. IEEE Trans. Neural Syst. Rehabil. Eng. 2021, 29, 1955–1964. [Google Scholar] [CrossRef]
- McCamley, J.; Donati, M.; Grimpampi, E.; Mazzà, C. An enhanced estimate of initial contact and final contact instants of time using lower trunk inertial sensor data. Gait Posture 2012, 36, 316–318. [Google Scholar] [CrossRef]
- Zijlstra, W.; Hof, A.L. Assessment of spatio-temporal gait parameters from trunk accelerations during human walking. Gait Posture 2003, 18, 1–10. [Google Scholar] [CrossRef]
- Weiss, A.; Brozgol, M.; Dorfman, M.; Herman, T.; Shema, S.; Giladi, N.; Hausdorff, J.M. Does the evaluation of gait quality during daily life provide insight into fall risk? A novel approach using 3-day accelerometer recordings. Neurorehabilit. Neural Repair 2013, 27, 742–752. [Google Scholar] [CrossRef]
- Troiano, R.P.; McClain, J.J.; Brychta, R.J.; Chen, K.Y. Evolution of accelerometer methods for physical activity research. Br. J. Sports Med. 2014, 48, 1019–1023. [Google Scholar] [CrossRef]
- Lee, I.-M.; Shiroma, E.J. Using accelerometers to measure physical activity in large-scale epidemiological studies: Issues and challenges. Br. J. Sports Med. 2014, 48, 197–201. [Google Scholar] [CrossRef] [PubMed]
- Hernández-Vicente, A.; Marín-Puyalto, J.; Pueyo, E.; Vicente-Rodríguez, G.; Garatachea, N. Physical activity in centenarians beyond cut-point-based accelerometer metrics. Int. J. Environ. Res. Public Health 2022, 19, 11384. [Google Scholar] [CrossRef] [PubMed]
- Migueles, J.H.; Cadenas-Sanchez, C.; Alcantara, J.M.; Leal-Martín, J.; Mañas, A.; Ara, I.; Glynn, N.W.; Shiroma, E.J. Calibration and cross-validation of accelerometer cut-points to classify sedentary time and physical activity from hip and non-dominant and dominant wrists in older adults. Sensors 2021, 21, 3326. [Google Scholar] [CrossRef] [PubMed]
- Troiano, R.P. Evolution of public health physical activity applications of accelerometers: A personal perspective. J. Meas. Phys. Behav. 2023, 6, 13–18. [Google Scholar] [CrossRef]
- Buchan, D.S.; Maylor, B.D. Comparison of physical activity metrics from two research-grade accelerometers worn on the non-dominant wrist and thigh in children. J. Sports Sci. 2023, 41, 80–88. [Google Scholar] [CrossRef]
- Rowlands, A.V.; Sherar, L.B.; Fairclough, S.J.; Yates, T.; Edwardson, C.L.; Harrington, D.M.; Davies, M.J.; Munir, F.; Khunti, K.; Stiles, V.H. A data-driven, meaningful, easy to interpret, standardised accelerometer outcome variable for global surveillance. J. Sci. Med. Sport 2019, 22, 1132–1138. [Google Scholar] [CrossRef]
- Migueles, J.H.; Cadenas-Sanchez, C.; Tudor-Locke, C.; Löf, M.; Esteban-Cornejo, I.; Molina-Garcia, P.; Mora-Gonzalez, J.; Rodriguez-Ayllon, M.; Garcia-Marmol, E.; Ekelund, U. Comparability of published cut-points for the assessment of physical activity: Implications for data harmonization. Scand. J. Med. Sci. Sports 2019, 29, 566–574. [Google Scholar] [CrossRef]
- Fairclough, S.J.; Rowlands, A.V.; del Pozo Cruz, B.; Crotti, M.; Foweather, L.; Graves, L.E.; Hurter, L.; Jones, O.; MacDonald, M.; McCann, D.A. Reference values for wrist-worn accelerometer physical activity metrics in England children and adolescents. Int. J. Behav. Nutr. Phys. Act. 2023, 20, 35. [Google Scholar] [CrossRef]
- Rowlands, A.V.; Dawkins, N.P.; Maylor, B.; Edwardson, C.L.; Fairclough, S.J.; Davies, M.J.; Harrington, D.M.; Khunti, K.; Yates, T. Enhancing the value of accelerometer-assessed physical activity: Meaningful visual comparisons of data-driven translational accelerometer metrics. Sports Med.-Open 2019, 5, 47. [Google Scholar] [CrossRef]
- Olson, R.D.; Vaux-Bjerke, A.; Quam, J.B.; Piercy, K.L.; Troiano, R.P.; George, S.M.; Sprow, K.; Ballard, R.M.; Fulton, J.E.; Galuska, D.A. Physical activity guidelines for Americans. Physical activity guidelines for Americans.Nadar! Swimming Magazine-Periódico Científico Em Esportes e Fitness Aquático-Natação, Pólo Aquático, Nado Sincronizado, Saltos Ornamentais, Travessias Aquáticas. 2023. Available online: https://revistanadar.com.br/index.php/Swimming-Magazine/article/view/48/89 (accessed on 9 April 2025).
- Duncan, M.J.; Rowlands, A.; Lawson, C.; Leddington Wright, S.; Hill, M.; Morris, M.; Eyre, E.; Tallis, J. Using accelerometry to classify physical activity intensity in older adults: What is the optimal wear-site? Eur. J. Sport Sci. 2020, 20, 1131–1139. [Google Scholar] [CrossRef] [PubMed]
- Dawkins, N.P.; Yates, T.; Edwardson, C.L.; Maylor, B.; Davies, M.J.; Dunstan, D.; Highton, P.J.; Herring, L.Y.; Khunti, K.; Rowlands, A.V. Comparing 24 h physical activity profiles: Office workers, women with a history of gestational diabetes and people with chronic disease condition (s). J. Sports Sci. 2021, 39, 219–226. [Google Scholar] [CrossRef]
- Fairclough, S.J.; Rowlands, A.V.; Taylor, S.; Boddy, L.M. Cut-point-free accelerometer metrics to assess children’s physical activity: An example using the school day. Scand. J. Med. Sci. Sports 2020, 30, 117–125. [Google Scholar] [CrossRef]
- Mikolaizak, A.S.; Rochester, L.; Maetzler, W.; Sharrack, B.; Demeyer, H.; Mazzà, C.; Caulfield, B.; Garcia-Aymerich, J.; Vereijken, B.; Arnera, V. Connecting real-world digital mobility assessment to clinical outcomes for regulatory and clinical endorsement–the Mobilise-D study protocol. PLoS ONE 2022, 17, e0269615. [Google Scholar] [CrossRef]
- Guralnik, J.M.; Simonsick, E.M.; Ferrucci, L.; Glynn, R.J.; Berkman, L.F.; Blazer, D.G.; Scherr, P.A.; Wallace, R.B. A short physical performance battery assessing lower extremity function: Association with self-reported disability and prediction of mortality and nursing home admission. J. Gerontol. 1994, 49, M85–M94. [Google Scholar] [CrossRef] [PubMed]
- Jette, A.M.; Haley, S.M.; Kooyoomjian, J.T. Late-Life FDI Manual; Boston University: Boston, MA, USA, 2002; Volume 73. [Google Scholar]
- van Hees, V.T.; Renström, F.; Wright, A.; Gradmark, A.; Catt, M.; Chen, K.Y.; Löf, M.; Bluck, L.; Pomeroy, J.; Wareham, N.J. Estimation of daily energy expenditure in pregnant and non-pregnant women using a wrist-worn tri-axial accelerometer. PLoS ONE 2011, 6, e22922. [Google Scholar] [CrossRef] [PubMed]
- Syed, S.; Morseth, B.; Hopstock, L.A.; Horsch, A. Evaluating the performance of raw and epoch non-wear algorithms using multiple accelerometers and electrocardiogram recordings. Sci. Rep. 2020, 10, 5866. [Google Scholar] [CrossRef]
- Herrmann, S.D.; Barreira, T.V.; Kang, M.; Ainsworth, B.E. Impact of accelerometer wear time on physical activity data: A NHANES semisimulation data approach. Br. J. Sports Med. 2014, 48, 278–282. [Google Scholar] [CrossRef]
- Rowlands, A.V.; Edwardson, C.L.; Dawkins, N.P.; Maylor, B.D.; Metcalf, K.M.; Janz, K.F. Physical activity for bone health: How much and/or how hard? Med. Sci. Sports Exerc. 2020, 52, 2331–2341. [Google Scholar] [CrossRef] [PubMed]
- Evans, J.D. Straightforward Statistics for the Behavioral Sciences; Thomson Brooks/Cole Publishing Co.: Belmont, CA, USA, 1996. [Google Scholar]
- Denche-Zamorano, Á.; Salas-Gómez, D.; Barrios-Fernandez, S.; Tomás-Carus, P.; Adsuar, J.C.; Parraca, J.A. Relationship Between Frequency of Physical Activity, Functional Mobility, and Self-Perceived Health in People with Different Levels of Pain: A Cross-Sectional Study. J. Funct. Morphol. Kinesiol. 2024, 9, 198. [Google Scholar] [CrossRef] [PubMed]
- Pereira, L.V.; Vasconcelos, P.P.d.; Souza, L.A.F.; Pereira, G.d.A.; Nakatani, A.Y.K.; Bachion, M.M. Prevalence and intensity of chronic pain and self-perceived health among elderly people: A population-based study. Rev. Lat.-Am. Enferm. 2014, 22, 662–669. [Google Scholar] [CrossRef] [PubMed]
- Rowlands, A.; Davies, M.; Dempsey, P.; Edwardson, C.; Razieh, C.; Yates, T. Wrist-worn accelerometers: Recommending~ 1.0 mg as the minimum clinically important difference (MCID) in daily average acceleration for inactive adults. Br. J. Sports Med. 2021, 55, 814–815. [Google Scholar] [CrossRef]
- Stamatakis, E.; Ahmadi, M.N.; Gill, J.M.; Thøgersen-Ntoumani, C.; Gibala, M.J.; Doherty, A.; Hamer, M. Association of wearable device-measured vigorous intermittent lifestyle physical activity with mortality. Nat. Med. 2022, 28, 2521–2529. [Google Scholar] [CrossRef]


| All | Four Recovery Groups | p-Value | ||||
|---|---|---|---|---|---|---|
| (1) Acute | (2) Post-Acute | (3) Extended Recovery | (4) Long-Term Recovery | |||
| N | 396 | 79 | 88 | 166 | 60 | - |
| Sex (F/M) | 257/139 | 57/22 | 57/31 | 103/63 | 37/23 | - |
| Days since sur. (days) | 57.5 (22.5–124.4) | 3.4 (3.3–4.5) | 27.9 (23.3–32.9) | 96.3 (62.4–121.7) | 330.4 (223.8–353.4) | - |
| 3 missing | [2.4–12.5] | [14.7–41.5] | [42.3–180.5] | [186.4–367.4] | - | |
| Age (yrs) | 79 (71–83) | 78 (72–84) | 81 (73–85) € | 76 (69–82) € | 78 (71–86) | 0.007 € |
| Mass (kg) | 67 (58–79) | 67 (59–79) | 68 (59–79) | 67 (57–80) | 69 (57–77) | 0.990 |
| Height (cm) | 168 (160–175) | 165 (160–174) | 165 (160–178) | 169 (161–175) | 168 (163–180) | 0.497 |
| BMI (kg/m2) | 23.9 (21.5–26.5) | 23.9 (22.4–26.7) | 24.6 (21.7–26.9) | 23.4 (21.1–26.7) | 23.9 (21.4–26.3) | 0.501 |
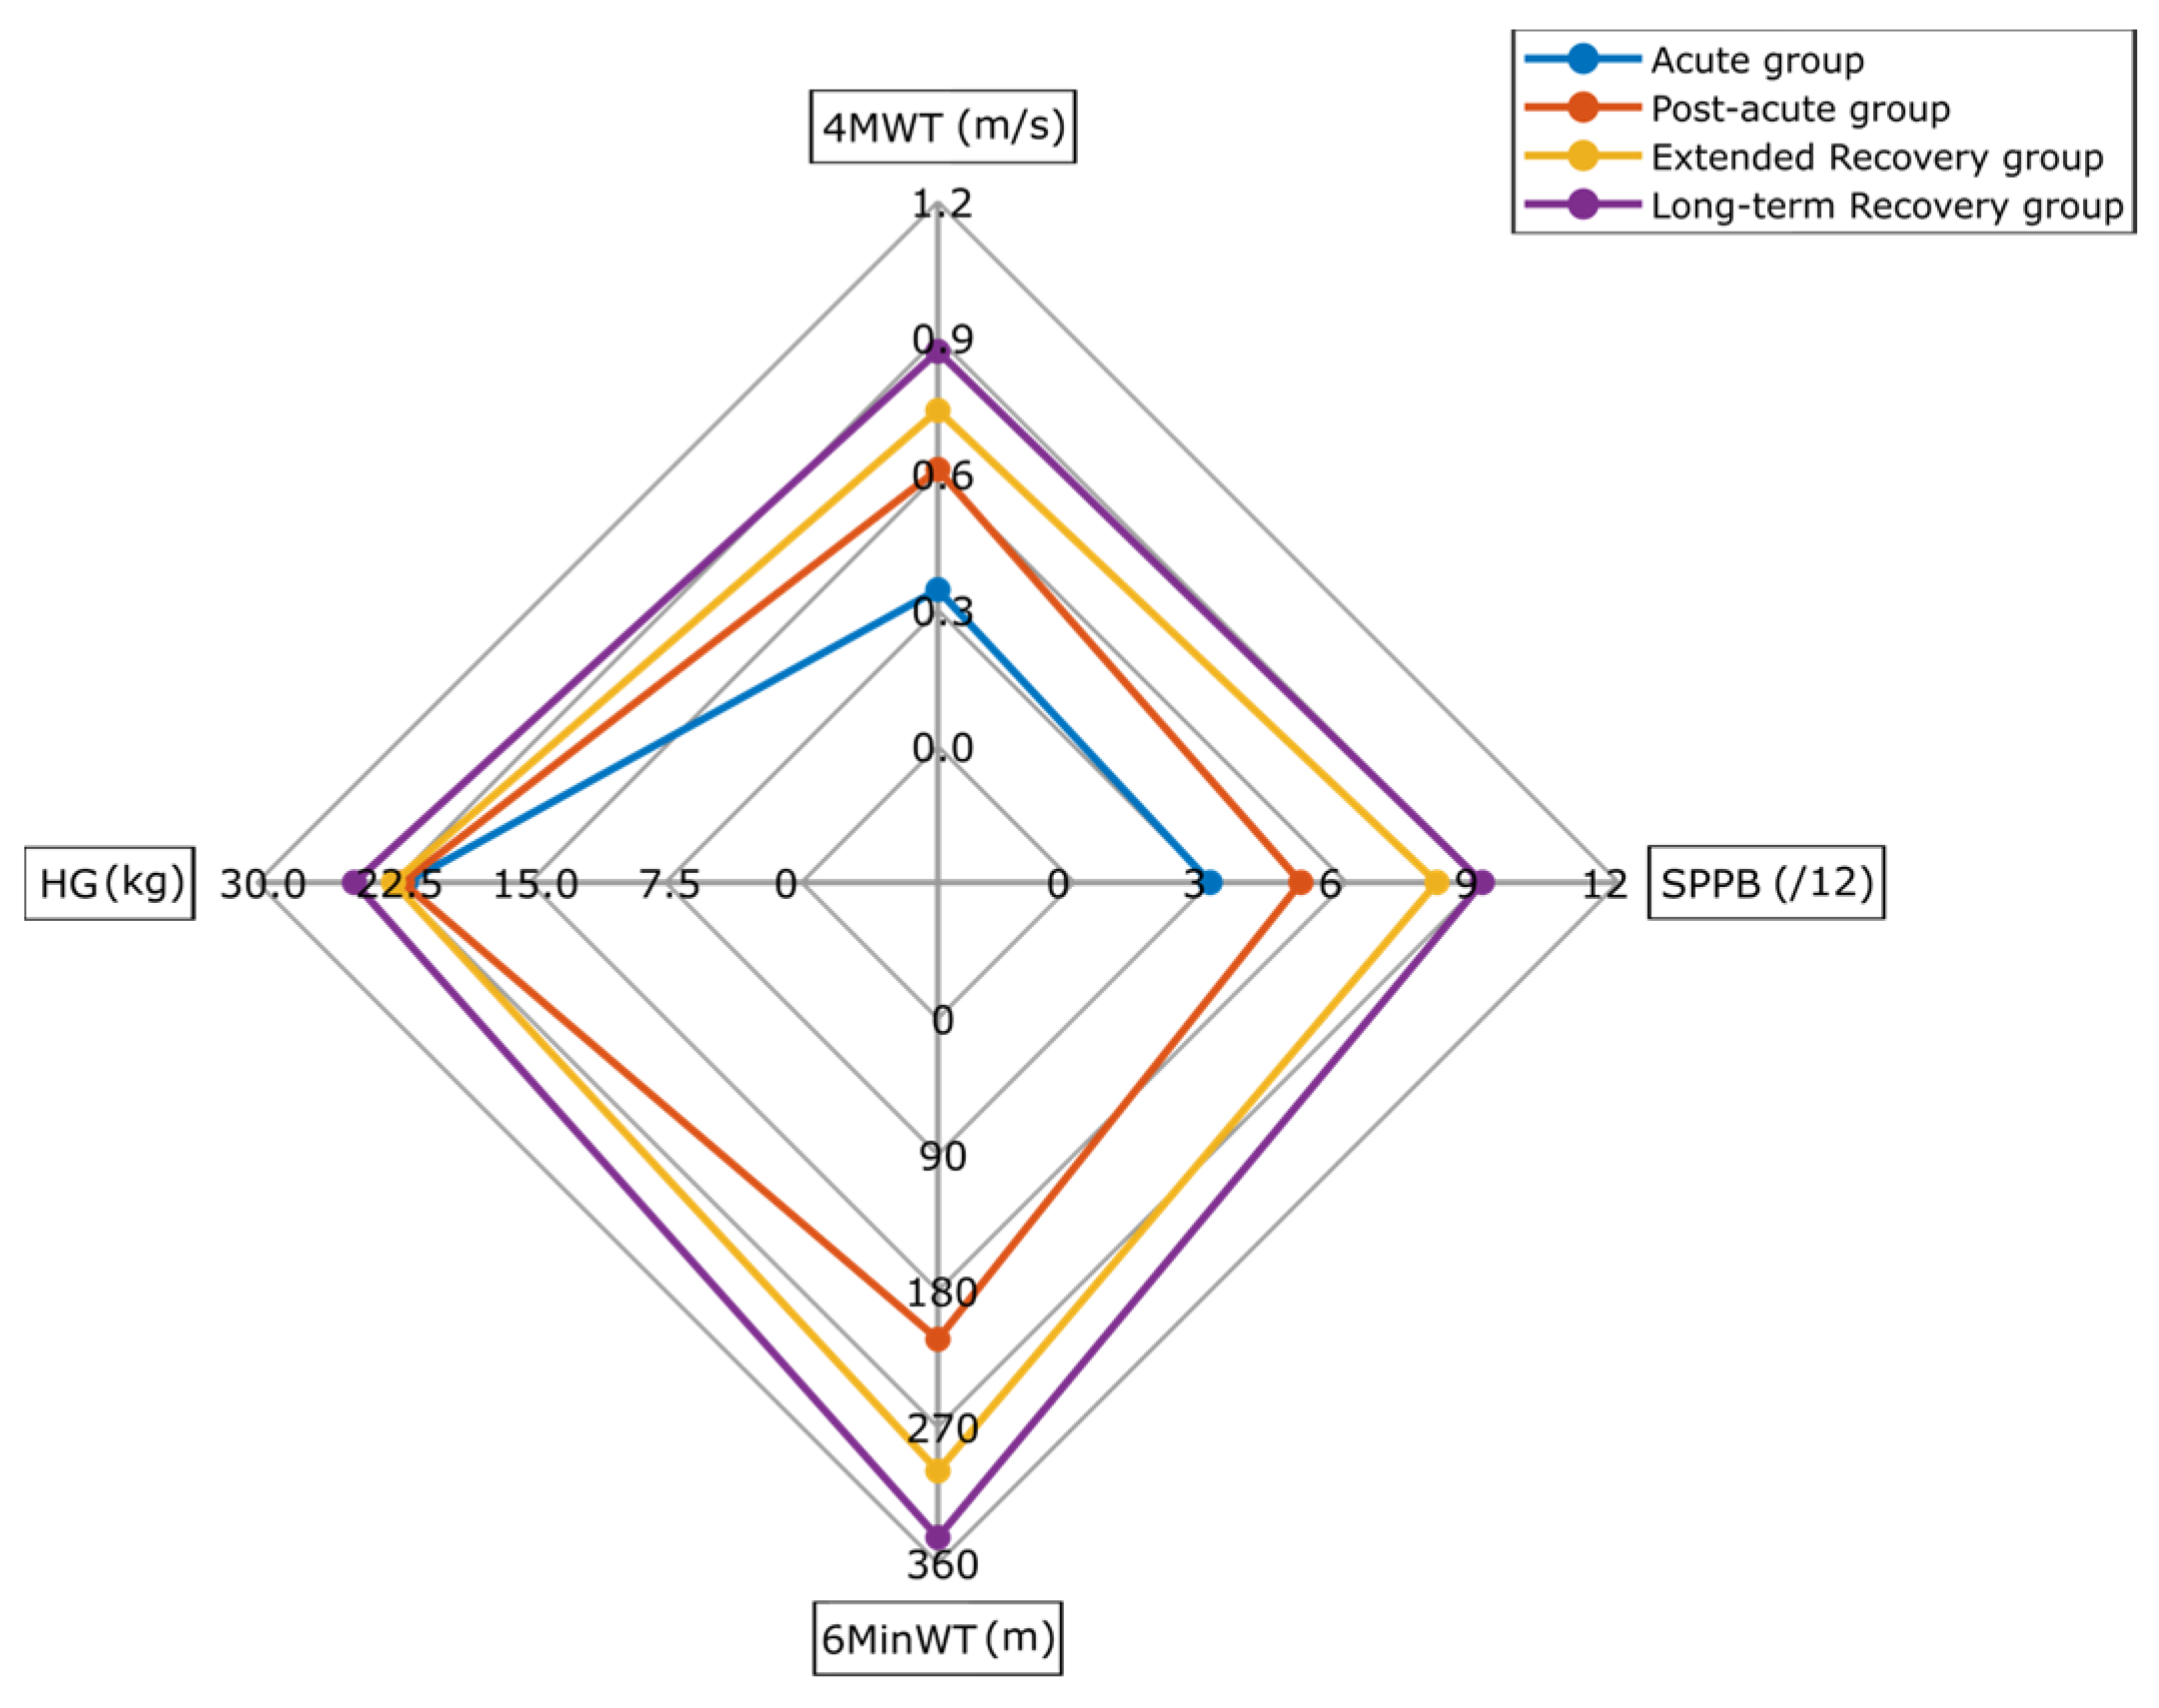
| 4MWT (m/s) | 0.65 (0.44–0.87) | 0.34 (0.23–0.43) * | 0.61 (0.51–0.76) *€ | 0.74 (0.57–0.92) *€ | 0.87 (0.59–1.09) *€ | <0.01 *€ |
| SPPB (/12) | 6 (4–9) | 3 (2–5) * | 5 (4–7) *€ | 8 (6–10) *€ | 9 (5–10) *€ | <0.01 *€ |
| 6MinWT (m) | 271 (192–376) | - | 212 (157–287) € | 299 (209–394) € | 343 (242–441) € | <0.01 *€ |
| HG (kg) | 22 (17–30) | 22 (17–27) | 22 (17–28) | 23 (17–32) | 24 (18–32) | 0.332 |
Disclaimer/Publisher’s Note: The statements, opinions and data contained in all publications are solely those of the individual author(s) and contributor(s) and not of MDPI and/or the editor(s). MDPI and/or the editor(s) disclaim responsibility for any injury to people or property resulting from any ideas, methods, instructions or products referred to in the content. |
© 2025 by the authors. Licensee MDPI, Basel, Switzerland. This article is an open access article distributed under the terms and conditions of the Creative Commons Attribution (CC BY) license (https://creativecommons.org/licenses/by/4.0/).
Share and Cite
Younesian, H.; Singleton, D.; Vereijken, B.; Garcia-Aymerich, J.; Rochester, L.; Aursand Berge, M.; Engdal, M.; Buekers, J.; Koch, S.; Helbostad, J.L.; et al. Association of Cut-Point Free Metrics and Common Clinical Tests Among Older Adults After Proximal Femoral Fracture. Sensors 2025, 25, 2557. https://doi.org/10.3390/s25082557
Younesian H, Singleton D, Vereijken B, Garcia-Aymerich J, Rochester L, Aursand Berge M, Engdal M, Buekers J, Koch S, Helbostad JL, et al. Association of Cut-Point Free Metrics and Common Clinical Tests Among Older Adults After Proximal Femoral Fracture. Sensors. 2025; 25(8):2557. https://doi.org/10.3390/s25082557
Chicago/Turabian StyleYounesian, Hananeh, David Singleton, Beatrix Vereijken, Judith Garcia-Aymerich, Lynn Rochester, Martin Aursand Berge, Monika Engdal, Joren Buekers, Sarah Koch, Jorunn L. Helbostad, and et al. 2025. "Association of Cut-Point Free Metrics and Common Clinical Tests Among Older Adults After Proximal Femoral Fracture" Sensors 25, no. 8: 2557. https://doi.org/10.3390/s25082557
APA StyleYounesian, H., Singleton, D., Vereijken, B., Garcia-Aymerich, J., Rochester, L., Aursand Berge, M., Engdal, M., Buekers, J., Koch, S., Helbostad, J. L., Alvarez, P., Jansen, C.-P., Aminian, K., Paraschiv-Ionescu, A., Becker, C., & Caulfield, B., on behalf of the Mobilise-D Consortium. (2025). Association of Cut-Point Free Metrics and Common Clinical Tests Among Older Adults After Proximal Femoral Fracture. Sensors, 25(8), 2557. https://doi.org/10.3390/s25082557