
Multiclass CNN Approach for Automatic Classification of Dolphin Vocalizations

 ,
,  ,
,  , , , and
Abstract
Highlights
- A CNN was developed for multiclass classification of dolphin vocalizations.
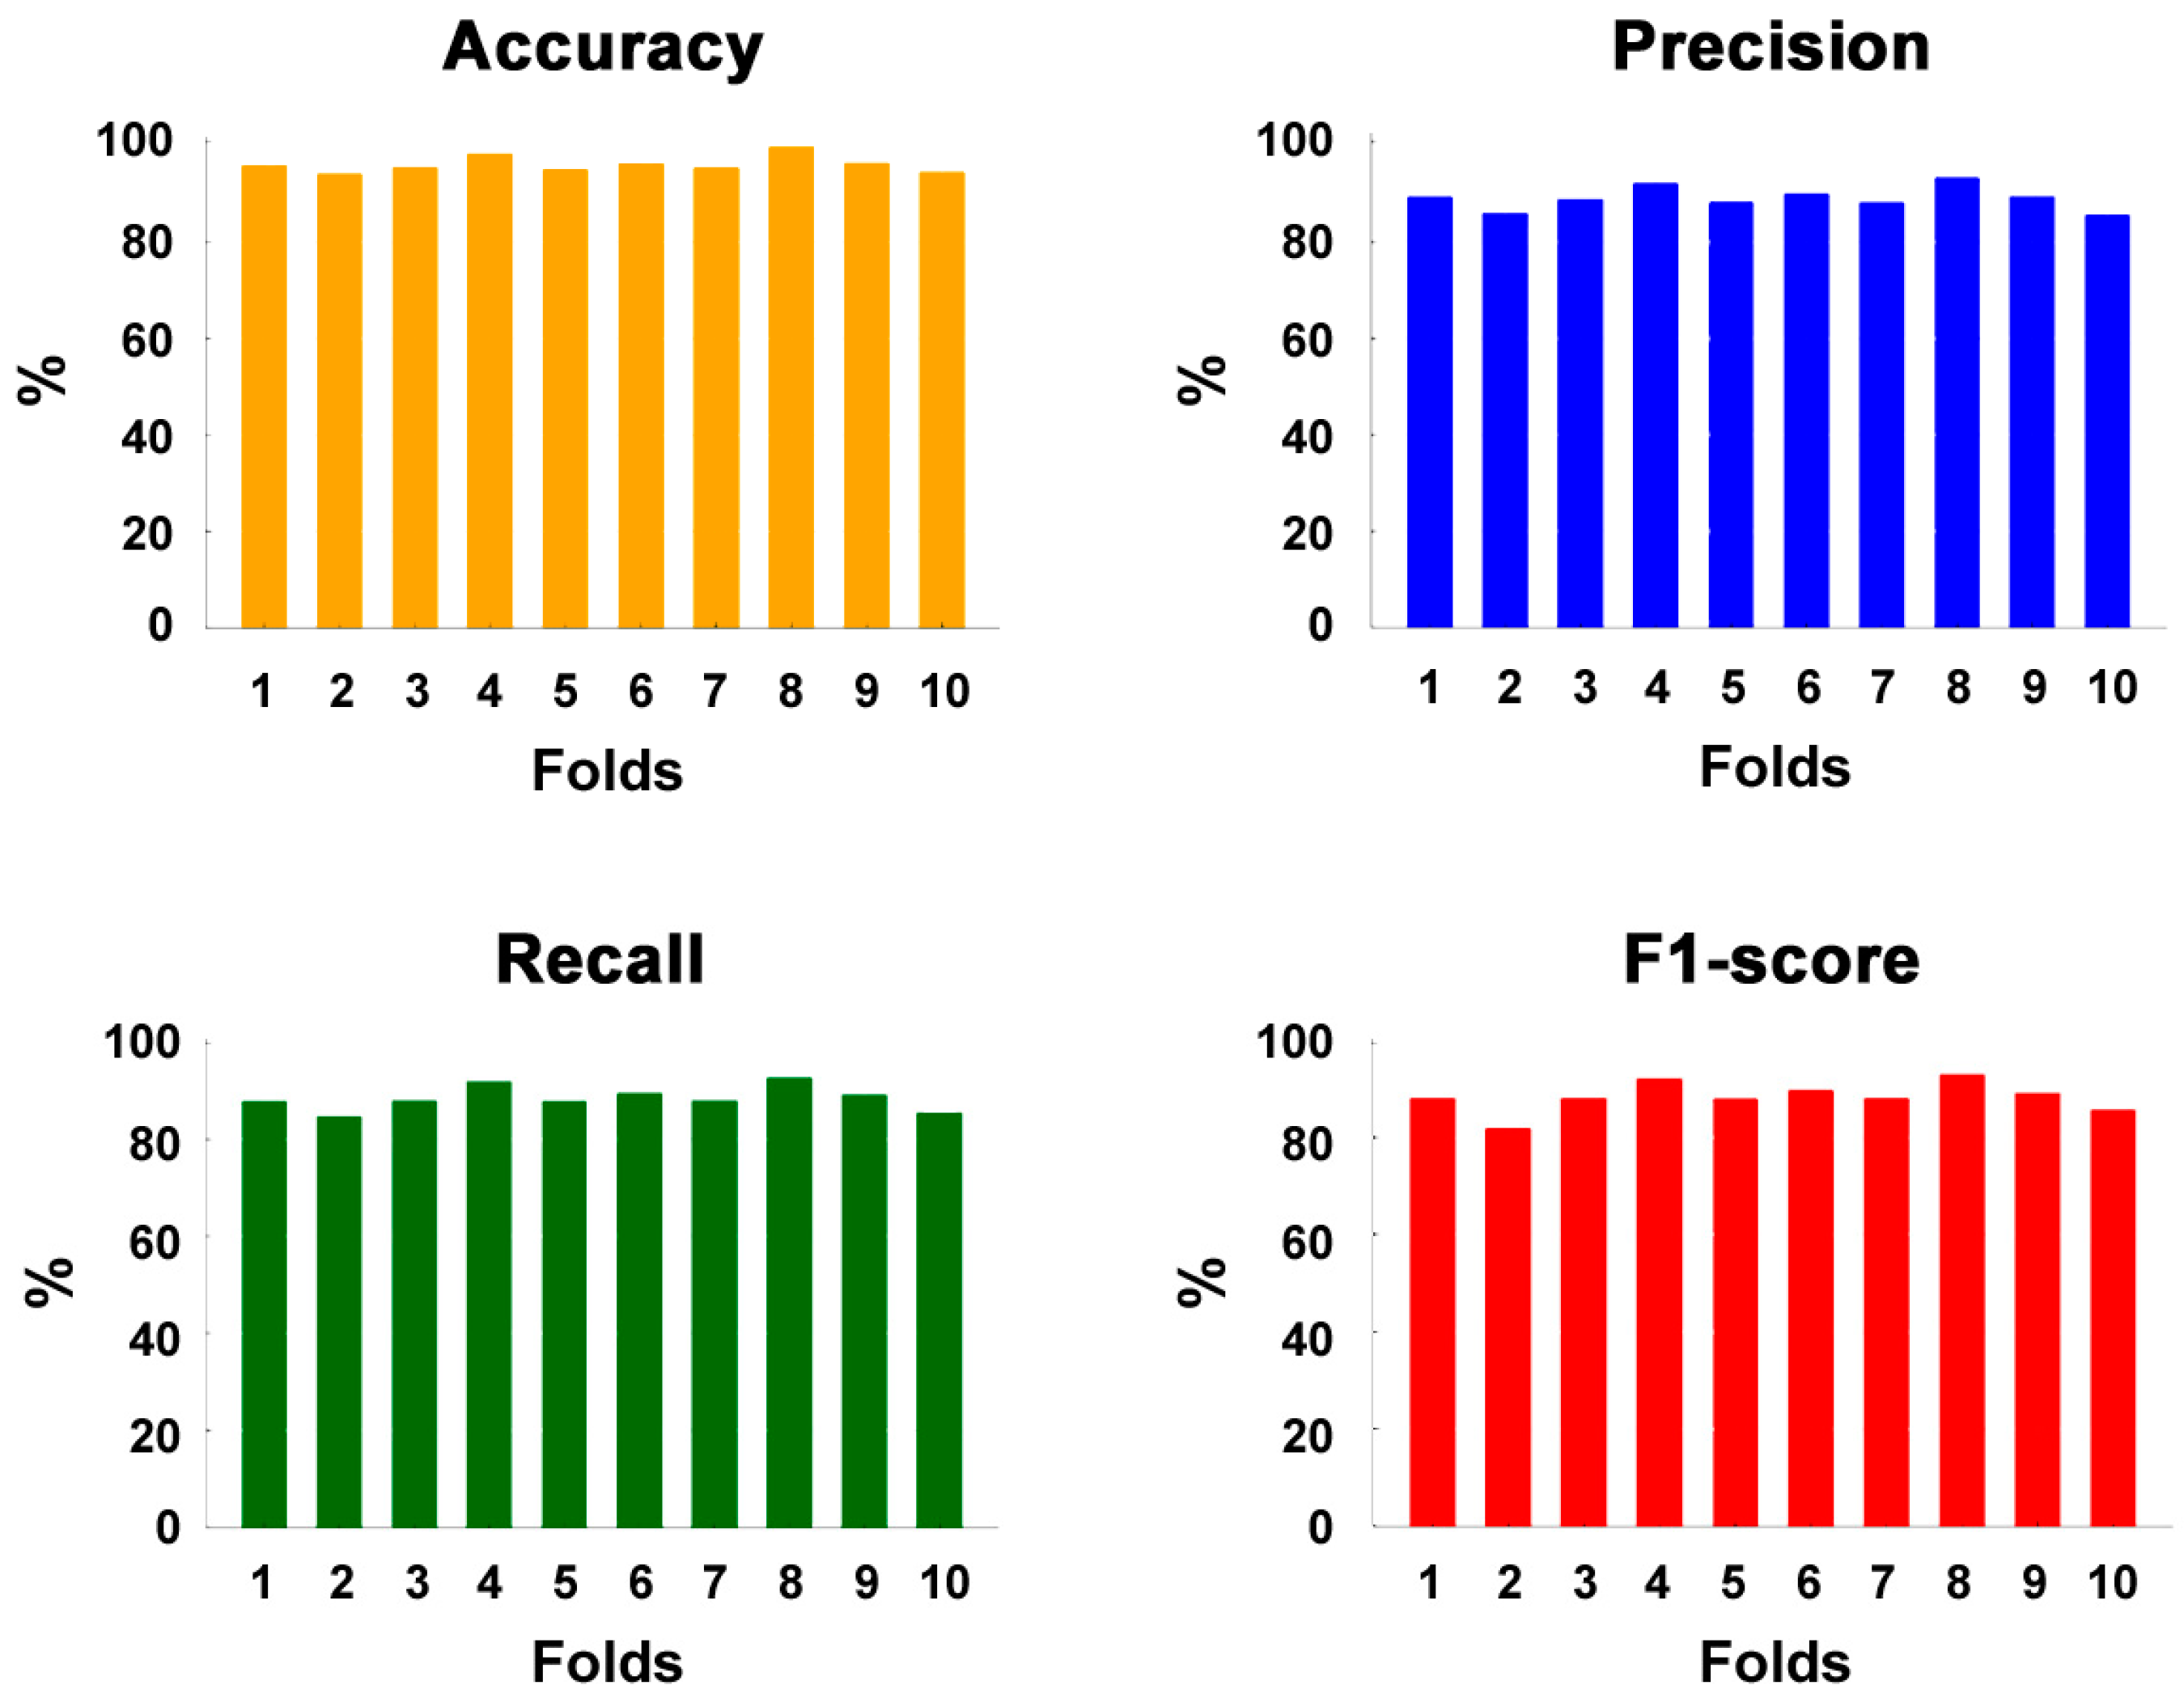
- The model achieved a 95.2% mean accuracy with a mean F1-score of 87.8%.
- This approach enhances the passive acoustic monitoring of dolphin vocalizations.
- It provides a scalable AI-based solution for marine bioacoustics research.
Abstract
1. Introduction
2. Materials and Methods
2.1. Signal Collection
2.2. Data Preparation
2.3. The Convolutional Neural Network
3. Results
4. Discussion
5. Conclusions
Author Contributions
Funding
Institutional Review Board Statement
Informed Consent Statement
Data Availability Statement
Acknowledgments
Conflicts of Interest
Abbreviations
| CNN | Convolutional Neural Network |
| PAM | Passive Acoustic Monitoring |
| SD | Standard Deviation |
References
- André, M.; van der Schaar, M.; Zaugg, S.; Houégnigan, L.; Sánchez, A.M.; Castell, J.V. Listening to the Deep: Live monitoring of ocean noise and cetacean acoustic signals. Mar. Pollut. Bull. 2011, 63, 18–26. [Google Scholar] [CrossRef] [PubMed]
- Mellinger, D.K.; Stafford, K.M.; Moore, S.E.; Dziak, R.P.; Matsumoto, H. An overview of fixed passive acoustic observation methods for cetaceans. Oceanography 2007, 20, 36–45. [Google Scholar] [CrossRef]
- Simon, M.; Nuuttila, H.; Reyes-Zamudio, M.M.; Ugarte, F.; Verfuss, U.; Evans, P.G.H. Passive acoustic monitoring of bottlenose dolphin and harbour porpoise, in Cardigan Bay, Wales, with implications for habitat use and partitioning. J. Mar. Biol. Assoc. UK 2010, 90, 1539–1545. [Google Scholar] [CrossRef]
- Luís, A.R.; May-Collado, L.J.; Rako-Gospić, N.; Gridley, T.; Papale, E.; Azevedo, A.; Silva, M.A.; Buscaino, G.; Herzing, D.; Santos, M.E.D. Vocal universals and geographic variations in the acoustic repertoire of the common bottlenose dolphin. Sci. Rep. 2021, 11, 11847. [Google Scholar] [CrossRef]
- De Marco, R.; Di Nardo, F.; Lucchetti, A.; Virgili, M.; Petetta, A.; Li Veli, D.; Screpanti, L.; Bartolucci, V.; Scaradozzi, D. The Development of a Low-Cost Hydrophone for Passive Acoustic Monitoring of Dolphin’s Vocalizations. Remote Sens. 2023, 15, 1946. [Google Scholar] [CrossRef]
- Lammers, M.O.; Oswald, J.N. Analyzing the acoustic communication of dolphins. In Dolphin Communication and Cognition: Past, Present and Future; MIT Press: Cambridge, MA, USA, 2015; pp. 107–137. [Google Scholar] [CrossRef]
- Heiler, J.; Elwen, S.H.; Kriesell, H.J.; Gridley, T. Changes in bottlenose dolphin whistle parameters related to vessel presence, surface behaviour and group composition. Anim. Behav. 2016, 117, 167–177. [Google Scholar] [CrossRef]
- Au, W.W.L. Echolocation signals of wild dolphins. Acoust. Phys. 2004, 50, 454–462. [Google Scholar] [CrossRef]
- Ridgway, S.H.; Moore, P.W.; Carder, D.A.; Romano, T.A. Forward shift of feeding buzz components of dolphins and belugas during associative learning reveals a likely connection to reward expectation, pleasure and brain dopamine activation. J. Exp. Biol. 2014, 217, 2910–2919. [Google Scholar] [CrossRef]
- Gillespie, D.; Caillat, M.; Gordon, J.; White, P. Automatic detection and classification of odontocete whistles. J. Acoust. Soc. Am. 2013, 134, 2427–2437. [Google Scholar] [CrossRef]
- Serra, O.; Martins, F.; Padovese, L.R. Active contour-based detection of estuarine dolphin whistles in spectrogram images. Ecol. Inform. 2020, 55, 101036. [Google Scholar] [CrossRef]
- Siddagangaiah, S.; Chen, C.F.; Hu, W.C.; Akamatsu, T.; McElligott, M.; Lammers, M.O.; Pieretti, N. Automatic detection of dolphin whistles and clicks based on entropy approach. Ecol. Indicat. 2020, 117, 106559. [Google Scholar] [CrossRef]
- White, E.L.; White, P.R.; Bull, J.M.; Risch, D.; Beck, S.; Edwards, E.W. More than a whistle: Automated detection of marine sound sources with a convolutional neural network. Front. Mar. Sci. 2022, 9, 879145. [Google Scholar] [CrossRef]
- Frainer, G.; Dufourq, E.; Fearey, J.; Dines, S.; Probert, R.; Elwen, S.; Gridley, T. Automatic detection and taxonomic identification of dolphin vocalisations using convolutional neural networks for passive acoustic monitoring. Ecol. Inform. 2023, 78, 102291. [Google Scholar] [CrossRef]
- Shiu, Y.; Palmer, K.; Roch, M.A.; Fleishman, E.; Liu, X.; Nosal, E.-M.; Helble, T.; Cholewiak, D.; Gillespie, D.; Klinck, H. Deep neural networks for automated detection of marine mammal species. Sci. Rep. 2020, 10, 607. [Google Scholar] [CrossRef] [PubMed]
- Nur Korkmaz, B.; Diamant, R.; Danino, G.; Testolin, A. Automated detection of dolphin whistles with convolutional networks and transfer learning. Front. Artif. Intell. 2023, 6, 1099022. [Google Scholar] [CrossRef] [PubMed]
- Jiang, J.-J.; Bu, L.-R.; Duan, F.-J.; Wang, X.-Q.; Liu, W.; Sun, Z.-B.; Li, C.-Y. Whistle detection and classification for whales based on convolutional neural networks. Appl. Acoust. 2019, 150, 169–178. [Google Scholar] [CrossRef]
- Jin, C.; Kim, M.; Jang, S.; Paeng, D.-G. Semantic segmentation-based whistle extraction of Indo-Pacific bottlenose dolphin residing at the coast of Jeju Island. Ecol. Indicat. 2022, 137, 108792. [Google Scholar] [CrossRef]
- Scaradozzi, D.; De Marco, R.; Li Veli, D.; Lucchetti, A.; Screpanti, L.; Di Nardo, F. Convolutional Neural Networks for Enhancing Detection of Dolphin Whistles in a Dense Acoustic Environment. IEEE Access 2024, 12, 127141–127148. [Google Scholar] [CrossRef]
- Nanni, L.; Cuza, D.; Brahnam, S. Building Ensemble of Resnet for Dolphin Whistle Detection. Appl. Sci. 2023, 13, 8029. [Google Scholar] [CrossRef]
- Zhong, M.; Castellote, M.; Dodhia, R.; Ferres, J.L.; Keogh, M.; Brewer, A. Beluga whale acoustic signal classification using deep learning neural network models. J. Acoust. Soc. Am. 2020, 147, 1834–1841. [Google Scholar] [CrossRef]
- Buchanan, C.; Bi, Y.; Xue, B.; Vennell, R.; Childerhouse, S.; Pine, M.K.; Briscoe, D.; Zhang, M. Deep convolutional neural networks for detecting dolphin echolocation clicks. In Proceedings of the 2021 36th International Conference on Image and Vision Computing New Zealand (IVCNZ), Tauranga, New Zealand, 9–10 December 2021. [Google Scholar]
- Alzubaidi, L.; Zhang, J.; Humaidi, A.J.; Al-Dujaili, A.; Duan, Y.; Al-Shamma, O.; Santamaría, J.; Fadhel, M.A.; Al-Amidie, M.; Farhan, L. Review of deep learning: Concepts, CNN architectures, challenges, applications, future directions. J. Big Data 2021, 8, 53. [Google Scholar] [CrossRef]
- Kanopoulos, N.; Vasanthavada, N.; Baker, R.L. Design of an image edge detection filter using the Sobel operator. IEEE J. Solid-State Circuits 1988, 23, 358–367. [Google Scholar] [CrossRef]
- Ranjan, R.; Avasthi, V. Edge Detection Using Guided Sobel Image Filtering. Wirel. Pers. Commun. 2023, 132, 651–677. [Google Scholar] [CrossRef]
- SQ26-05 Hydrophone, Sensor Technology, Nauta Scientific. Available online: https://www.nauta-rcs.it/EN/Hydrophones/SensorTech/ (accessed on 28 March 2025).
- Palmero, S.; Guidi, C.; Kulikovskiy, V.; Sanguineti, M.; Manghi, M.; Sommer, M.; Pesce, G. Towards automatic detection and classification of orca (Orcinus orca) calls using cross-correlation methods. Mar. Mammal Sci. 2022, 1, 18. [Google Scholar] [CrossRef]
- Fanizza, C.; Maglietta, R.; Buscaino, G.; Carlucci, R.; Ceraulo, M.; Cipriano, G.; Grammauta, R.; Renò, V.; Santacesaria, F.C.; Sion, L.; et al. Emission rate of acoustic signals for the common bottlenose and striped dolphins in the Gulf of Taranto (Northern Ionian Sea, Central-eastern Mediterranean Sea). In Proceedings of the 2018 IEEE International Workshop on Metrology for the Sea; Learning to Measure Sea Health Parameters (MetroSea), Bari, Italy, 8–10 October 2018; IEEE: New York, NY, USA, 2018; pp. 188–192. [Google Scholar]
- Audacity®|Free Audio Editor, Recorder, Music Making and More! Available online: https://www.audacityteam.org/ (accessed on 28 March 2025).
- Woods, J.W. Multidimensional Signal, Image, and Video Processing and Coding, 2nd ed.; Academic Press: Cambridge, MA, USA, 2011; ISBN 9780123814203. [Google Scholar]
- Refaeilzadeh, P.; Tang, L.; Liu, H. Cross-Validation. In Encyclopedia of Database Systems; Liu, L., Özsu, M.T., Eds.; Springer: Boston, MA, USA, 2009. [Google Scholar] [CrossRef]
- Abdel-Hamid, O.; Deng, L.; Yu, D. Exploring convolutional neural network structures and optimization techniques for speech recognition. Proc. Interspeech 2013, 3366–3370. [Google Scholar] [CrossRef]
- Kershenbaum, A.; Sayigh, L.S.; Janik, V.M. The encoding of individual identity in dolphin signature whistles: How much information is needed? PLoS ONE 2013, 8, e77671. [Google Scholar] [CrossRef]
- Nuuttila, H.K.; Meier, R.; Evans, P.G.H.; Turner, J.R.; Bennell, J.D.; Hiddink, J.G. Identifying Foraging Behaviour of Wild Bottlenose Dolphins (Tursiops truncatus) and Harbour Porpoises (Phocoena phocoena) with Static Acoustic Dataloggers. Aquat. Mamm. 2013, 39, 147–161. [Google Scholar] [CrossRef]
- Verfuß, U.K.; Miller, L.A.; Pilz, P.K.; Schnitzler, H.U. Echolocation by two foraging harbour porpoises (Phocoena phocoena). J Exp Biol. 2009, 212 Pt 6, 823–834. [Google Scholar] [CrossRef]
- Di Nardo, F.; De Marco, R.; Lucchetti, A.; Scaradozzi, D. A WAV file dataset of bottlenose dolphin whistles, clicks, and pulse sounds during trawling interactions. Sci. Data 2023, 10, 650. [Google Scholar] [CrossRef]
- Lau, Y.; Sim, W.; Chew, K.; Ng, Y.; Salam, Z.A.A. Understanding how noise affects the accuracy of CNN image classification. J. Appl. Technol. Innovation 2021, 5, 23. [Google Scholar]

| Kernel Size | Accuracy | Precision | Recall | F1 Score |
|---|---|---|---|---|
| 3 × 3 | 97.3% | 98.4% | 96.3% | 97.3% |
| 5 × 5 | 97.5% | 98.2% | 96.8% | 97.5% |
| 7 × 7 | 97.4% | 97.8% | 97.0% | 97.4% |
| 9 × 9 | 97.4% | 97.5% | 97.3% | 97.4% |
| 11 × 11 | 97.2% | 97.5% | 96.8% | 97.2% |
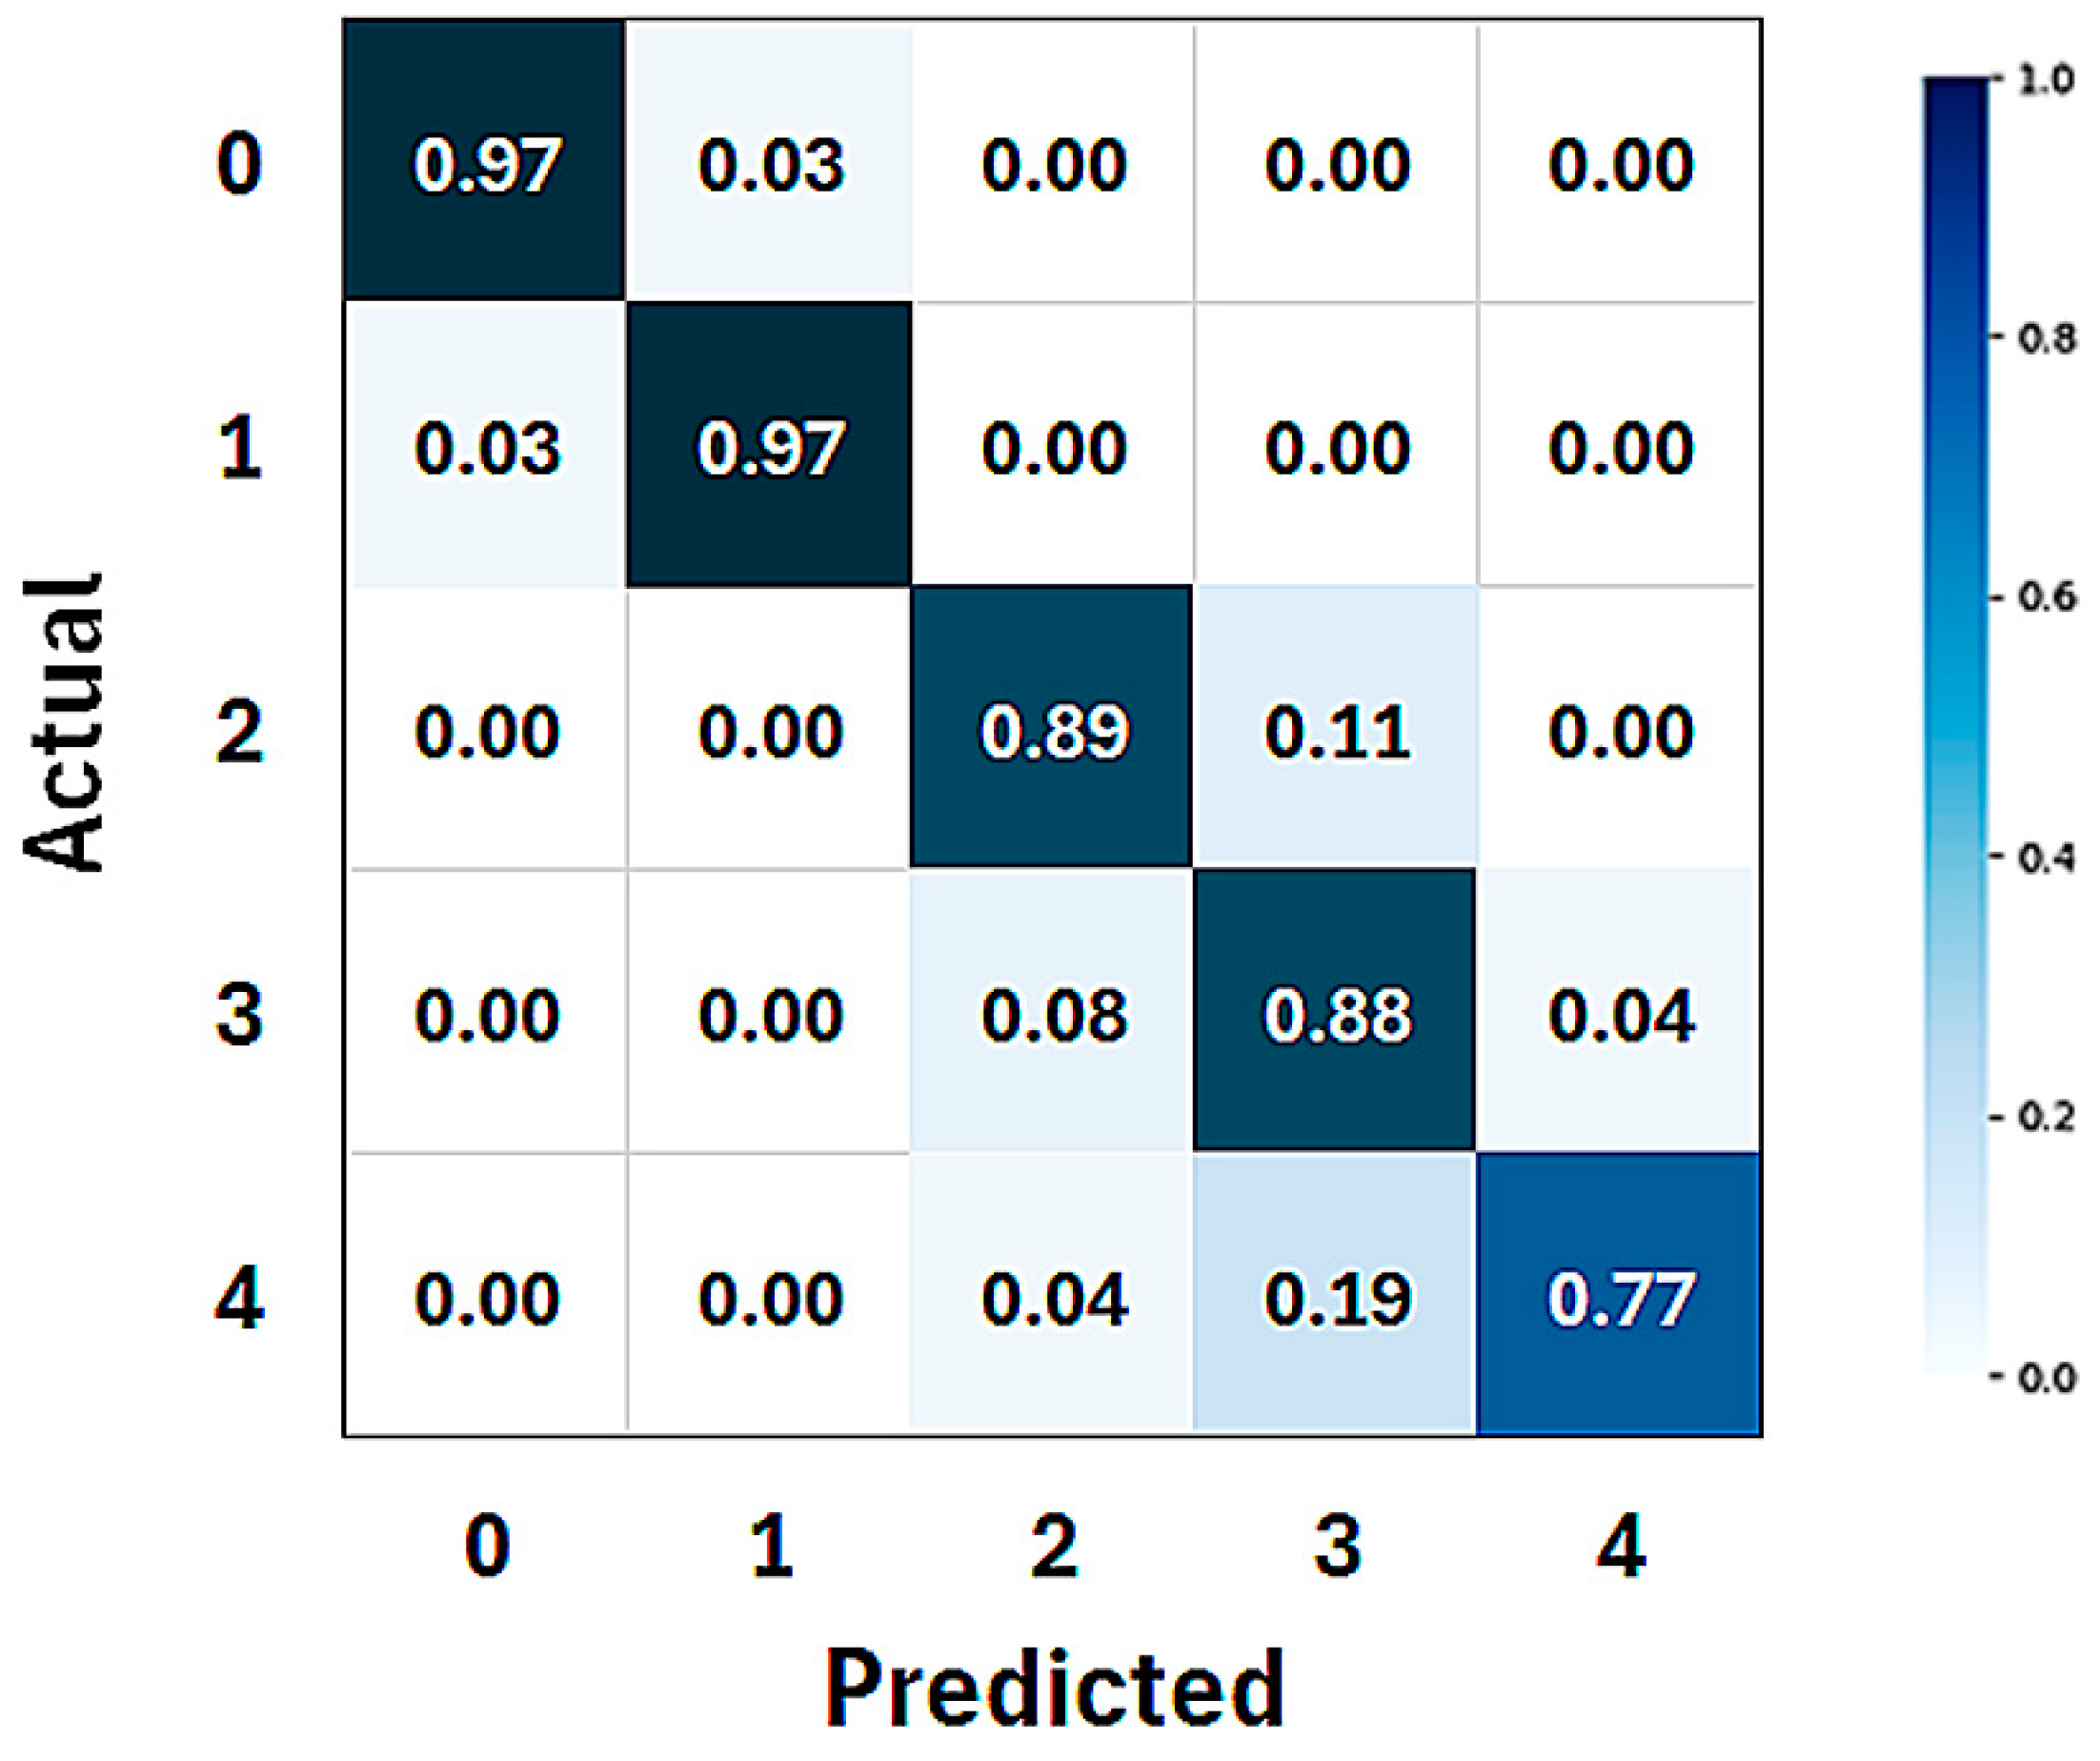
| Class | Accuracy (%) | Precision (%) | Recall (%) | F1-Score (%) |
|---|---|---|---|---|
| 0 | 97.9 | 95.0 | 95.6 | 95.0 |
| 1 | 97.9 | 95.2 | 95.0 | 95.0 |
| 2 | 94.5 | 85.9 | 87.6 | 86.6 |
| 3 | 92.3 | 77.0 | 88.1 | 81.9 |
| 4 | 94.0 | 92.6 | 76.2 | 83.0 |
| Mean | 95.0 ± 1.1 | 89.1 ± 2.8 | 89.0 ± 2.7 | 88.0 ± 3.1 |
Disclaimer/Publisher’s Note: The statements, opinions and data contained in all publications are solely those of the individual author(s) and contributor(s) and not of MDPI and/or the editor(s). MDPI and/or the editor(s) disclaim responsibility for any injury to people or property resulting from any ideas, methods, instructions or products referred to in the content. |
© 2025 by the authors. Licensee MDPI, Basel, Switzerland. This article is an open access article distributed under the terms and conditions of the Creative Commons Attribution (CC BY) license (https://creativecommons.org/licenses/by/4.0/).
Share and Cite
Di Nardo, F.; De Marco, R.; Li Veli, D.; Screpanti, L.; Castagna, B.; Lucchetti, A.; Scaradozzi, D. Multiclass CNN Approach for Automatic Classification of Dolphin Vocalizations. Sensors 2025, 25, 2499. https://doi.org/10.3390/s25082499
Di Nardo F, De Marco R, Li Veli D, Screpanti L, Castagna B, Lucchetti A, Scaradozzi D. Multiclass CNN Approach for Automatic Classification of Dolphin Vocalizations. Sensors. 2025; 25(8):2499. https://doi.org/10.3390/s25082499
Chicago/Turabian StyleDi Nardo, Francesco, Rocco De Marco, Daniel Li Veli, Laura Screpanti, Benedetta Castagna, Alessandro Lucchetti, and David Scaradozzi. 2025. "Multiclass CNN Approach for Automatic Classification of Dolphin Vocalizations" Sensors 25, no. 8: 2499. https://doi.org/10.3390/s25082499
APA StyleDi Nardo, F., De Marco, R., Li Veli, D., Screpanti, L., Castagna, B., Lucchetti, A., & Scaradozzi, D. (2025). Multiclass CNN Approach for Automatic Classification of Dolphin Vocalizations. Sensors, 25(8), 2499. https://doi.org/10.3390/s25082499