


Analysis of Voice, Speech, and Language Biomarkers of Parkinson’s Disease Collected in a Mixed Reality Setting

 , , , , and
Abstract
1. Introduction
2. Materials and Methods
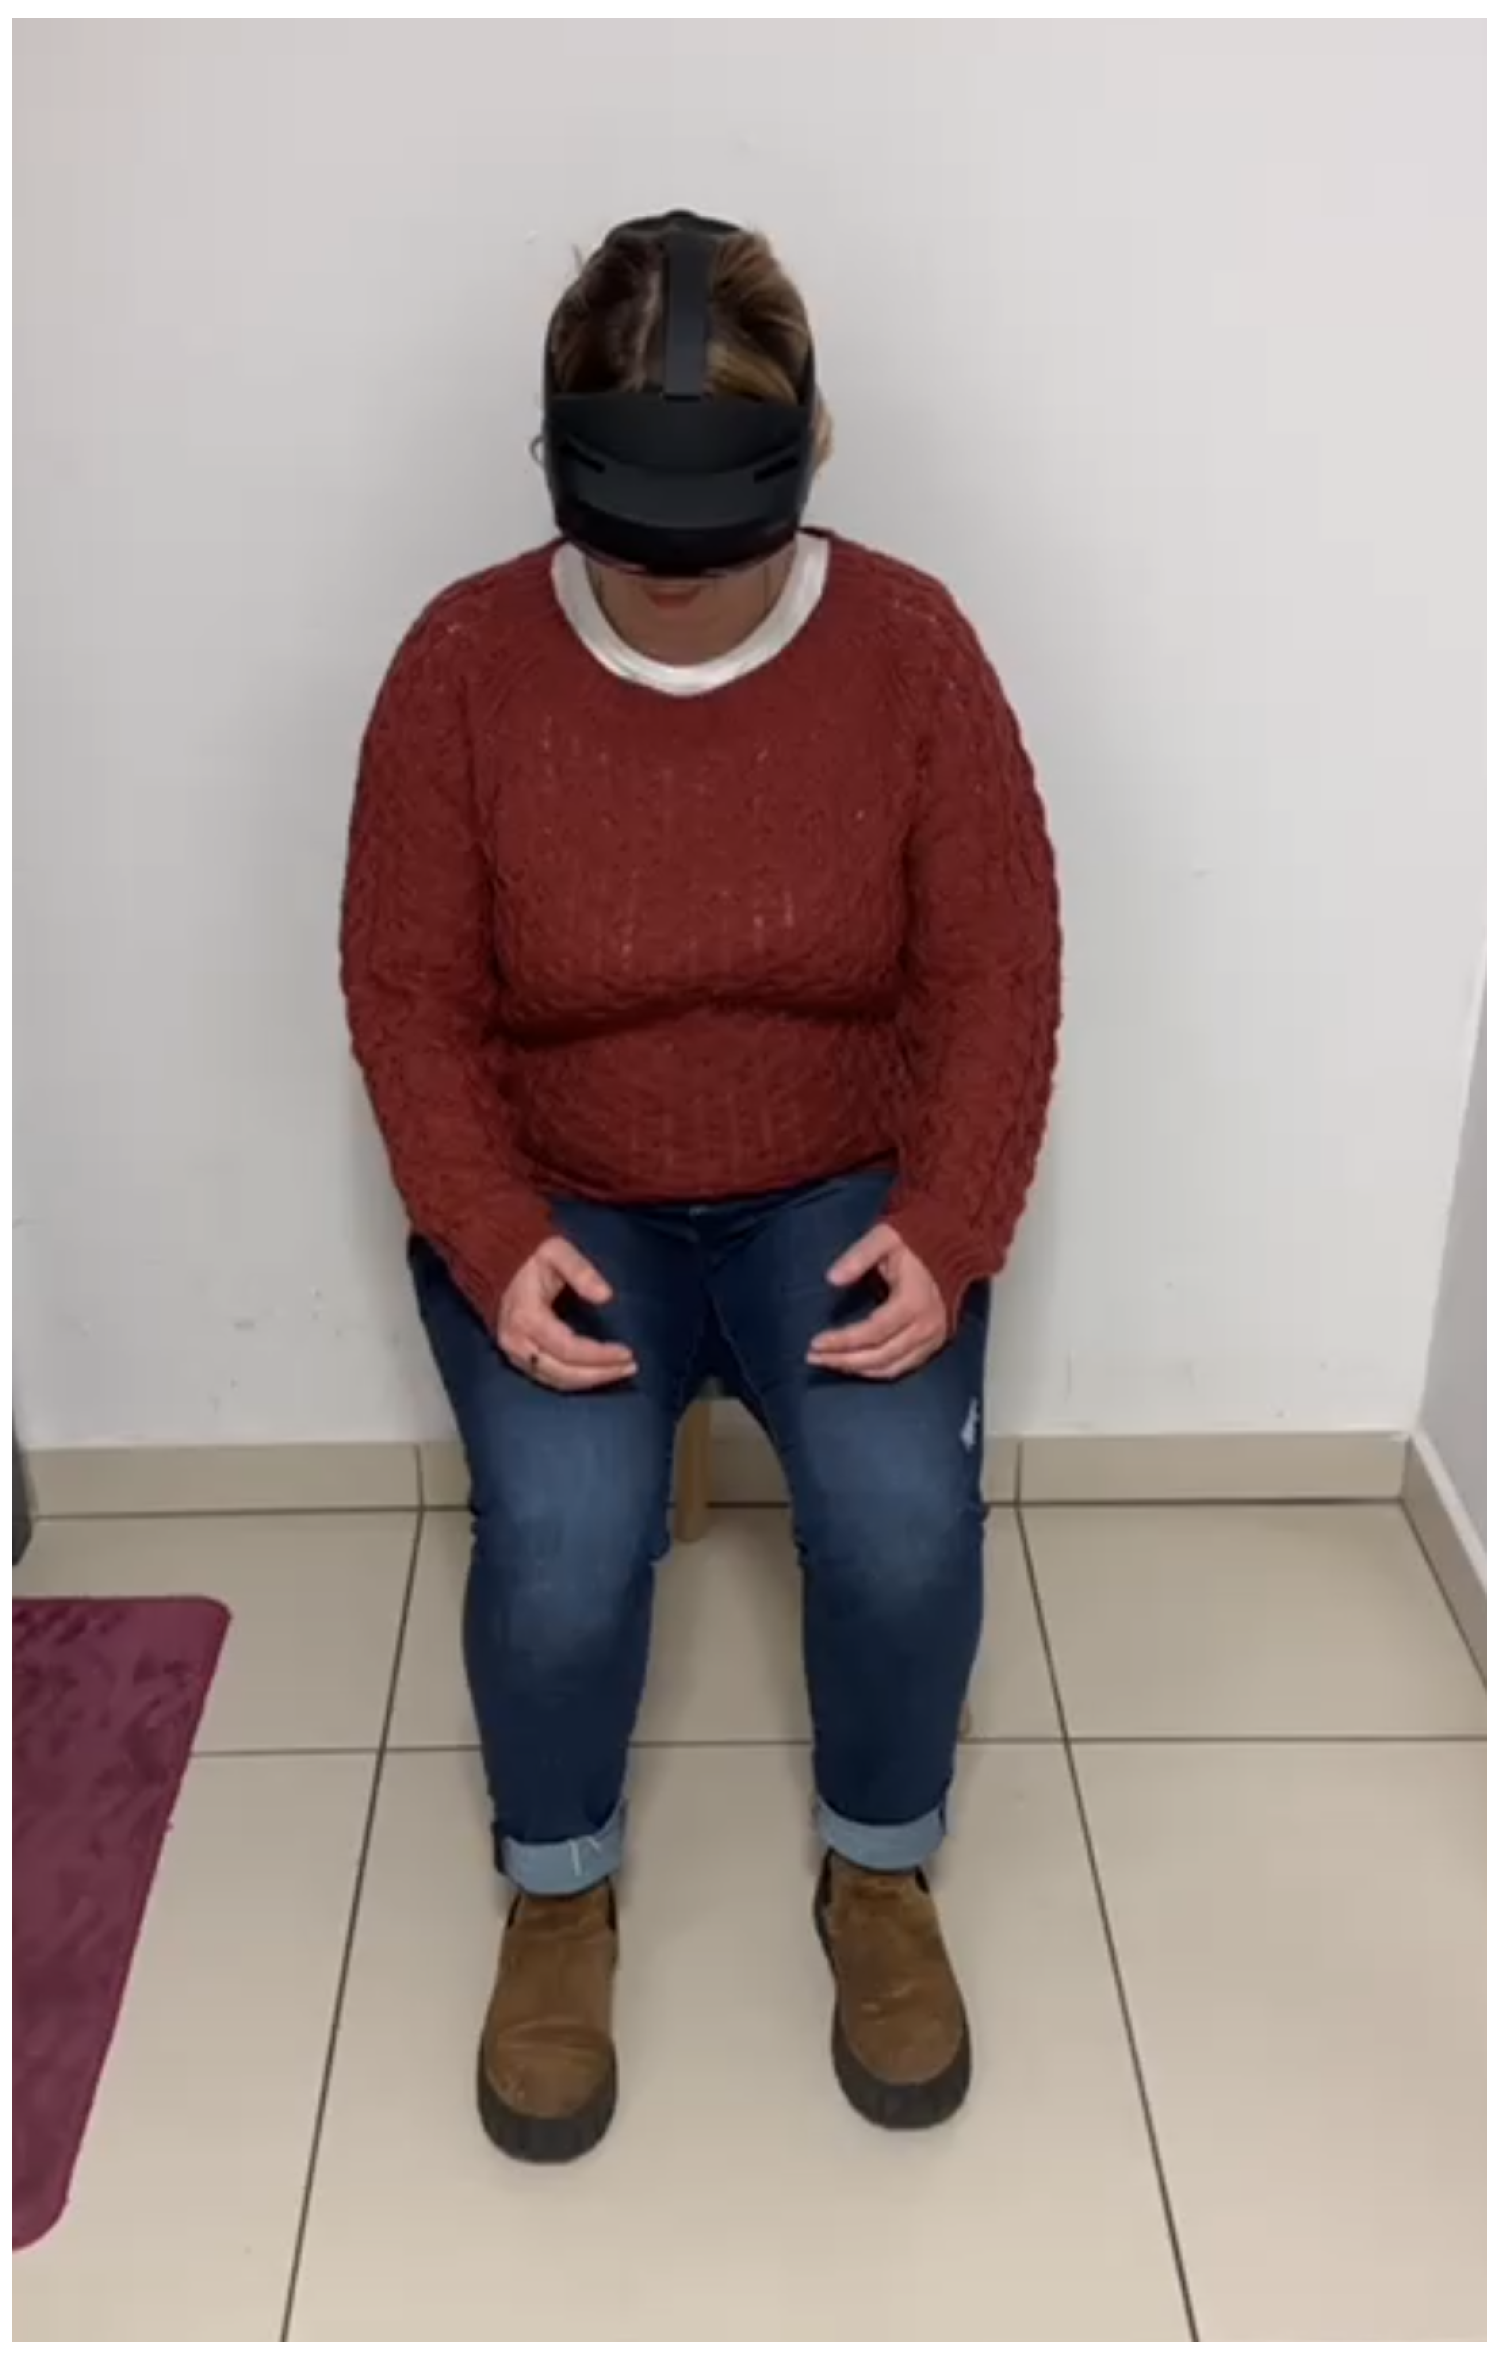
2.1. Data Acquisition Protocol
2.2. Patient Data
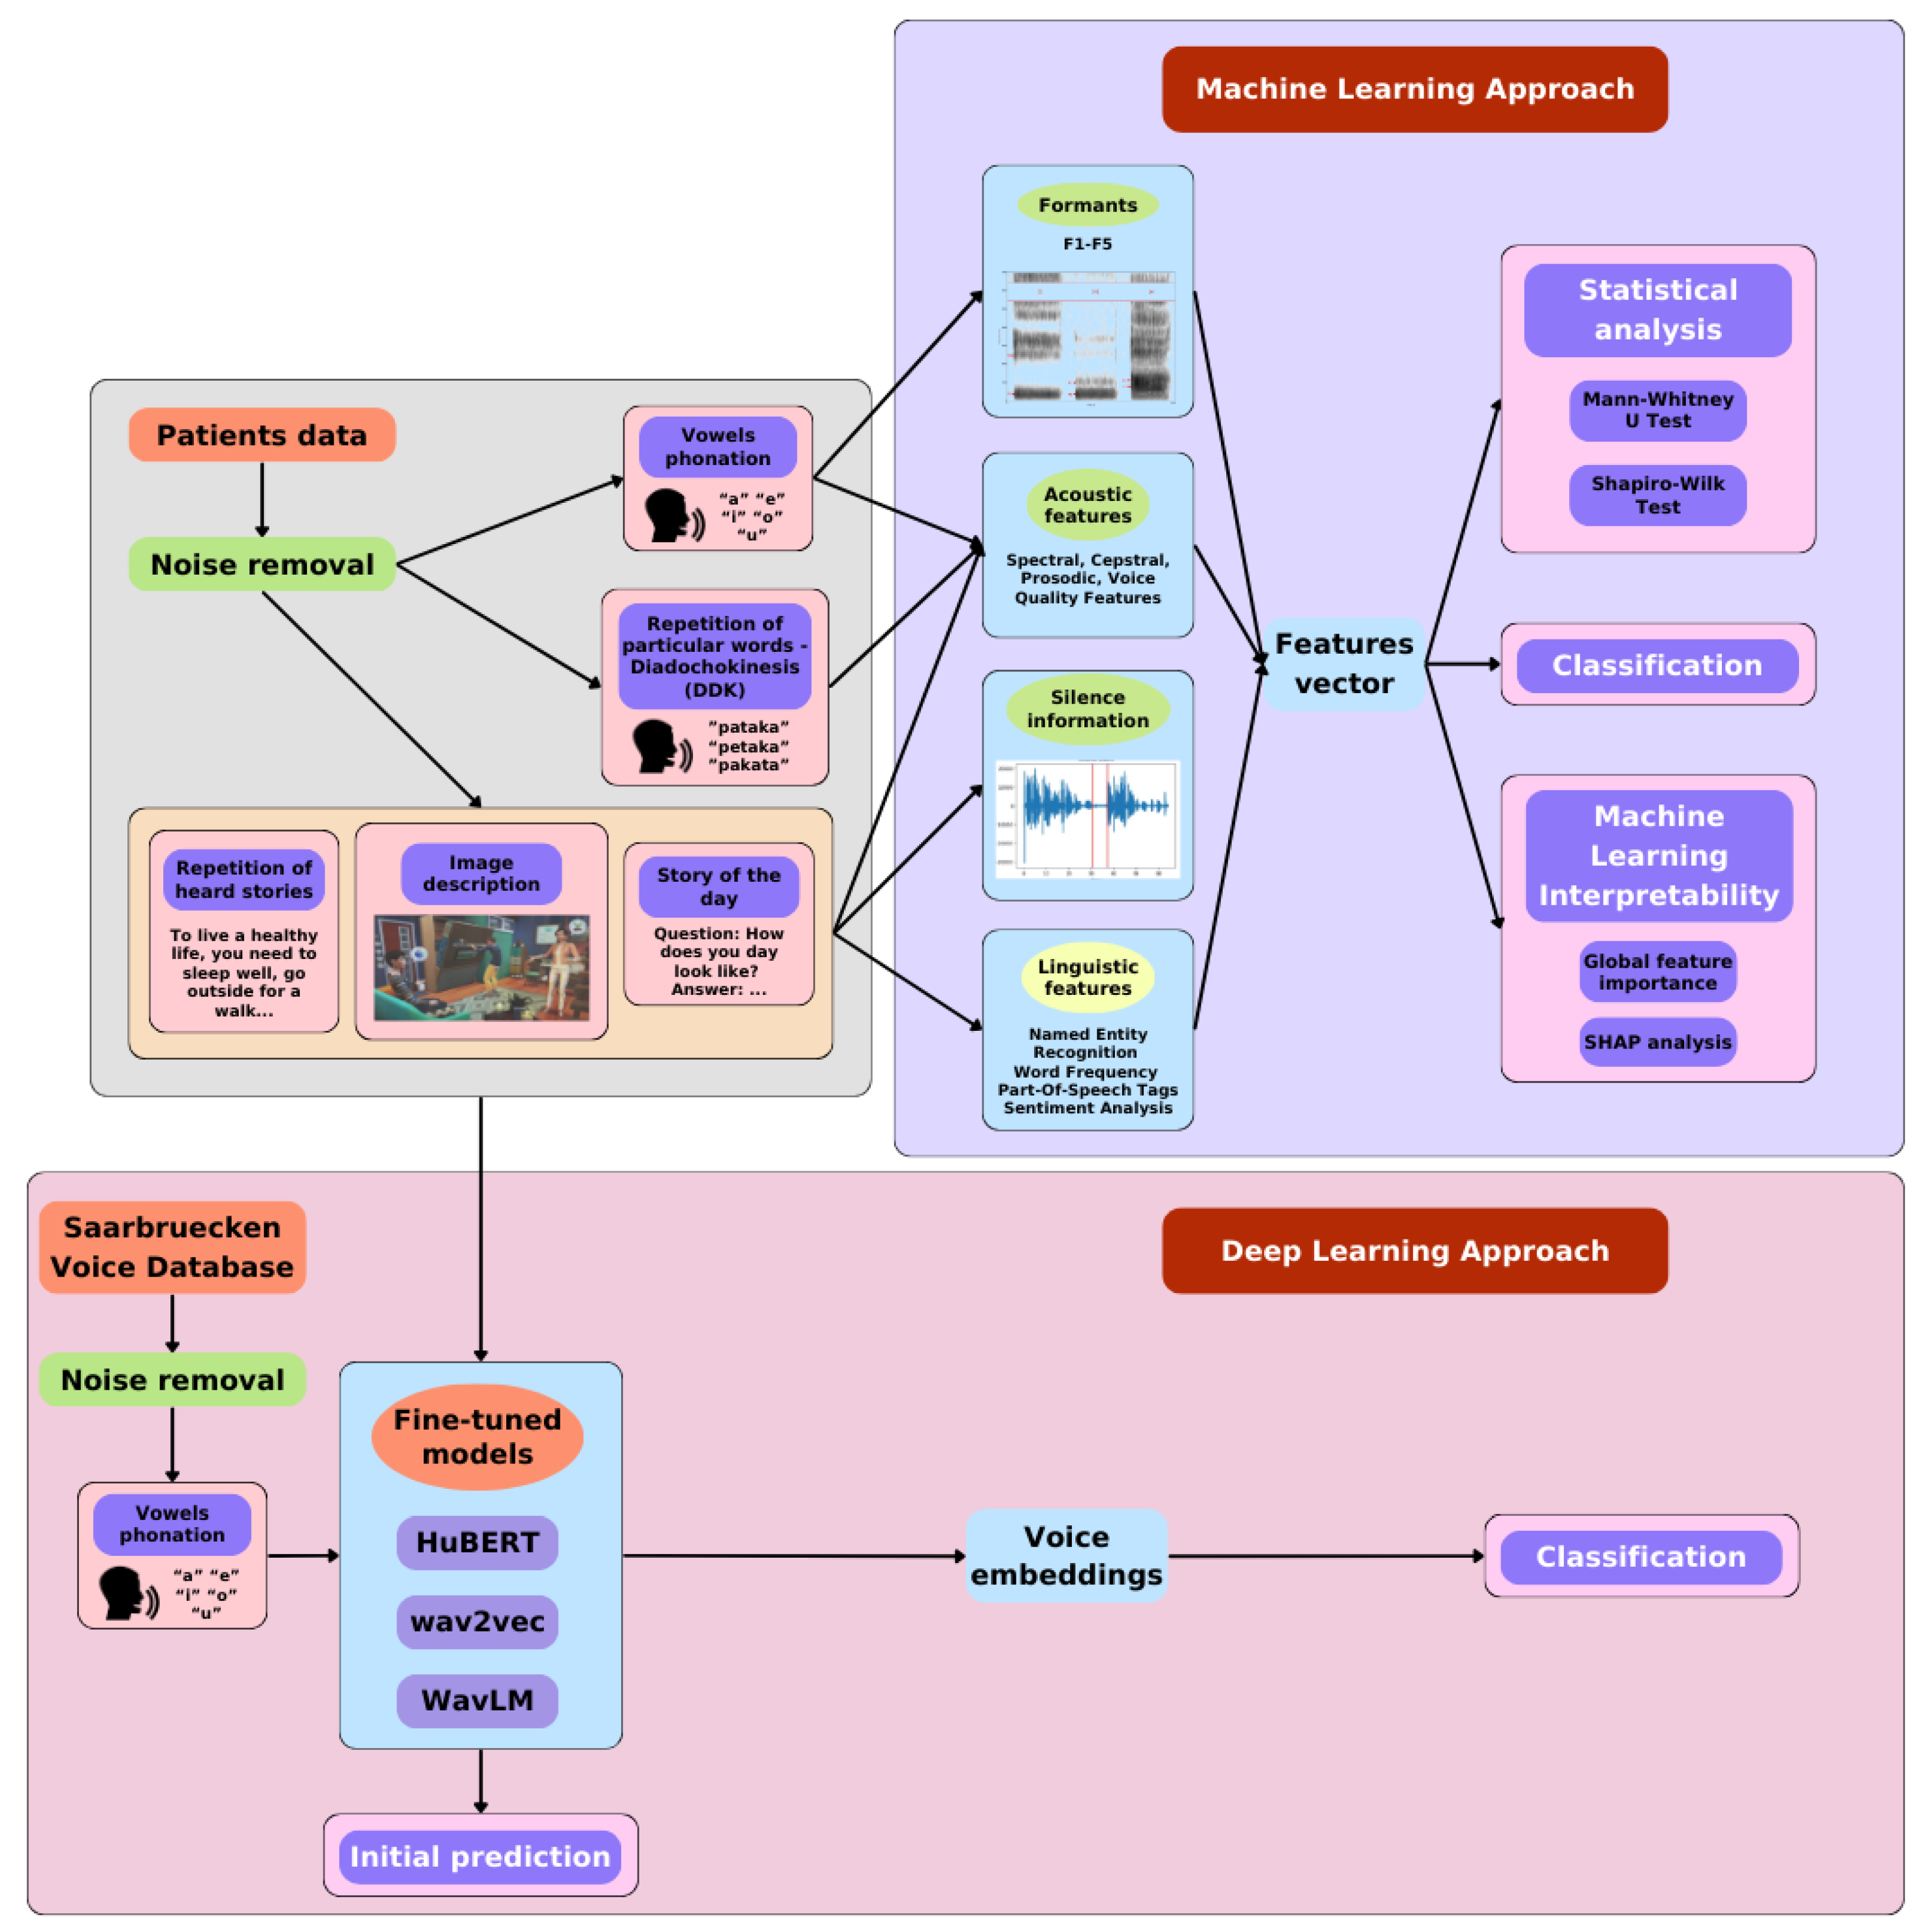
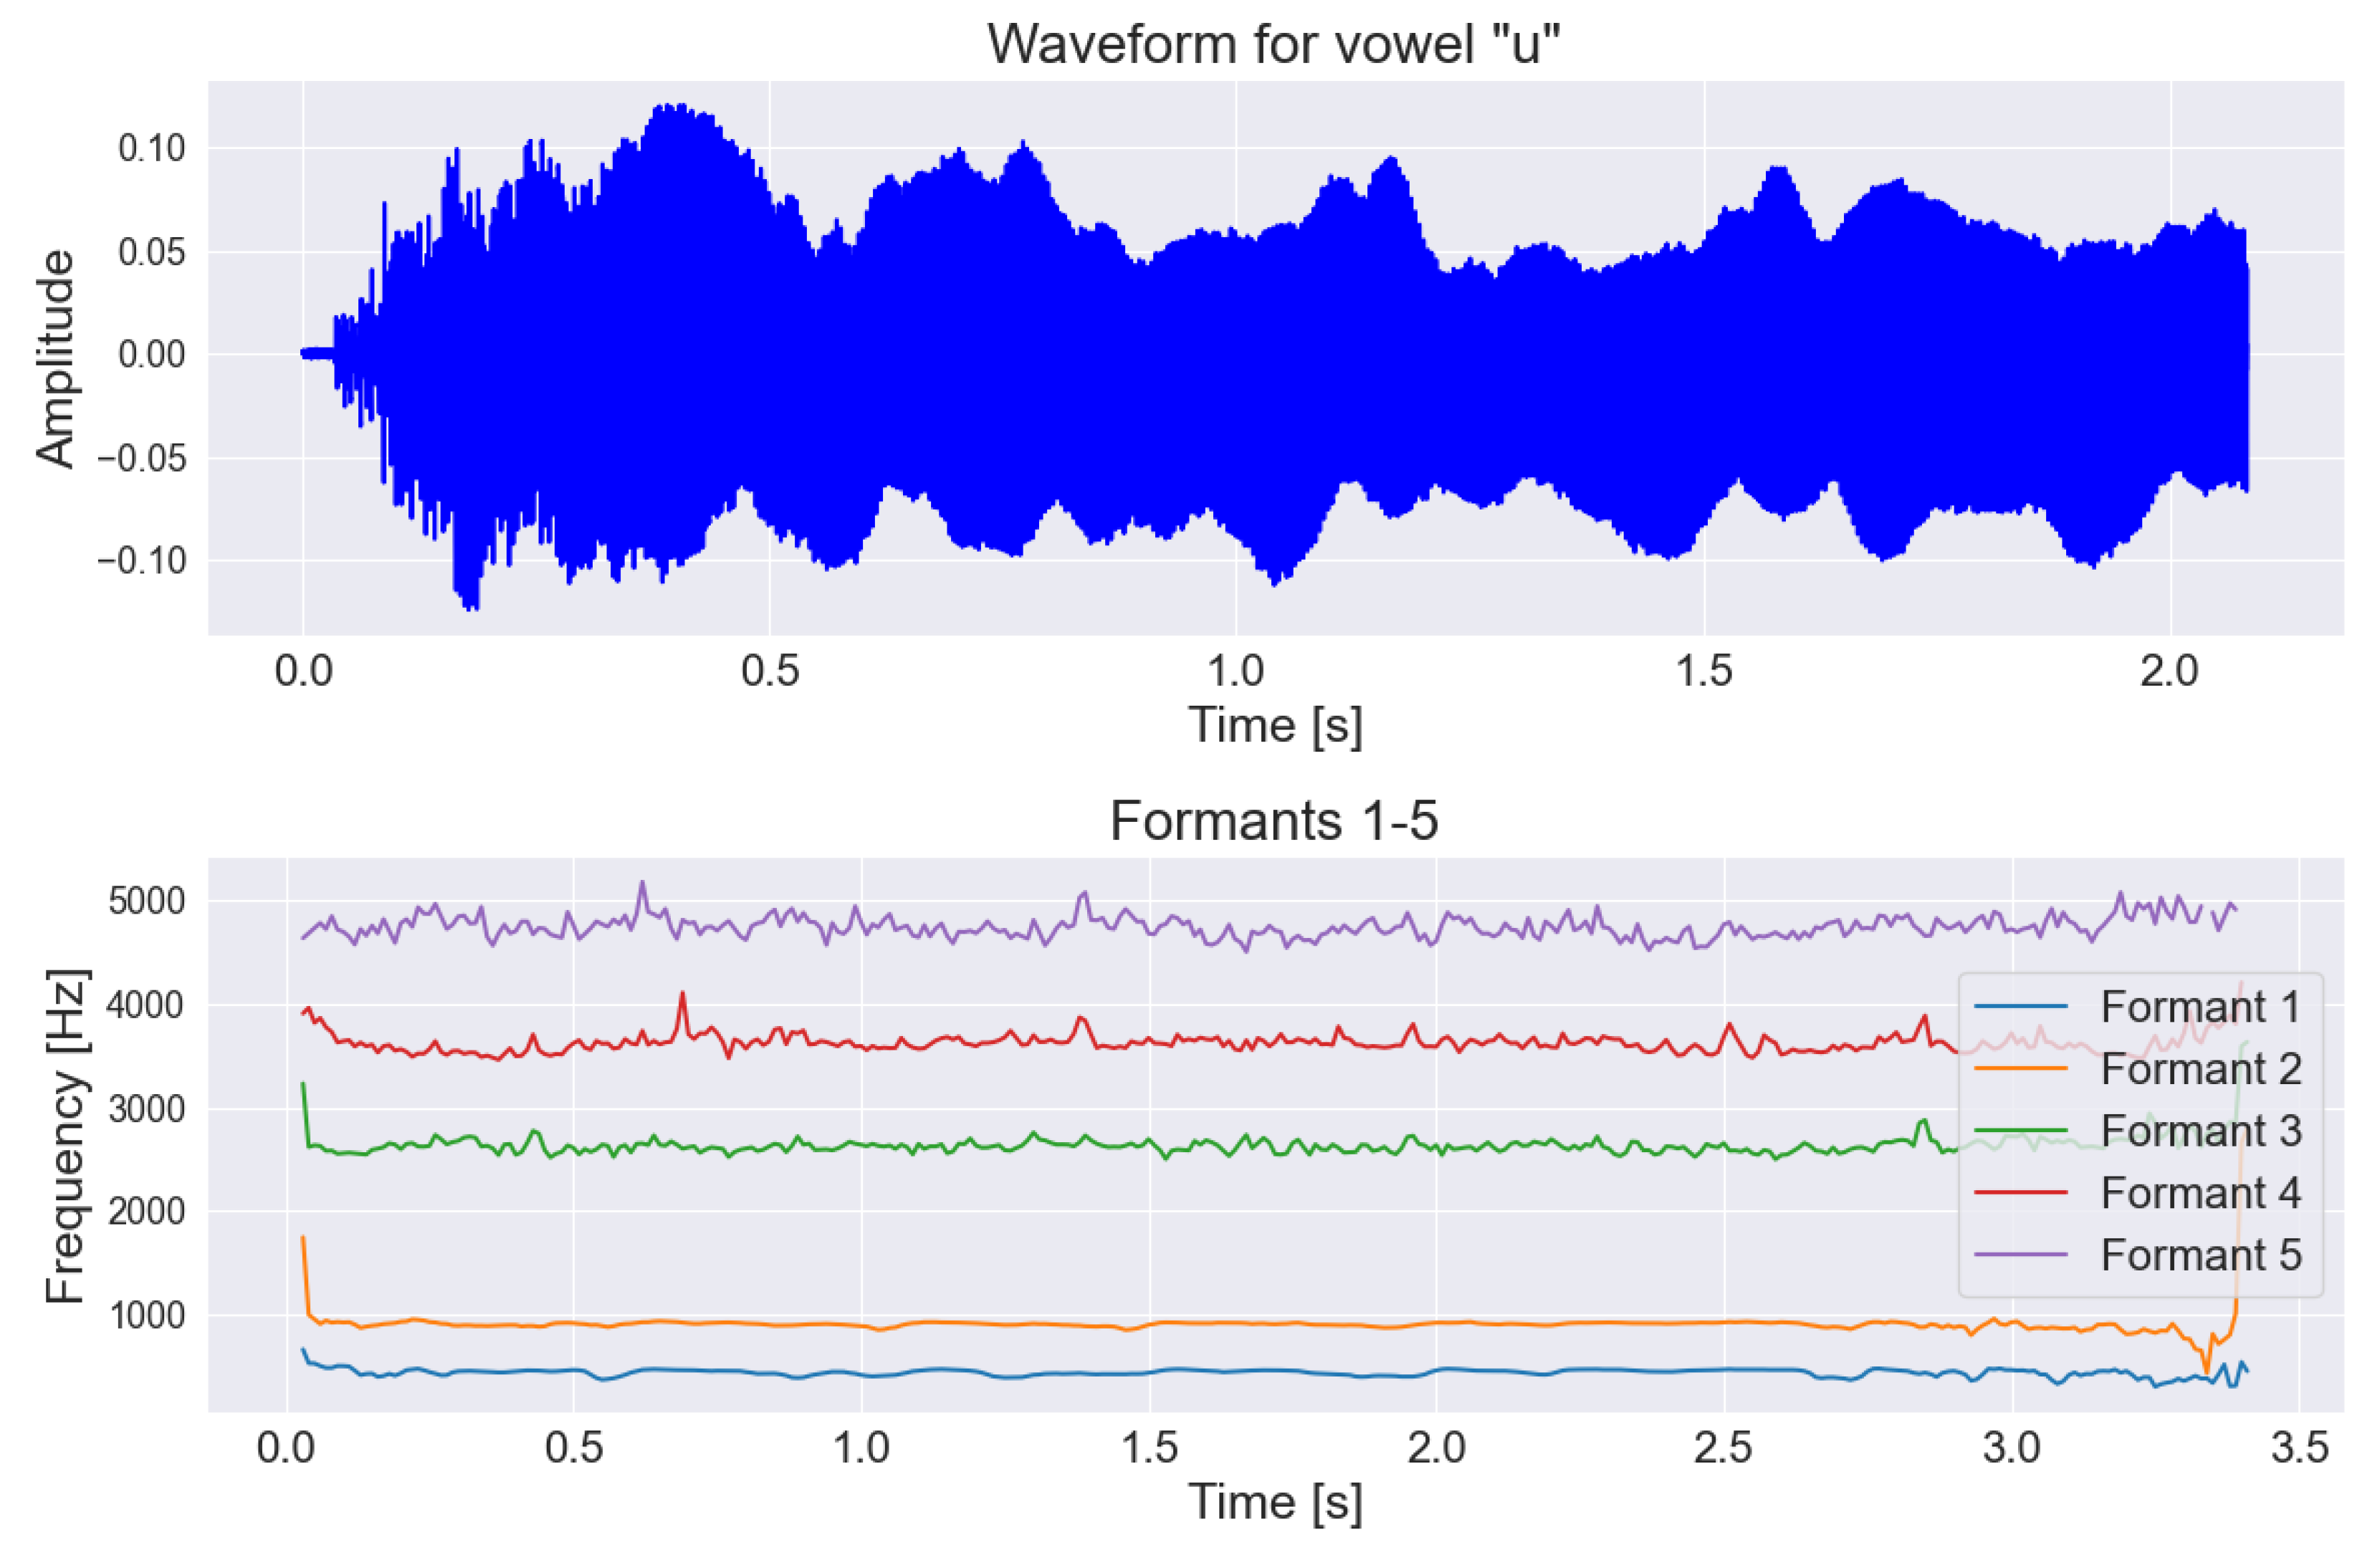
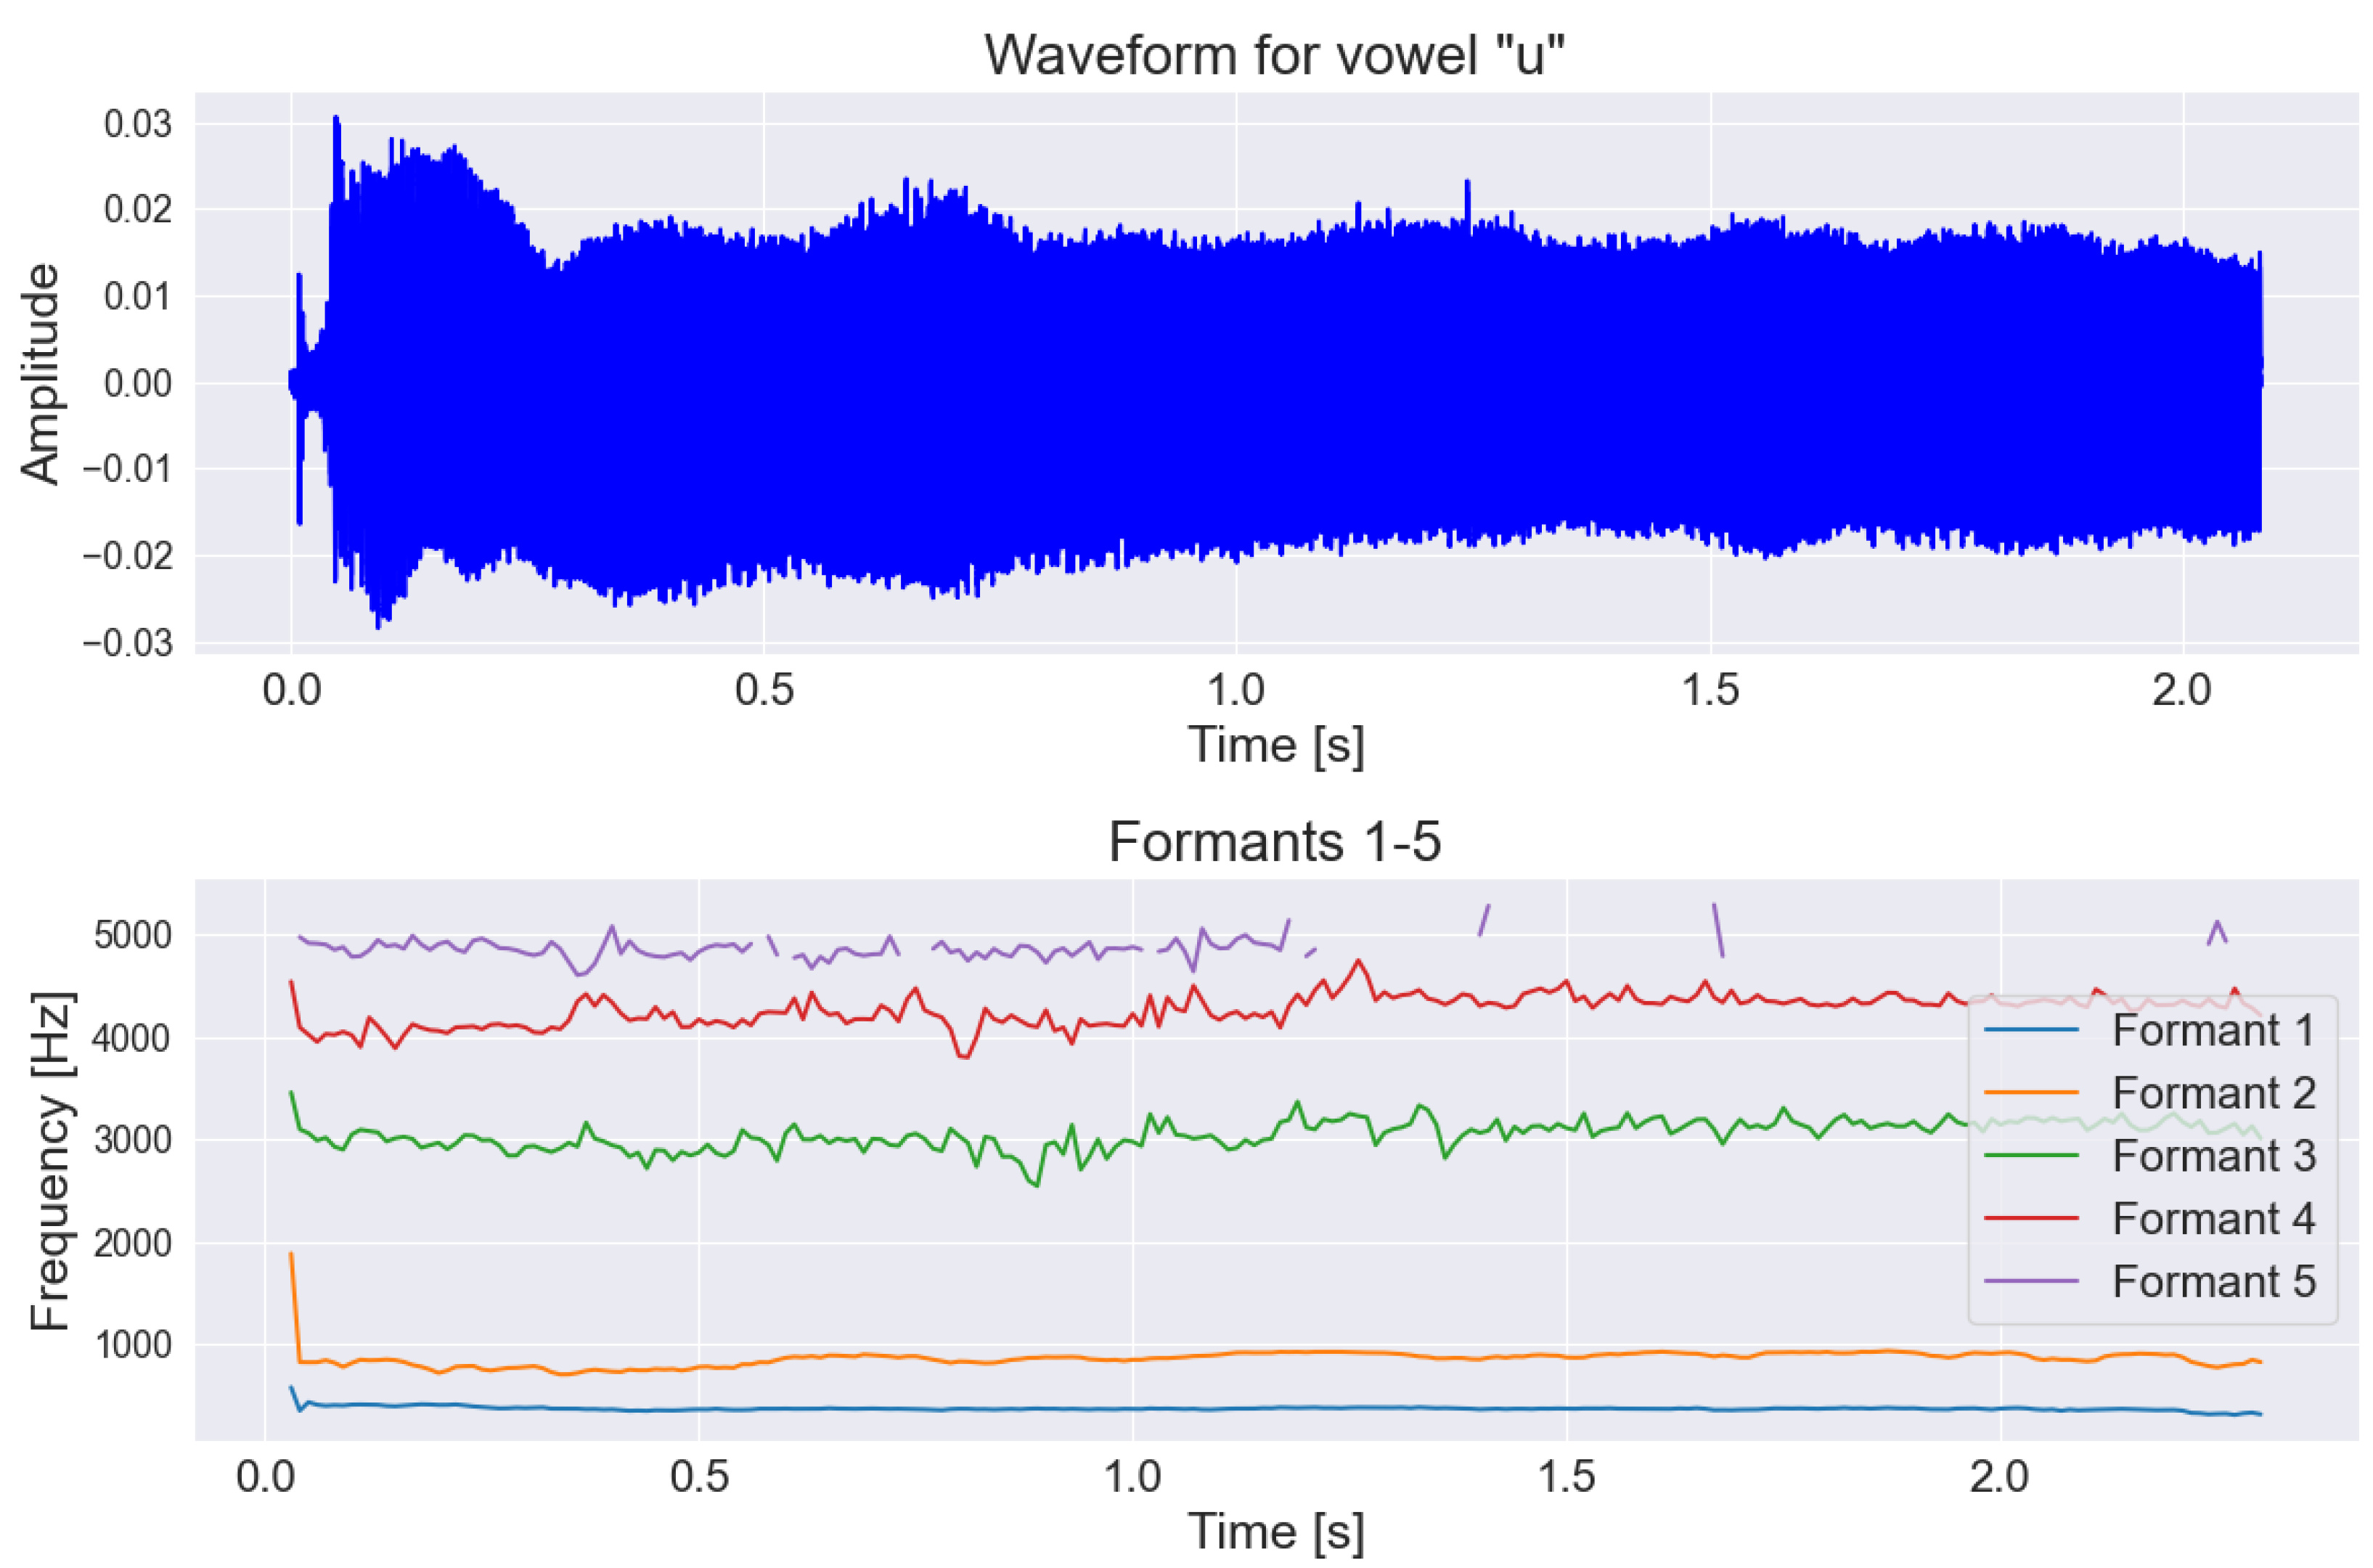
2.3. Speech and Voice Parametrization
2.4. Language Parametrization
- Parts of Speech (POS). The analysis of parts of speech can help in detecting changes in communication patterns that may be early indicators of neurodegenerative diseases such as Alzheimer’s or Parkinson’s disease. For instance, a person with Alzheimer’s disease may start using simpler sentences and less complex grammatical structures, which can be indirectly determined through POS tagging. Additionally, this analysis can aid in monitoring the progression of the disease and the response to treatment, as well as help identify patterns and trends characteristic of individuals with neurodegenerative conditions in large datasets.The parts of speech analyzed included: adverb, numeral, punctuation, determiner, interjection, adjective, preposition, particle, conjunction, proper noun, auxiliary verb, pronoun, noun, verb, coordinating conjunction, and others.
- Named Entity Recognition (NER). Named entity recognition is a crucial first step in the process of creating semantic representations. This enables more precise identification of specific events and relationships between participants. Consequently, it can contribute to a better understanding of the differences between patient groups, which can be pivotal in the context of neurodegenerative diseases.The text was analyzed to detect the occurrence of names of people, dates, times, geographical locations, organization names, and places.
- Word frequency. For word frequency, only four to five words per task were used, which were the same for both groups—Parkinson’s patients and the control group. This type of information can be used to track what type of words are mostly common in PD and HC group. For example, the most frequently spoken words by both groups for the task “daily activities description” were the following: “morning”, “lunch”, “wake up”, “home”.
- Normalized number of different words in the text. Here, all unique words in the text were counted, and their proportion relative to all spoken words was calculated. This kind of feature allow to determine how sophisticated a person’s nomenclature is, which can be also extended to the PD and HC group.
- Sentiment analysis. Sentiment analysis can be used to monitor the progression of neurodegenerative diseases by observing changes in the patient’s attitude during conversations. For example, a person suffering from Parkinson’s disease may experience a decline in well-being associated with disease progression, which translates into expressing more negative emotions during interactions. Furthermore, sentiment analysis opens up the possibility of personalized care, as doctors can better understand the psychological context of patients dealing with such neurodegenerative conditions.It was performed for each sentence spoken by the participant. This resulted in the number of positive, negative, and neutral sentiments in the text provided by the participant. This was achieved using a pretrained roBERTa model on a Polish language corpus [51].
2.5. Machine Learning Methods
- Three for each description-based task (picture description, story retelling, answering questions):
- −
- Trained separately on acoustic features, linguistic features, and a combination of both.
- Six for the continuous vowel pronunciation task:
- −
- Five trained on acoustic features for each vowel separately;
- −
- One trained on the combined features of all vowels.
- Four for the diadochokinetic task of repeating specific words:
- −
- Three trained on acoustic features for each word (“pataka”, “petaka”, “pakata”);
- −
- One trained on the combined features of all these words.
- One final model trained on all features of all described tasks.
2.6. Deep Learning Methods
- MethodsIn the deep learning approach, we decided to use the effective language models such as HuBERT-base [52], WavLM-base [53], and wav2vec 2.0 [54]. Each of these models was implemented in basic variant. In this version, datasets were trained on the LibriSpeech dataset. It is worth mentioning that the selected language models were originally trained on a large amount of data using the self-supervised learning method, which means that there are no traditional labels during training. This strategy allows for the creation of a universal representation of speech, making it easier to use these models for various speech processing tasks, such as speaker verification, recognition or authentication. Using this approach, with a slight modification, we could easily adapt the previously trained model to classify neurodegenerative diseases. All the above-mentioned models are equipped with a convolutional layer for feature extraction from the audio input, as well as a transformer-based encoder responsible for processing sequential data. Additionally, each model is equipped with a classification layer.
- Fine-tuning for Parkinson detectionBefore fine-tuning and classifying the data obtained with the MR head-mounted display (HMD), the model was pretrained to diagnose voice pathologies using the Saarbruecken Voice Database (SVD) [55]. This database contains voice recordings from over 2000 individuals, including patients with various voice pathologies. From this dataset, we utilized 1500 recordings with pathological speech characteristics, sampled at a frequency of 44.1 kHz, to fine-tune the model for recognizing voice pathologies commonly associated with neurodegenerative diseases like Parkinson’s disease.
- Data processingThe data underwent preprocessing to prepare it for analysis. This included resampling the recordings to a sampling rate of 16 kHz, as required by the models trained on data at this frequency. Additionally, the length of each recording was standardized to 2 s. Longer recordings, such as those obtained from MR HMD, were split into random 2-s fragments to avoid losing valuable information. Conversely, shorter recordings were padded with silence to ensure consistency across the dataset. Recordings with poor quality or processing issues that made them unsuitable for model training were excluded from the analysis.
- Training processDuring the training process, the learning rate parameter was set to 0.0003 and the batch size was set to 64. The cross-entropy loss function was used, and the Adam optimization algorithm was applied during training. Model performance was evaluated using F1-score, precision, and recall calculated from the number of correctly and incorrectly classified data points. The selection of these metrics was made in the same manner as with the machine learning models due to the unevenness of the dataset, where the control group was larger than the group diagnosed with Parkinson’s disease. The cross-validation method was used during fine-tuning. SVD and mixed reality recordings were split into 5 folds during training.
3. Results
3.1. Statistical Analysis
3.1.1. Correlation with MoCA (Cognitive Function)
- pakata_F0final_sma_quantile50: ;
- pakata_F0final_sma_median: ;
- u_F0final_sma_quantile50: ;
- u_F0final_sma_median: ;
- u_F0final_sma_quantile25: ;
- pataka_F0final_sma_std: ;
- o_F0final_sma_quantile25: ;
- pakata_F0final_sma_mean: ;
- petaka_F0final_sma_std: .
3.1.2. Correlation with MDS-UPDRS-III (Motor Function)
- o_F0final_sma_std:;
- e_F0final_sma_std:;
- u_F0final_sma_std:;
- e_F0final_sma_quantile75:;
- a_F0final_sma_std:;
- u_F0final_sma_quantile75:;
- describe-story_F0final_sma_quantile75:;
- e_F0final_sma_mean:.
3.2. Machine Learning Classification Results
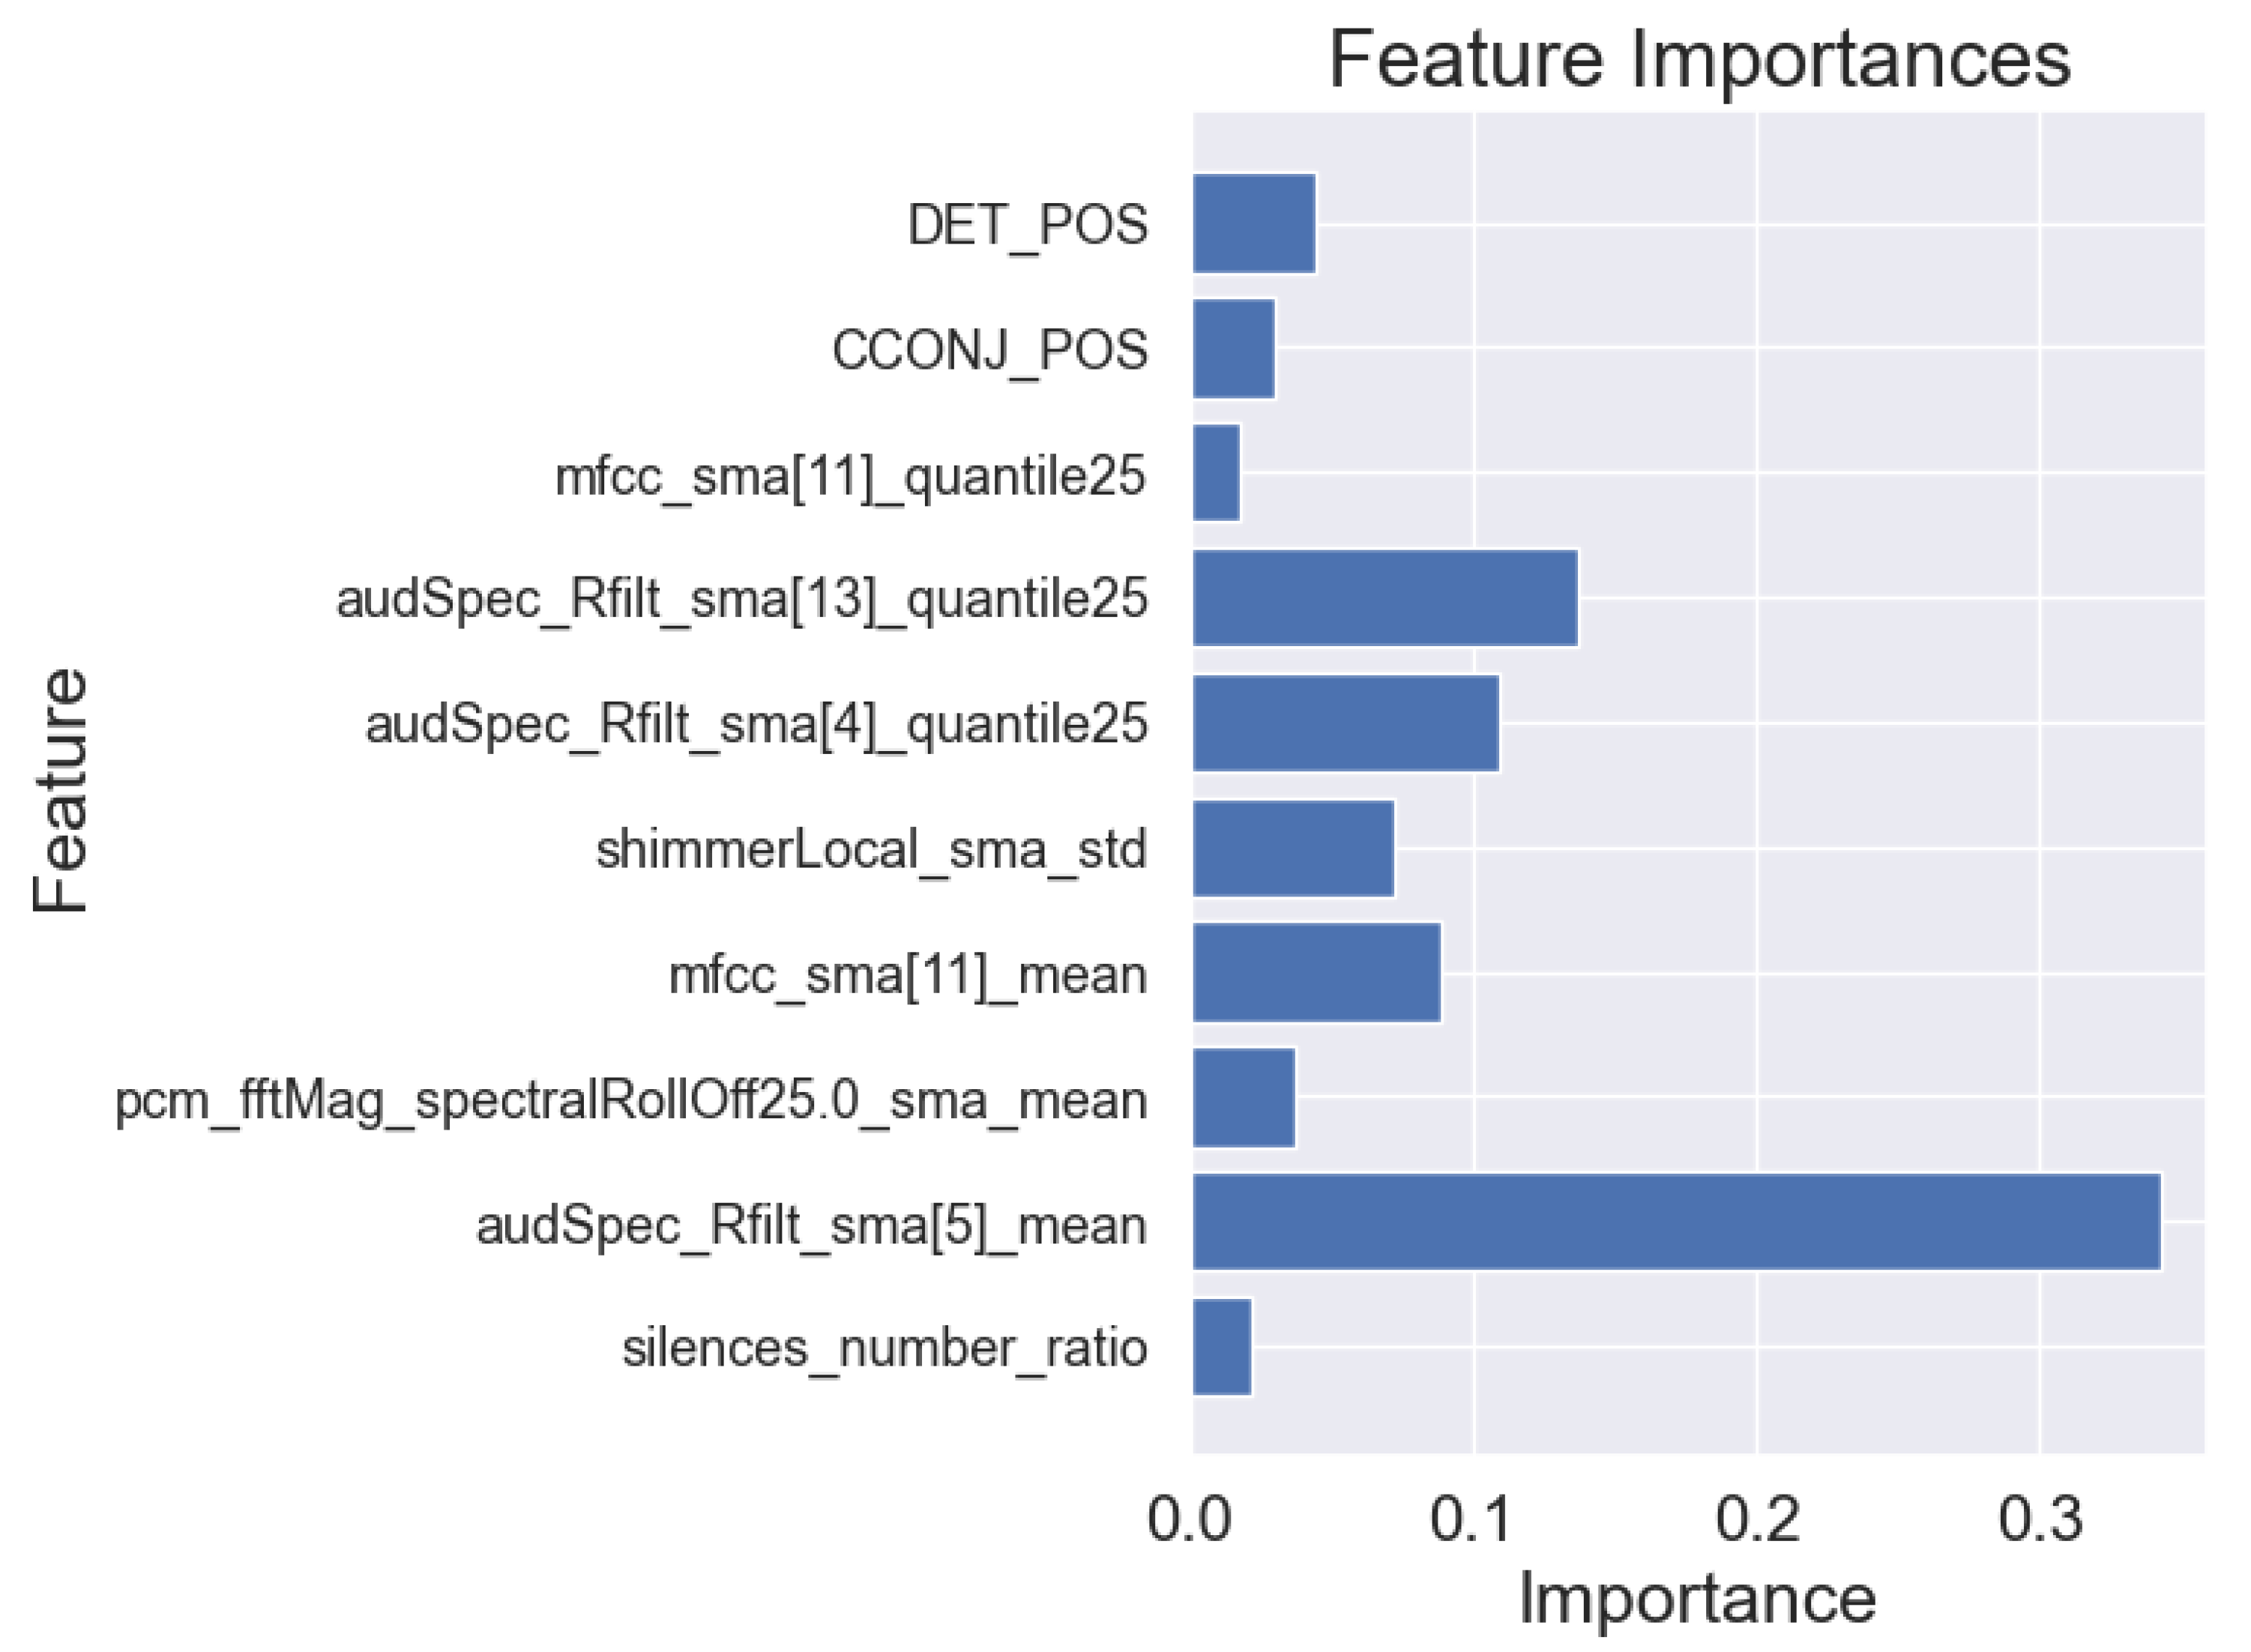
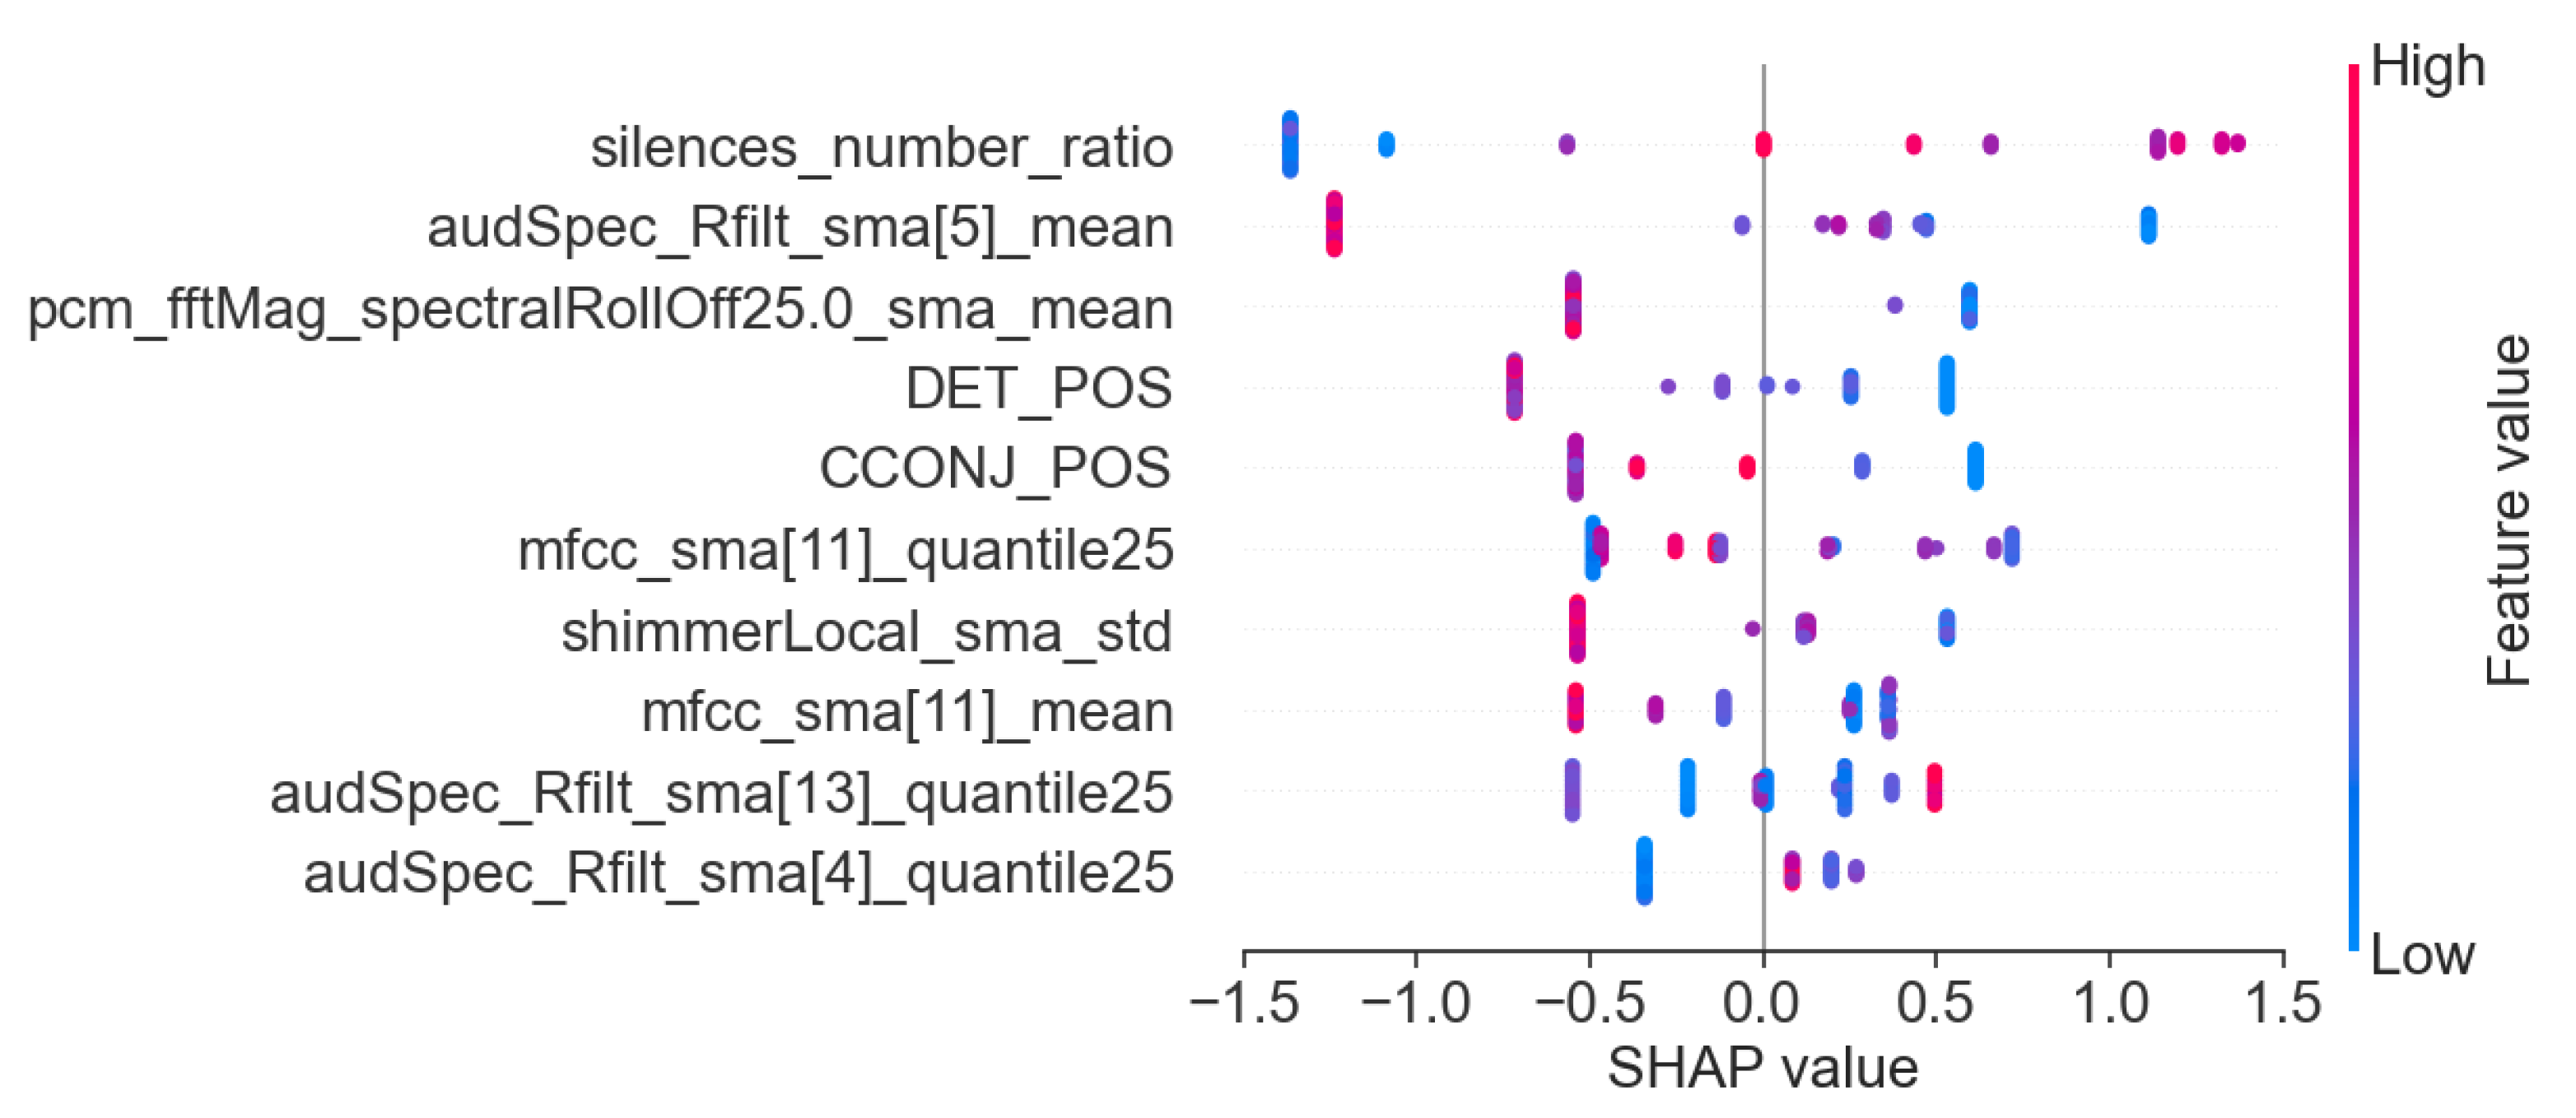
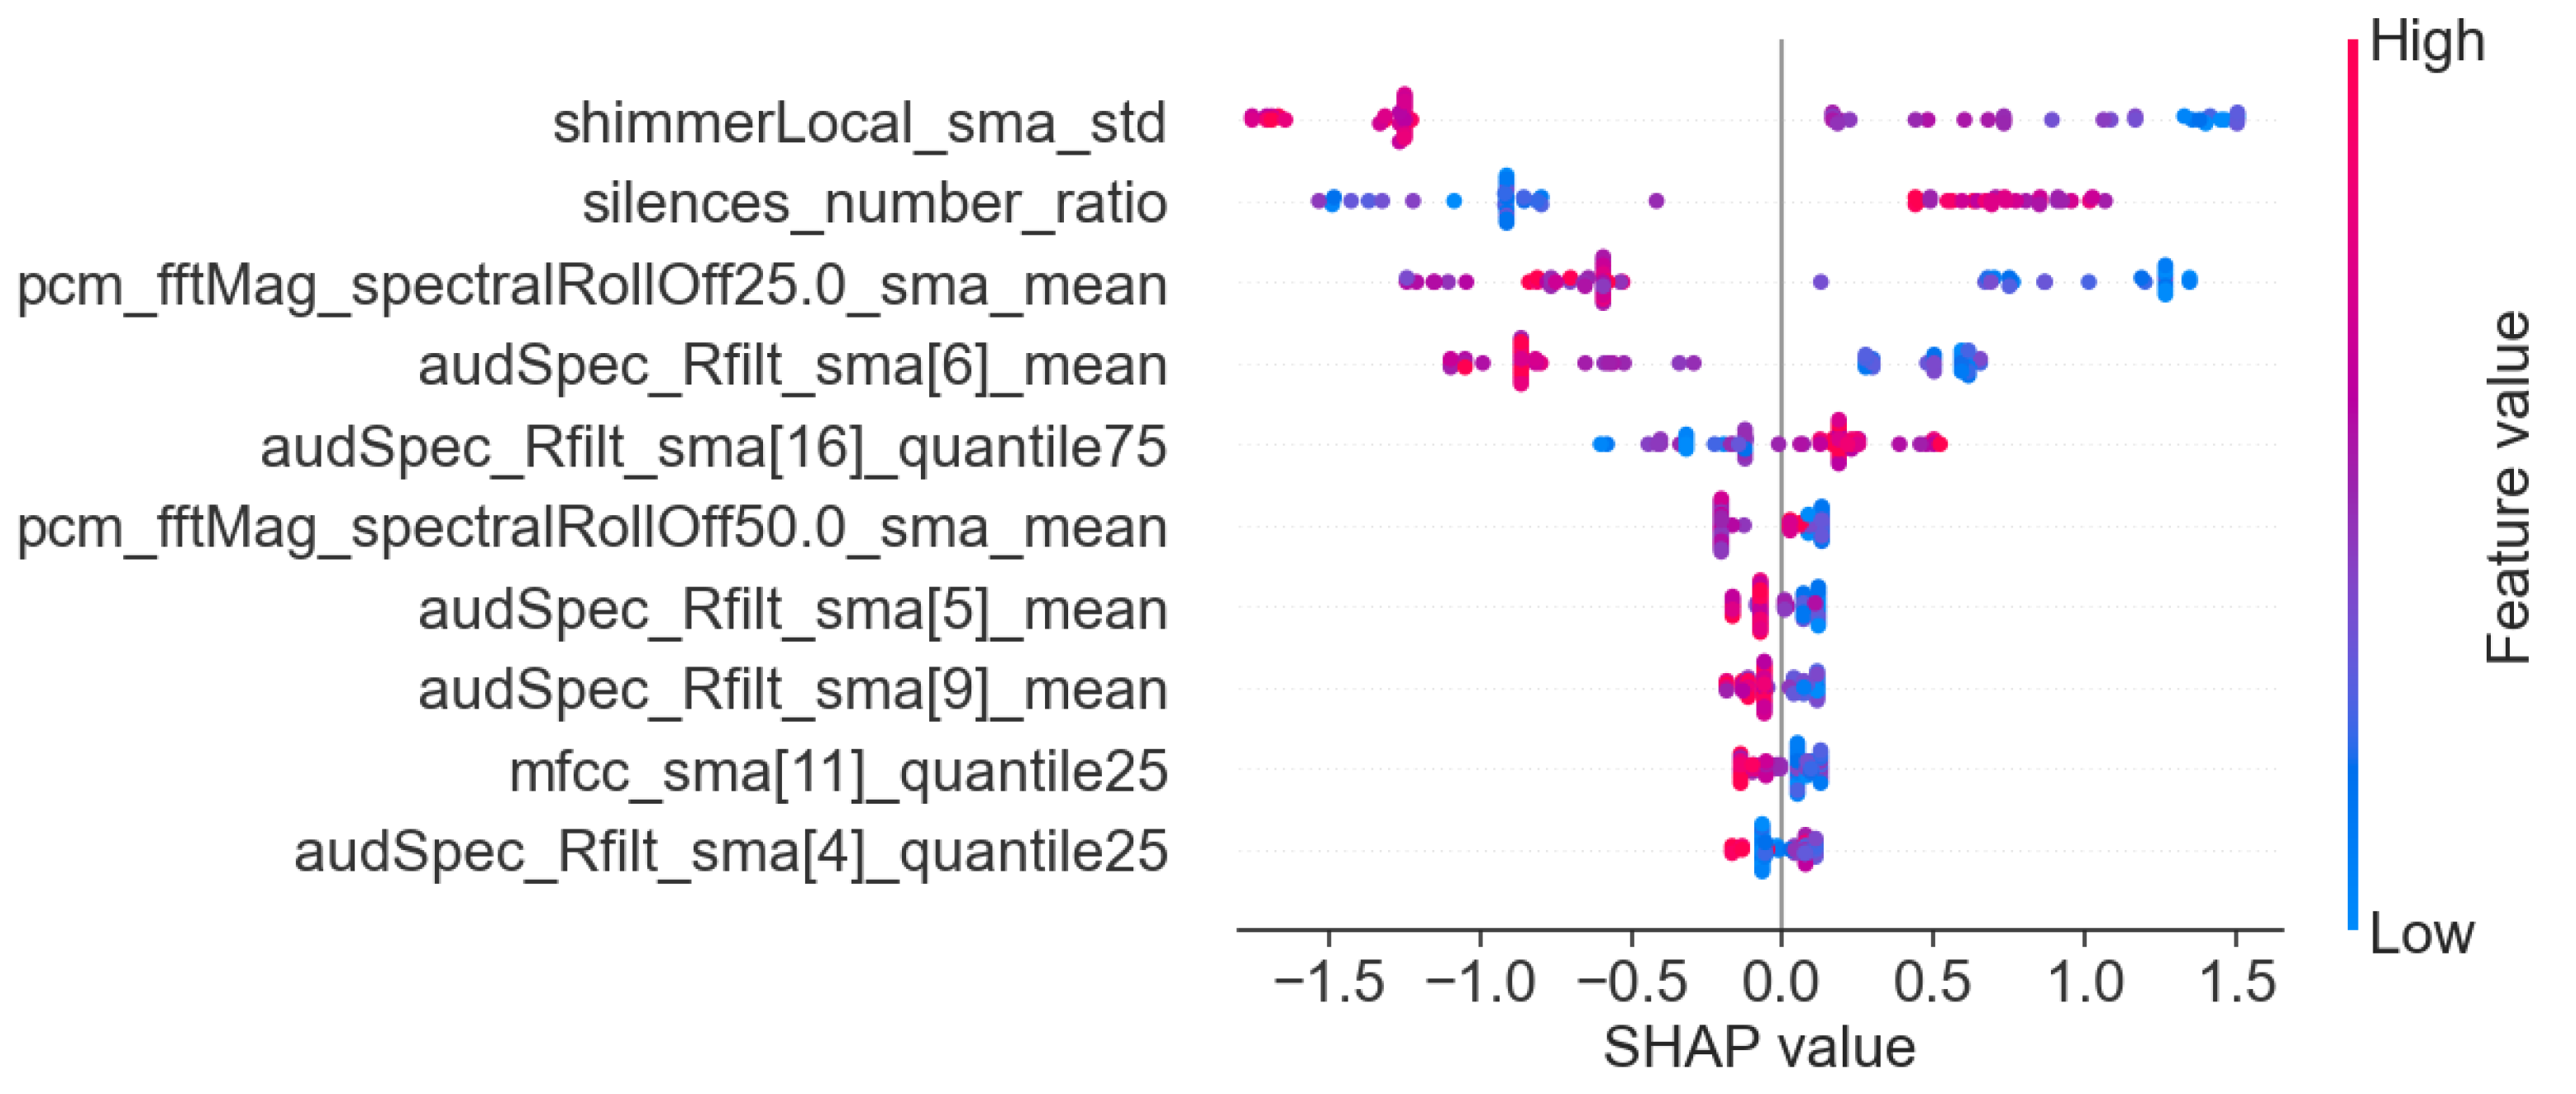
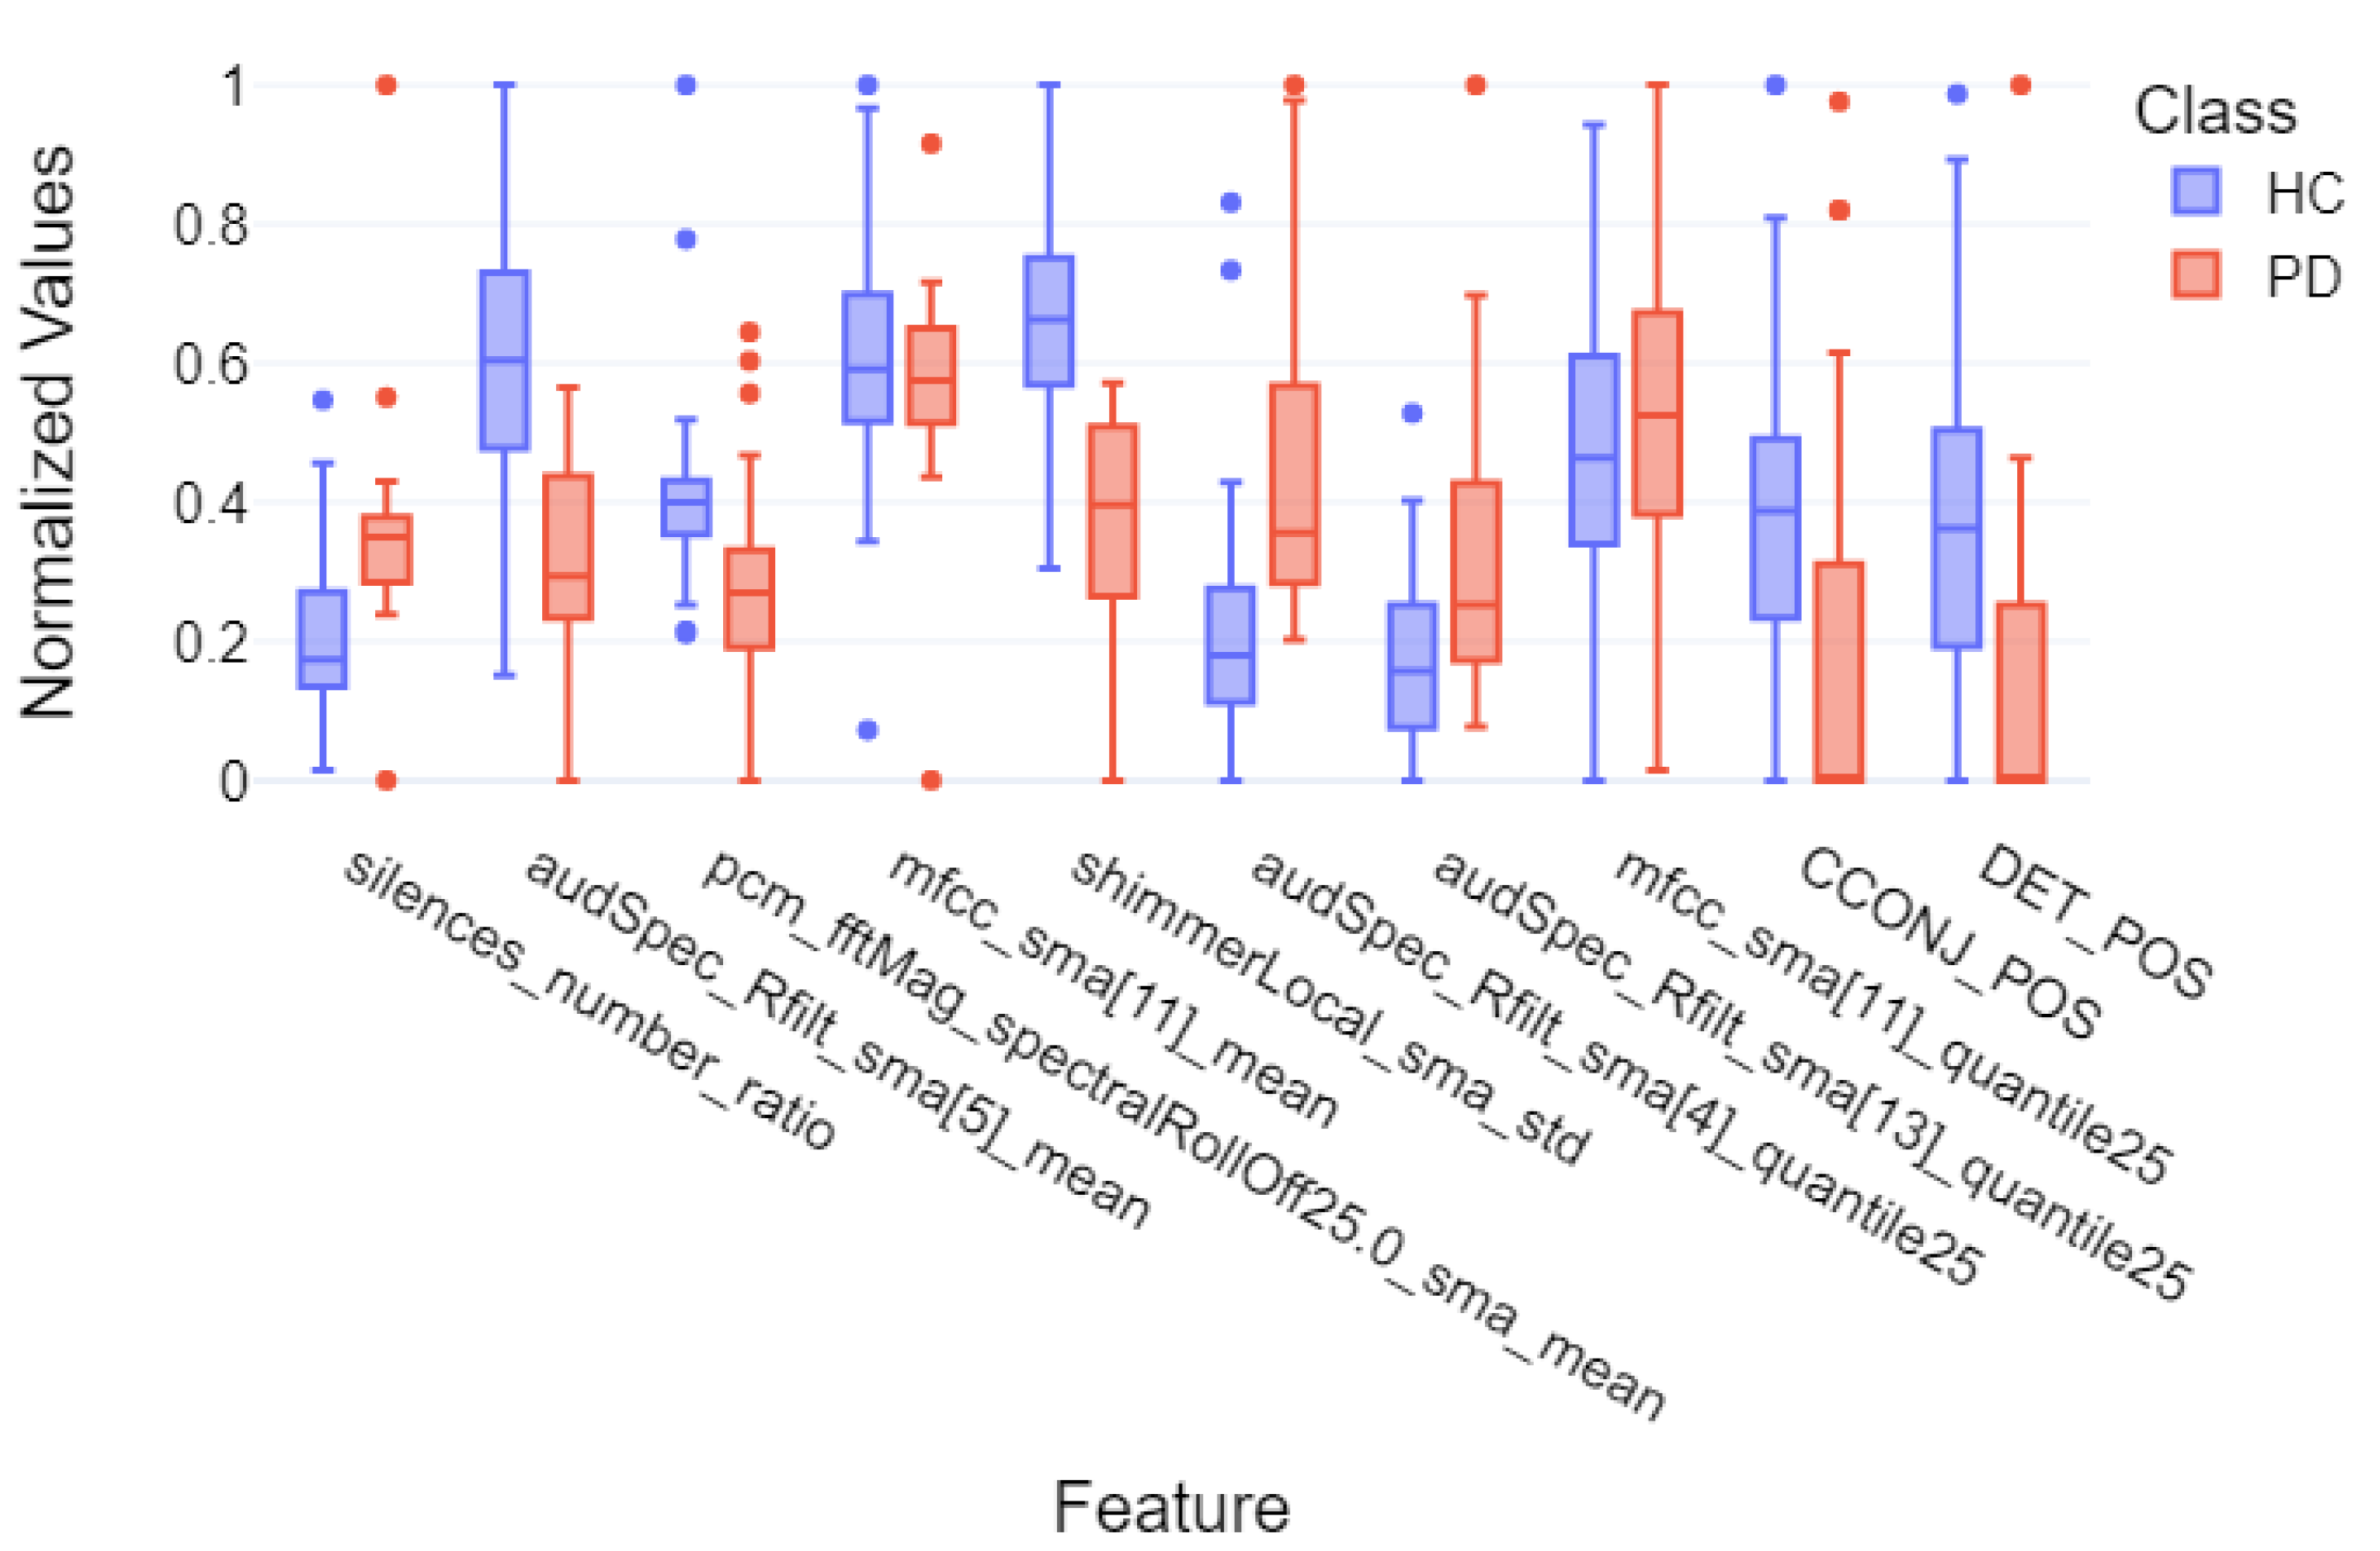
3.3. Machine Learning Interpretability
- Acoustic and linguistic features for the task: story retelling
- Acoustic features for the task: story retelling
- The diadochokinetic task for the word “pataka”.
3.4. Deep Learning Classification Results
4. Discussion

| Study | Dataset Size | Method (ML/DL) | Task | Best F1-Score, Recall, Precision |
|---|---|---|---|---|
| Our Work | 57 (21 PD, 36 HC) | ML: Logistic Regression, SVM, Random Forests, AdaBoost, XGBoost | Story Retelling (Acoustic + Linguistic) | F1: 0.90 ± 0.05 Recall: 0.91 ± 0.11 Precision: 0.92 ± 0.10 |
| Our Work | 57 (21 PD, 36 HC) | DL: HuBERT, WavLM, wav2vec 2.0 | Diadochokinetic Task | F1: 0.94 ± 0.04 Recall: 0.92 ± 0.08 Precision: 0.98 ± 0.03 |
| [15] | 223 (115 PD, 108 HC) | ML: SVM | Standardized Italian Sentence | F1: 0.79 Recall: 0.83 Precision: 0.75 |
| [17] | 338 (72 Early PD, 266 HC) | ML: KNN, SVM, NB, DL: CNN | Articulation of the Vowel /e/ | F1: 0.82 ± 0.01 Recall: 0.83 ± 0.01 Precision: 0.81 ± 0.01 |
| [17] | 354 (88 Mid-Advanced PD, 266 HC) | ML: KNN, SVM, NB, DL: CNN | Articulation of the Vowel /e/ | F1: 0.80 ± 0.03 Recall: 0.80 ± 0.01 Precision: 0.79 ± 0.03 |
| [20] | 37 (16 PD, 21 HC) | ML: Cubic SVM, Fine KNN, DL: Wide neural network | Reading Task | F1: 0.92 Recall: 0.91 Precision: 0.93 |
| [20] | 37 (16 PD, 21 HC) | ML: Cubic SVM, Fine KNN, DL: Wide neural network | Spontaneous Conversation | F1: 0.90 Recall: 0.90 Precision: 0.90 |
| [23] | 65 (28 PD, 37 HC) | DL: YAMNet | Standardized Italian Sentence | F1: 0.84 Recall: 0.74 Precision: 1.00 |
| [21] | 188 (124 PD, 64 HC) | DL: CNN-LSTM | Articulation of the Vowel /a/ | F1: 0.96 Recall: 0.96 Precision: 0.95 |
| [22] | 252 (188 PD, 64 HC) | DL: LSTM | Articulation of the Vowel /a/ | F1: 0.93 Recall: 0.90 Precision: 0.96 |
5. Conclusions
Author Contributions
Funding
Institutional Review Board Statement
Informed Consent Statement
Data Availability Statement
Conflicts of Interest
References
- DeMaagd, G.; Philip, A. Parkinson’s Disease and Its Management: Part 1: Disease Entity, Risk Factors, Pathophysiology, Clinical Presentation, and Diagnosis. Pharm. Ther. 2015, 40, 504–510, 532. [Google Scholar]
- Logemann, J.A.; Fisher, H.B.; Boshes, B.; Blonsky, E.R. Frequency and cooccurrence of vocal tract dysfunctions in the speech of a large sample of Parkinson patients. J. Speech Hear. Disord. 1978, 43, 47–57. [Google Scholar] [CrossRef] [PubMed]
- Ackermann, H.; Ziegler, W. Articulatory deficits in parkinsonian dysarthria: An acoustic analysis. J. Neurol. Neurosurg. Psychiatry 1991, 54, 1093–1098. [Google Scholar] [CrossRef] [PubMed]
- Miller, N.; Noble, E.; Jones, D.; Burn, D. Life with communication changes in Parkinson’s disease. Age Ageing 2006, 35, 235–239. [Google Scholar] [CrossRef]
- Biomarkers Definitions Working Group; Atkinson, A.J., Jr.; Colburn, W.A.; DeGruttola, V.G.; DeMets, D.L.; Downing, G.J.; Hoth, D.F.; Oates, J.A.; Peck, C.C.; Schooley, R.T. Biomarkers and surrogate endpoints: Preferred definitions and conceptual framework. Clin. Pharmacol. Ther. 2001, 69, 89–95. [Google Scholar]
- Califf, R.M. Biomarker definitions and their applications. Exp. Biol. Med. 2018, 243, 213–221. [Google Scholar] [CrossRef]
- Fagherazzi, G.; Fischer, A.; Ismaeli, M.; Despotovic, V. Voice for Health: The Use of Vocal Biomarkers from Research to Clinical Practice. Digit. Biomark. 2021, 5, 78–88. [Google Scholar] [CrossRef]
- Sara, D.S.; Orbelo, D.; Maor, E.; Lerman, L.O.; Lerman, A. Guess What We Can Hear—Novel Voice Biomarkers for the Remote Detection of Disease. Mayo Clin. Proc. 2023, 98, 1353–1375. [Google Scholar] [CrossRef]
- Godino-Llorente, J.I.; Shattuck-Hufnagel, S.; J.Y., C.; Moro-Velázquez, L.; Gómez-García, J.A. Towards the identification of Idiopathic Parkinson’s Disease from the speech. New articulatory kinetic biomarkers. PLoS ONE 2017, 12, e01895835. [Google Scholar] [CrossRef]
- Pascal, H.; Nico, S.; Florian, E.; Björn, W.S.; Bert, A. Voice Analysis for Neurological Disorder Recognition—A Systematic Review and Perspective on Emerging Trends. Front. Digit. Health 2022, 4, 842301. [Google Scholar]
- Tsanas, A.; Little, M.A.; McSharry, P.E.; Ramig, L.O. Accurate Telemonitoring of Parkinson’s Disease Progression by Noninvasive Speech Tests. IEEE Trans. Biomed. Eng. 2010, 57, 884–893. [Google Scholar] [CrossRef]
- Dashtipour, K.; Tafreshi, A.; Lee, J.; Crawley, I.B. Speech disorders in Parkinson’s disease: Pathophysiology, medical management and surgical approaches. Neurodegener. Dis. Manag. 2018, 8, 337–348. [Google Scholar] [CrossRef] [PubMed]
- Rudic, F. Articulatory Knowledge in the Recognition of Dysarthric Speech. IEEE Trans. Audio Speech Lang. Process. 2011, 19, 947–960. [Google Scholar]
- Feenaughty, L.; Tjaden, K.; Benedict, R.H.; Weinstock-Guttman, B. Speech and pause characteristics in multiple sclerosis: A preliminary study of speakers with high and low neuropsychological test performance. Clin. Linguist. Phon. 2013, 27, 134–151. [Google Scholar] [CrossRef] [PubMed]
- Antonio, S.; Giovanni, C.; Francesco, A.; Pietro, D.L.; Sami, A.W.M.; Giulia, D.L.; Simona, S.; Antonio, P.; Giovanni, S. Voice in Parkinson’s Disease: A Machine Learning Study. Front. Neurol. 2022, 13, 831428. [Google Scholar]
- Sayed, M.A.; Tayaba, M.; Islam, M.T.; Islam, M.E.U.; Pavel, M.A.; Mia, M.A.; Ayon, E.H.; Ghosh, N.B.P. Parkinson’s Disease Detection through Vocal Biomarkers and Advanced Machine Learning Algorithms. J. Comput. Sci. Technol. Stud. 2023, 5, 142–149. [Google Scholar] [CrossRef]
- Giovanni, C.; Cesarini, V.; Leo, P.D.; Amato, F.; Suppa, A.; Asci, F.; Pisani, A.; Calculli, A.; Saggio, G. Artificial Intelligence-Based Voice Assessment of Patients with Parkinson’s Disease Off and On Treatment: Machine vs. Deep-Learning Comparison. Sensors 2023, 23, 2293. [Google Scholar] [CrossRef]
- Orozco-Arroyave, J.; Arias-Londono, J.; Vargas-Bonilla, J.; Gonzalez-Rativa, M.C.; Noeth, E. New Spanish speech corpus database for the analysis of people suffering from Parkinson’s disease. In Proceedings of the Ninth International Conference on Language Resources and Evaluation (LREC’14), Reykjavik, Iceland, 26–31 May 2014; pp. 342–347. [Google Scholar]
- Senjuti, R.; Hasan, M.; Sarkar, A.K.; Khan, F. Classification of Parkinson’s Disease Using Speech Signal With Machine Learning and Deep Learning Approaches. Eur. J. Electr. Eng. Comput. Sci. 2023, 7, 20–27. [Google Scholar]
- Cesare, M.D.D.; Perpetuini, D.; Cardone, D.; Merla, A. Machine Learning-Assisted Speech Analysis for Early Detection of Parkinson’s Disease: A Study on Speaker Diarization and Classification Techniques. Sensors 2024, 24, 1499. [Google Scholar] [CrossRef]
- Salman, A.J.M.K.; Stamatescu, G. Daily Monitoring of Speech Impairment for Early Parkinson’s Disease Detection. In Proceedings of the 2023 IEEE 12th International Conference on Intelligent Data Acquisition and Advanced Computing Systems: Technology and Applications (IDAACS), Dortmund, Germany, 7–9 September 2023; Volume 1, pp. 1049–1053. [Google Scholar]
- Naanoue, J.; Ayoub, R.; Sayyadi, F.E.; Hamawy, L.; Hage-Diab, A.; Sbeity, F. Parkinson’s disease detection from speech analysis using deep learning. In Proceedings of the 2023 Seventh International Conference on Advances in Biomedical Engineering (ICABME), Beirut, Lebanon, 12–13 October 2023; pp. 102–105. [Google Scholar]
- Kumar, S.A.; Sasikala, S.; Arthiya, K.B.; Sathika, J.; Karishma, V. Parkinson’s Speech Detection Using YAMNet. In Proceedings of the 2023 2nd International Conference on Advancements in Electrical, Electronics, Communication, Computing and Automation (ICAECA), Coimbatore, India, 16–17 June 2023; pp. 1–5. [Google Scholar]
- La Quatra, M.; Turco, M.F.; Svendsen, T.; Salvi, G.; Orozco-Arroyave, J.R.; Siniscalchi, S.M. Exploiting Foundation Models and Speech Enhancement for Parkinson’s Disease Detection from Speech in Real-World Operative Conditions. In Proceedings of the Interspeech 2024, Kos, Greece, 1–5 September 2024; pp. 1405–1409. [Google Scholar]
- Klempir, O.; Krupicka, R. Analyzing Wav2Vec 1.0 Embeddings for Cross-Database Parkinson’s Disease Detection and Speech Features Extraction. Sensors 2024, 24, 5520. [Google Scholar] [CrossRef]
- Amirov, A.; Castegnaro, A.; Rudzka, K.; Burgess, N.; Chan, D.; Pan, X. Exploring Augmented Reality as a Tool for Early Detection of Alzheimer’s Disease. In Proceedings of the 2024 IEEE International Conference on Serious Games and Applications for Health (SeGAH), Funchal, Portugal, 7–9 August 2024. [Google Scholar]
- Balestrino, R.; Schapira, A. Parkinson’s Disease: An Updated Overview. Eur. J. Neurol. 2020, 27, 27–42. [Google Scholar] [CrossRef]
- Koop, M.M.; Rosenfeldt, A.B.; Johnston, J.D.; Streicher, M.C.; Qu, J.; Alberts, J.L. The HoloLens Augmented Reality System Provides Valid Measures of Gait Performance in Healthy Adults. IEEE Trans.-Hum.-Mach. Syst. 2020, 50, 584–592. [Google Scholar] [CrossRef]
- Thomos, M.; Charisis, V.; Hadjidimitriou, S.; Iakovakis, D.; Bostantzopoulou, S.; Hadjileontiadis, L. Holoprognosis: Augmented Reality Exercises for Early-Stage Parkinson’s Patients. In Universal Access in Human–Computer Interaction; Springer: Berlin/Heidelberg, Germany, 2020; pp. 417–430. [Google Scholar]
- Favaro, A.; Moro-Velázquez, L.; Butala, A.; Motley, C.; Cao, T.; Stevens, R.D.; Villalba, J.; Dehak, N. Multilingual evaluation of interpretable biomarkers to represent language and speech patterns in Parkinson’s disease. Front. Neurol. 2023, 14, 1142642. [Google Scholar] [CrossRef]
- Microsoft. Microsoft HoloLens 2. 2024. Available online: https://www.microsoft.com/pl-pl/hololens (accessed on 15 December 2024).
- Kipman, A.; Pollefeys, M. Global Lecture 2019—HoloLens 2: Unpacked, 2019. Available online: https://mspoweruser.com/microsofts-alex-kipman-explains-the-groundbreaking-technology-behind-the-hololens-2/ (accessed on 5 April 2025).
- Goetz, C.G.; Tilley, B.; Shaftman, S.R.; Stebbins, G.T.; Fahn, S.; Martinez-Martin, P.; Poewe, W.; Sampaio, C.; Stern, M.B.; Dodel, R.; et al. Movement Disorder Society-Sponsored Revision of the Unified Parkinson’s Disease Rating Scale (MDS-UPDRS). Mov. Disord. 2008, 23, 2129–2170. [Google Scholar] [CrossRef] [PubMed]
- The Movement Disorder Society. MDS-UPDRS. 2008. Available online: https://www.movementdisorders.org/MDS-Files1/PDFs/Rating-Scales/MDS-UPDRS_English_FINAL.pdf (accessed on 20 December 2024).
- Jacobson, B.H.; Johnson, A.; Grywalski, C.; Silbergleit, A.; Jacobson, G.; Benninger, M.S. The Voice Handicap Index (VHI): Development and Validation. Am. J.-Speech-Lang. Pathol. 1997, 6, 66–70. [Google Scholar] [CrossRef]
- Niedbala-Bogusz, Z.; Kuzniarska, A.; Block, P.; Domanska, M.; Woznicka, E.; Politanski, P.; Sliwinska-Kowalska, M. Zastosowanie wskaznika niepelnosprawnosci glosowej (Voice Handicap Index—VHI) w ocenie efektywnosci terapii głosu u nauczycieli. Medycyna Pracy 2007, 58, 1–9. [Google Scholar]
- Epstein, R.; Hirani, S.P.; Stygall, J.; Newman, S.P. How do individuals with voice disorders? Introducing the Voice Disability Coping Questionnaire. J. Voice 2009, 23, 209–217. [Google Scholar] [CrossRef]
- Morawska, J.; Politanski, P.; Sliwinska-Kowalska, M.; Niebudek-Bogusz, E. Validation of the Polish Version of Voice Disability Coping Questionnaire (PL-VDCQ). Otolaryngol.-Prz. Klin. 2019, 18, 101–109. [Google Scholar]
- Nasreddine, Z.S.; Phillips, N.A.; Bedirian, V.; Charbonneau, S.; Whitehead, V.; Collin, I.; Cummings, J.L.; Chertkow, H. The Montreal Cognitive Assessment, MoCA: A brief screening tool for mild cognitive impairment. J. Am. Geriatr. Soc. 2005, 53, 695–699. [Google Scholar] [CrossRef]
- McEwen, B. Administering the MoCA: What Does It Mean and Why Is It Important? Presentation, Riverside University Medical Center, 2023. Available online: https://rivcodpss.org/sites/g/files/aldnop276/files/2023-04/MoCA%20Presentation.FULL%20PAGE.pdf (accessed on 5 April 2025).
- Sainburg, T. Tinsamb/Noisereduce: v1.0.0. 2019. Available online: https://zenodo.org/records/3243139 (accessed on 20 December 2024).
- Eyben, F.; Wollmer, M.; Schuller, B. openSMILE—The Munich Versatile and Fast Open-Source Audio Feature Extractor. In Proceedings of the 18th ACM International Conference on Multimedia, Florence, Italy, 25–29 October 2010; pp. 1459–1462. [Google Scholar]
- Jadoul, Y.; Thompson, B.; de Boer, B. Introducing Parselmouth: A Python interface to Praat. J. Phon. 2018, 71, 1–15. [Google Scholar] [CrossRef]
- Boersma, P.; Weenink, D. Praat: Doing Phonetics by Computer [Computer Program], 2021. Version 6.1.38. Available online: http://www.praat.org/ (accessed on 20 December 2024).
- Tadeusiewicz, R. Sygnal Mowy; Wydawnictwo Komunikacji i Lacznosci: Sulejówek, Poland, 1988. [Google Scholar]
- Cleveland Clinic. Tips for Improving Communication in People with Parkinson’s Disease, 2020.
- Wiseman, J. Python Interface to the WebRTC Voice Activity Detector, 2021. Available online: https://github.com/wiseman/py-webrtcvad (accessed on 20 December 2024).
- Goberman, A.M.; Coelho, C.A.; Robb, M.P. Prosodic characteristics of Parkinsonian speech: The effect of levodopa-based medication. J. Med.-Speech-Lang. Pathol. 2005, 13, 51–68. [Google Scholar]
- Microsoft. Microsoft—Azure Speech SDK. 2024. Available online: https://learn.microsoft.com/en-us/azure/ai-services/speech-service/speech-sdk (accessed on 20 December 2024).
- spaCy. spaCy—Industrial-Strength Natural Language Processing in Python. 2024. Available online: https://spacy.io/ (accessed on 20 December 2024).
- Citizenlab. Citizenlab/Twitter-Xlm-Roberta-Base-Sentiment-Finetuned. 2022. Available online: https://huggingface.co/citizenlab/twitter-xlm-roberta-base-sentiment-finetuned (accessed on 20 December 2024).
- Facebook. Facebook/Hubert-Base-ls960v. 2024. Available online: https://huggingface.co/facebook/hubert-base-ls960 (accessed on 20 December 2024).
- Microsoft. Microsoft/Wavlm-Base. 2021. Available online: https://huggingface.co/microsoft/wavlm-base (accessed on 20 December 2024).
- Meta. Wav2vec 2.0: Learning the Structure of Speech from Raw Audio. 2020. Available online: https://huggingface.co/docs/transformers/en/model_doc/wav2vec2 (accessed on 20 December 2024).
- Putzer, M.; Barry, W.J. Saarbruecken Voice Database. 2007. Available online: https://uni-saarland.academia.edu/ManfredP%C3%BCtzer (accessed on 20 December 2024).
- Sawilowsky, S. New Effect Size Rules of Thumb. J. Mod. Appl. Stat. Methods 2009, 8, 597–599. [Google Scholar] [CrossRef]


| Low-Level Descriptors | Group |
|---|---|
| Energy | |
| Sum of auditory spectrum | Prosodic |
| Sum of RASTA-filtered auditory spectrum | Prosodic |
| RMS Energy | Prosodic |
| Zero Crossing Rate | Prosodic |
| F0 (Pitch) | |
| Fundamental frequency | Prosodic |
| Probability of Voicing | Voice Quality |
| Voicing Quality | |
| Jitter (Local) | Voice Quality |
| Jitter (Delta) | Voice Quality |
| Shimmer (Local) | Voice Quality |
| RASTA and Spectral Features | |
| RASTA-style filtered auditory spectral bands [1–26] | Spectral |
| Spectral Flux | Spectral |
| Spectral Entropy | Spectral |
| Spectral Variance | Spectral |
| Spectral Skewness | Spectral |
| Spectral Kurtosis | Spectral |
| Spectral Slope | Spectral |
| Spectral Roll-Off (0.25, 0.50, 0.75, 0.9) | Spectral |
| Spectral Energy 25–650 Hz | Spectral |
| Spectral Energy 1–4 kHz | Spectral |
| MFCC | |
| Mel-Frequency Cepstrum Coefficients | Cepstral |
| Task | No. of Significant Features | |
|---|---|---|
| Monologue AC | DI | 122/399 |
| AQ | 182/399 | |
| RS | 257/399 | |
| Recurrent | 113 | |
| Monologue NLP | DI | 3/31 |
| AQ | 8/30 | |
| RS | 8/30 | |
| Recurrent | 1 | |
| V | A | 73/425 |
| E | 64/425 | |
| I | 68/425 | |
| O | 85/425 | |
| U | 40/425 | |
| Recurrent | 9 | |
| DDK | pataka | 159/390 |
| petaka | 172/390 | |
| pakata | 219/390 | |
| Recurrent | 134 | |
| Feature | Test Statistic U | p Value | Cohen’s d | Effect Size |
|---|---|---|---|---|
| pcm_fftMag_spectralKurtosis_sma_mean | 262.0 | 0.1016 | −0.54 | medium |
| shimmerLocal_sma_std | 630.0 | <0.0001 | 1.58 | very large |
| pcm_fftMag_spectralVariance_sma_std | 412.0 | 0.3451 | 0.29 | small |
| mfcc_sma[10]_std | 220.0 | 0.0180 | −0.76 | medium |
| audSpec_Rfilt_sma[0]_median | 595.0 | <0.0001 | 1.26 | very large |
| audSpec_Rfilt_sma[0]_quantile75 | 624.0 | <0.0001 | 1.52 | very large |
| audSpec_Rfilt_sma[1]_quantile75 | 606.0 | <0.0001 | 1.36 | very large |
| audSpec_Rfilt_sma[5]_quantile75 | 573.0 | 0.0002 | 1.13 | large |
| audSpec_Rfilt_sma[6]_quantile75 | 586.0 | 0.0001 | 1.17 | large |
| audSpec_Rfilt_sma[9]_quantile75 | 569.0 | 0.0003 | 1.13 | large |
| Feature | Test Statistic U | p Value | Cohen’s d | Effect Size |
|---|---|---|---|---|
| silences_number_ratio | 135.0 | 0.0001 | −1.08 | large |
| audSpec_Rfilt_sma[5]_mean | 672.0 | <0.0001 | 1.64 | very large |
| pcm_fftMag_spectralRollOff25.0_sma_mean | 572.0 | 0.0014 | 0.79 | medium |
| mfcc_sma[11]_mean | 416.0 | 0.5350 | 0.24 | small |
| shimmerLocal_sma_std | 699.0 | <0.0001 | 1.91 | very large |
| audSpec_Rfilt_sma[4]_quantile25 | 118.0 | <0.0001 | −1.18 | large |
| audSpec_Rfilt_sma[13]_quantile25 | 205.0 | 0.0043 | −0.98 | large |
| mfcc_sma[11]_quantile25 | 305.0 | 0.2304 | −0.28 | small |
| CCONJ_POS | 558.5 | 0.0026 | 0.72 | medium |
| DET_POS | 583.0 | 0.0006 | 0.89 | large |
| Feature | Test Statistic U | p Value | Cohen’s d | Effect Size |
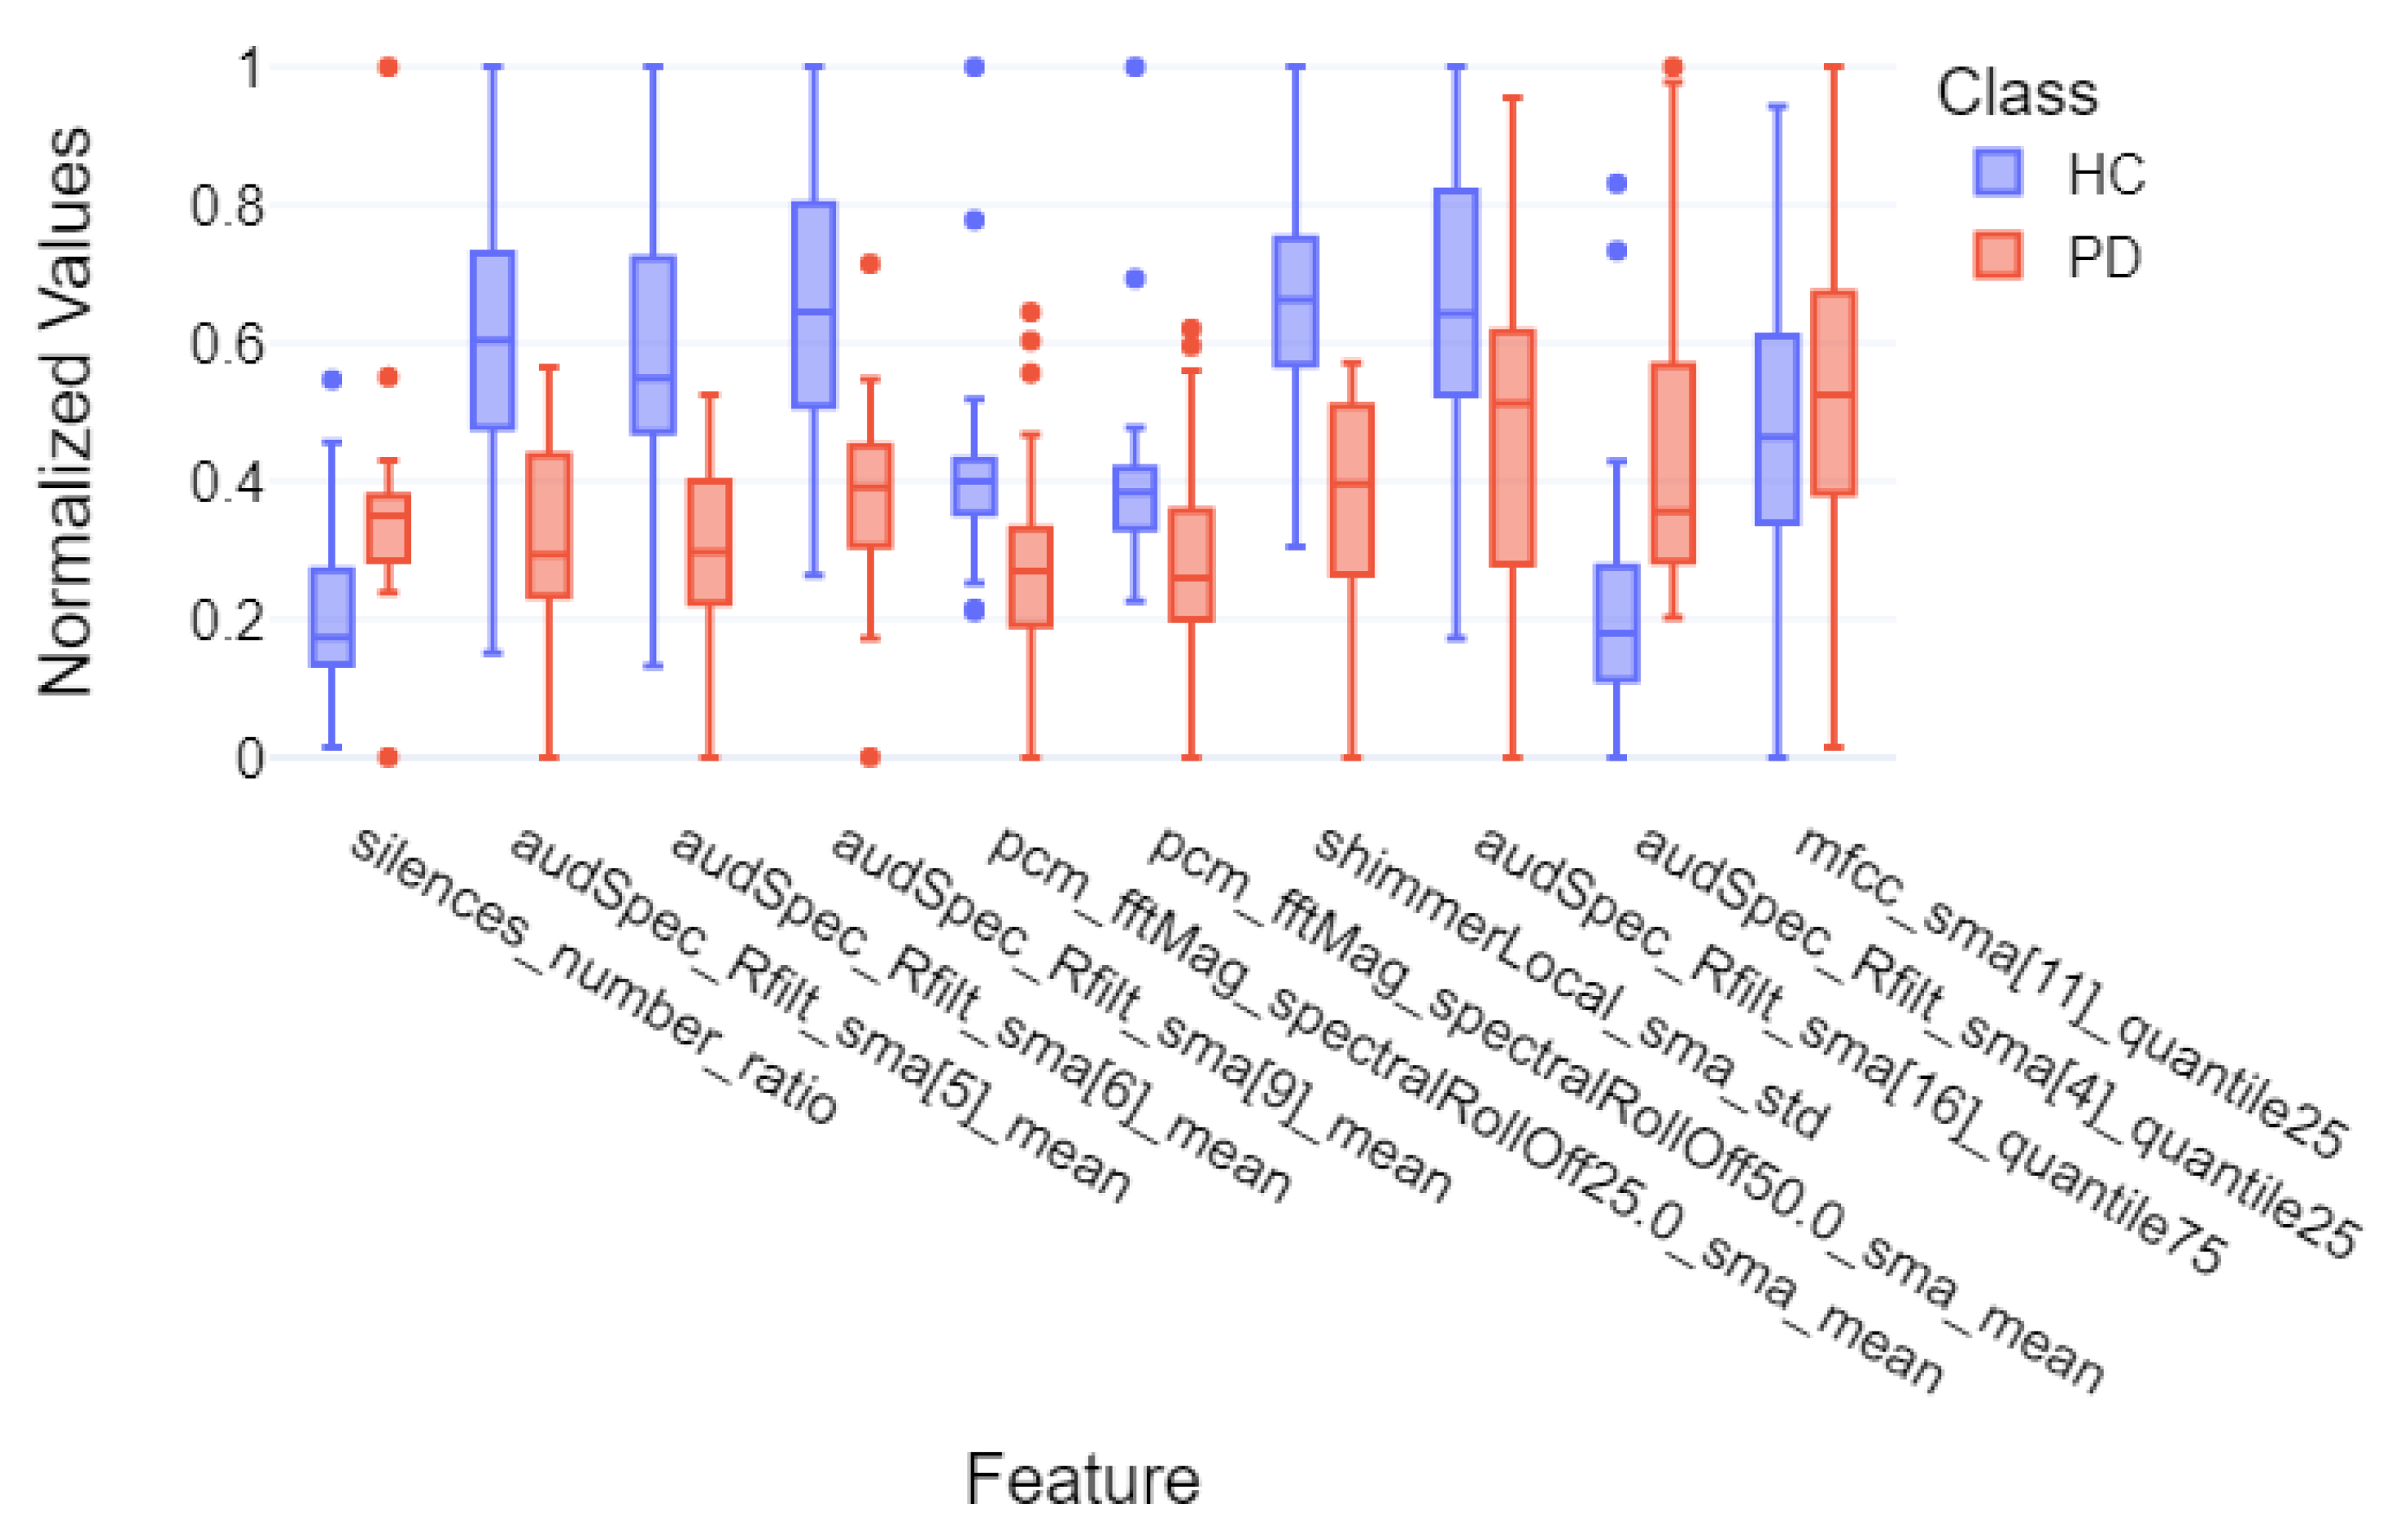
|---|---|---|---|---|
| silences_number_ratio | 135.0 | 0.0001 | −1.07 | large |
| audSpec_Rfilt_sma[5]_mean | 672.0 | <0.0001 | 1.64 | very large |
| audSpec_Rfilt_sma[6]_mean | 670.0 | <0.0001 | 1.59 | very large |
| audSpec_Rfilt_sma[9]_mean | 651.0 | <0.0001 | 1.52 | very large |
| pcm_fftMag_spectralRollOff25.0_sma_mean | 572.0 | 0.0014 | 0.79 | medium |
| pcm_fftMag_spectralRollOff50.0_sma_mean | 558.0 | 0.0030 | 0.67 | medium |
| shimmerLocal_sma_std | 699.0 | <0.0001 | 1.91 | very large |
| audSpec_Rfilt_sma_quantile75 | 540.0 | 0.0075 | 0.84 | large |
| audSpec_Rfilt_sma[4]_quantile25 | 118.0 | <0.0001 | −1.18 | large |
| mfcc_sma[11]_quantile25 | 305.0 | 0.2304 | −0.28 | small |
| Task | 5F Recall | 5F Precision | 5F F1-Score |
|---|---|---|---|
| DI AC | 0.93 ± 0.13 | 0.88 ± 0.15 | 0.89 ± 0.09 |
| DI NLP | 0.65 ± 0.08 | 0.81 ± 0.24 | 0.71 ± 0.14 |
| DI all | 0.93 ± 0.13 | 0.88 ± 0.15 | 0.89 ± 0.09 |
| AQ AC | 0.90 ± 0.12 | 0.84 ± 0.13 | 0.85 ± 0.03 |
| AQ NLP | 0.47 ± 0.07 | 0.68 ± 0.28 | 0.54 ± 0.13 |
| AQ all | 0.90 ± 0.12 | 0.79 ± 0.11 | 0.83 ± 0.05 |
| RS AC | 0.95 ± 0.10 | 0.86 ± 0.13 | 0.89 ± 0.07 |
| RS NLP | 0.67 ± 0.10 | 0.95 ± 0.10 | 0.78 ± 0.07 |
| RS all | 0.91 ± 0.11 | 0.92 ± 0.10 | 0.90 ± 0.05 |
| V A | 0.75 ± 0.22 | 0.89 ± 0.14 | 0.80 ± 0.16 |
| V E | 0.70 ± 0.19 | 0.90 ± 0.12 | 0.77 ± 0.12 |
| V I | 0.76 ± 0.10 | 0.85 ± 0.12 | 0.77 ± 0.06 |
| V O | 0.80 ± 0.19 | 0.88 ± 0.16 | 0.82 ± 0.13 |
| V U | 0.55 ± 0.19 | 0.92 ± 0.16 | 0.65 ± 0.15 |
| V all | 0.80 ± 0.19 | 0.91 ± 0.14 | 0.83 ± 0.14 |
| DDK pataka | 0.83 ± 0.24 | 0.96 ± 0.08 | 0.86 ± 0.16 |
| DDK petaka | 0.73 ± 0.25 | 0.96 ± 0.08 | 0.80 ± 0.16 |
| DDK pakata | 0.77 ± 0.31 | 0.84 ± 0.13 | 0.76 ± 0.23 |
| DDK all | 0.88 ± 0.24 | 0.83 ± 0.11 | 0.85 ± 0.17 |
| Overall | 0.80 ± 0.27 | 0.95 ± 0.10 | 0.83 ± 0.18 |
| HuBERT-Base Results | |||
|---|---|---|---|
| Task | 5F Recall | 5F Precision | 5F F1-Score |
| DI | 0.71 ± 0.06 | 0.73 ± 0.12 | 0.72 ± 0.11 |
| AQ | 0.85 ± 0.07 | 0.80 ± 0.12 | 0.80 ± 0.03 |
| RS | 0.85 ± 0.07 | 0.80 ± 0.12 | 0.80 ± 0.03 |
| V | 0.82 ± 0.08 | 0.80 ± 0.14 | 0.79 ± 0.06 |
| DDK | 0.92 ± 0.08 | 0.98 ± 0.03 | 0.94 ± 0.04 |
| all | 0.76 ± 0.21 | 0.86 ± 0.19 | 0.75 ± 0.12 |
| WavLM-Base Results | |||
| Task | 5F Recall | 5F Precision | 5F F1-Score |
| DI | 0.80 ± 0.14 | 0.68 ± 0.04 | 0.72 ± 0.08 |
| AQ | 0.86 ± 0.03 | 0.71 ± 0.08 | 0.75 ± 0.05 |
| RS | 0.88 ± 0.07 | 0.72 ± 0.09 | 0.78 ± 0.04 |
| V | 0.76 ± 0.07 | 0.71 ± 0.05 | 0.72 ± 0.03 |
| DDK | 0.89 ± 0.07 | 0.93 ± 0.09 | 0.90 ± 0.06 |
| all | 0.71 ± 0.15 | 0.88 ± 0.19 | 0.69 ± 0.08 |
| wav2vec2-Base Results | |||
| Task | 5F Recall | 5F Precision | 5F F1-Score |
| DI | 0.60 ± 0.20 | 0.73 ± 0.13 | 0.62 ± 0.14 |
| AQ | 0.87 ± 0.04 | 0.77 ± 0.03 | 0.81 ± 0.01 |
| RS | 0.84 ± 0.02 | 0.79 ± 0.01 | 0.80 ± 0.01 |
| V | 0.96 ± 0.09 | 0.64 ± 0.20 | 0.73 ± 0.16 |
| DDK | 0.90 ± 0.11 | 0.94 ± 0.08 | 0.90 ± 0.11 |
| all | 0.65 ± 0.07 | 0.86 ± 0.20 | 0.67 ± 0.07 |
Disclaimer/Publisher’s Note: The statements, opinions and data contained in all publications are solely those of the individual author(s) and contributor(s) and not of MDPI and/or the editor(s). MDPI and/or the editor(s) disclaim responsibility for any injury to people or property resulting from any ideas, methods, instructions or products referred to in the content. |
© 2025 by the authors. Licensee MDPI, Basel, Switzerland. This article is an open access article distributed under the terms and conditions of the Creative Commons Attribution (CC BY) license (https://creativecommons.org/licenses/by/4.0/).
Share and Cite
Dudek, M.; Hemmerling, D.; Kaczmarska, M.; Stepien, J.; Daniol, M.; Wodzinski, M.; Wojcik-Pedziwiatr, M. Analysis of Voice, Speech, and Language Biomarkers of Parkinson’s Disease Collected in a Mixed Reality Setting. Sensors 2025, 25, 2405. https://doi.org/10.3390/s25082405
Dudek M, Hemmerling D, Kaczmarska M, Stepien J, Daniol M, Wodzinski M, Wojcik-Pedziwiatr M. Analysis of Voice, Speech, and Language Biomarkers of Parkinson’s Disease Collected in a Mixed Reality Setting. Sensors. 2025; 25(8):2405. https://doi.org/10.3390/s25082405
Chicago/Turabian StyleDudek, Milosz, Daria Hemmerling, Marta Kaczmarska, Joanna Stepien, Mateusz Daniol, Marek Wodzinski, and Magdalena Wojcik-Pedziwiatr. 2025. "Analysis of Voice, Speech, and Language Biomarkers of Parkinson’s Disease Collected in a Mixed Reality Setting" Sensors 25, no. 8: 2405. https://doi.org/10.3390/s25082405
APA StyleDudek, M., Hemmerling, D., Kaczmarska, M., Stepien, J., Daniol, M., Wodzinski, M., & Wojcik-Pedziwiatr, M. (2025). Analysis of Voice, Speech, and Language Biomarkers of Parkinson’s Disease Collected in a Mixed Reality Setting. Sensors, 25(8), 2405. https://doi.org/10.3390/s25082405