


Thermography in Bike Fitting: A Literature Review

 , ,
, ,  , and
, and 
Abstract
1. Introduction
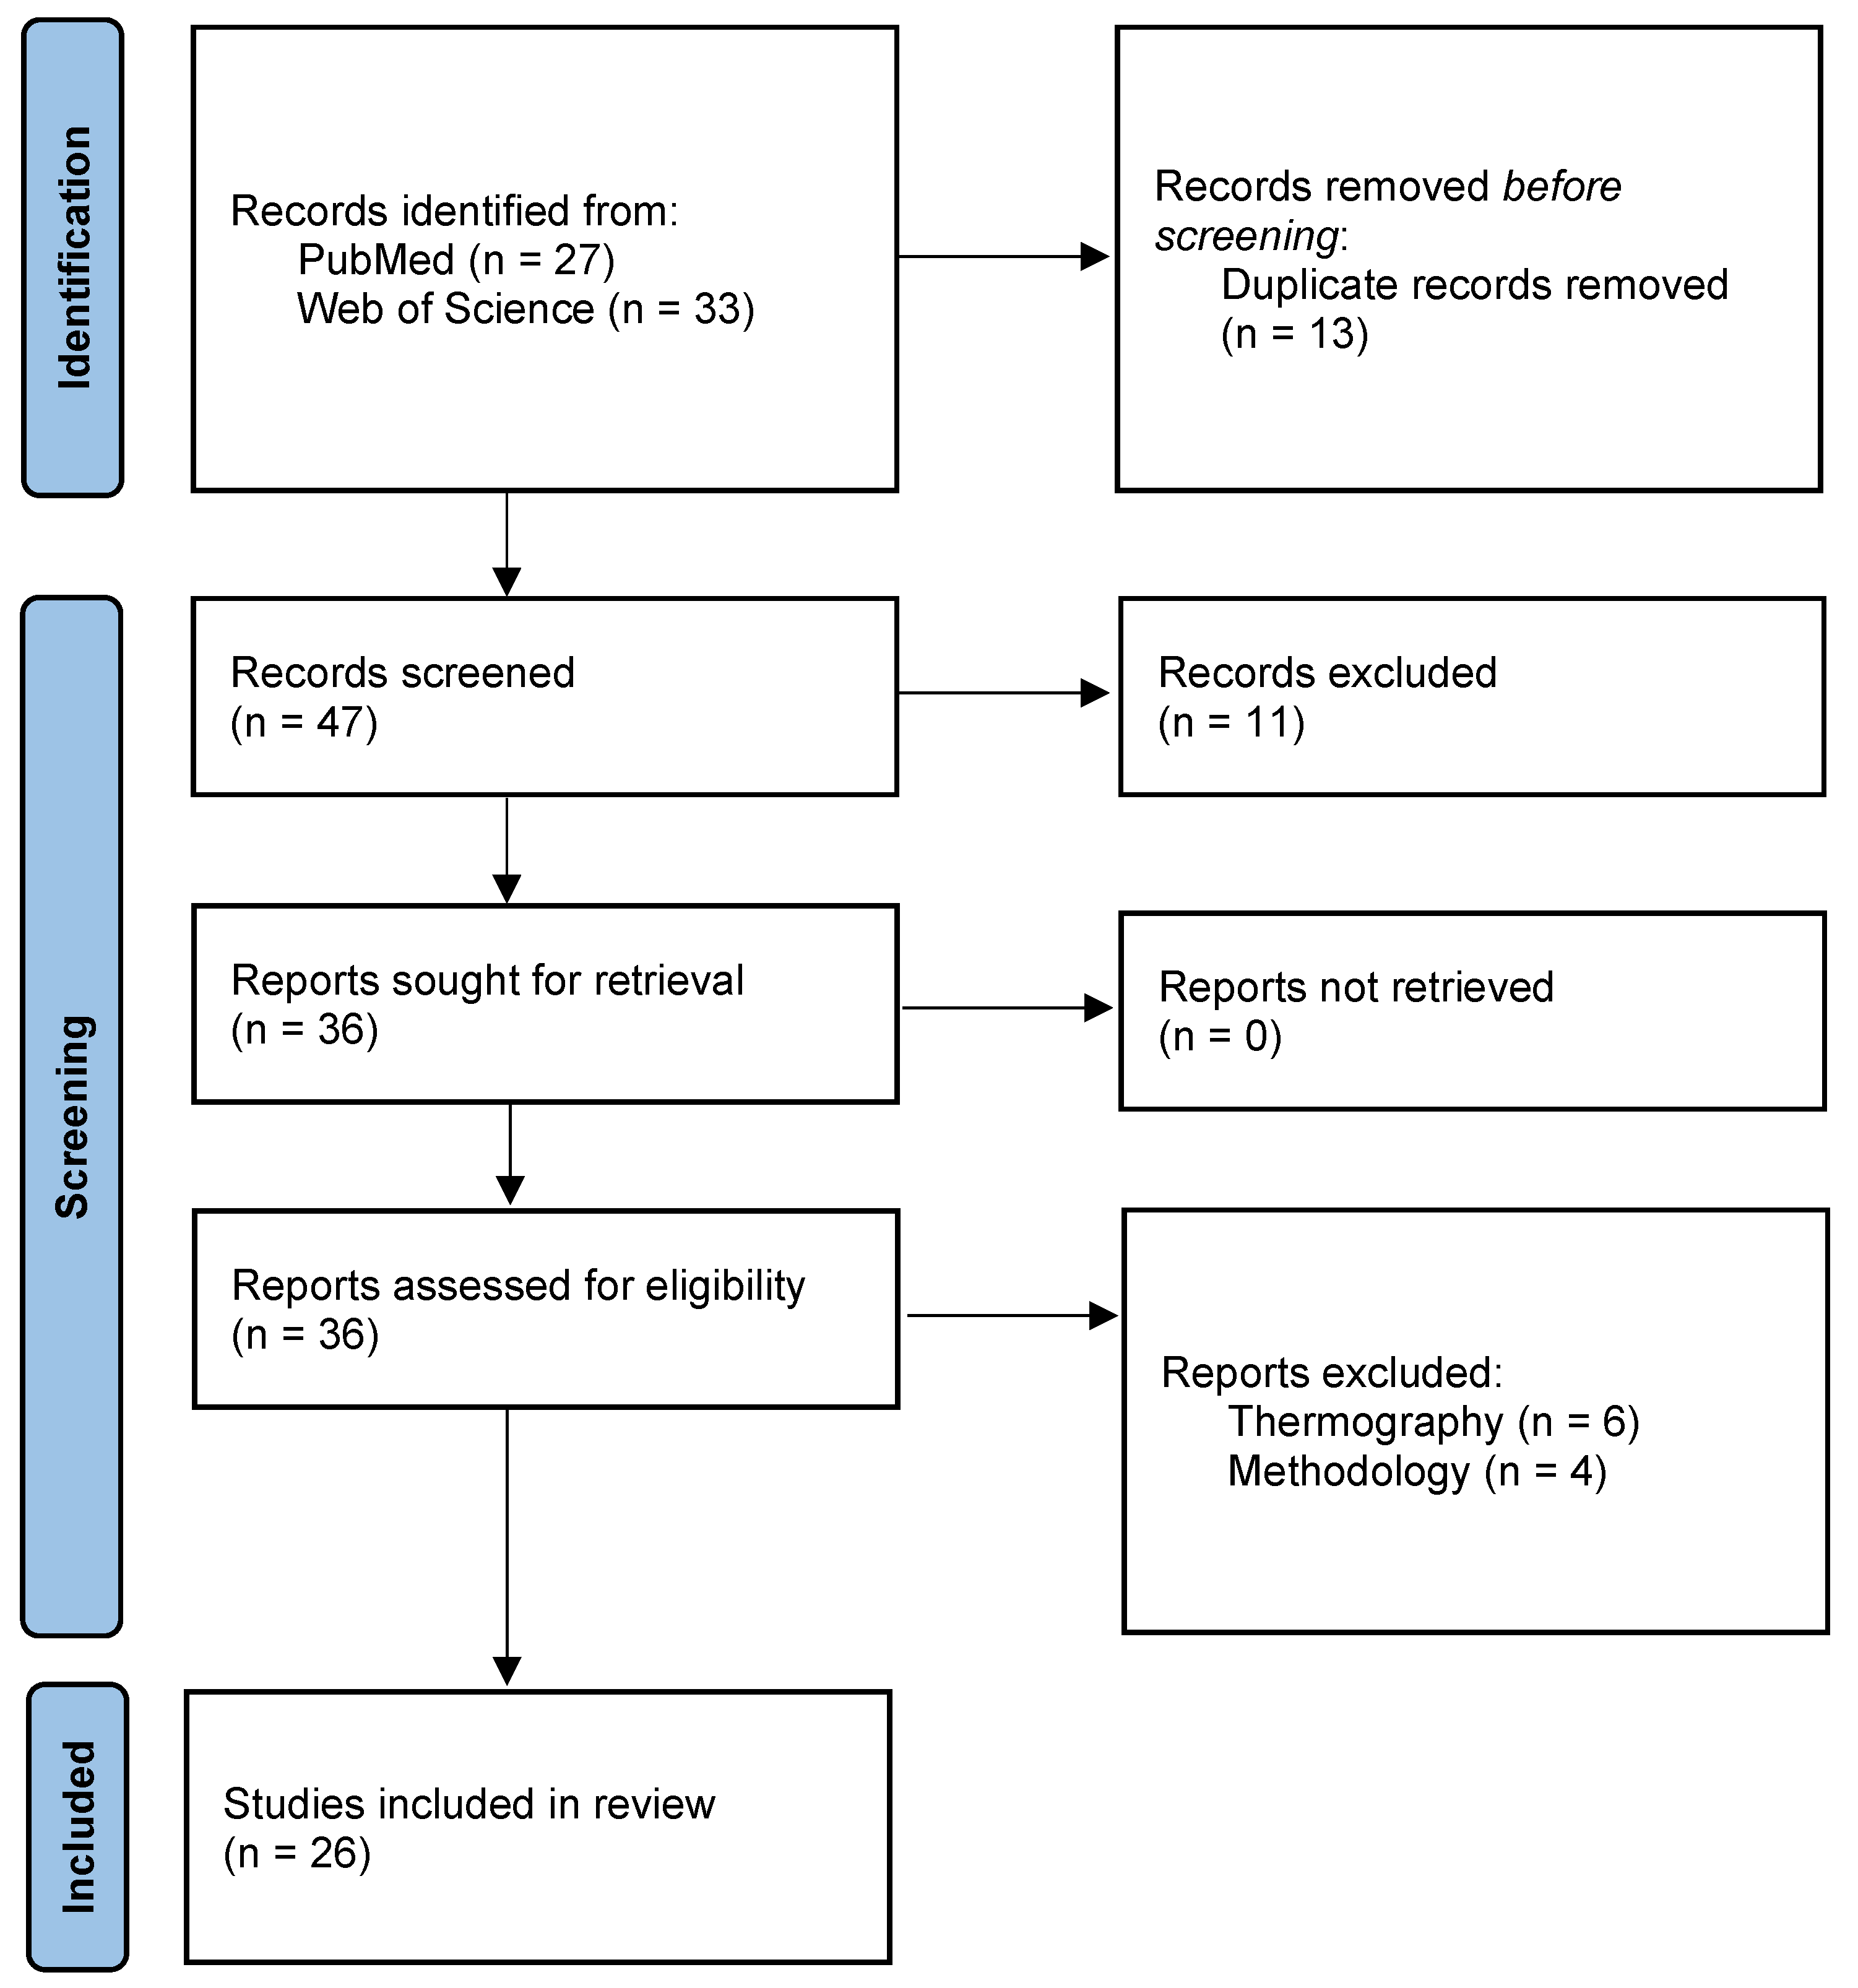
2. Methodology
2.1. Search Strategy and Study Selection
2.2. Inclusion Criteria
2.3. Data Extraction
3. Results
3.1. Measurement Protocol
3.2. Effects on Skin Temperature
3.3. Symmetry Analysis
3.4. Injury and Pressure Point Detection

| Study | Objective | Exercise Protocol | Measurement Procedure | ROI | Subjects | Camera and Position |
|---|---|---|---|---|---|---|
| Vieira et al. (2020) [13] | Analyze and compare skin temperature during resistance training in men and women; monitor thermal recovery | 3 sets of 12 repetitions at 70–80%, 1 RM for lat pulldowns, leg presses, and biceps arm curl exercises | Interior and posterior body view at rest, 20 min and 24 h after training | Brachial biceps, quadriceps, and upper back | 8 male and 8 female adults (24.56 ± 3.22 yrs) (healthy, no smoking, allergies, lotion, oils, creams before exercise) | FLIR T420 (320 × 240 pixels) |
| Szurko et al. (2022) [14] | Create a thermal map of the body surface in trained individuals | 30 min adaptation, 3 min on rowing ergometer set at 90% capacity | Before and immediately after exercise, then 10 min after, 20 min after, 40 min after and 50 min after | 12 ROIs: right wrist elbow flexor, left wrist flexor, biceps, triceps, pectoral muscles, anterior dentate muscles, right rectus muscle, trapezius muscles, gastrocnemius muscles, quadriceps, deltoid muscles, latissimus dorsi muscles | Six professional male adults (24–30 yrs) (no alcohol, stimulants, sauna, etc., before exercise) | FLIR T640 (640 × 480 pixels, distance of 3 m) |
| Bandeira et al. (2012) [15] | Evaluate the potential of thermography for diagnosing injuries caused by training | 15 min adaptation, 2 groups: control group (low-intensity run 50–60% max heart rate), experimental group (80% heart rate squats, leg extension) | Image of quadriceps before training and another image taken 24 h after the session | Quadriceps | 18 male football players (age: 15–17 yrs) | FLIR A-325 (320 × 240 pixels) |
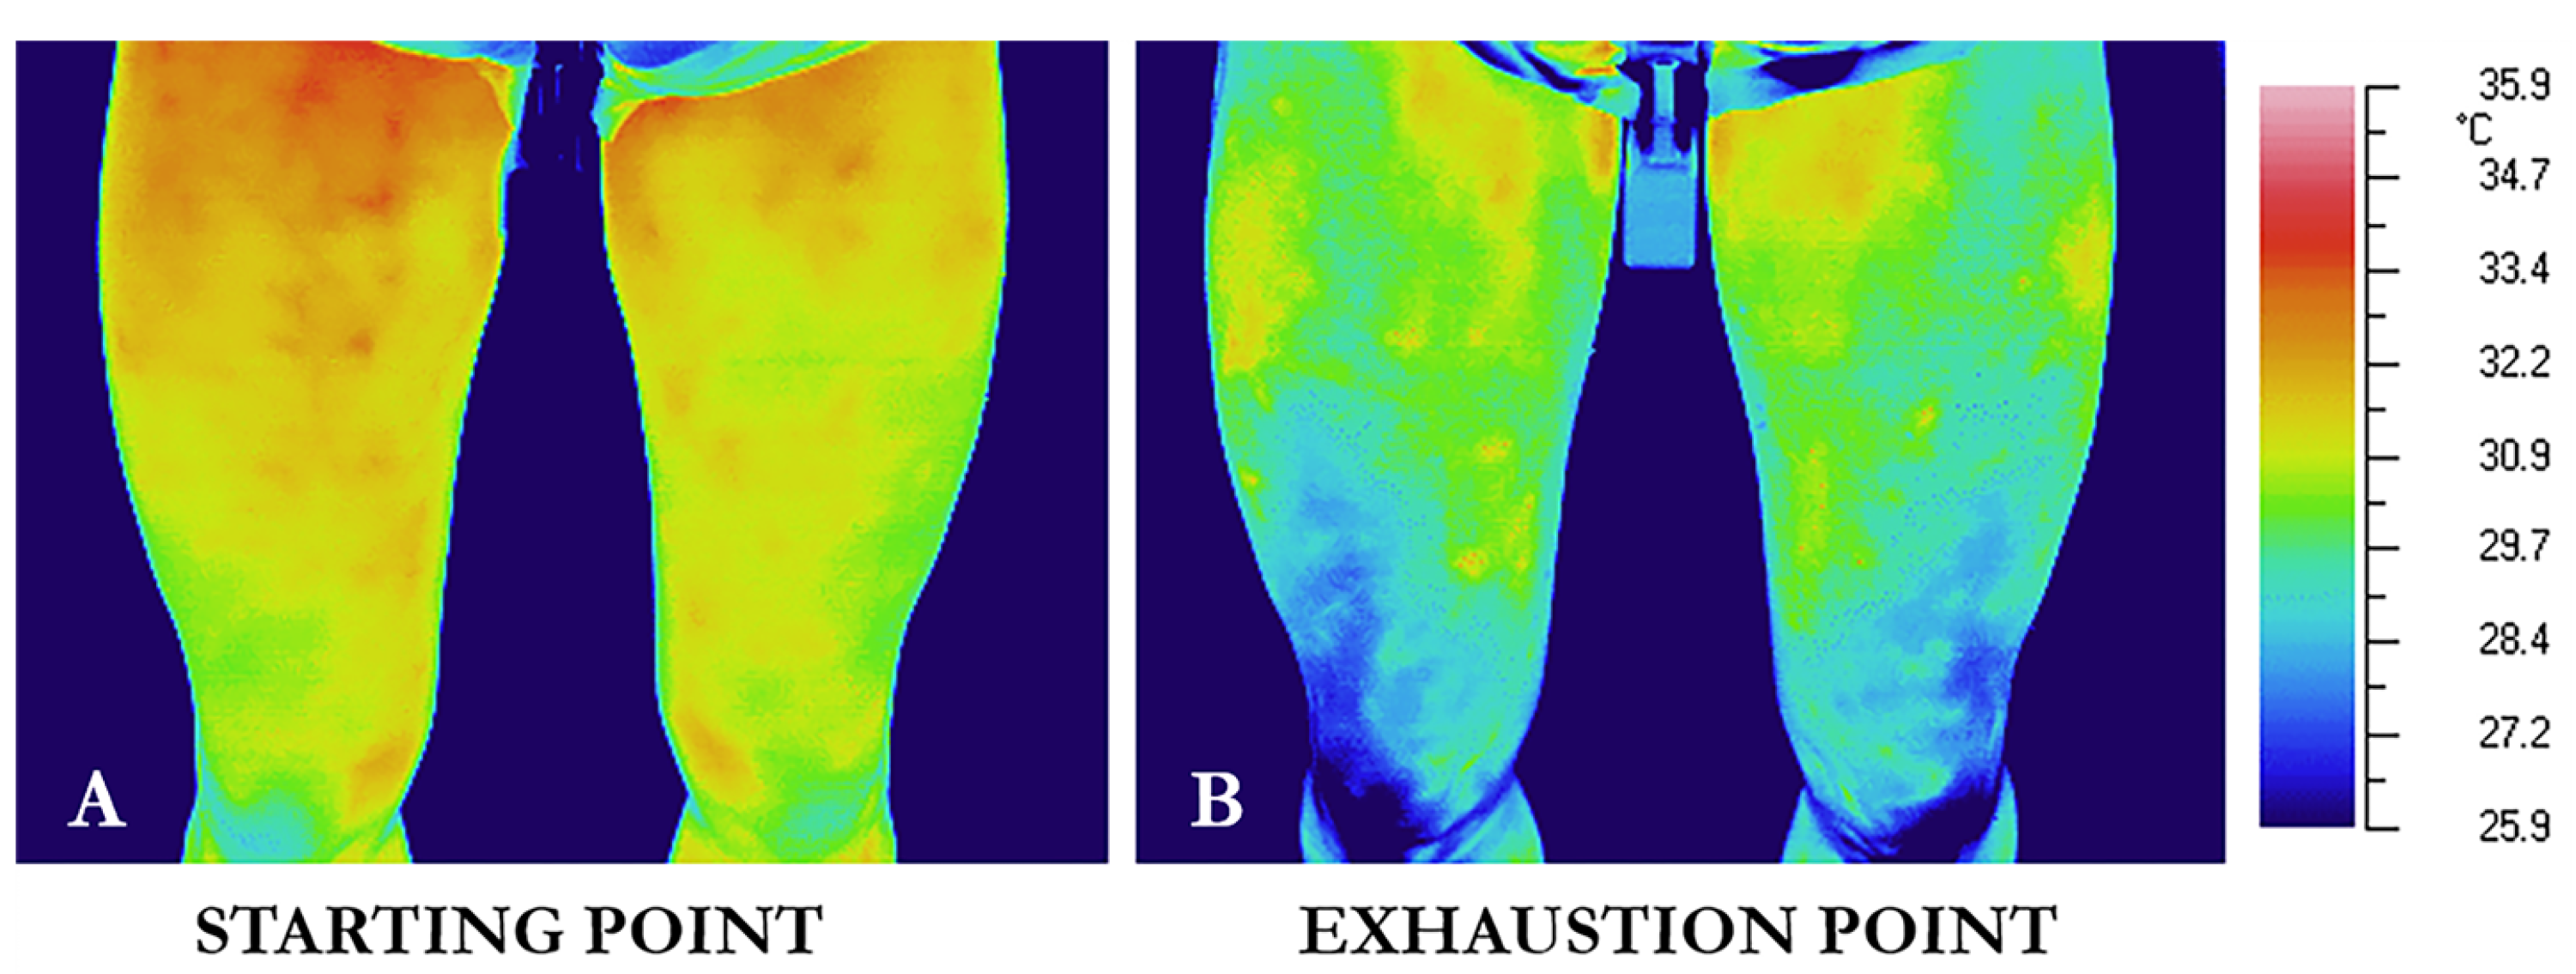
| Trecroci et al. (2017) [16] | Examine the relationship between kinetic and thermal asymmetry during exercise | Adaptation to room temperature, 10 min warm-up at 100 W, increase 25 W every min until exhaustion | One image every 10 s, 1 before warm-up, 1 after warm-up, 1 at exhaustion point, and 2 after exercise (3 and 6 min after) | Independent pedal forces, peak crank torque, overall torque, skin temperature of quadriceps | 10 male elite cyclists | AVIO TVS-700 (320 × 240 pixels, placed at a fixed height of 118 cm, background at constant temperature) |
| Quesada et al. (2016) [10] | Investigate how cycling postures, linked to knee angles, affect skin temperature, the reliability of thermal measurements in varied body regions | 10 min adaptation; 3 tests of 45 min cycling at 50% peak power, each test in a different knee flexion 20, 30, 40° (when pedal crank at 180); one pre-test: 5 min warm-up at 50 W then 25 W added every min until exhaustion; main test: 3 min warm-up at 50 W, 45 min at 50% | Before, immediately after, and 10 min after the test | 16 ROIs: chest, abdomen, upper back, lower back, vastus lateralis, rectus femoris, abductor, vastus medialis, biceps femoris, semitendinosus, knee, popliteal, tibialis anterior, gastrocnemius, ankle anterior, and Achilles | 16 cyclists at club level (No smoking, no alcohol 12 h, no high intensity 24 h, and no lotions/creams 2 h before exercise) | FLIR E-60 (320 × 240 pixels, NETD < 0.05 °C) |
| Cholewka et al. (2015) [17] | Assess efficiency levels during endurance tests by comparing temperature parameters with data | 30–40 min adaptation to room temperature; start at 50 W and every 3 min +30 W until exhaustion | Before, after, and every 3 min interval | Face, chest, arms, back, calf | 12 healthy male cyclists | FLIR E-60 (320 × 240 pixels) |
| Ludwig et al. (2016) [18] | Assess temperature distribution on thighs during incremental exercise | 10 min adaptation, 10 min warm-up at 100 W, then +25 W every min until exhaustion | Before the test, after warm-up, and after the incremental test (immediately, 3 min after, and 6 min after) | Thighs | 7 male cyclists (no exercise 24 h before) | AVIO TVS-700 (320 × 240 pixels, set perpendicular to ROI) |
| Dindorf et al. (2022) [12] | Study the impact of asymmetric muscle fatigue on the skin temperature of abdominal/back muscles | Adaptation to room temperature; side bends on Roman chair in sets of 20 repetitions | Images were taken before, immediately after, and after 24 h | Side back and abdomen | 41 subjects (22 male, 19 female; age: 22.63 ± 3.91 yrs; height: 173.36 ± 9.95 cm; weight: 71.89 ± 12.97 kg) | NEC AVIO TVS-200 (320 × 240 pixels) |
| Chudecka et al. (2015) [20] | Compare temperature changes of rowers and handball players after exercise | 20 min warm-up, 2000 m rowing, and 90 min handball training | Two series: 20 min before training and immediately after training | Front and rear surfaces of the upper limbs (arm and forearm), chest, front and rear surfaces of thighs, the back | 2 groups: 18 male scullers, average age of 20.77 yrs, and handball players (no specific information) | FLIR ThermaCAM SC500 (256 × 256 pixels, with a distance of 3 m; conditions: 25 °C and 60% humidity) |
| Formenti et al. (2012) [22] | Examine differences in skin temperature changes after exercise between trained and untrained individuals | 15 min adaptation, standing heel raises for 2 min | Before exercise (1 min), during exercise (2 min), and after exercise (7 min) | Lower limbs (calves, Achilles tendon) | 7 sedentary female subjects (no alcohol and caffeine 4 h before exercise) | AVIO TVS-700 (320 × 240 pixels) |
| Bayrak et al. (2024) [23] | Determine the level of participation in the training of an athlete with sartorius muscle injury using IRT | 5 min adaptation, then cycling at 30–40% intensity because he was in pain | Daily before and after exercise | Sartorius muscle | 1 professional football player (23 yrs, 185 cm, 81 kg) | Not specified |
| Straburnzyńska-Lupa et al. (2022) [25] | Assess elite rowers’ skin temperature; examine the link between resting skin temperature and muscle peak torque | 15 min adaptation, rowing (not specified) | Before, immediately after, and 15 min after exercise | Back and front body A-pose | 10 professional male sweep rowers (no caffeine/coffee, no alcohol, no lotion/oil before exercise) | FLIR SC640 (640 × 380 pixels, height of 1 m, distance of 6 m) |
| Duc et al. (2015) [29] | Analyze the relationship between body/muscle efficiency and skin thermograms during graded cycling | Start at 100 W and every 4 min +40 W until exhaustion | Taken throughout exercise from 5 min before to 5 min after | Right calf, left quadriceps | 7 young, healthy male competitive cyclists (no smoking, no alcohol, no coffee/caffeine 3 h, no intense exercise 24 h, and no cream, lotion or gel 2 h before exercise) | FLIR SC1000 (256 × 256 pixels, height of 0.5 m and distance of 1.5 m at the right side of the vehicle) |
| Ludwig et al. (2013) [30] | Compare methods for analyzing thermographic images | 15 min adaptation, staying in an anti-gravitational static position | 3 images of the calves, 1 every 20 s | Calves | 33 subjects (male/female) (healthy, no drugs, alcohol, caffeine for 4 h before exercise, no body hair) | AVIO TVS-700 (320 × 240 pixels) |
| Marins et al. (2014) [31] | Determine acclimation time needed to achieve thermal balance in young individuals at rest | Standing for 20 min, no sitting, crossing arms, or scratching | Every 2 min, 4 images (in total 20 min) | Hands, forearms, arms, thighs, legs, chest, and abdomen | 44 subjects: 18 men (22.3 ± 3.1 yrs) and 26 women (21.7 ± 2.5 yrs) (no pain, no medication 2 weeks, no smoking, no cream/lotion 6 h, no exercise 24 h before exercise) | Fluke ATIR-25 (160 × 120 pixels) |
| Arfaoui et al. (2014) [32] | Analyze the relationship between gastrocnemius skin temperature and heart rate during incremental cycling | 5 min sitting, cycling at 100 W for 10 min, then +50 W every 3 min at up to 200 W, then 250 W for 2 min, 30 min was needed to balance the body’s temperature with the environment before resuming | Not specified | Calves | 11 male cyclists (15 ± 11 yrs experience) (no smoking, alcohol, coffee/caffeine for 6 h before exercise) | FLIR SC1000 (256 × 256 pixels) |
| Quesada et al. (2016) [33] | Compare skin temperature differences between cyclists and non-cyclists, relationship with performance factors | 3 min warm-up at 105 W, then 35 W increase per 3 min until exhaustion; 10 min adaptation before the test; after 10 min adaptation, immediately after the test and 10 min after the test | Not specified | Vastus lateralis, rectus femoris, biceps femoris, and gastrocnemius medialis | 11 cyclists and 11 non-cyclists (no alcohol, coffee/caffeine, smoking 12 h, exercise, no sunbath, no creams, lotions, oils before exercise) | FLIR T420 (320 × 240 pixels, perpendicular to ROI, distance of 1 m, no electronic devices in 5 m radius) |
| Ferreira et al. (2008) [41] | Evaluate thermographic changes linked to localized exercise in young and elderly participants | 10 min adaptation, warm-up exercise for right lower limb: isotonic exercises of knee extension/flexion with 1 kg weight resistance above the ankle, 3 min full range of motion | Pre-exercise, immediately post-exercise, and during the 10-min period post-exercise (every 2 min 5 times) | Posterior thigh’s skin temperature | 14 elderly (67 ± 5 yrs) and 15 young (23 ± 2 yrs) healthy subjects (no food 2 h, no alcohol or exercise 24 h, no lotion 2 h before exercise) | Not specified (height of 36 cm, distance of 2.34 m) |
| Vardasca et al. (2016) [48] | Assess thermal symmetry in the extremities of participants | Room adaptation of 15 min | Not specified | Total body anterior, total body dorsal, right arm, left arm, both hands, thighs, lower legs, plantar feet, and dorsal feet views | 39 males (26.9 ± 10.2 yrs) (no smoking, no heavy meal, no alcohol 2 h, no exercise, no oils/lotion before exercise) | FLIR A40 (320 × 240 pixels) |
| Mu noz et al. (2024) [44] | Evaluate skin temperature asymmetries in padel players; associations with fatigue, pain, and experience | Training of 3 ± 1 h with a common training pattern | Before exercises, immediately after, and 10 min after | Upper limbs: anterior shoulder, anterior arm, anterior forearm, abdominal, posterior shoulder, posterior arm, posterior forearm, and lower back; lower limbs: anterior thigh, anterior knee, anterior leg, posterior thigh, posterior knee, and posterior leg | 10 professional padel players (9 males, 1 female) (no UV treatment 12 h, no medication, no body cream before exercise) | FLIR E60 (320 × 240 pixels, perpendicular to ROI, distance of 2 m) |
| Salamunes et al. (2017) [42] | Investigate the relationship between body fat percentage and skin temperature | 15 min adaptation, no exercise, participants were grouped based on %BF | Not specified | Anterior and posterior views, on both right and left sides: arms, forearms, thighs, shanks, palms, abdomen, and flanks | 123 Women (18–35 yrs, BMI: 18.5–29.99 kg/m2) (not pregnant, no fever for 15 days, no alcohol, caffeine/coffee, lotions, deodorants, no smoking before exercise) | Fluke Ti400 (320 × 240 pixels, orthostatic position, distance of 2.5 m) |
| Zontak et al. (1997) [34] | Define skin temperature responses to exercise using thermography | 15 min adaptation; method 1: cycling with a load increase of 50 W every 3 min until exhaustion; method 2: rest and steady state (640 s at rest, 1280 s under load) | Not specified | Method 1: hand skin temperature under conditions of rest, load, and recovery; method 2: dynamics of hand surface temperature under rest followed by constant load | 10 subjects (age: 25.8 ± 0.7 yrs, height: 175.3 ± 1.8 cm, weight: 70.1 ± 2.5 kg) | Not specified |
| Merla et al. (2005) [35] | Examine differences in skin thermoregulation during graded exercise between trained and untrained individuals | High-resolution thermal video: thighs recorded at rest for 1 min, during exercise and along the recovery phase | High-resolution thermal video: thighs recorded at rest for 1 min, during exercise and along the recovery phase | Total body | 18 young healthy men (19–26 yrs), 10 professional footballers and 8 sedentary subjects (non-smokers, no drugs) | AEG Aim 256 PtSi (256 × 256 pixels) |
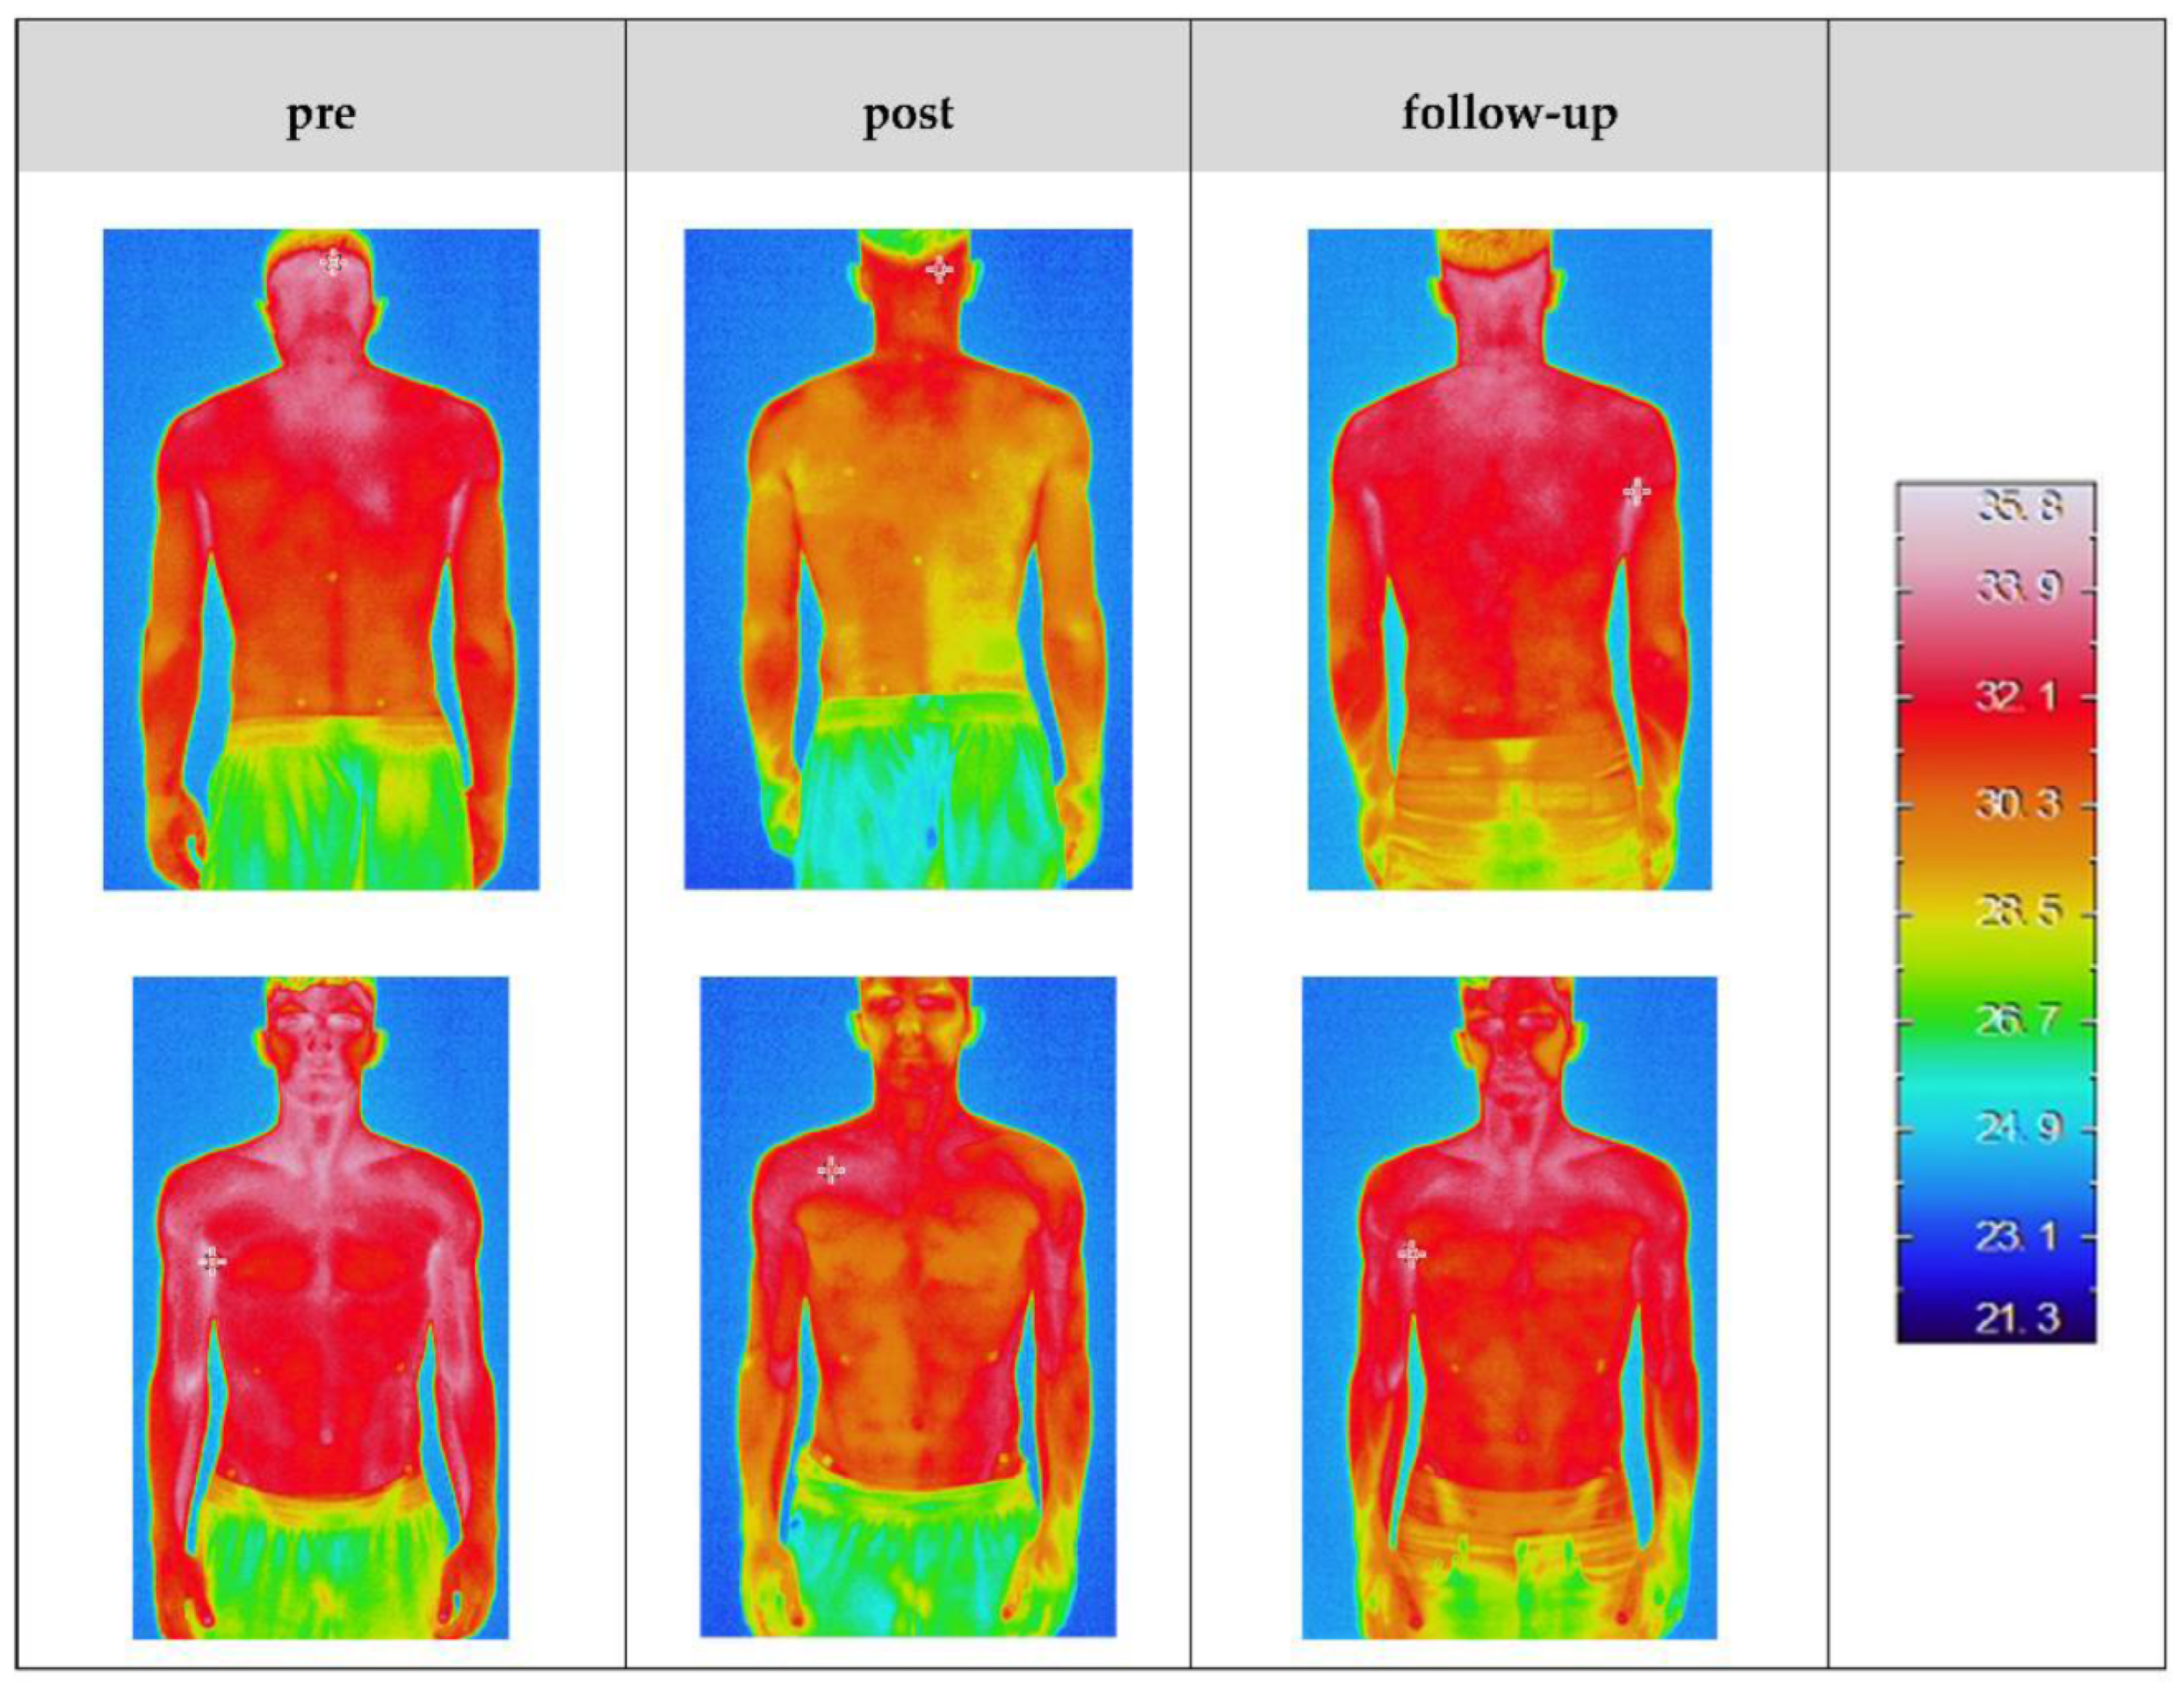
| Cuevas et al. (2014) [28] | Use IRT to monitor changes in muscle and joint temperature after exercises, understanding effects on thermoregulation and metabolism | Strength training session protocol: 5 min warm-up bicycle + stretch, 4 sets of 10 reps at 70%, 90 s rest, bench, leg press, leg extensions, crossed pulleys; also 5 min warm-up, 45 min treadmill 60–75%. 15 min adaptation, no exercise 24 h, comfortable clothing | 10 series of thermograms before, immediately after, and one hour after exercise | Pectoral, dorsal, deltoids, biceps brachii, triceps brachii, quadriceps, and hamstring muscles, the elbow and knee joints bilaterally, abdominal | 15 physically active students | FLIR 335 (320 × 240 pixels) |
| Tanda et al. (2015) [39] | Evaluate skin temperature responses to controlled running exercise | 10 min adaptation, running exercise on a treadmill with graded or constant load | During different phases of exercise, including warm-up, running at a constant velocity, and resting periods | Anterior thigh, abdomen, posterior calf, etc. | 7 healthy and active subjects (6 males and 1 female) | FLIR T335 (320 × 240 pixels) |
| Hadzic et al. (2015) [45] | Study the connection between skin temperature changes and muscle fatigue, determine the usefulness of thermography for monitoring fatigue | 15 min adaptation, 6 min warm-up at 100 W, 10 s stretch, then 7.5 min at 120°/s on a dynamometer | Not specified | Quadriceps | 1 male (23 yrs, 12 yrs training history, 178.5 cm, 68 kg) | FLIR T425 (320 × 240 pixels) |
| Study | Key Findings | Limitations | Conclusions |
|---|---|---|---|
| Vieira et al. (2020) [13] | Women had significantly lower skin temperature than men, with no significant differences between sexes at both 20 min and 24 h after exercise; asymmetry is noted when the temperature difference exceeded 0.5 °C | The type of strength training performed may induce thermal changes 24 h after exercise compared to baseline values in the ROIs, these areas would thus require a longer recovery time | Women’s resting skin temperature was lower than men’s across all ROIs; strength training did not alter baseline skin temperature at 20 min post-exercise in the analyzed regions; 24 h post-training, men showed increases compared to base values in upper back skin temperature, women in quadriceps |
| Szurko et al. (2022) [14] | An initial decrease in skin temperature due to vasoconstriction; an increase in skin temperature in specific regions when blood flow drifts from internal tissues to the skin surface | Not specified | Thermography can assess muscle symmetry; temperature differences did not exceed 0.5 °C, meaning no significant asymmetry; thermal imaging is a non-contact, safe, and innovative method for verifying muscle symmetry |
| Bandeira et al. (2012) [15] | The experimental group experienced some micro-injuries, triggering an inflammatory process, notable muscular temperature gradient was observed 24 h after exercise | Not specified | Thermography, alongside creatine kinase, can non-invasively detect and localize muscle injuries post-training; fat layer thickness affects accuracy |
| Trecroci et al. (2017) [16] | Significant asymmetry in peak crank torques, the right limb is stronger and colder, no correlation between asymmetry and skin temperature differences, fewer asymmetries with highly trained cyclists, sweat production can reduce skin temperature | The experimental setting is far from regular training or competition environments, with no pedal power measurements, only analyzing the quadriceps | Bilateral differences in kinetic variables did not correspond to skin temperature differences during a maximal incremental cycling test, challenging to link skin temperature with muscle effort, future studies should include additional cameras to analyze other areas of the lower limbs |
| Quesada et al. (2016) [10] | Changing saddle height did not lead to changes in skin temperature at the regions of interest, different cycling postures from saddle height variations had no impact on thermal measurements | Sweat on the skin could influence the IRT data as it may work as a filter | Changes in knee flexion angles did not alter skin temperature at the ROIs, application of IRT for analyzing saddle height effects does not seem suitable |
| Cholewka et al. (2015) [17] | A strong negative correlation was found between average power output and average body surface temperature from thermal parameters | Not specified | Thermal imaging can be useful for evaluating athletic efficiency, it may also aid in training assessments |
| Ludwig et al. (2016) [18] | Heat-spot patterns on thighs linked to effort type rather than exercise type | Controlled environment conditions | Decrease in temperature post-exercise, rapid recovery immediately after; hot-spotted thermal pattern on the skin surface |
| Dindorf et al. (2022) [12] | Temperature changes were visible post-test, decreasing after 24 h; back muscles showed asymmetric skin temperature differences post-test, with the treated side slightly warmer | Body fat influences thermographic reactions [14], laboratory environmental conditions | Thermography is effective for detecting differences between treatment and non-treatment areas, suggesting potential in evaluating the effectiveness of treatment for asymmetric muscle fatigue; thermography can bring value in diagnosing muscular imbalances |
| Chudecka et al. (2015) [20] | Scullers: mean skin temperature was lower post-exercise than pre-exercise, symmetrical muscle activity; handball players: significant differences in skin temperatures between symmetric and asymmetric muscle areas | Small sample size, lack of detailed information on the handball players | Thermal imaging could be a valuable tool for assessing technical preparations in sports requiring symmetrical muscle use, like rowing; symmetry is crucial for optimal performance in such sports |
| Formenti et al. (2012) [22] | Female athlete’s skin temperature increased more during steady-load exercise compared to sedentary female controls | Heat dissipation is influenced by variables like body hair and fat distribution | Physical training influences the rate of skin temperature increases during localized exercise in female subjects; IRT has the potential to track skin temperature changes during exercise and is helpful in studying skin temperature changes and their physiopathology |
| Bayrak et al. (2024) [23] | Temperature increased significantly after 10 min of cycling at 30–40% intensity | Not specified | Thermography is useful for detecting muscle injuries and can be employed in injury prevention strategies |
| Straburnzyńska-Lupa et al. (2022) [25] | No significant temperature asymmetries were found | Not specified | No significant temperature asymmetries were found; thermal imaging can effectively track changes in skin temperature and symmetry before and after exercise |
| Duc et al. (2015) [29] | Strong correlations were observed between changes in heart rate, oxygen uptake, and skin temperature in the vastus lateralis and gastrocnemius medialis muscles | Efficiency is calculated at the same workload but not at identical pedaling cadence, the time of power output steps to measure data is much lower than recommended | Significant inverse correlation between skin temperature changes in vastus lateralis and cycling efficiency, cyclists with greater skin temperature decrease showed better thermoregulation during exercise |
| Ludwig et al. (2013) [30] | Comparison of three IRT methods (Troi, Tmax, Ttot) for skin temperature analysis; Troi and Ttot yield similar values, while Tmax detects higher temperatures and asymmetry more effectively | Small sample size, limited to calf muscles, only static images analyzed | All three methods effectively capture skin temperature trends, Tmax is the most suitable for detecting asymmetry and dynamic conditions |
| Marins et al. (2014) [31] | Women exhibited significantly higher temperature variations than men; men: significant temperature variation in the abdomen; women: variations in the anterior abdomen, thighs, and posterior parts of the hands and forearms | Not specified | The time required to reach skin temperature balance in young men and women is variable, 10 min of rest for whole-body thermal analysis is recommended for both sexes |
| Arfaoui et al. (2014) [32] | No asymmetries were found | Not specified | A significant correlation was found between heart rate and skin temperature evolution during graded exercise, no asymmetries were detected |
| Quesada et al. (2016) [33] | Cyclists had lower body fat percentage, higher peak power output, higher oxygen consumption, higher heat production, and higher skin temperatures in knee extensors compared to non-cyclists; skin temperature was negatively correlated with body fat and positively correlated with peak power output and heat production | Sweat on the skin could have influenced the thermal data due to its effect as a filter for infrared radiation [49] | Cyclists had higher skin temperatures than non-cyclists during and after an incremental cycling test, heat production is a key variable to consider when interpreting skin temperature results, skin temperature dynamics are influenced by body composition and cycling performance, and maintaining low body fat is recommended for improved heat dissipation |
| Ferreira et al. (2008) [41] | No temperature differences were observed pre-exercise, younger individuals had higher baseline limb temperatures than elderly participants, post-exercise: the temperature in the exercised limb was greater | No similar health conditions between subjects | IRT is effective in detecting thermal responses during low-exercise conditions, young subjects had higher resting temperatures than the elderly, elderly showed slower heat dissipation post-exercise despite similar heat production |
| Vardasca et al. (2016) [48] | The greatest difference in standard variations between the contralateral areas was found to be 0.12 °C (forearm, anterior view); the asymmetry threshold is at 0.5 °C | Not specified | Regional views provided better thermal symmetry than full-body views, particularly for hands and feet, with excellent thermal symmetry in healthy individuals, with maximum differences of 0.4 °C |
| Mu noz et al. (2024) [44] | No asymmetries before exercise; post-exercise differences found in anterior and posterior forearms, shoulders, and arms; 10 min post-exercise, differences in anterior and posterior arms and forearms; strong correlation found between thermal asymmetries in the knee and racket weight (moderate correlation between the posterior thigh and age) | Small sample size, only one female; training was the same for all players, so load cannot be objectively determined | Asymmetries were observed in upper limbs post-training, increasing during recovery (10 min post-exercise); skin temperature dominance was not related to changes in fatigue, pain, or years of experience, but was associated with racket mass in the anterior knee and age in the posterior thigh; thermography can be useful for observing asymmetries |
| Salamunes et al. (2017) [42] | Higher body fat percentage correlated with lower skin temperatures in posterior thighs, shanks, and arms; body fat percentage positively correlated with palm temperatures and body circumferences | The lack of control of subjects’ menstrual cycle phases may alter thermal results [37] | Skin temperature distribution is influenced by body fat percentage, future studies should consider body fat’s impact on heat dissipation |
| Zontak et al. (1997) [34] | Method 1: hand temperature decreased over time; method 2: steady-state temperature at rest reached after 500 s; higher initial fingertip temperatures correlated with greater rates of decrease | Not specified | Rate of temperature decrease was influenced by the initial hand temperature; graded load exercises caused continuous cooling of fingers; steady-state exercises caused a similar decrease, followed by rewarming post-exercise |
| Merla et al. (2005) [35] | Untrained subjects showed lower minimal skin temperature after exercise compared to trained subjects, trained subjects had better blood circulation, skin temperature decreased in both trained and untrained groups during exercise due to continuous vasoconstriction as exercise intensity increased | Not specified | Trained individuals showed better vasoconstriction and heat dissipation during exercise; trained group was more efficient at transferring heat from muscles to skin |
| Cuevas et al. (2014) [28] | Recovery times varied by muscle group, exercise type, and intensity | Only 15 participants, a controlled environment, and limited exercises | IRT could offer valuable insights into temperature changes as a reaction to exercise; it is a safe, effective tool for monitoring activity and recovery patterns |
| Tanda et al. (2015) [39] | Early decrease in skin temperature during graded load exercise due to vasoconstriction, relative minimum during constant load, gradual increase during recovery | A limited number of subjects, controlled laboratory conditions | Human thermoregulation during running is influenced by dynamic energy balance and environmental and physical work conditions; IRT is effective for real-time, non-invasive monitoring of skin temperature; skin temperature decreases initially during exercise due to vasoconstriction |
| Hadzic et al. (2015) [45] | Negative correlation between quadriceps skin temperature increase and power decrease | Not specified | Possible relationship between skin temperature changes and muscle fatigue, monitoring skin temperature could provide an easier tool for tracking muscle fatigue |
4. Discussion
4.1. Thermography vs. Traditional Bike-Fitting Methods
4.2. Practical Applications of Thermography in Bike Fitting
4.3. Limitations
4.4. Recommendations for Future Research
5. Conclusions
Author Contributions
Funding
Institutional Review Board Statement
Informed Consent Statement
Data Availability Statement
Acknowledgments
Conflicts of Interest
References
- Scoz, R.D.; de Oliveira, P.R.; Santos, C.S.; Pinto, J.R.; Melo-Silva, C.A.; de Júdice, A.F.T.; Mendes, J.J.B.; Ferreira, L.M.A.; Amorim, C.F. Long-Term effects of a kinematic bikefitting method on pain, comfort, and fatigue: A Prospective cohort study. Int. J. Environ. Res. Public Health 2022, 19, 12949. [Google Scholar] [CrossRef] [PubMed]
- Van der Walt, A. Non-traumatic injury profile of amateur cyclists. S. Afr. J. Sport. Med. 2014, 26, 119–122. [Google Scholar] [CrossRef]
- Bini, R.; Hume, P.A.; Croft, J.L. Effects of bicycle saddle height on knee injury risk and cycling performance. Sport. Med. 2011, 41, 463–476. [Google Scholar] [CrossRef] [PubMed]
- Braeckvelt, J.; De Bock, J.; Schuermans, J.; Verstockt, S.; Witvrouw, E.; Dierckx, J. The need for data-driven bike fitting: Data study of subjective expert fitting. In Proceedings of the 7th International Conference on Sport Sciences Research and Technology Support (icSports), Vienna, Austria, 20–21 September 2019; pp. 181–189. [Google Scholar] [CrossRef]
- Bini, R.R. (La Trobe University, Melbourne, VIC, Australia). The Need for a Link Between Bike Fitting and Injury Risk. Personal communication, 2016. [Google Scholar]
- Millour, G.; Velásquez, A.T.; Domingue, F. A Literature Overview of Modern Biomechanical-Based Technologies for Bike-Fitting Professionals and Coaches. Int. J. Sport. Sci. Coach. 2023, 18, 292–303. [Google Scholar] [CrossRef]
- Holliday, W.; Fisher, J.; Swart, J. The Effects of Relative Cycling Intensity on Saddle Pressure Indexes. J. Sci. Med. Sport 2019, 22, 1106–1111. [Google Scholar] [CrossRef]
- Scoz, R.D.; Espindola, T.R.; Santiago, M.F.; de Oliveira, P.R.; Alves, B.M.O.; Ferreira, L.M.A.; Amorim, C.F. Validation of a 3D Camera System for Cycling Analysis. Sensors 2021, 21, 4473. [Google Scholar] [CrossRef]
- Husband, S.P.; Wainwright, B.; Wilson, F.; Crump, D.; Mockler, D.; Carragher, P.; Nugent, F.; Simms, C.K. Cycling Position Optimisation—A Systematic Review of the Impact of Positional Changes on Biomechanical and Physiological Factors in Cycling. J. Sport. Sci. 2024, 42, 239–255. [Google Scholar] [CrossRef]
- Quesada, J.I.P.; Carpes, F.P.; Palmer, R.S.; Perez-Soriano, P.; De Anda, R.M.C.O. Effect of saddle height on skin temperature measured in different days of cycling. SpringerPlus 2016, 5, 205. [Google Scholar] [CrossRef]
- Soroko, M.; Zaborski, D.; Dudek, K.; Yarnell, K.; Górniak, W.; Vardasca, R. Evaluation of thermal pattern distributions in racehorse saddles using infrared thermography. PLoS ONE 2019, 14, e0221622. [Google Scholar] [CrossRef]
- Dindorf, C.; Bartaguiz, E.; Janowicz, E.; Fröhlich, M.; Ludwig, O. Effects of unilateral muscle fatigue on thermographic skin surface temperature of back and abdominal Muscles—A pilot study. Sports 2022, 10, 41. [Google Scholar] [CrossRef]
- Vieira, S.G.; Sillero-Quintana, M.; Da Silva, A.G.; Marins, K.O.; Marins, J.C.B. Thermographic response resulting from strength training: A preliminary study. Apunt. Sport. Med. 2020, 55, 120–127. [Google Scholar] [CrossRef]
- Szurko, A.; Kasprzyk-Kucewicz, T.; Cholewka, A.; Kazior, M.; Sieroń, K.; Stanek, A.; Morawiec, T. Thermovision as a tool for athletes to verify the symmetry of work of individual muscle segments. Int. J. Environ. Res. Public Health 2022, 19, 8490. [Google Scholar] [CrossRef] [PubMed]
- Bandeira, F.; De Moura, M.A.; De Souza, M.A.; Nohama, P.; Neves, E.B. Can Thermography Aid In The Diagnosis Of Muscle Injuries In Soccer Athletes? Rev. Bras. Med. Esporte 2012, 18, 246–251. [Google Scholar] [CrossRef]
- Trecroci, A.; Formenti, D.; Ludwig, N.; Gargano, M.; Bosio, A.; Rampinini, E.; Alberti, G. Bilateral asymmetry of skin temperature is not related to bilateral asymmetry of crank torque during an incremental cycling exercise to exhaustion. PeerJ 2018, 6, e4438. [Google Scholar] [CrossRef]
- Cholewka, A.; Kasprzyk, T.; Stanek, A.; Sieron-Stoltny, K.; Drzazga, Z. May thermal imaging be useful in cyclist endurance tests? J. Therm. Anal. Calorim. 2015, 123, 1973–1979. [Google Scholar] [CrossRef]
- Ludwig, N.; Trecroci, A.; Gargano, M.; Formenti, D.; Bosio, A.; Rampinini, E.; Alberti, G. Thermography for skin temperature evaluation during dynamic exercise, a case study on an incremental maximal test in elite male cyclists. Appl. Opt. 2016, 55, D126–D130. [Google Scholar] [CrossRef]
- Sillero-Quintana, M.; Gomez-Carmona, P.M.; Fernandez-Cuevas, I. Infrared thermography as a means of monitoring and preventing sports injuries. In Infrared Thermography as a Means of Monitoring and Preventing Sports Injuries; IGI Global: Hershey, PA, USA, 2017; pp. 166–167. [Google Scholar] [CrossRef]
- Straburzyńska-Lupa, A.; Korman, P.; Śliwicka, E.; Kryściak, J.; Ogurkowska, M.B. The use of thermal imaging for monitoring the training progress of professional male sweep rowers. Sci. Rep. 2022, 12, 16507. [Google Scholar] [CrossRef]
- Chudecka, M.; Lubkowska, A.; Leźnicka, K.; Krupecki, K. The use of thermal imaging in the evaluation of the symmetry of muscle activity in various types of exercises (Symmetrical and asymmetrical). J. Hum. Kinet. 2015, 49, 141–147. [Google Scholar] [CrossRef]
- Formenti, D.; Ludwig, N.; Gargano, M.; Gondola, M.; Dellerma, N.; Caumo, A.; Alberti, G. Thermal imaging of Exercise-Associated skin temperature changes in trained and untrained female subjects. Ann. Biomed. Eng. 2012, 41, 863–871. [Google Scholar] [CrossRef]
- Bayrak, A.; Ergene, M.C.; Ceylan, M. Thermography method under the influence of exercise in the detection of muscle injuries: Sartorius muscle case report. J. Bodyw. Mov. Ther. 2024, 39, 109–115. [Google Scholar] [CrossRef]
- Bogomilsky, S.; Hoffer, O.; Shalmon, G.; Scheinowitz, M. Preliminary study of thermal density distribution and entropy analysis during cycling exercise stress test using infrared thermography. Sci. Rep. 2022, 12, 14018. [Google Scholar] [CrossRef] [PubMed]
- Potter, J.J.; Sauer, J.L.; Weisshaar, C.L.; Thelen, D.G.; Ploeg, H.L. Gender Differences in Bicycle Saddle Pressure Distribution during Seated Cycling. Med. Sci. Sport. Exerc. 2008, 40, 1126–1134. [Google Scholar] [CrossRef]
- Lin, Z.J.; Wang, H.H.; Chen, C.H. The effect of bicycle saddle widths on saddle pressure in female cyclists. J. Sport. Sci. Med. 2023, 22, 425–430. [Google Scholar] [CrossRef] [PubMed]
- Herrero-Molleda, A.; Bini, R.; García-López, J. Saddle preferences and perceived comfort of competitive women cyclists. Sci. Sports 2024, 39, 670–677. [Google Scholar] [CrossRef]
- Cuevas, I.F.; Quintana, M.S.; Garcia-Concepcion, M.A.; Serrano, J.R.; Gomez-Carmona, P.; Marins, J.C. Monitoring Skin Thermal Response to Training with Infrared Thermography. New Stud. Athl. 2014, 29, 57–71. [Google Scholar]
- Duc, S. Efficiency and Thermography in Cycling during a Graded Exercise Test. J. Exerc. Sport. Orthop. 2015, 2, 1–8. [Google Scholar] [CrossRef]
- Ludwig, N.; Formenti, D.; Gargano, M.; Alberti, G. Skin temperature evaluation by infrared thermography: Comparison of image analysis methods. Infrared Phys. Technol. 2013, 62, 1–6. [Google Scholar] [CrossRef]
- Marins, J.C.B.; Moreira, D.G.; Cano, S.P.; Quintana, M.S.; Soares, D.D.; Fernandes, A.d.; da Silva, F.S.; Costa, C.M.A.; Amorim, P.R.d.S. Time required to stabilize thermographic images at rest. Infrared Phys. Technol. 2014, 65, 30–35. [Google Scholar] [CrossRef]
- Arfaoui, A.; Bertucci, W.; Letellier, T.; Polidori, G. Thermoregulation during incremental exercise in masters cycling. J. Sci. Cycl. 2014, 3, 33–41. [Google Scholar]
- Quesada, J.I.P.; Sampaio, L.T.; Bini, R.R.; Rossato, M.; Cavalcanti, V. Multifactorial cycling performance of Cyclists and Non-Cyclists and their effect on skin temperature. J. Therm. Anal. Calorim. 2016, 127, 1479–1489. [Google Scholar] [CrossRef]
- Zontak, A.; Sideman, S.; Verbitsky, O.; Beyar, R. Dynamic Thermography: Analysis of hand temperature during exercise. Ann. Biomed. Eng. 1998, 26, 988–993. [Google Scholar] [CrossRef] [PubMed]
- Merla, A.; Iodice, P.; Tangherlini, A.; Michele, G.D.; Romualdo, S.D.; Saggini, R. Monitoring skin temperature in trained and untrained subjects throughout thermal video. In Proceedings of the 2005 IEEE Engineering in Medicine and Biology 27th Annual Conference, Shanghai, China, 17–18 January 2006; pp. 1684–1686. [Google Scholar] [CrossRef]
- Ring, E.F.J.; Ammer, K. The technique of infrared imaging in medicine. In IOP Publishing eBooks; IOP: Bristol, UK, 2015; pp. 1–10. [Google Scholar] [CrossRef]
- Fernández-Cuevas, I.; Marins, J.C.B.; Lastras, J.A.; Carmona, P.M.G.; Cano, S.P.; García-Concepción, M.Á.; Sillero-Quintana, M. Classification of factors influencing the use of infrared thermography in humans: A review. Infrared Phys. Technol. 2015, 71, 28–55. [Google Scholar] [CrossRef]
- Usuki, K.; Kanekura, T.; Aradono, K.; Kanzaki, T. Effects of nicotine on peripheral cutaneous blood flow and skin temperature. J. Dermatol. Sci. 1998, 16, 173–181. [Google Scholar] [CrossRef] [PubMed]
- Tanda, G. The use of infrared thermography to detect the skin temperature response to physical activity. J. Phys. Conf. Ser. 2015, 655, 012062. [Google Scholar] [CrossRef]
- Torii, M.S.C.; Yamasaki, M.; Sasaki, T.; Nakayama, H. Fall in skin temperature of exercising man. Br. J. Sports Med. 1992, 26, 29–32. [Google Scholar] [CrossRef]
- Ferreira, J.J.A.; Mendonça, L.C.S.; Nunes, L.A.O.; Andrade Filho, A.C.C.; Rebelatto, J.R.; Salvini, T.F. Exercise-Associated thermographic changes in young and elderly subjects. Ann. Biomed. Eng. 2008, 36, 1420–1427. [Google Scholar] [CrossRef] [PubMed]
- Salamunes, A.C.C.; Stadnik, A.M.W.; Neves, E.B. The effect of body fat percentage and body fat distribution on skin surface temperature with infrared thermography. J. Therm. Biol. 2017, 66, 1–9. [Google Scholar] [CrossRef]
- Neves, E.B.; Salamunes, A.C.C.; De Oliveira, R.M.; Stadnik, A.M.W. Effect of body fat and gender on body temperature distribution. J. Therm. Biol. 2017, 70, 1–8. [Google Scholar] [CrossRef]
- De León-Mu noz, A.; Priego-Quesada, J.I.; Marzano-Felisatti, J.M.; Sanchez-Jimenez, J.L.; Sendra-Pérez, C.; Aparicio-Aparicio, I. Preliminary application of infrared thermography to monitoring of skin temperature asymmetries in professional padel players. Sensors 2024, 24, 4534. [Google Scholar] [CrossRef]
- Hadžić, V.; Širok, B.; Malneršić, A.; Čoh, M. Can infrared thermography be used to monitor fatigue during exercise? A case study. J. Sport Health Sci. 2015, 8, 89–92. [Google Scholar] [CrossRef]
- Priego Quesada, J.I.; Jacques, T.C.; Bini, R.R.; Carpes, F.P. Importance of static adjustment of knee angle to determine saddle height in cycling. J. Sci. Cycl. 2016, 5, 16–31. [Google Scholar]
- Peveler, W.W.; Green, J.M. Effects of saddle height on economy and anaerobic Power in Well-Trained cyclists. J. Strength Cond. Res. 2011, 25, 629–633. [Google Scholar] [CrossRef] [PubMed]
- Vardasca, R.; Ring, F.; Plassmann, P.; Jones, C. Symmetry of temperature distribution in the upper and lower extremities. In Proceedings of the 16th National Congress of the Polish Association of Thermology, Zakopane, Poland, 16–18 March 2012; pp. 53–60. [Google Scholar]
- Siegel, R.; Laursen, P.B. Keeping Your Cool: Possible Mechanisms for Enhanced Exercise Performance in the Heat with Internal Cooling Methods. Sport. Med. 2011, 42, 89–98. [Google Scholar] [CrossRef] [PubMed]
| Thermal Camera Type | Percentage of the Included Studies (%) |
|---|---|
| FLIR | 57.7 |
| AVIO | 19.3 |
| Fluke | 7.7 |
| AEG | 3.8 |
| Not mentioned | 11.5 |
Disclaimer/Publisher’s Note: The statements, opinions and data contained in all publications are solely those of the individual author(s) and contributor(s) and not of MDPI and/or the editor(s). MDPI and/or the editor(s) disclaim responsibility for any injury to people or property resulting from any ideas, methods, instructions or products referred to in the content. |
© 2025 by the authors. Licensee MDPI, Basel, Switzerland. This article is an open access article distributed under the terms and conditions of the Creative Commons Attribution (CC BY) license (https://creativecommons.org/licenses/by/4.0/).
Share and Cite
Clarys, W.; Vallet, O.; Verstockt, J.; Zhang, H.; Verspeek, S.; Steenackers, G. Thermography in Bike Fitting: A Literature Review. Sensors 2025, 25, 2356. https://doi.org/10.3390/s25082356
Clarys W, Vallet O, Verstockt J, Zhang H, Verspeek S, Steenackers G. Thermography in Bike Fitting: A Literature Review. Sensors. 2025; 25(8):2356. https://doi.org/10.3390/s25082356
Chicago/Turabian StyleClarys, Warre, Oscar Vallet, Jan Verstockt, Hai Zhang, Simon Verspeek, and Gunther Steenackers. 2025. "Thermography in Bike Fitting: A Literature Review" Sensors 25, no. 8: 2356. https://doi.org/10.3390/s25082356
APA StyleClarys, W., Vallet, O., Verstockt, J., Zhang, H., Verspeek, S., & Steenackers, G. (2025). Thermography in Bike Fitting: A Literature Review. Sensors, 25(8), 2356. https://doi.org/10.3390/s25082356