Electroacoustic Analysis and Optimization of Needle-Rod Electrodes for Low-Power Impulse Sound Source

Abstract
1. Introduction
2. Methods
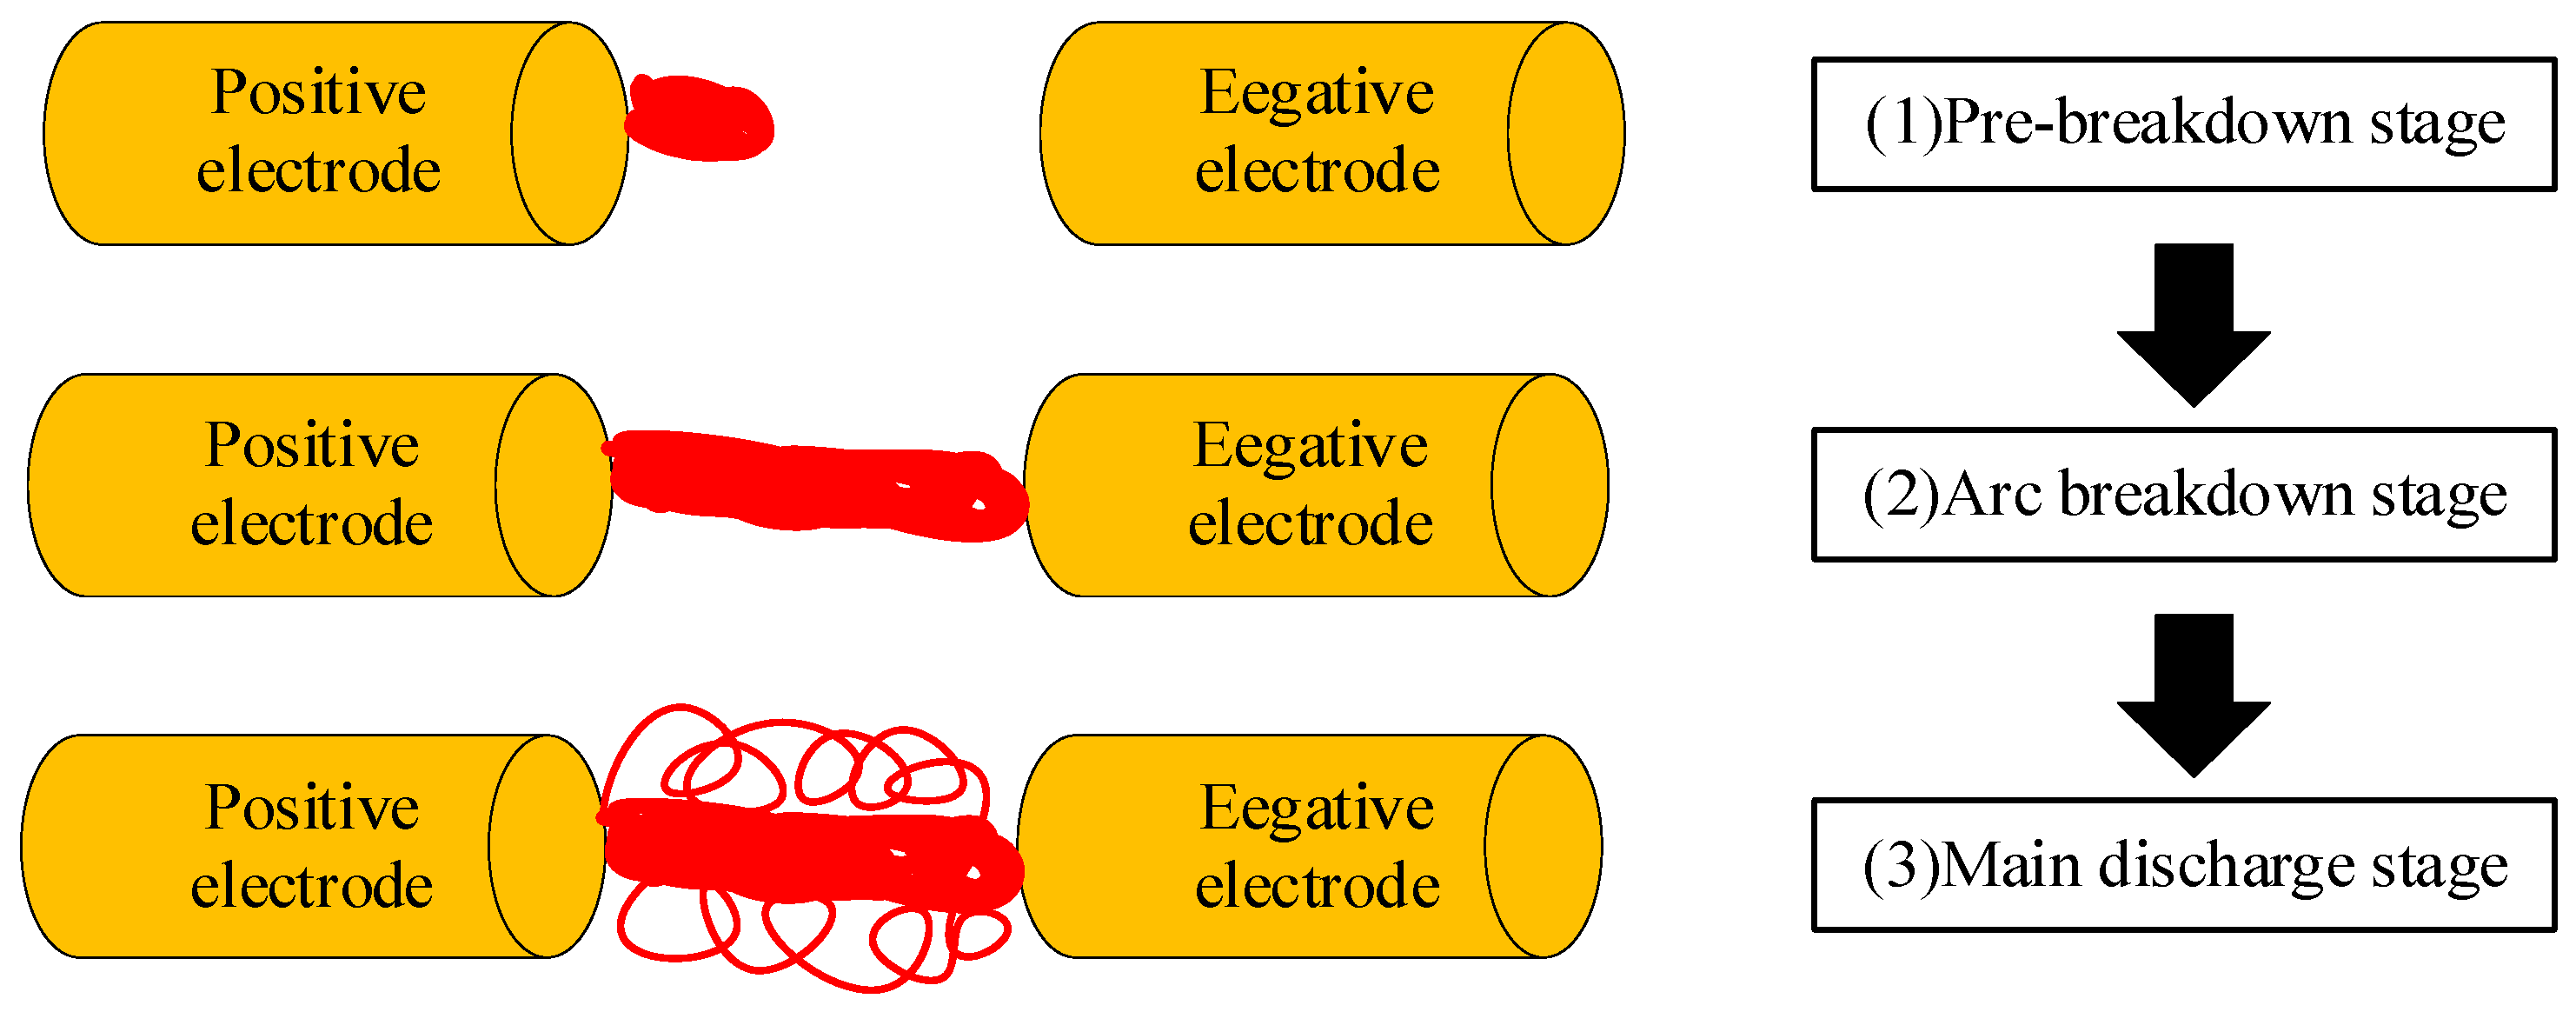
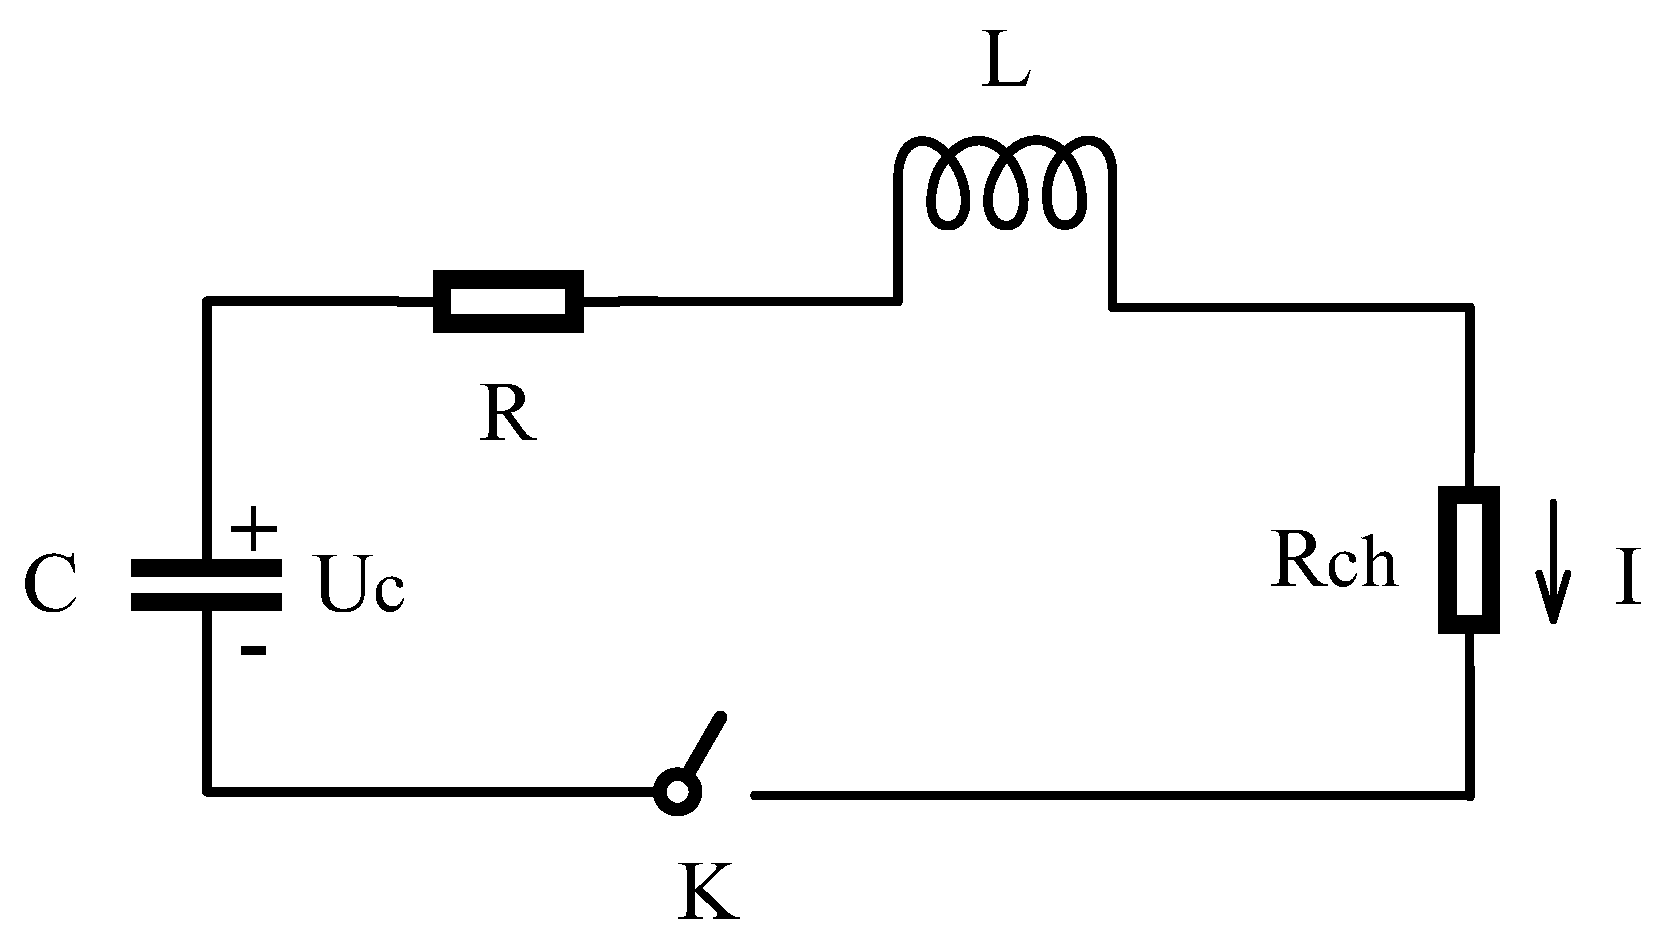
2.1. Principle
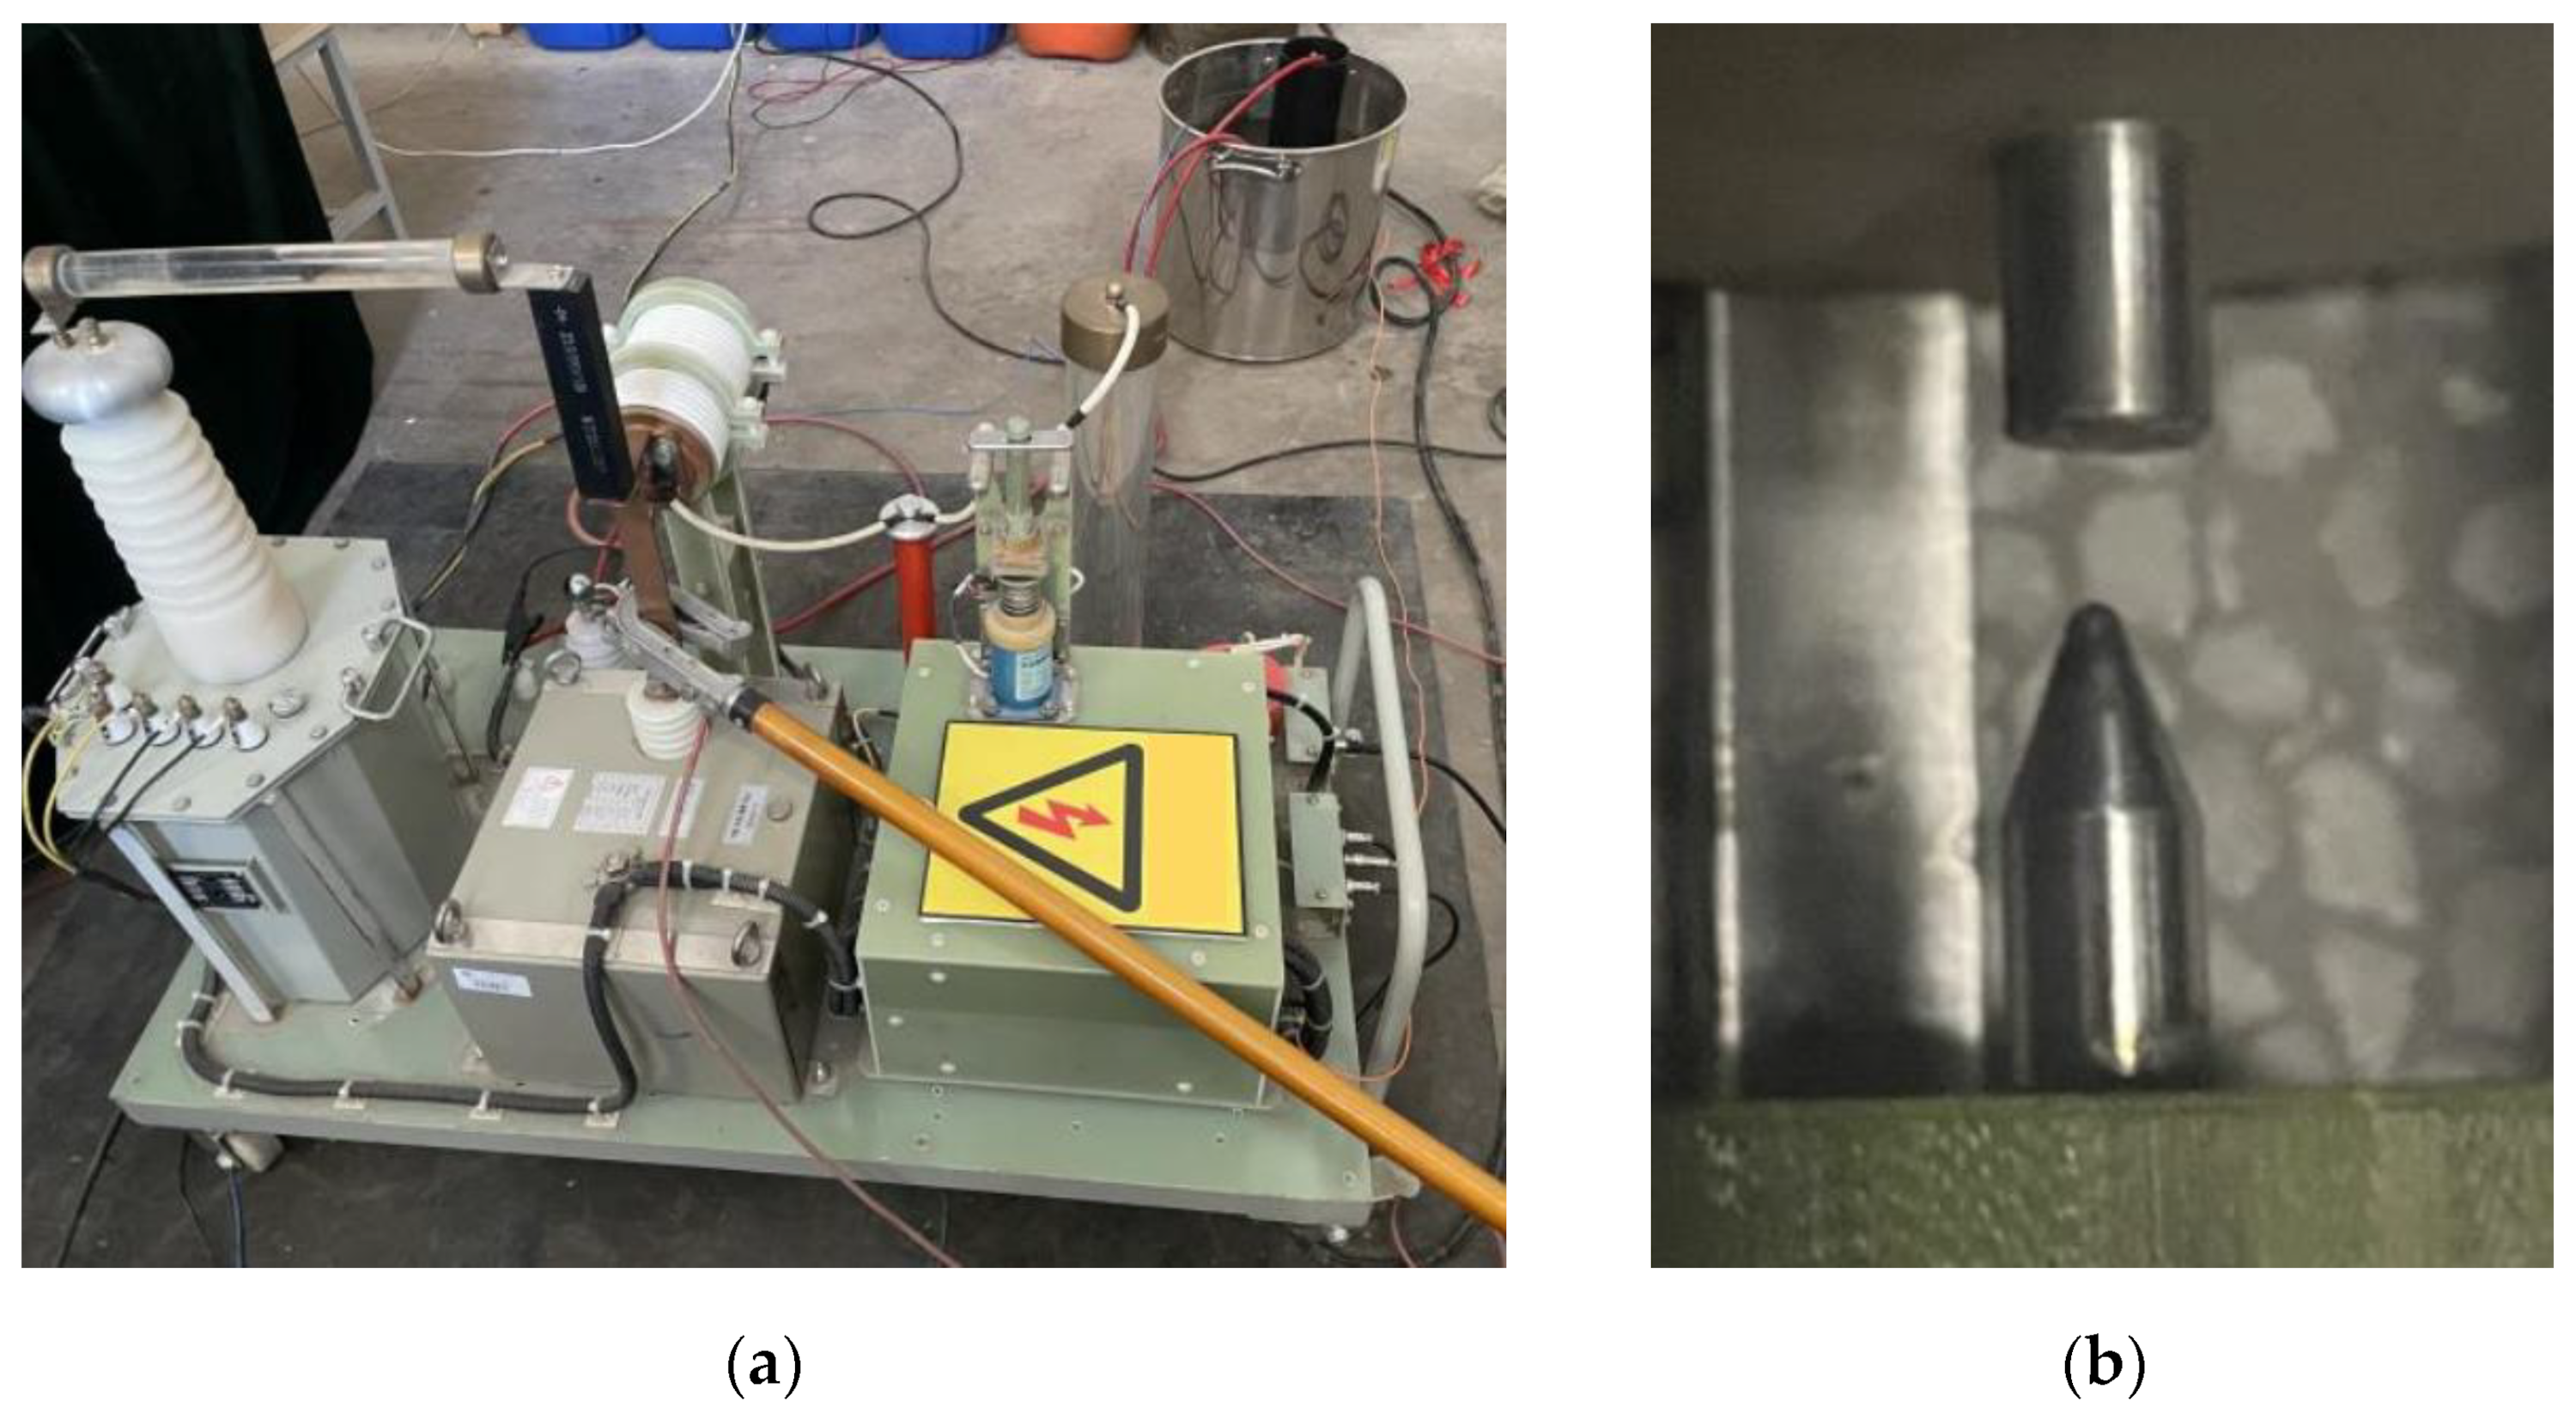
2.2. Experiment
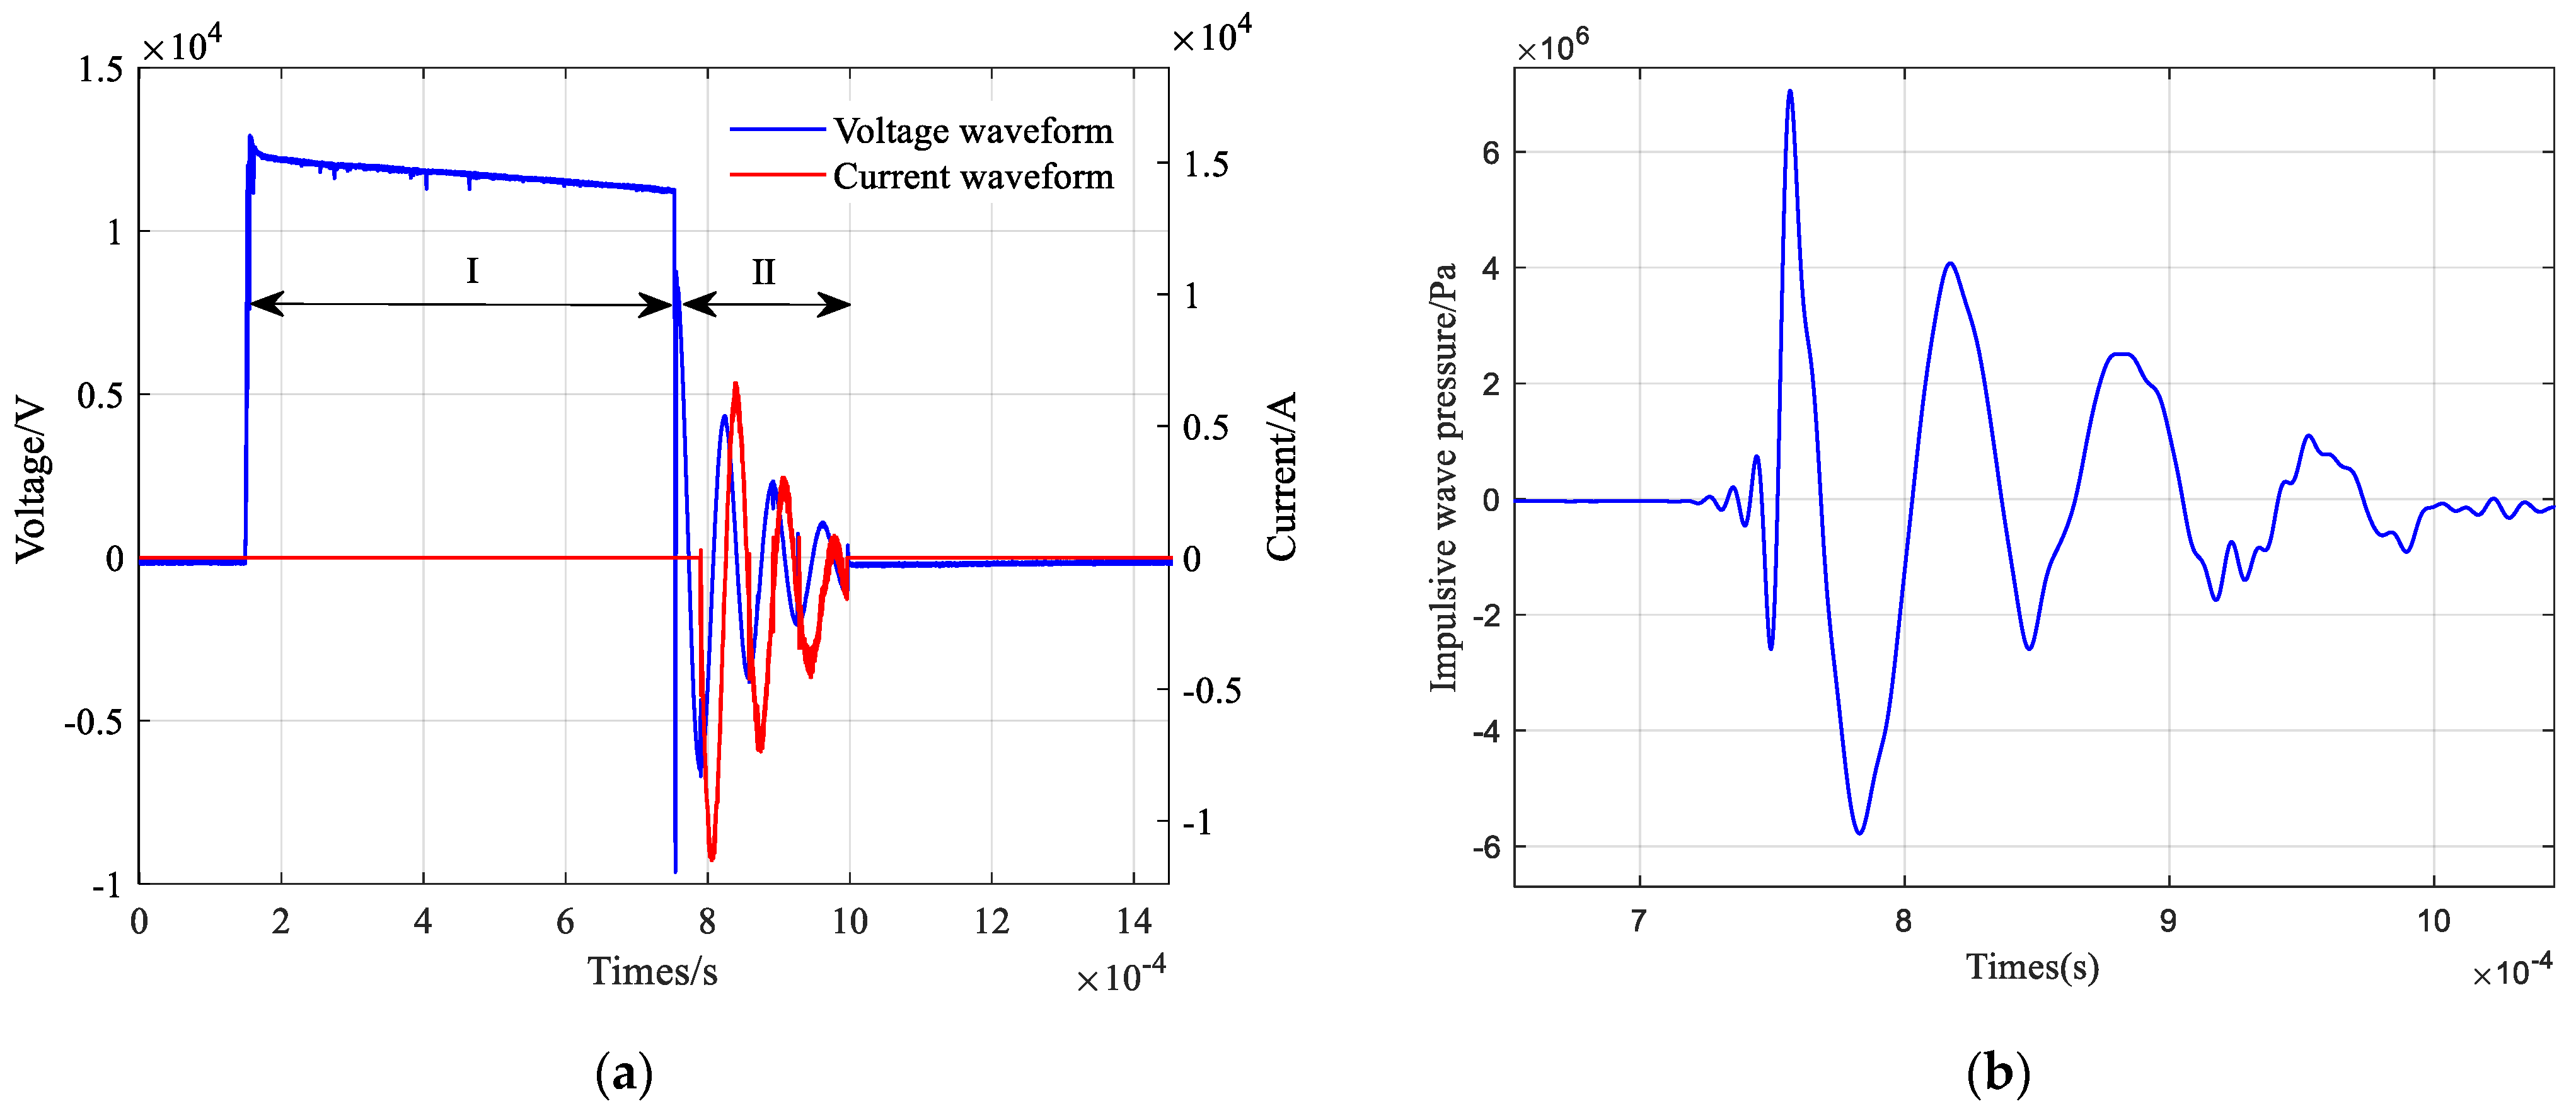
2.3. Validation
3. Discussion
3.1. System Power
3.2. Pre-Breakdown Time and Gap Average Field Strength
3.3. Impulse Wave Intensity
3.4. Sound Pressure Level–Frequency
4. Optimization
4.1. Optimization
4.2. Prospects
- (1)
- Azimuthal characteristics: The sound field excited by the impulse sound source is a spherical wave, which does not have azimuthal radiation characteristics, so how to make the impulse sound source with azimuthal directivity is a key issue in the azimuthal detection of impulse sound sources;
- (2)
- Adaptability to drilling: A downhole drilling environment with a high temperature, high pressure, and strong vibration poses challenges to the pulse energy storage capacitor and other components;
- (3)
- Miniaturisation: The capacity of the storage capacitor and the volume of the storage capacitor are constrained by each other. For the narrow space of the downhole instrument, reducing the volume while ensuring the capacity of the storage capacitor is an issue that needs to be further considered for research.
- (4)
- Data separation and processing of received signals: The drilling environment is complex, and the acoustic waves generated by the drill bit breaking up the rock and the vibration of the drill column will interfere with the echo signals. Meanwhile, a direct wave will also bury useful signals. It is worth studying how to separate useful echoes from complex signals.
5. Conclusions
- (1)
- The impulse sound source works under high-power, high-voltage, and high-current working conditions, the level of electrode erosion is serious, the system insulation is poor, and the pulse capacitors, control switches, and other components are large; thus, the instrument is difficult to install in a small space;
- (2)
- Reducing the charging voltage is the most significant way to reduce the power of the needle-rod electrode system for the impulse sound source, but it results in a weaker impulse wave intensity and sound pressure level. The optimum impulse wave can only be stimulated by a suitable electrode gap. A larger liquid conductivity reduces the pre-breakdown time of the needle-rod electrode of an impulse sound source;
- (3)
- The optimised needle-rod electrode of a low-power impulse sound source system has a peak power of only 20.95 kW, a maximum impulse wave intensity of 4.78 MPa, and a sound pressure level of more than 295 dB below 1 kHz and more than 225 dB from 1 kHz to 300 kHz, which is characterized by a wide bandwidth and high energy.
Author Contributions
Funding
Institutional Review Board Statement
Informed Consent Statement
Data Availability Statement
Conflicts of Interest
References
- Sun, Z.; Yang, S.; Zhang, F.; Lu, J.; Wang, R.; Ou, X.; Lei, A.; Han, F.; Cen, W.; Wei, D.; et al. A Reconstructed Method of Acoustic Logging Data and Its Application in Seismic Lithological Inversion for Uranium Reservoir. Remote Sens. 2023, 15, 1260. [Google Scholar] [CrossRef]
- Zhang, Q.; Zhang, F.; Yuan, C.; Deng, R.; Liu, G. Application analysis on the different neutron gamma density (NGD) logging methods. Appl. Radiat. Isot. 2021, 172, 109672. [Google Scholar] [CrossRef]
- Abdollahian, A.; Wang, H.; Liu, H.; Zheng, X. Transfer learning for acoustic cement bond evaluation: An image classification approach using acoustic variable Density log. Geoenergy Sci. Eng. 2024, 239, 212960. [Google Scholar] [CrossRef]
- Markova, I.; Markov, M. Secondary porosity classification in heterogeneous carbonate reservoirs based on the sonic log data. J. Appl. Geophys. 2023, 218, 105215. [Google Scholar]
- Tartoussi, N.; Lataste, J.F.; Rivard, P. Effects of a filled discontinuity in a rock mass on transmission losses of compressional and shear wave of full-waveform sonic log data. J. Appl. Geophys. 2023, 217, 14. [Google Scholar]
- Zhou, Z.; Caspari, E.; Barbosa, N.D.; Holliger, K. Normal and Shear Compliance Estimation for Inclined Fractures Using Full-Waveform Sonic Log Data. IEEE Trans. Geosci. Remote Sens. 2023, 62, 5901515. [Google Scholar]
- Li, Z.C.; Qu, Y.M. Research progress on seismic imaging technology. Pet. Sci. 2022, 19, 128–146. [Google Scholar]
- Zhao, L.; Li, Z.; Guo, S. Research on the Application of Acoustic Far Detection Technology in Relief Well. Well Logging Technol. 2024, 48, 248–255. [Google Scholar]
- Xu, H.; Zhai, C.; Xia, J.; Sun, Y.; Dong, X.; Lai, Y.; Yu, X.; Xu, J.; Cong, Y. Coal-rock interface imaging based on acoustic remote reflection logging within crossing boreholes using the finite element method. Coal Geol. Explor. 2024, 52, 118–129. [Google Scholar]
- Niu, D.; Su, Y. Adjacent Borehole Imaging Method Based on Acoustic Remote Detection in Shallow Unconsolidated Formations. Pet. Drill. Tech. 2022, 50, 21–27. [Google Scholar]
- Zhao, T.; Che, X.; Qiao, W.; Cheng, L. Experimental Simulation of Fracture Evaluation Based on Borehole 3D Scanning Acoustic Imaging Using Scattered Waves. Earth Sci. 2023, 48, 2703–2717. [Google Scholar]
- Liu, H.; Wu, Y.; He, H.; Xie, B.; Lai, Q.; Han, H. Application of new processing technology of array acoustic logging in carbonate reservoir evaluation. Process Geophys. 2023, 38, 220–228. [Google Scholar]
- Wang, J.; Che, X.; Qiao, W.; Tao, S.; Zhao, Q. Influence of the Transducer-Mounting Method on the Radiation Performance of Acoustic Sources Used in Monopole Acoustic Logging While Drilling. Sensors 2025, 25, 201. [Google Scholar] [CrossRef] [PubMed]
- Zhao, Q.; Che, X.; Qiao, W.; Tao, S.; Wang, J. Inversion of radial formation velocity distribution based on monopole acoustic logging while drilling. Geoenergy Sci. Eng. 2023, 231, 212313. [Google Scholar] [CrossRef]
- Ji, Y.J.; Wang, H. Shear wave measurement in slow formations for eccentric monopole acoustic logging while drilling. J. Phys. Conf. Ser. Zhengzhou China 2024, 2822, 012061. [Google Scholar] [CrossRef]
- Wang, J.; Nie, C.; Guan, W.; Zhang, C. Experimental measurements of monopole inner/outer collar waves and estimation of P wave velocity in acoustic LWD. J. Pet. Sci. Eng. 2022, 214, 110539. [Google Scholar] [CrossRef]
- Fu, X.; Gou, Y. An analysis for unipole acoustic logging while drilling wavefields with varying eccentered collar positions. J. Geophys. Eng. 2022, 19, 475–493. [Google Scholar]
- Tang, X.-M.; Patterson, D.J. Single-well S-wave imaging using multicomponent dipole acoustic-log data. Geophysics 2009, 74, WCA211–WCA223. [Google Scholar] [CrossRef]
- Wei, Z.; Tang, X.; Cao, J. Acoustic radiation and reflection of a logging-while-drilling dipole source. Geophys. J. Int. 2019, 219, 108–128. [Google Scholar]
- Hei, C.; Hu, W.; Zou, X.; Hu, K.; Li, Z. Numerical Simulation of Acoustic Field Ahead of Drill-Bit in Formation Generated by Multipole Source During Logging While Drilling. IEEE Geosci. Remote Sens. Lett. 2024, 21, 7506705. [Google Scholar]
- Li, J.C.; He, X.; Zhao, A.S.; Jiang, C. Joint inversion of formation radial shear-velocity profiles by dipole acoustic logging while drilling. Geophysics 2023, 88, D295–D305. [Google Scholar] [CrossRef]
- Li, Y.; Tang, X.; Su, Y. Borehole radiation and reception responses for azimuthal shear-wave reflection imaging with an off-centred dipole acoustic tool. J. Geophys. Eng. 2022, 19, 1180–1195. [Google Scholar]
- Qiao, W.X.; Du, G.S.; Chen, X.L. Feasibility of Application of Linear Phased Array Acoustic Transmitters to Acoustic Well-logging. Chin. J. Geophys. 2002, 45, 755–763. [Google Scholar]
- Yang, S.; Qiao, W.; Che, X. Numerical simulation of acoustic fields in formation generated by linear phased array acoustic transmitters during logging while drilling. J. Pet. Sci. Eng. 2019, 182, 106184. [Google Scholar]
- Johansen, T.F.; Buschmann, P.E.; Røsberg, K.M.; Diez, A.; Viggen, E.M. Ultrasonic Well Integrity Logging Using Phased Array Technology. In Proceedings of the International Conference on Offshore Mechanics and Arctic Engineering, Melbourne, Australia, 11–16 June 2023. [Google Scholar]
- Gao, X.; Zhou, J.; Xie, H.; Du, X. Discharge Experiment and Structure Optimisation Simulation of Impulse Sound Source. Energies 2024, 17, 4565. [Google Scholar] [CrossRef]
- Gao, X.; Zhou, J.; Du, X. Simulation and Optimization of Transmitting Transducers for Well Logging. Sensors 2024, 24, 6795. [Google Scholar] [CrossRef]
- Xiandong, L.; Yi, L.; Zhiyuan, L. Observation of Underwater Pulse Discharge and Influence of Deposited Energy on Shock Wave in Non-uniform Electric Field. Proc. CSEE 2017, 37, 3028–3036. [Google Scholar]
- Luo, Q.P. Surface Ablation of W-Cu Alloy Electrodes by Discharge Arc of High Pulsed Voltage in Water: An Experimental Study. Chin. J. Vac. Sci. Technol. 2019, 39, 819–823. [Google Scholar]
- Li, W.W.; Gao, Q.; Liu, S. Research and Application of Special Pulse Capacitor for Small Pulse Power Device. Power Capacit. React. Power Compens. 2020, 41, 86–91. [Google Scholar]
- Kolb, J.F.; Joshi, R.P.; Xiao, S.; Schoenbach, K.H. Streamers in water and other dielectric liquids. J. Phys. D Appl. Phys. 2008, 41, 234007. [Google Scholar]
- Jones, H.M.; Kunhardt, E.E. Development of pulsed dielectric breakdown in liquids. J. Phys. D Appl. Phys. 1995, 28, 178. [Google Scholar] [CrossRef]
- Cook, J.A.; Gleeson, A.M.; Roberts, R.M.; Rogers, R.L. A Spark-generated Bubble Model with Semi-empirical Mass Transport. J. Acoust. Soc. Am. 1997, 101, 1908–1920. [Google Scholar]
- Roberts, R.M.; Cook, J.A.; Rogers, R.L.; Gleeson, A.M.; Griffy, T.A. The Energy Partition of Underwater Sparks. J. Acoust. Soc. Am. 1996, 99, 3465–3475. [Google Scholar]
- Eubank, P.T.; Patel, M.R.; Barrufet, M.A.; Bozkurt, B. Theoretical Models of the Electrical Discharge Machining Process. III. The Variable Mass, Cylindrical Plasma Model. J. Appl. Phys. 1993, 73, 7900. [Google Scholar] [CrossRef]
- Zhu, Z.; Lan, S.; Feng, Z.; Lu, K. Numerical Simulation of Pulsed Discharge Plasma in Water Based on COMSOL. Chin. J. Vac. Sci. Technol. 2022, 42, 304–310. [Google Scholar]
- De’en, T.; Xinlei, Z.; Xiaobing, Z. Numerical Simulation of the Preheating Process of Pulse Discharge in Water. High Volt. Eng. 2019, 45, 1461–1467. [Google Scholar]


| Structure | Size (mm) |
|---|---|
| Needle-cone top radius | 1 |
| Needle-cone bottom radius | 5 |
| Needle-cone height | 10 |
| Needle-column height | 12 |
| Rod radius | 5 |
| Rod height | 14 |
| External Circuit Parameters | Size (mm) | ||
|---|---|---|---|
| Charging voltage (kV) | 12.8 | Conductivity (S/m) | 0.07 |
| Energy storage capacitors (µF) | 15 | Initial temperature (K) | 293.15 |
| Equivalent resistance (Ω) | 0.22 | Hydrostatic pressure (Pa) | 101,325 |
| Equivalent inductance (µH) | 8.18 | Relative permittivity | 81 |
| Compared Parameters | Breakdown Voltage/kV | Pre-Breakdown Time/μs | Peak Breakdown Current/kA | Impulse Wave Intensity/Mpa |
|---|---|---|---|---|
| Experiment | 11.26 | 596.3 | 11.23 | 6.95 |
| Simulation | 10.9 | 602.56 | 11.01 | 6.75 |
| Percentage error | 3.2% | 1.05% | 11.01 | 2.88% |
| Factor | Range | Step Size |
|---|---|---|
| Charging voltage (kV) | 7–15 | 2 |
| Electrode gap (mm) | 1–5 | 1 |
| Liquid conductivity (S/m) | 0.03–0.19 | 0.04 |
| Charging Voltage (kV) | Breakdown Temperature (K) | Breakdown Voltage (kV) | Gap Average Field Strength (kV/cm) | Breakdown? |
|---|---|---|---|---|
| 10 | 777 | 8.65 | 24.71 | Yes |
| 9 | 774 | 7.45 | 21.29 | Yes |
| 8 | 775 | 6.25 | 17.8 | Yes |
| 7 | 773 | 4.88 | 13.9 | Yes |
| 6 | 776 | 3.43 | 9.8 | Yes |
| 5 | 719 | 1.09 | 3.11 | No |
| Pre-Breakdown Time (µs) | Breakdown Voltage (kV) | Gap Average Field Strength (kV/cm) | Peak Breakdown Current (kA) | Peak Impulse Wave Intensity (MPa) | Peak System Power (kW) |
|---|---|---|---|---|---|
| 606.9 | 3.43 | 9.8 | 3.53 | 4.78 | 20.95 |
Disclaimer/Publisher’s Note: The statements, opinions and data contained in all publications are solely those of the individual author(s) and contributor(s) and not of MDPI and/or the editor(s). MDPI and/or the editor(s) disclaim responsibility for any injury to people or property resulting from any ideas, methods, instructions or products referred to in the content. |
© 2025 by the authors. Licensee MDPI, Basel, Switzerland. This article is an open access article distributed under the terms and conditions of the Creative Commons Attribution (CC BY) license (https://creativecommons.org/licenses/by/4.0/).
Share and Cite
Du, X.; Zhou, J.; Gao, X. Electroacoustic Analysis and Optimization of Needle-Rod Electrodes for Low-Power Impulse Sound Source. Sensors 2025, 25, 2331. https://doi.org/10.3390/s25072331
Du X, Zhou J, Gao X. Electroacoustic Analysis and Optimization of Needle-Rod Electrodes for Low-Power Impulse Sound Source. Sensors. 2025; 25(7):2331. https://doi.org/10.3390/s25072331
Chicago/Turabian StyleDu, Xiao, Jing Zhou, and Xu Gao. 2025. "Electroacoustic Analysis and Optimization of Needle-Rod Electrodes for Low-Power Impulse Sound Source" Sensors 25, no. 7: 2331. https://doi.org/10.3390/s25072331
APA StyleDu, X., Zhou, J., & Gao, X. (2025). Electroacoustic Analysis and Optimization of Needle-Rod Electrodes for Low-Power Impulse Sound Source. Sensors, 25(7), 2331. https://doi.org/10.3390/s25072331