
A Fuzzy-Based Model to Detect Hotspots of Air Pollutants During Heatwaves in Urban Settlements


Abstract
1. Introduction
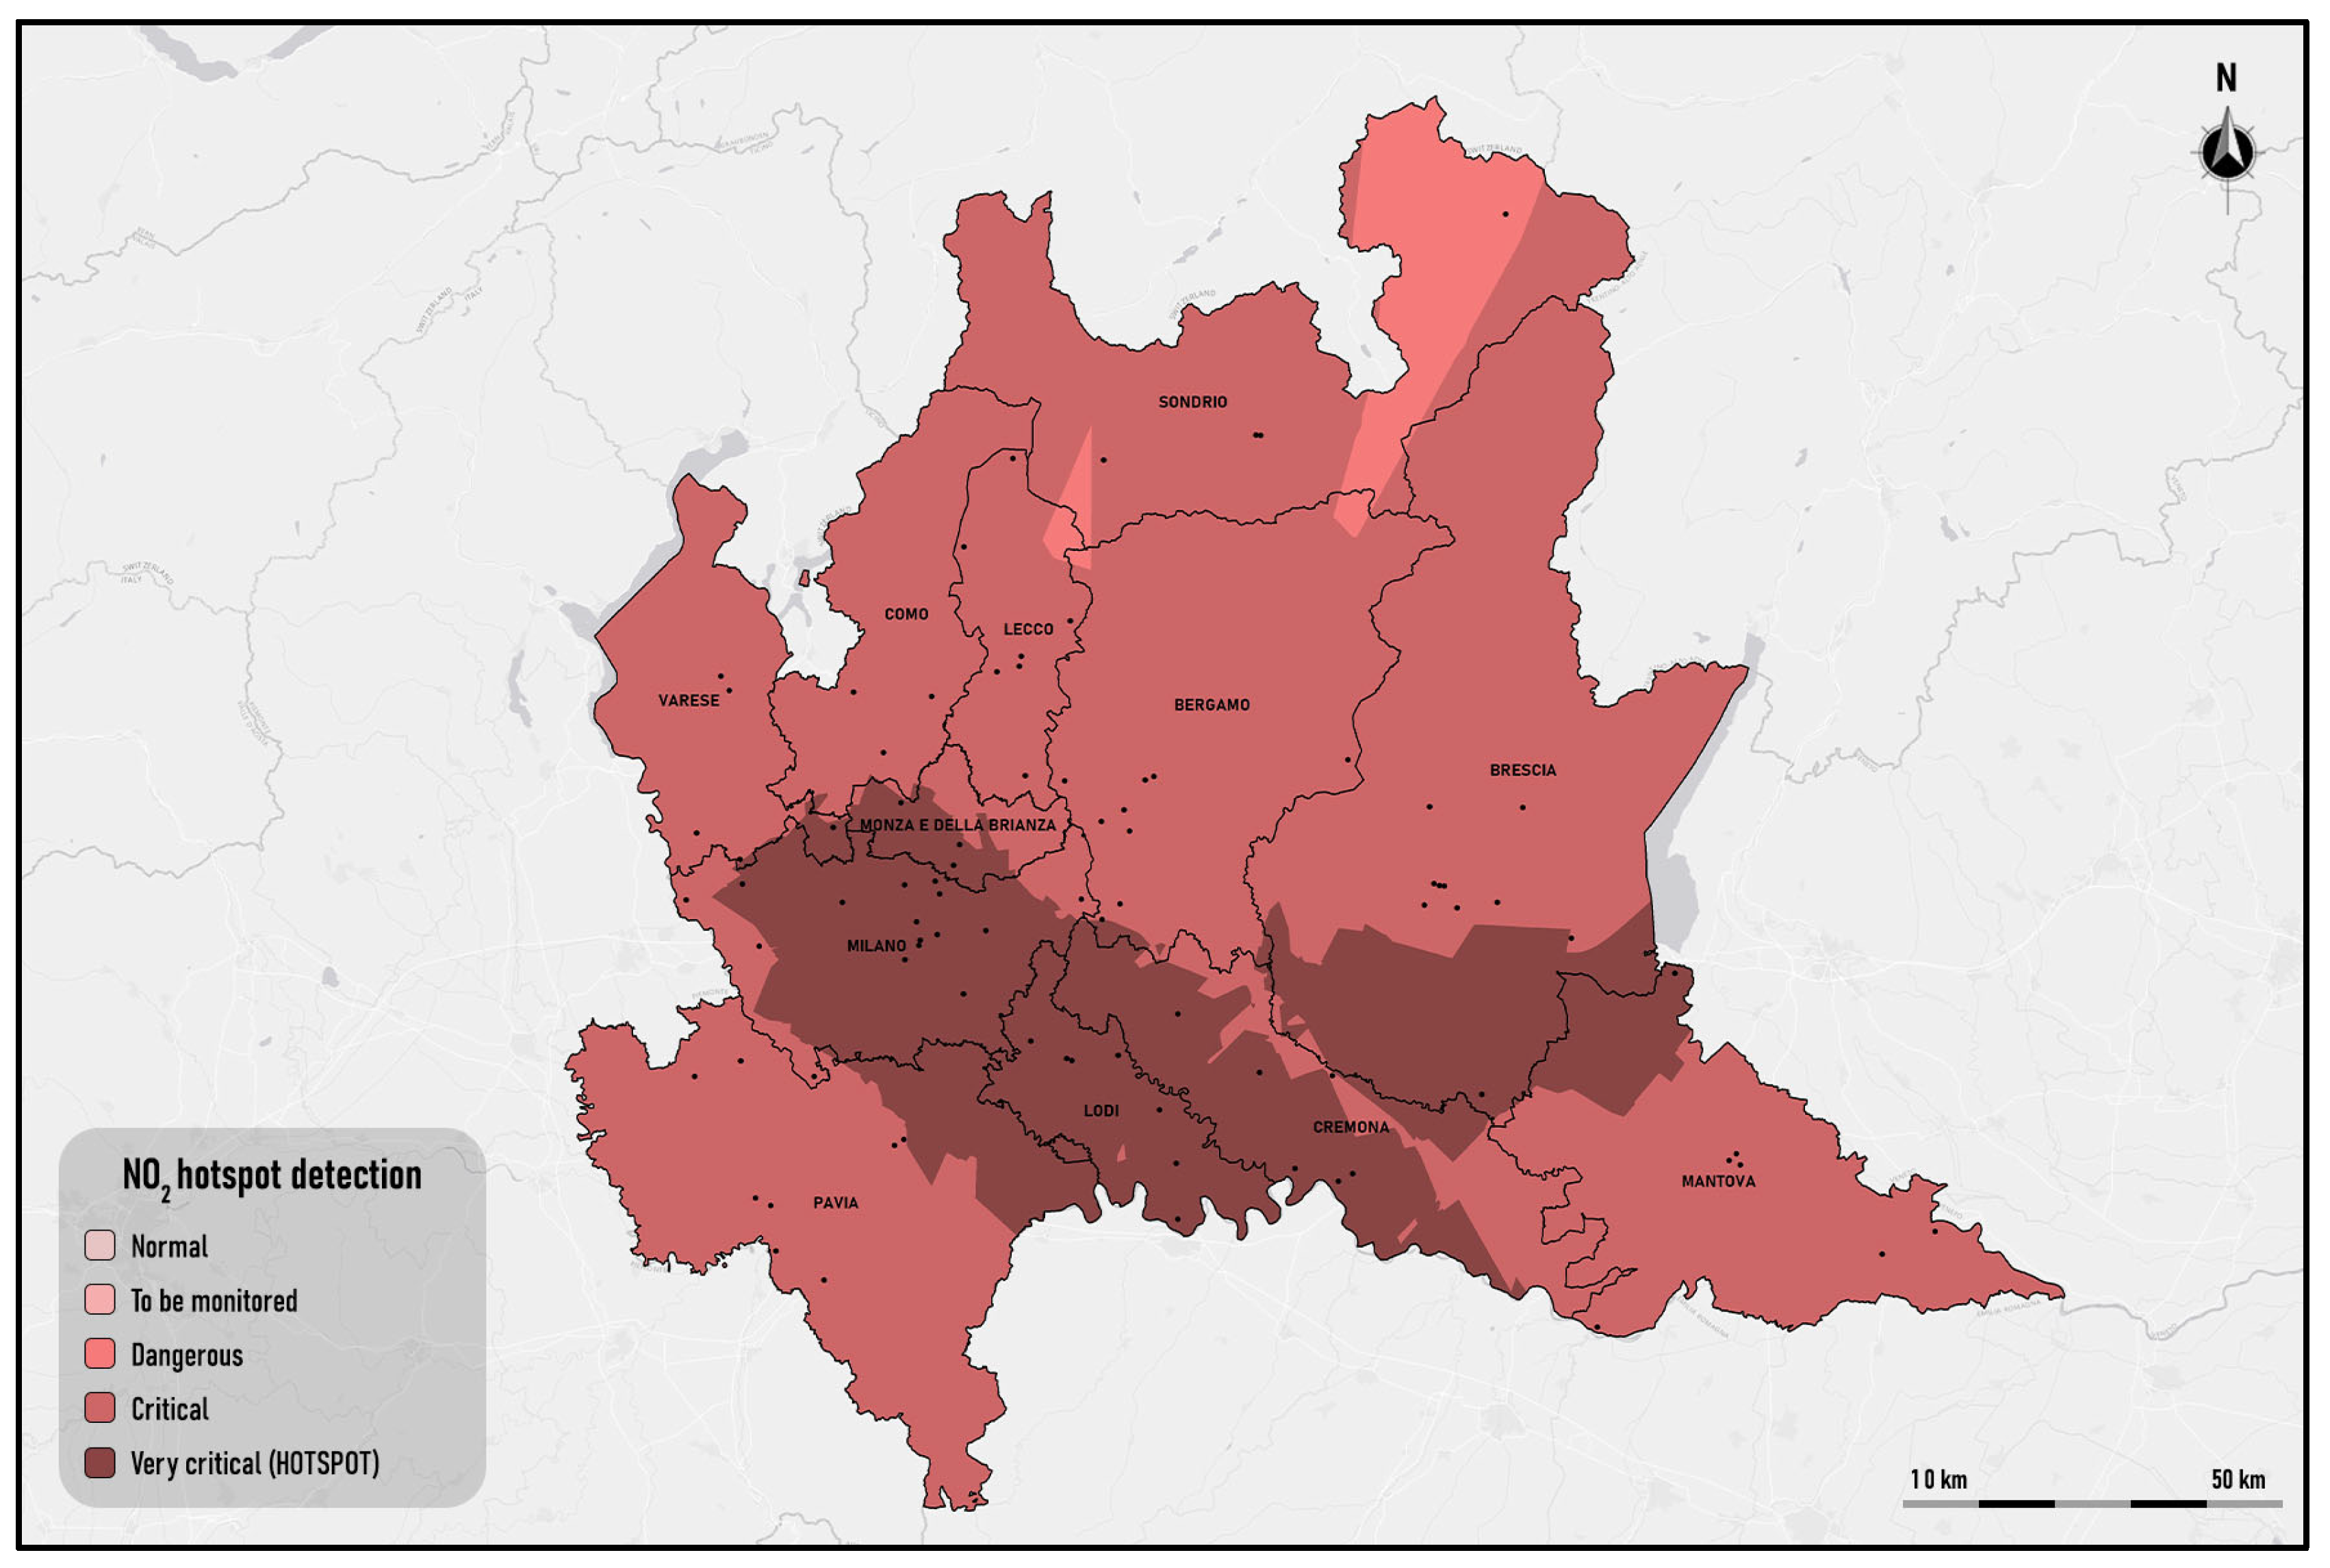
- Identification of critical air pollution areas during heatwaves: this study proposes an innovative method to detect urban air pollution hotspots during heatwaves, identifying the areas most at risk in terms of the health of vulnerable populations.
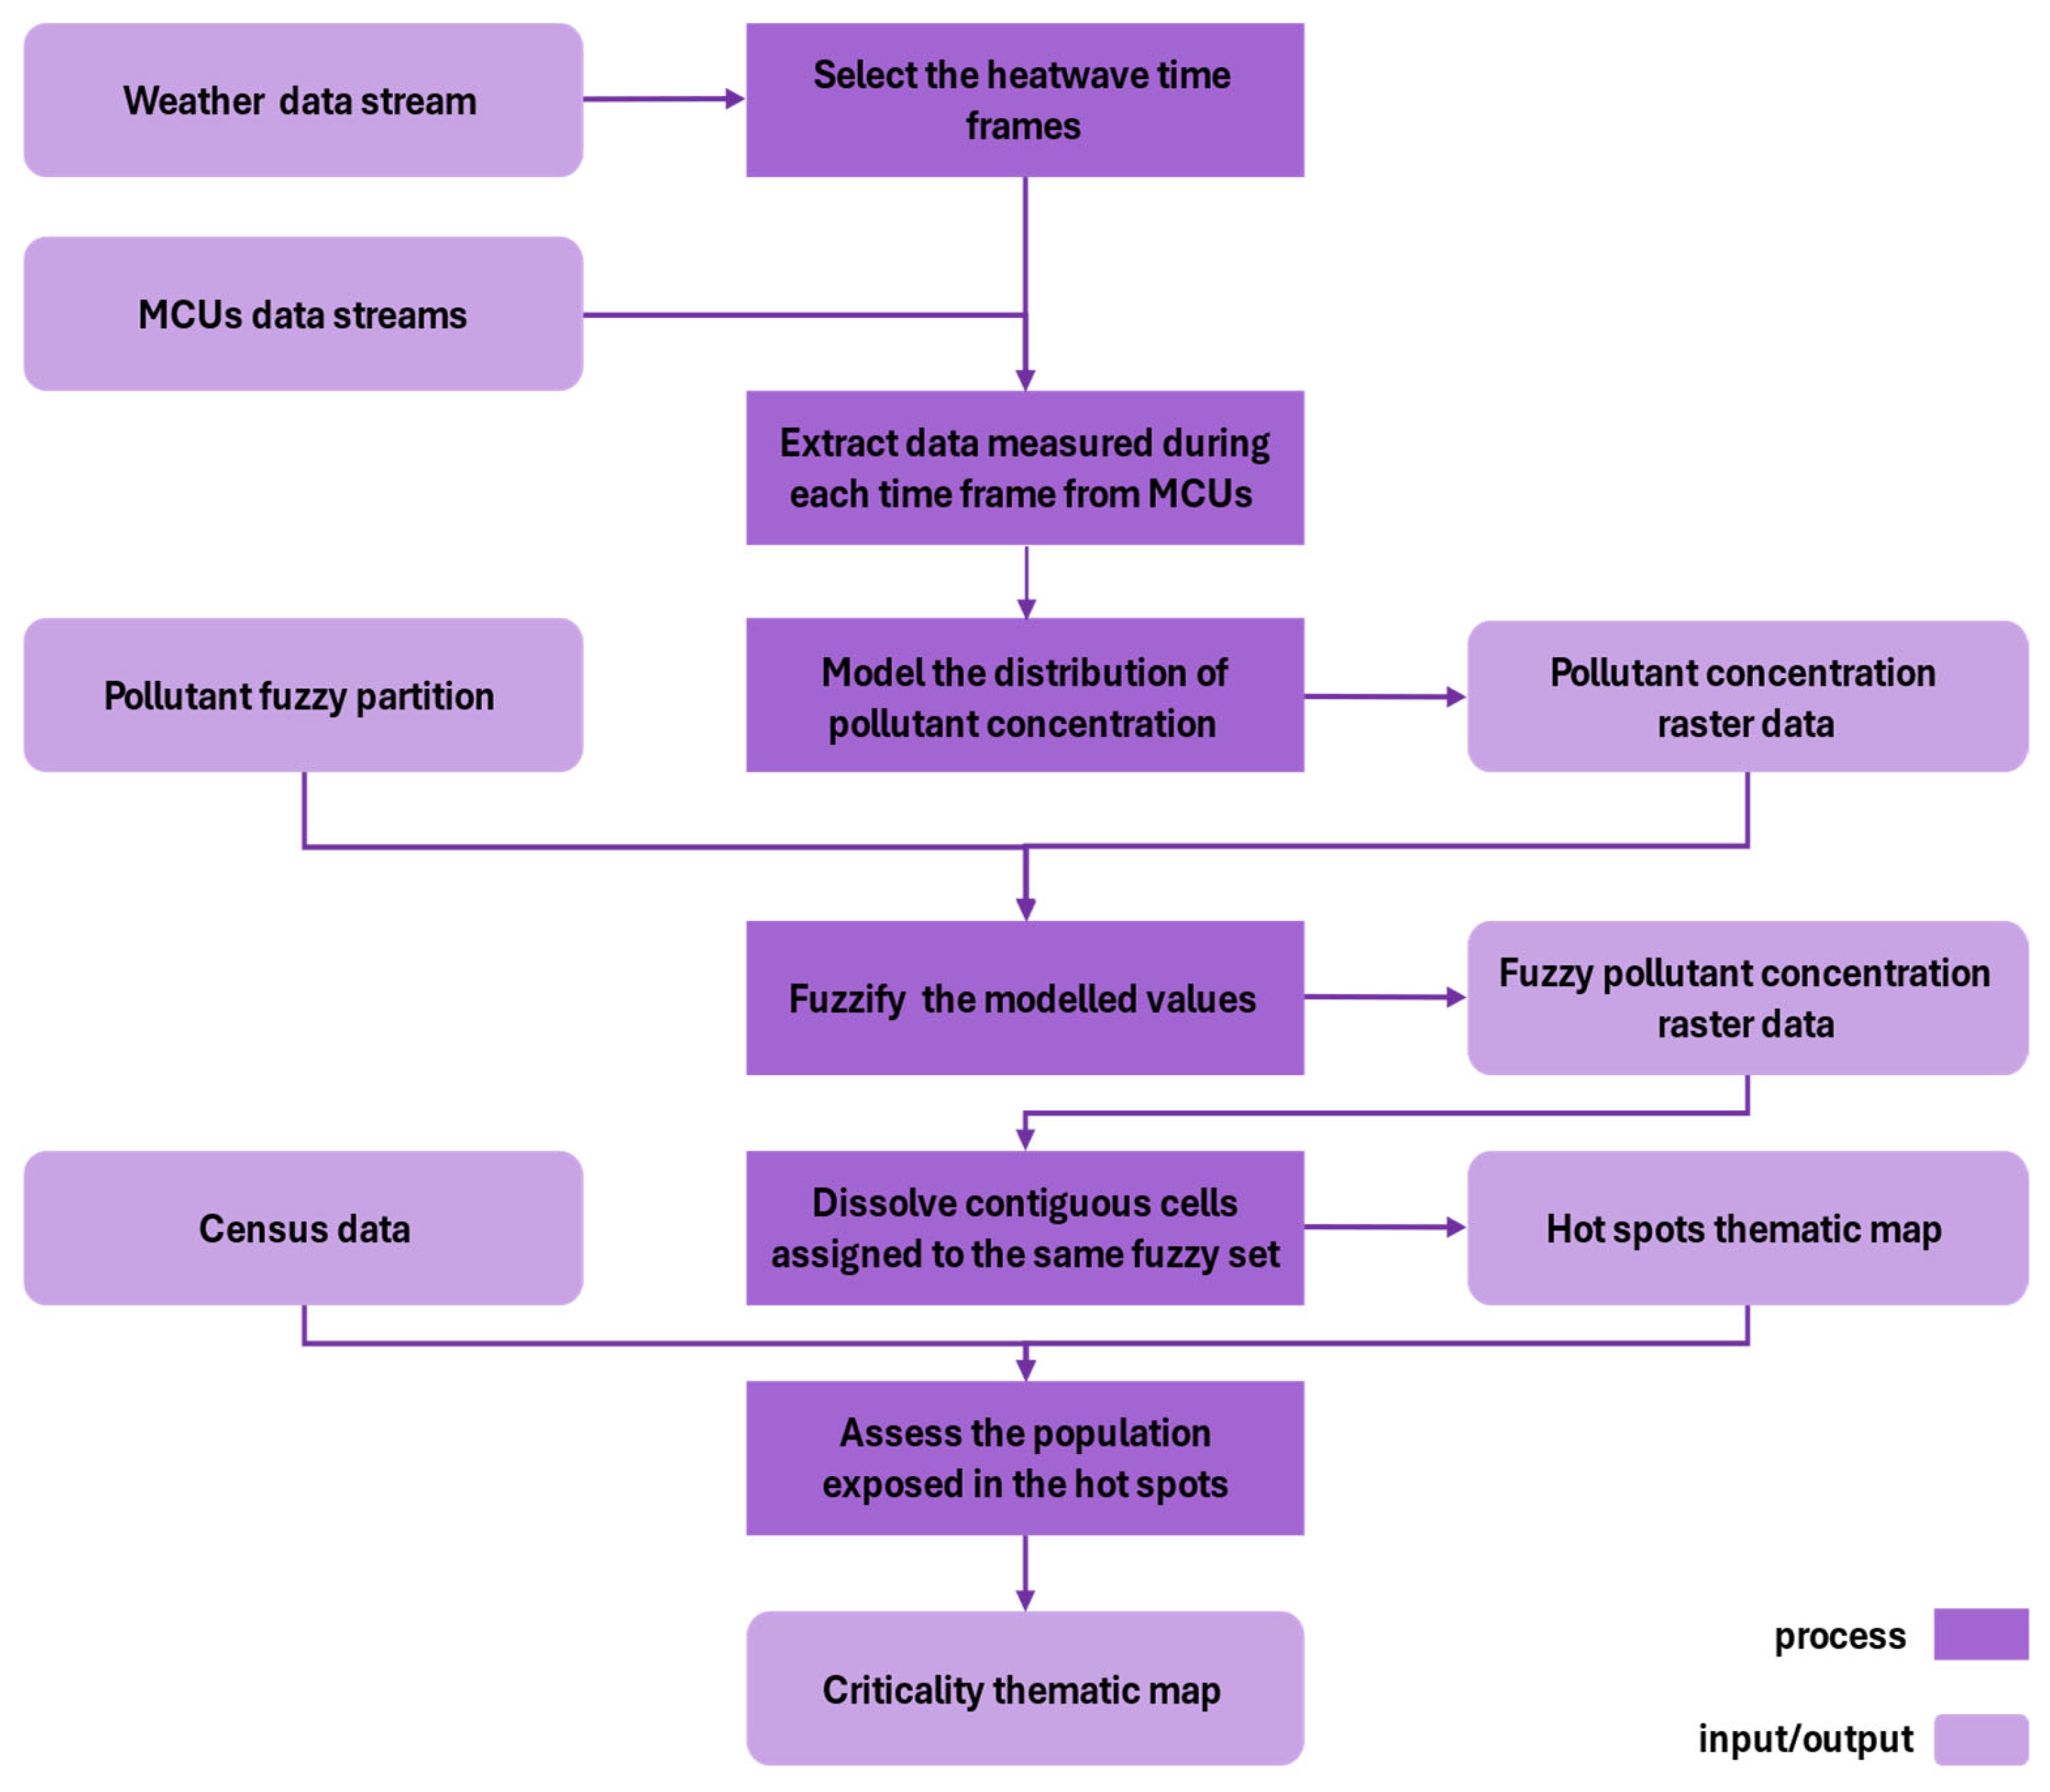
- Methodological approach based on temporal and spatial analysis: the method includes a preliminary preprocessing phase to identify heatwave periods and collect daily data on air pollutant concentrations, normalizing the values according to the duration of the event.
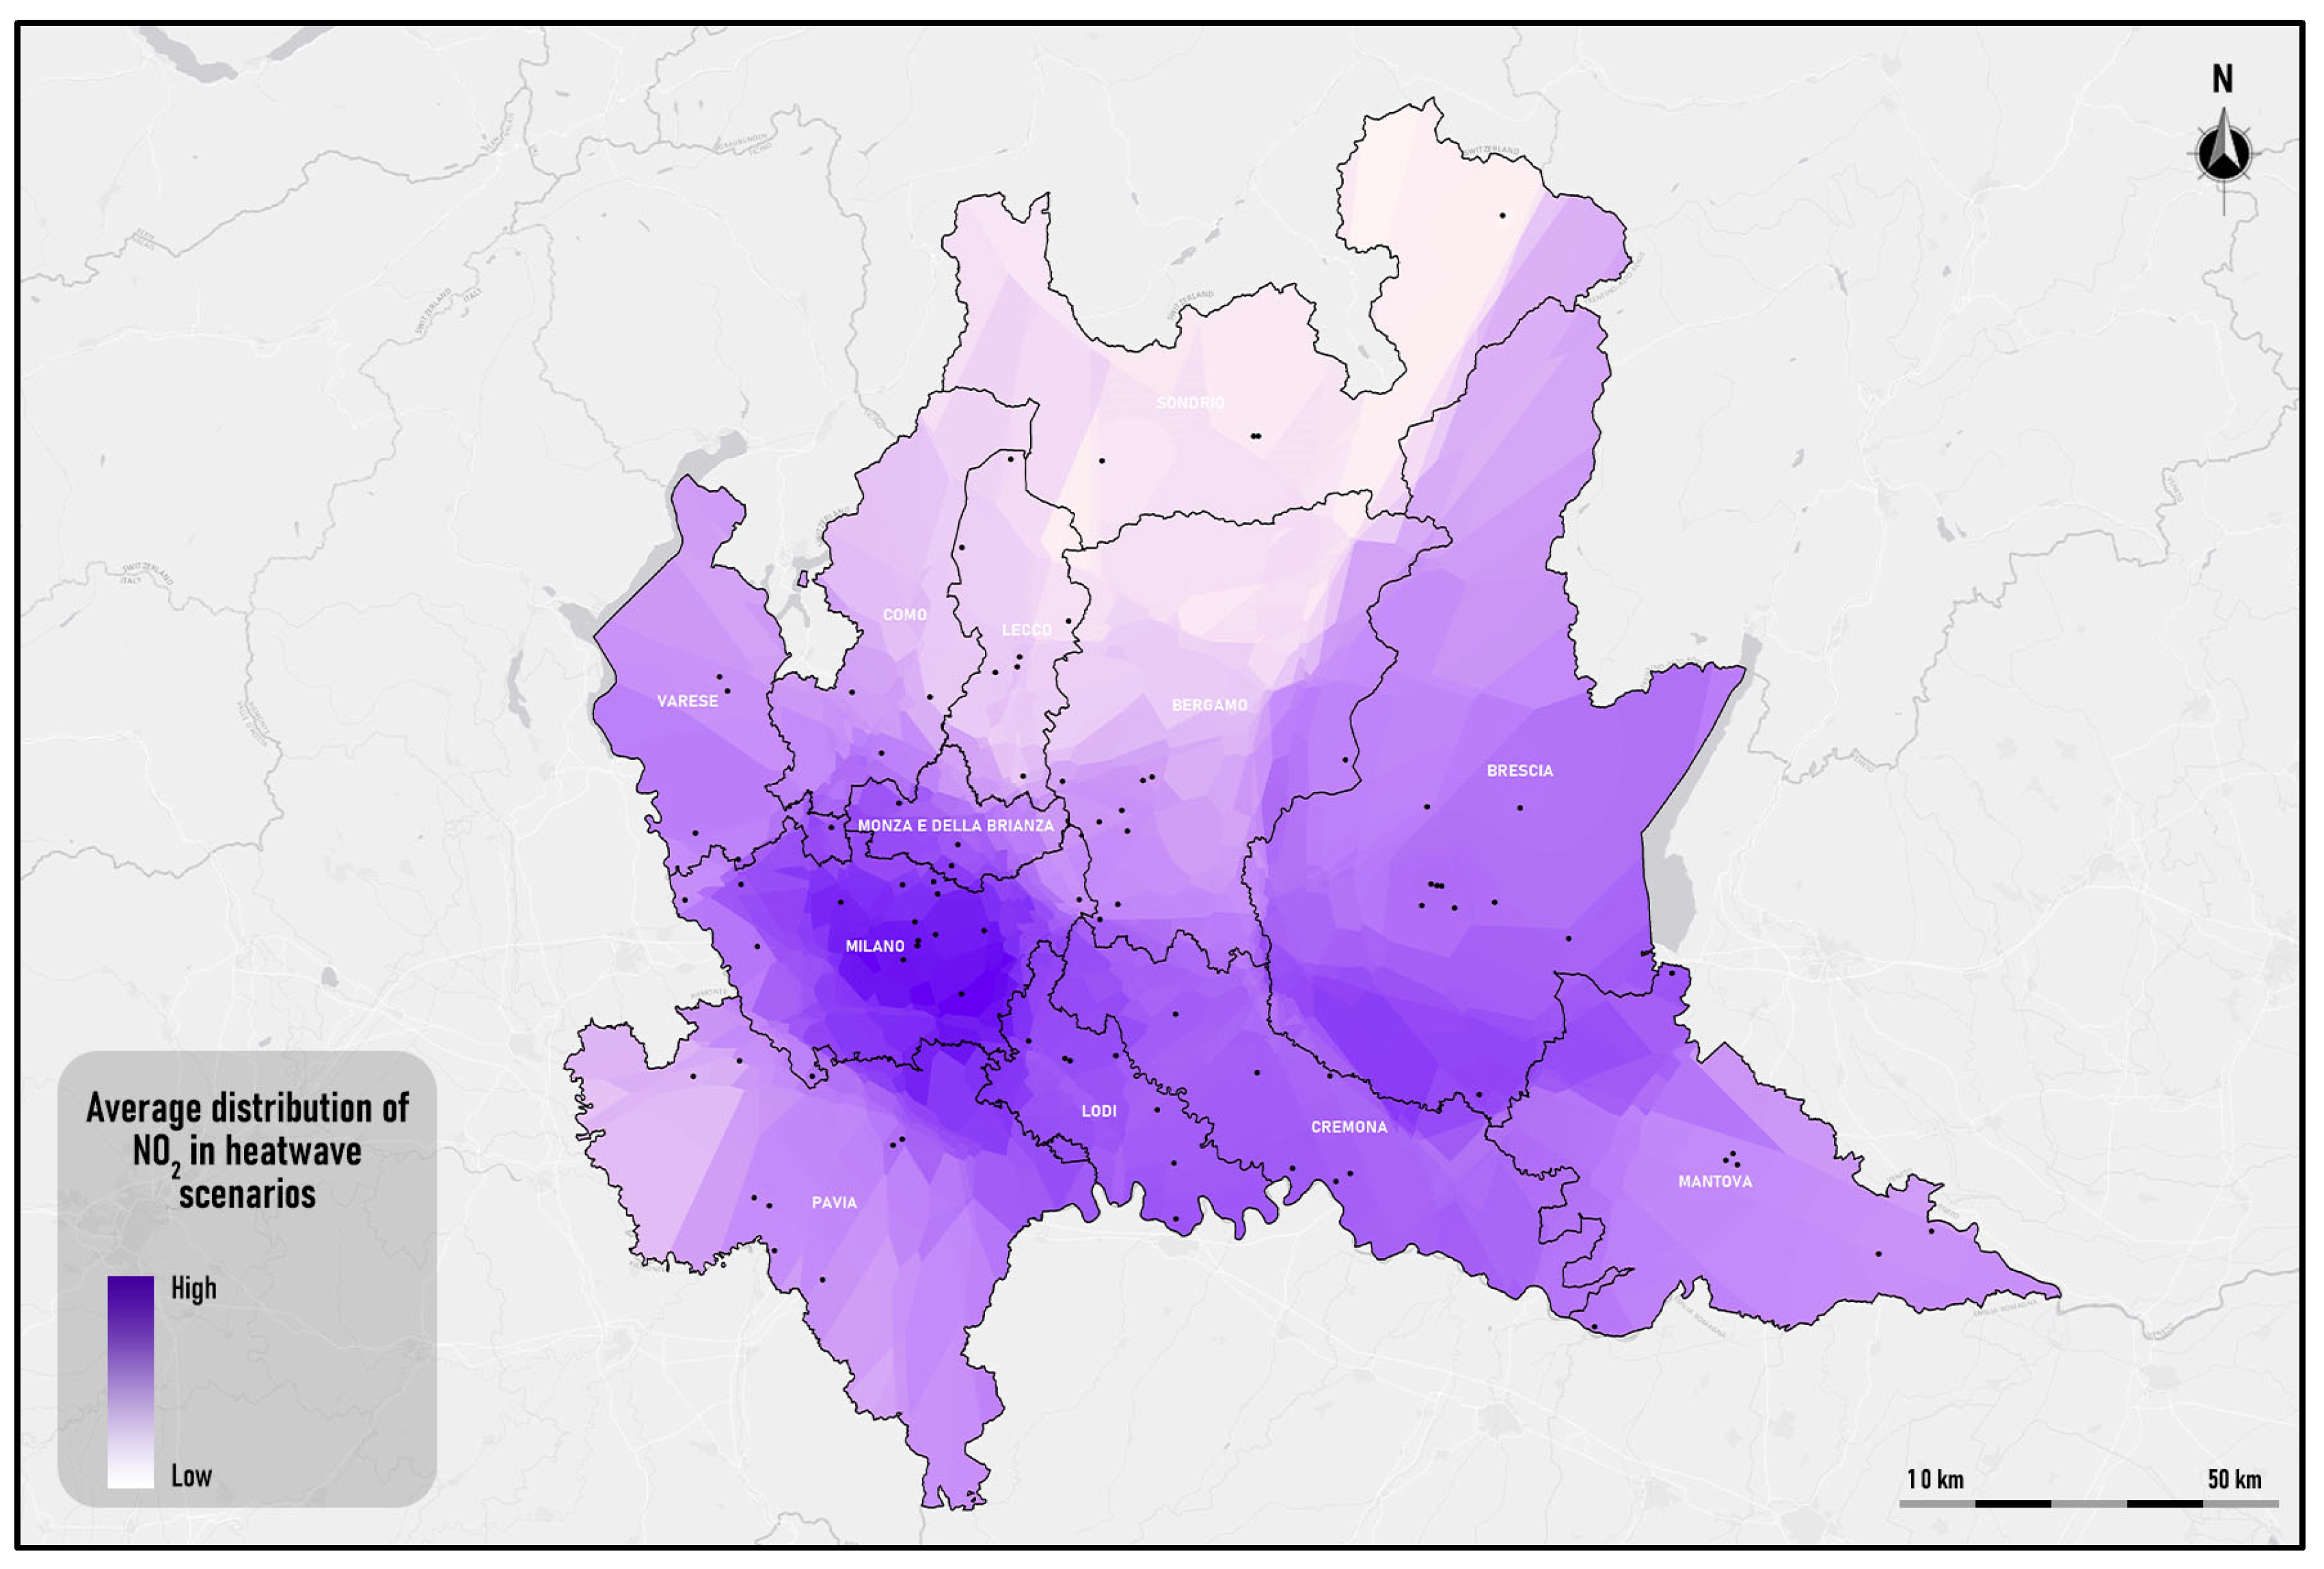
- Spatial interpolation to model pollutant distribution: using spatial interpolation techniques, the model constructs a detailed representation of pollutant distribution during critical periods.
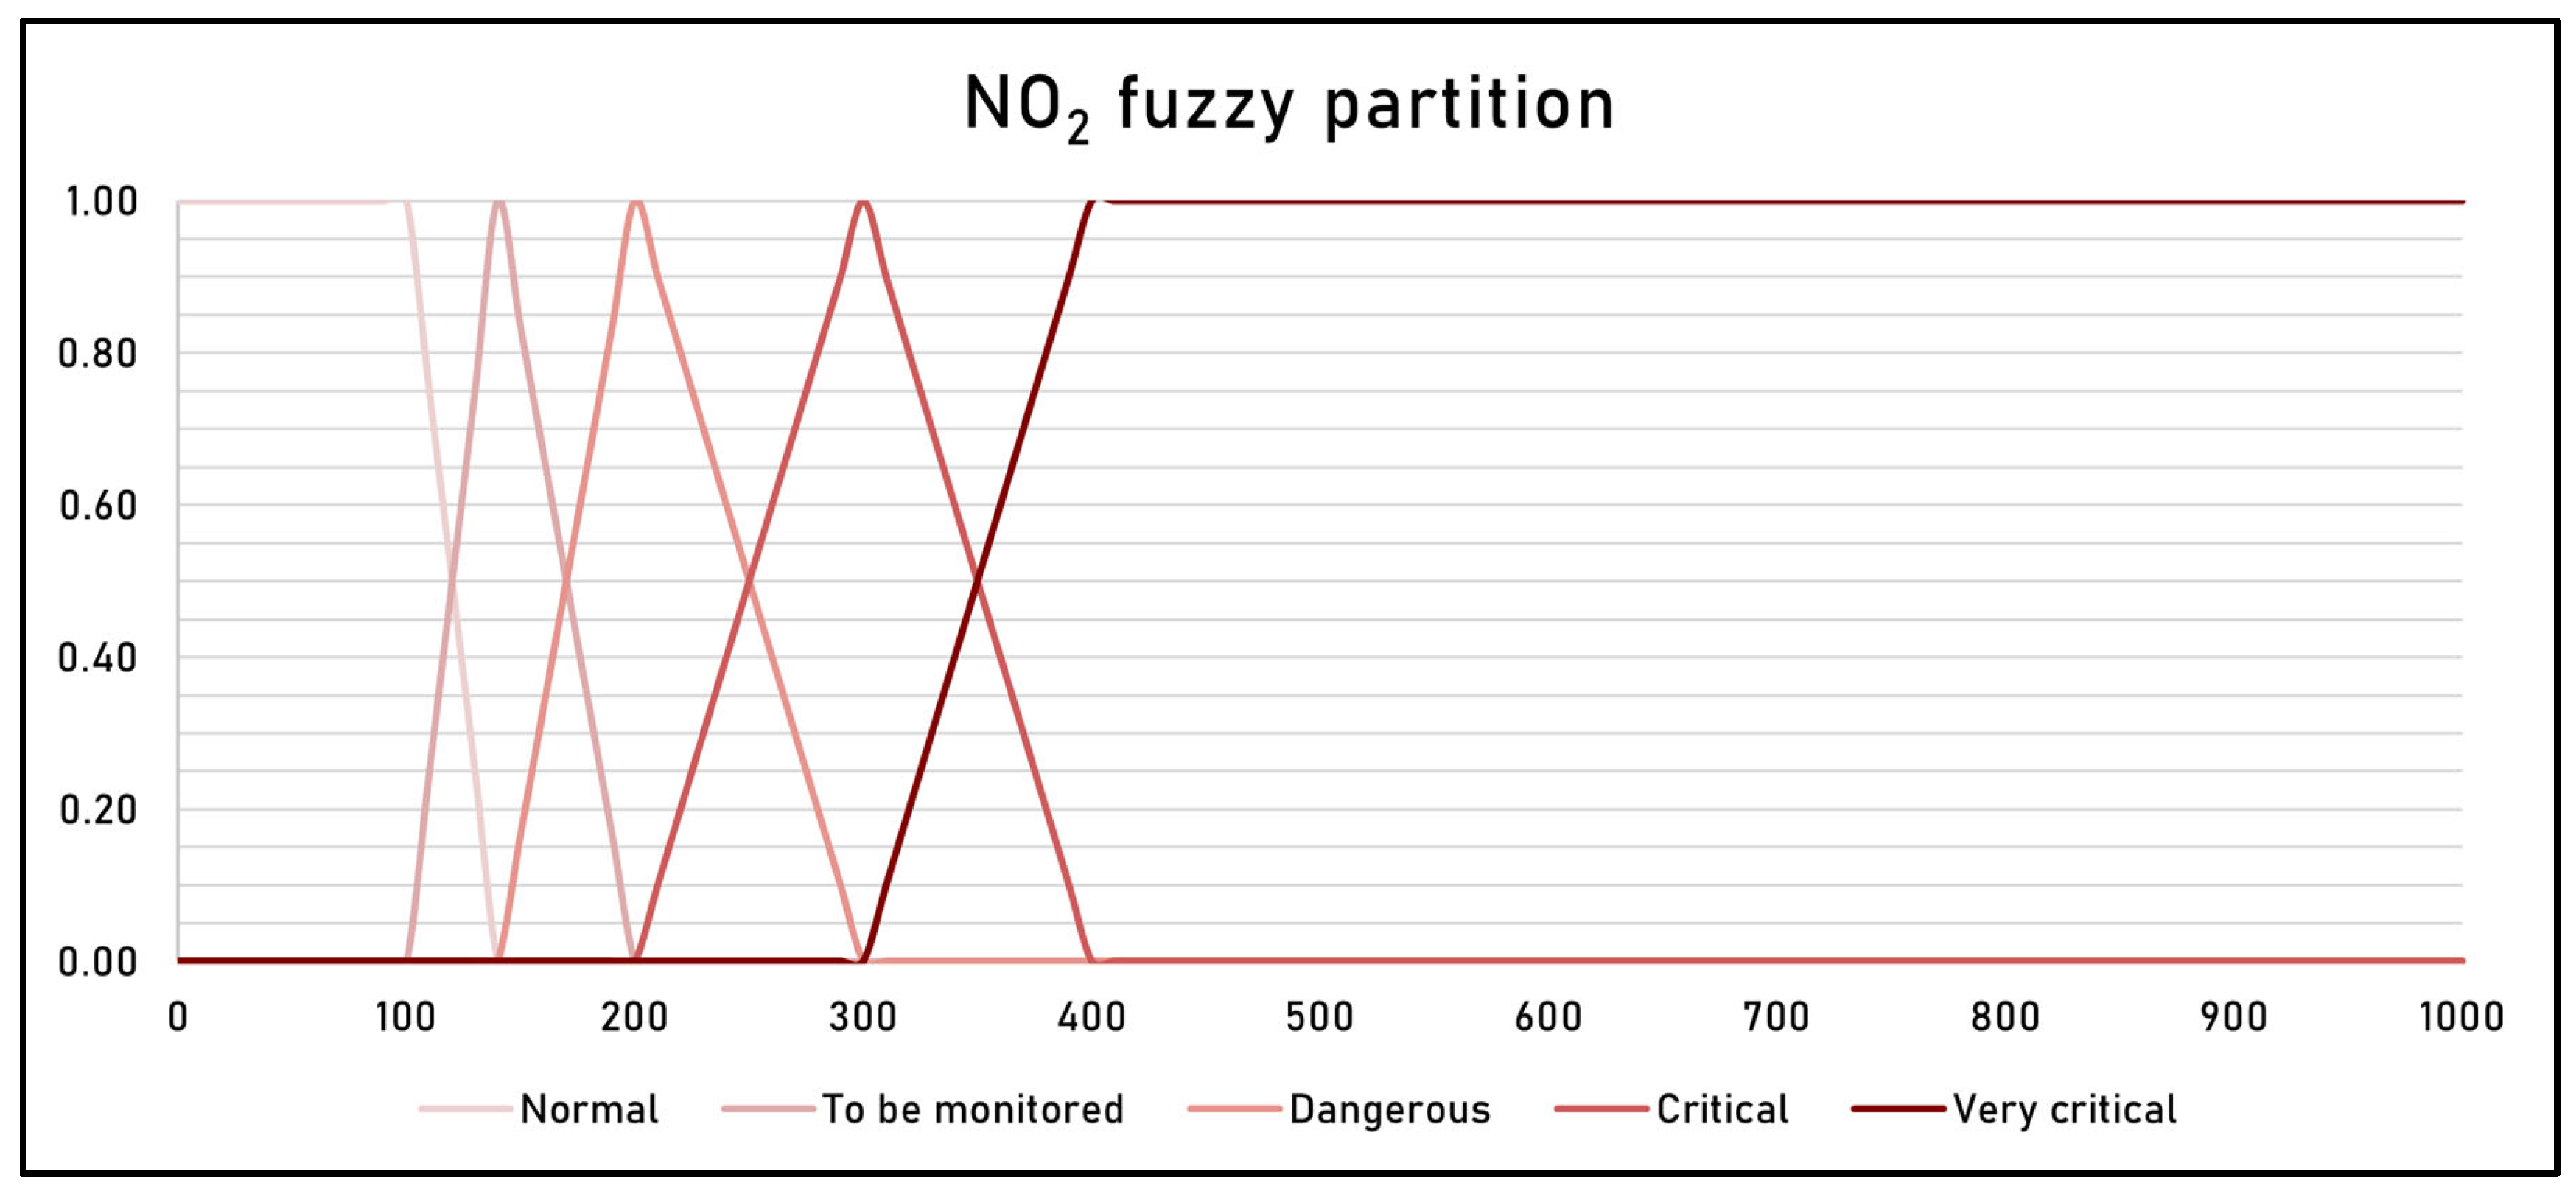
- Classification of urban areas through fuzzification: a fuzzification process classifies urban areas based on their level of health risk, highlighting the most critical hotspots.
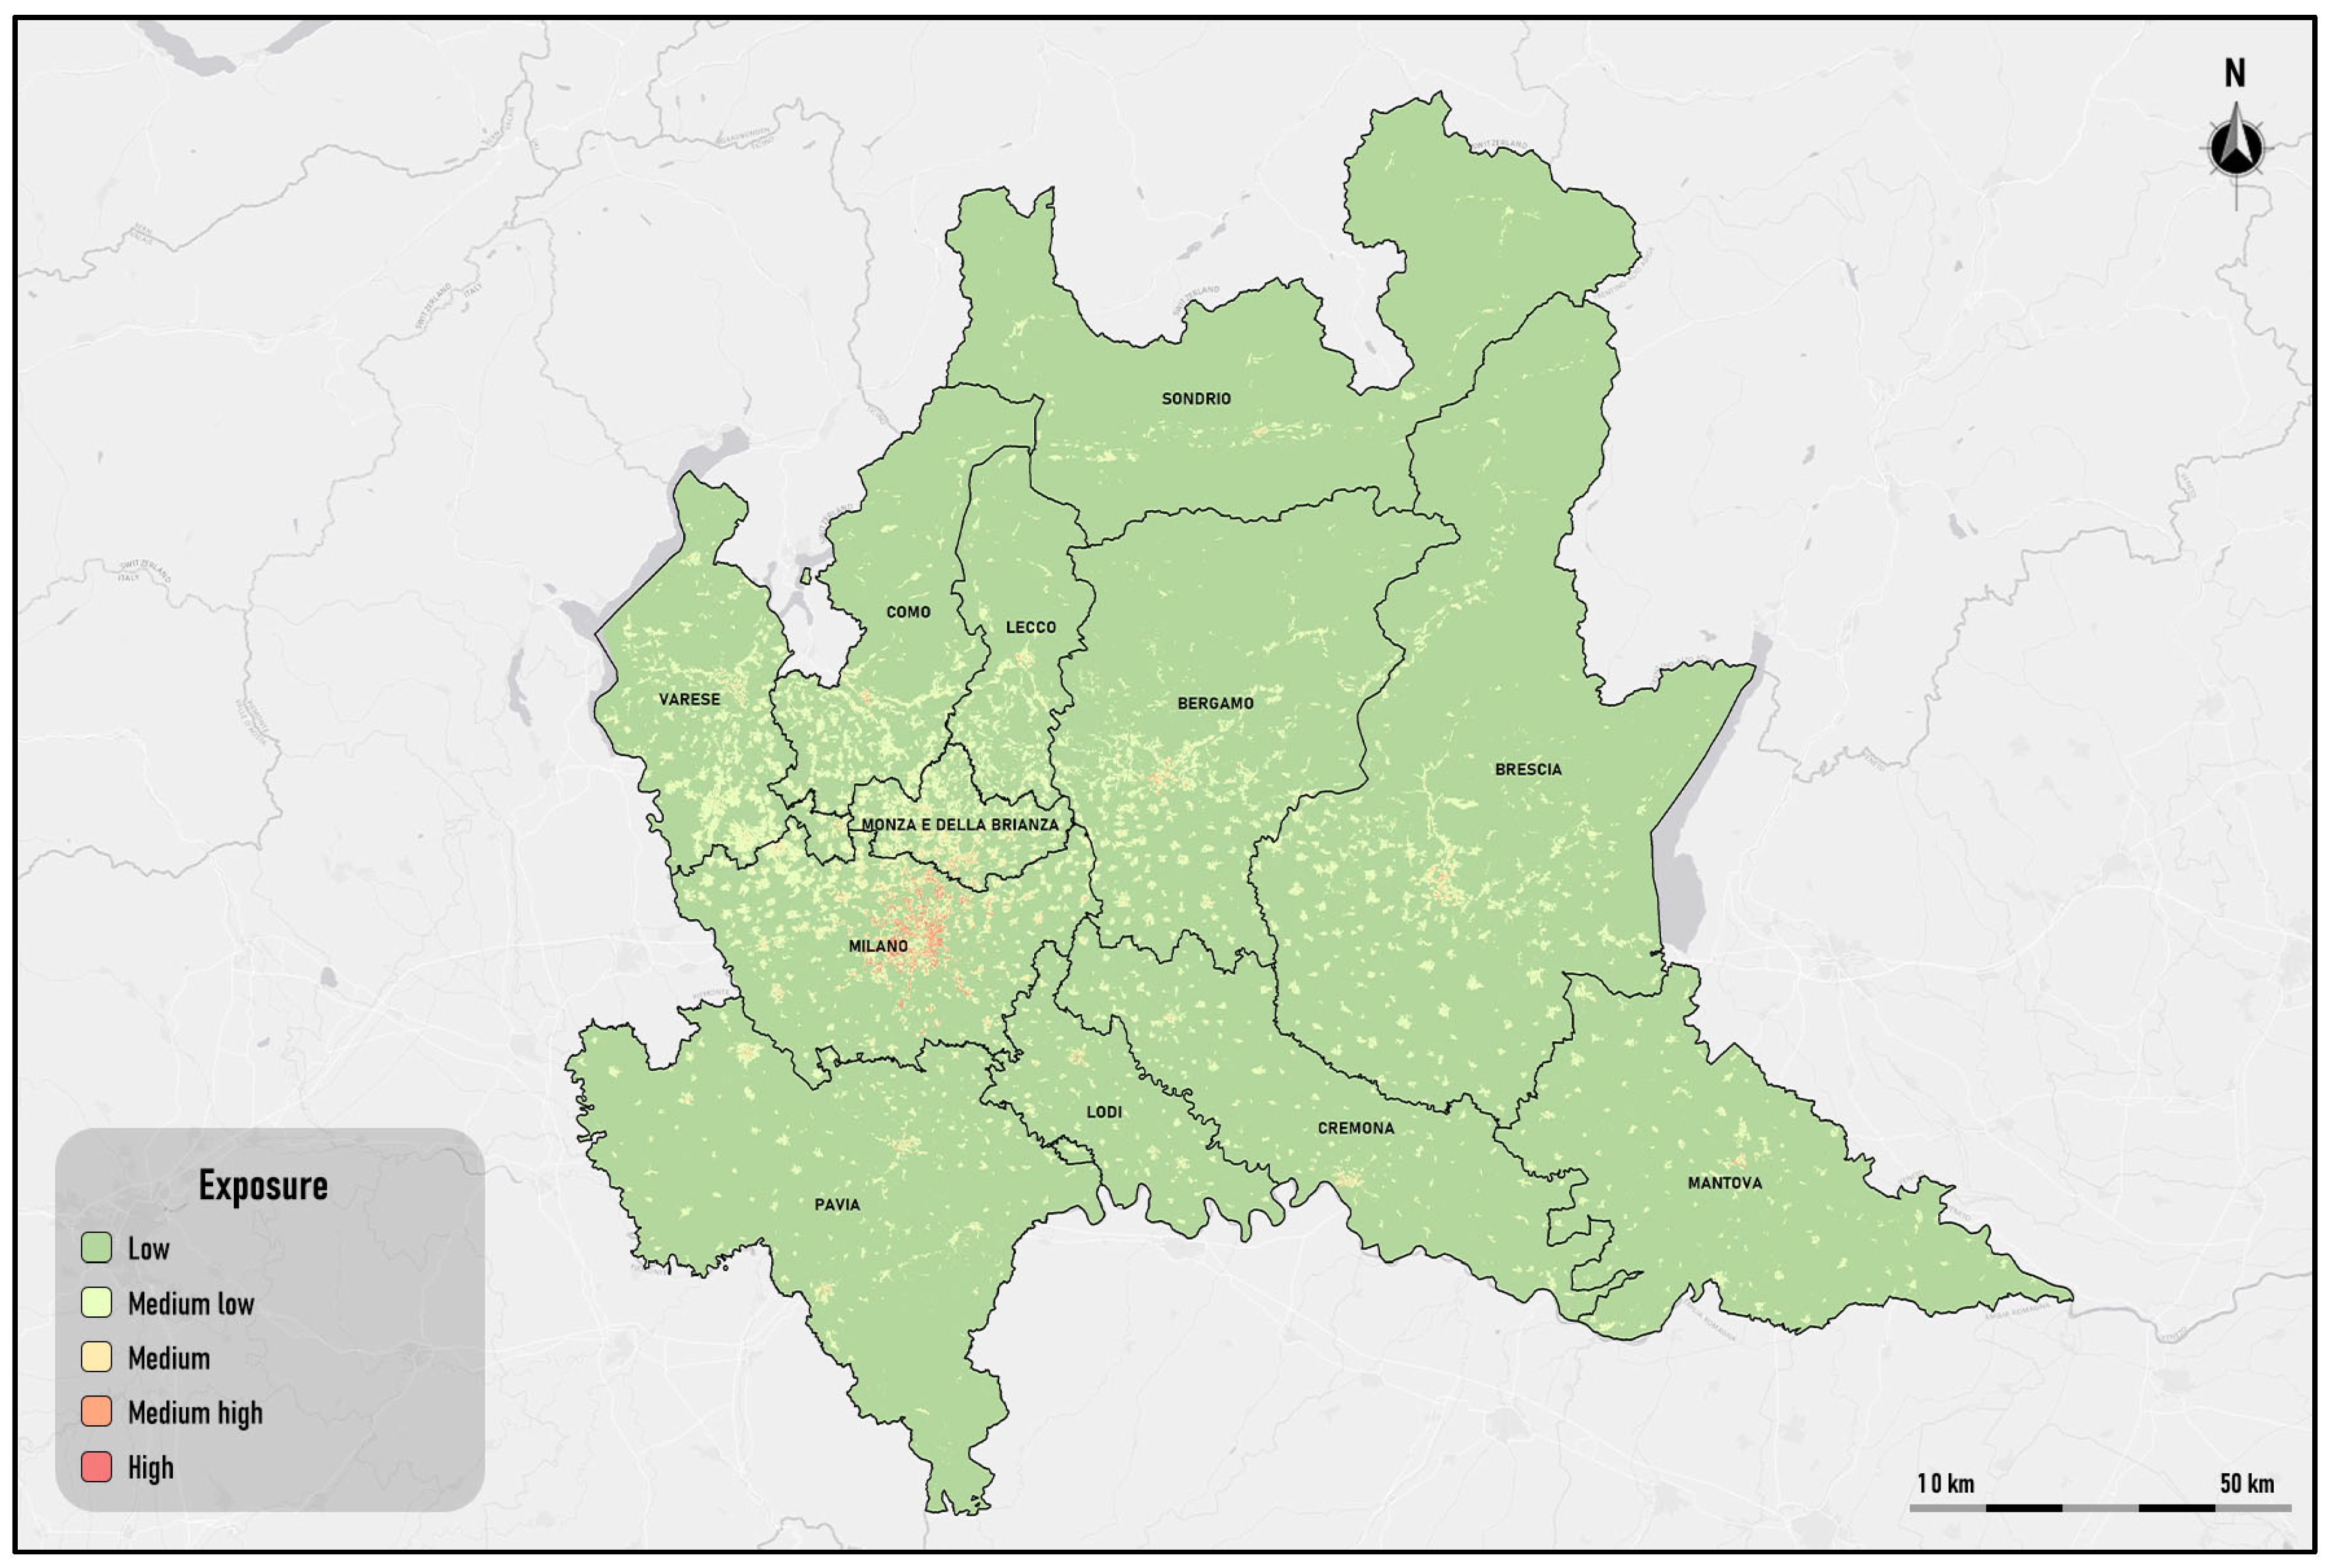
- Generation of criticality maps for public health protection: the method produces risk maps that identify urban areas with higher densities of vulnerable populations, supporting the planning of targeted interventions.
- High transferability and ease of implementation: the model stands out for its high transferability, requiring only a limited amount of data (daily measurements from monitoring stations and demographic data), making it easily applicable to different urban contexts.
- Decision support for urban planning and environmental policies: by providing a simple yet effective tool, this method can assist local authorities in designing air pollution mitigation strategies and protecting public health.
2. Related Research
3. Materials and Methods
The Case Study
4. Results and Discussion
5. Conclusions
Author Contributions
Funding
Institutional Review Board Statement
Informed Consent Statement
Data Availability Statement
Conflicts of Interest
References
- Bourdrel, T.; Bind, M.A.; Béjot, Y.; Morel, O.; Argacha, J.F. Cardiovascular effects of air pollution. Arch. Cardiovasc. Dis. 2017, 110, 634–642. [Google Scholar] [CrossRef]
- Brunekreef, B.; Strak, M.; Chen, J.; Andersen, Z.J.; Atkinson, R.; Bauwelinck, M.; Bellander, T.; Boutron, M.-C.; Brandt, J.; Carey, I.; et al. Mortality and Morbidity Effects of Long-Term Exposure to Low-Level PM2.5, BC, NO2, and O3: An Analysis of European Cohorts in the ELAPSE Project. Res. Rep. Health Eff. Inst. 2021, 2021, 208. [Google Scholar]
- Brauer, M.; Brook, J.R.; Christidis, T.; Chu, Y.; Crouse, D.L.; Erickson, A.; Hystad, P.; Li, C.; Martin, R.V.; Meng, J.; et al. Mortality-Air Pollution Associations in Low Exposure Environments (MAPLE): Phase 2. Res. Rep. Health Eff. Inst. 2022, 2022, 212. [Google Scholar]
- Henning, R.J. Particulate Matter Air Pollution is a Significant Risk Factor for Cardiovascular Disease. Curr. Probl. Cardiol. 2024, 49, 102094. [Google Scholar] [CrossRef]
- Zhou, W.; Wang, Q.; Li, R.; Kadier, A.; Wang, W.; Zhou, F.; Ling, L. Combined effects of heatwaves and air pollution, green space and blue space on the incidence of hypertension: A national cohort study. Sci. Total Environ. 2023, 867, 161560. [Google Scholar] [CrossRef]
- Rahman Md, M.; McConnell, R.; Schlaerth, H.; Ko, J.o.s.e.p.h.; Silva, S.; Lurmann, F.W.; Palinkas, L.; Johnston, J.; Hurlburt, M.; Yin, H.; et al. The Effects of Coexposure to Extremes of Heat and Particulate Air Pollution on Mortality in California: Implications for Climate Change. Am. J. Respir. Crit. Care Med. 2022, 206, 1117–1127. [Google Scholar] [CrossRef]
- D’Amato, G.; Vitale, C.; De Martino, A.; Viegi, G.; Lanza, M.; Molino, A.; Sanduzzi, A.; Vatrella, A.; Annesi-Maesano, I.; D’Amato, M. Effects on asthma and respiratory allergy of Climate change and air pollution. Multidiscip. Respir. Med. 2015, 10, 39. [Google Scholar] [CrossRef]
- Bartholy, J.; Pongrácz, R. A brief review of health-related issues occurring in urban areas related to global warming of 1.5 °C. Curr. Opin. Environ. Sustain. 2018, 30, 123–132. [Google Scholar] [CrossRef]
- Cardone, B.; Di Martino, F. Fuzzy-Based Spatiotemporal Hot Spot Intensity and Propagation—An Application in Crime Analysis. Electronics 2022, 11, 370. [Google Scholar] [CrossRef]
- He, B.-J.; Ding, L.; Prasad, D. Enhancing urban ventilation performance through the development of precinct ventilation zones: A case study based on the Greater Sydney, Australia. Sustain. Cities Soc. 2019, 47, 101472. [Google Scholar] [CrossRef]
- Badach, J.; Voordeckers, D.; Nyka, L.; Van Acker, M. A framework for Air Quality Management Zones—Useful GIS-based tool for urban planning: Case studies in Antwerp and Gdańsk. Build. Environ. 2020, 174, 106743. [Google Scholar] [CrossRef]
- Oji, S.; Adamu, H. Air Pollution Exposure Mapping by GIS in Kano Metropolitan Area. Pollution 2021, 7, 101–112. [Google Scholar] [CrossRef]
- Goyal, P.; Gulia, S.; Goyal, S.K. Identification of air pollution hotspots in urban areas—An innovative approach using monitored concentrations data. Sci. Total Environ. 2021, 798, 149143. [Google Scholar] [CrossRef]
- Desouza, P.; Anjomshoaa, A.; Duarte, F.; Kahn, R.; Kumar, P.; Ratti, C. Air quality monitoring using mobile low-cost sensors mounted on trash-trucks: Methods development and lessons learned. Sustain. Cities Soc. 2020, 60, 102239. [Google Scholar] [CrossRef]
- Cardone, B.; Di Martino, F.; Miraglia, V. A GIS-Based Hot and Cold Spots Detection Method by Extracting Emotions from Social Streams. Future Internet 2023, 15, 23. [Google Scholar] [CrossRef]
- Cardone, B.; Di Martino, F.; Miraglia, V. A GIS-Based Fuzzy Model to Detect Critical Polluted Urban Areas in Presence of Heatwave Scenarios. Computers 2024, 13, 143. [Google Scholar] [CrossRef]
- Lin, Y.-P.; Chu, H.-J.; Wu, C.-F.; Chang, T.-K.; Chen, C.-Y. Hotspot Analysis of Spatial Environmental Pollutants Using Kernel Density Estimation and Geostatistical Techniques. Int. J. Environ. Res. Public Health 2011, 8, 75–88. [Google Scholar] [CrossRef]
- Wang, J.; Li, H.; Lu, H. Application of a novel early warning system based on fuzzy time series in urban air quality forecasting in China. Appl. Soft Comput. 2018, 71, 783–799. [Google Scholar] [CrossRef]
- Koo, J.W.; Wong, S.W.; Selvachandran, G.; Long, H.V. Prediction of Air Pollution Index in Kuala Lumpur using fuzzy time series and statistical models. Air Qual. Atmos. Health 2020, 75, 107–111. [Google Scholar] [CrossRef]
- Alyousifi, Y.; Othman, M.; Sokkalingam, R.; Faye, I.; Silva, P.C.L. Predicting Daily Air Pollution Index Based on Fuzzy Time Series Markov Chain Model. Symmetry 2020, 12, 293. [Google Scholar] [CrossRef]
- Navares, L.; Aznarte, J.L. Predicting air quality with deep learning LSTM: Towards comprehensive models. Ecol. Inform. 2020, 55, 101019. [Google Scholar] [CrossRef]
- Mao, W.; Wang, W.; Jiao, L.; Zhao, S.; Liu, A. Modeling air quality prediction using a deep learning approach: Method optimization and evaluation Sustainable. Cities Soc. 2021, 65, 102567. [Google Scholar] [CrossRef]
- Bacanin, B.N.; Sarac, M.; Budimirovic, N.; Zivkovic, M.; AlZubi, A.A.; Bashir, A.K. Smart wireless health care system using graph LSTM pollution prediction and dragonfly node localization. Sustain. Comput. Inform. Syst. 2022, 35, 100711. [Google Scholar] [CrossRef]
- Lavana, H.; Prathik, N.R. Deep Learning-Based Air Pollution Forecasting System Using Multivariate LSTM. In Artificial Intelligence Tools and Technologies for Smart Farming and Agriculture Practices; Gupta, R.K., Jain, A., Wang, J., Bharti, S.K., Patel, S., Eds.; IGI Global Publishing: Beijing, China, 2023; pp. 101–114. [Google Scholar] [CrossRef]
- Drewil, G.I.; Al-Bahadili, R.J. Air pollution prediction using LSTM deep learning and metaheuristics algorithms. Meas. Sens. 2022, 24, 100546. [Google Scholar] [CrossRef]
- D’Ambrosio, V.; Di Martino, F.; Miraglia, M. A GIS-based framework to assess heatwave vulnerability and impact scenarios in urban systems. Sci. Rep. 2023, 13, 13073. [Google Scholar] [CrossRef]
- Anderson, G.B.; Bell, M.L.; Peng, R.D. Methods to Calculate the Heat Index as an Exposure Metric in Environmental Health Research. Environ. Health Perspect. 2013, 121, 1111–1119. [Google Scholar] [CrossRef]
- Ruspini, E.H. A new approach to clustering. Inf. Control. 1969, 15, 22–32. [Google Scholar] [CrossRef]
- World Health Organization. WHO Global Air Quality Guidelines: Particulate Matter (PM2.5 and PM10), Ozone, Nitrogen Dioxide, Sulfur Dioxide and Carbon Monoxide. 2021. Available online: https://iris.who.int/handle/10665/345329 (accessed on 1 May 2024).
- Cedeno Jimenez, J.R.; Brovelli, M.A. NO2 Concentration Estimation at Urban Ground Level by Integrating Sentinel 5P Data and ERA5 Using Machine Learning: The Milan (Italy) Case Study. Remote Sens. 2023, 15, 5400. [Google Scholar] [CrossRef]
- Maranzano, P. Air Quality in Lombardy, Italy: An Overview of the Environmental Monitoring System of ARPA Lombardia. Earth 2022, 3, 172–203. [Google Scholar] [CrossRef]
- Tomassetti, L.; Torre, M.; Tratzi, P.; Paolini, V.; Rizza, V.; Segreto, M.; Petracchini, F. Evaluation of air quality and mobility policies in 14 large Italian cities from 2006 to 2016. J. Environ. Sci. Health Part A 2020, 55, 886–902. [Google Scholar] [CrossRef]


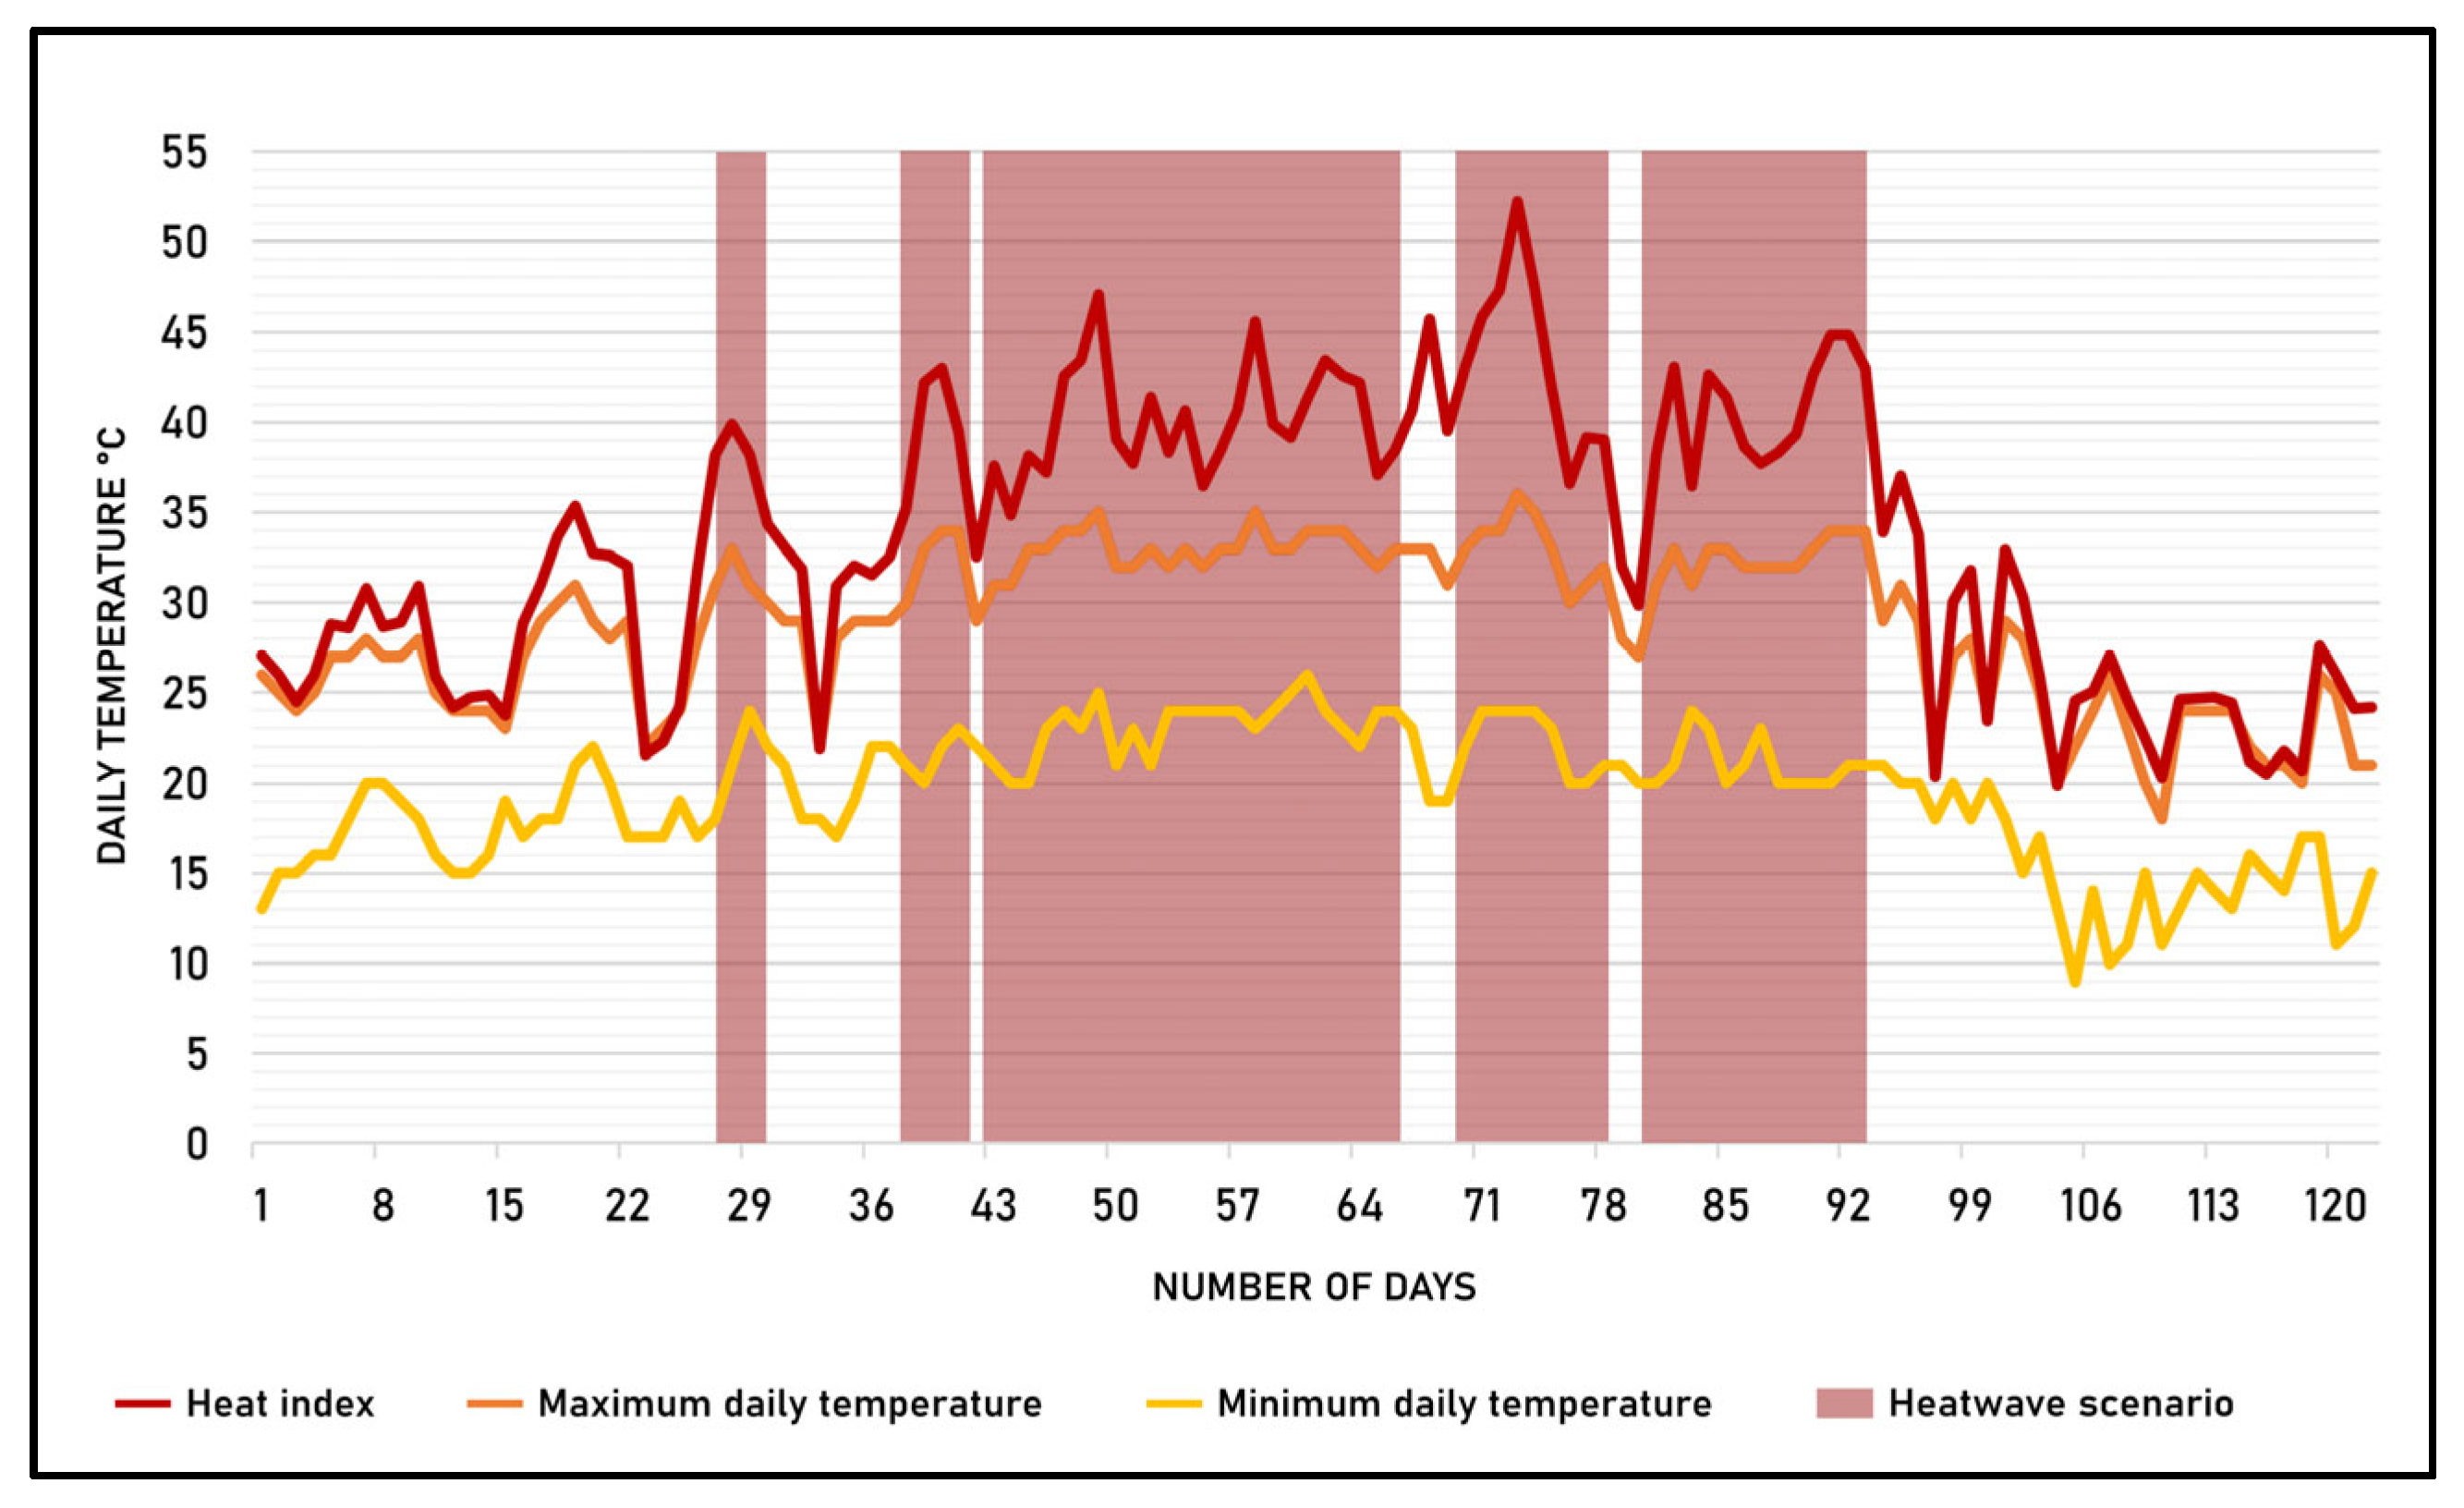
| ID Scenario | Time Frame | Number of Consecutive Days | Day with the Highest Heat Index | |
|---|---|---|---|---|
| Start | End | |||
| 1 | 28 June | 30 June | 3 | 28 June (+40 °C) |
| 2 | 7 July | 11 July | 4 | 10 July (+43 °C) |
| 3 | 13 July | 6 August | 25 | 19 July (+47 °C) |
| 4 | 9 August | 17 August | 9 | 12 August (+52 °C) |
| 5 | 20 August | 1 September | 13 | 31 August (+45 °C) |
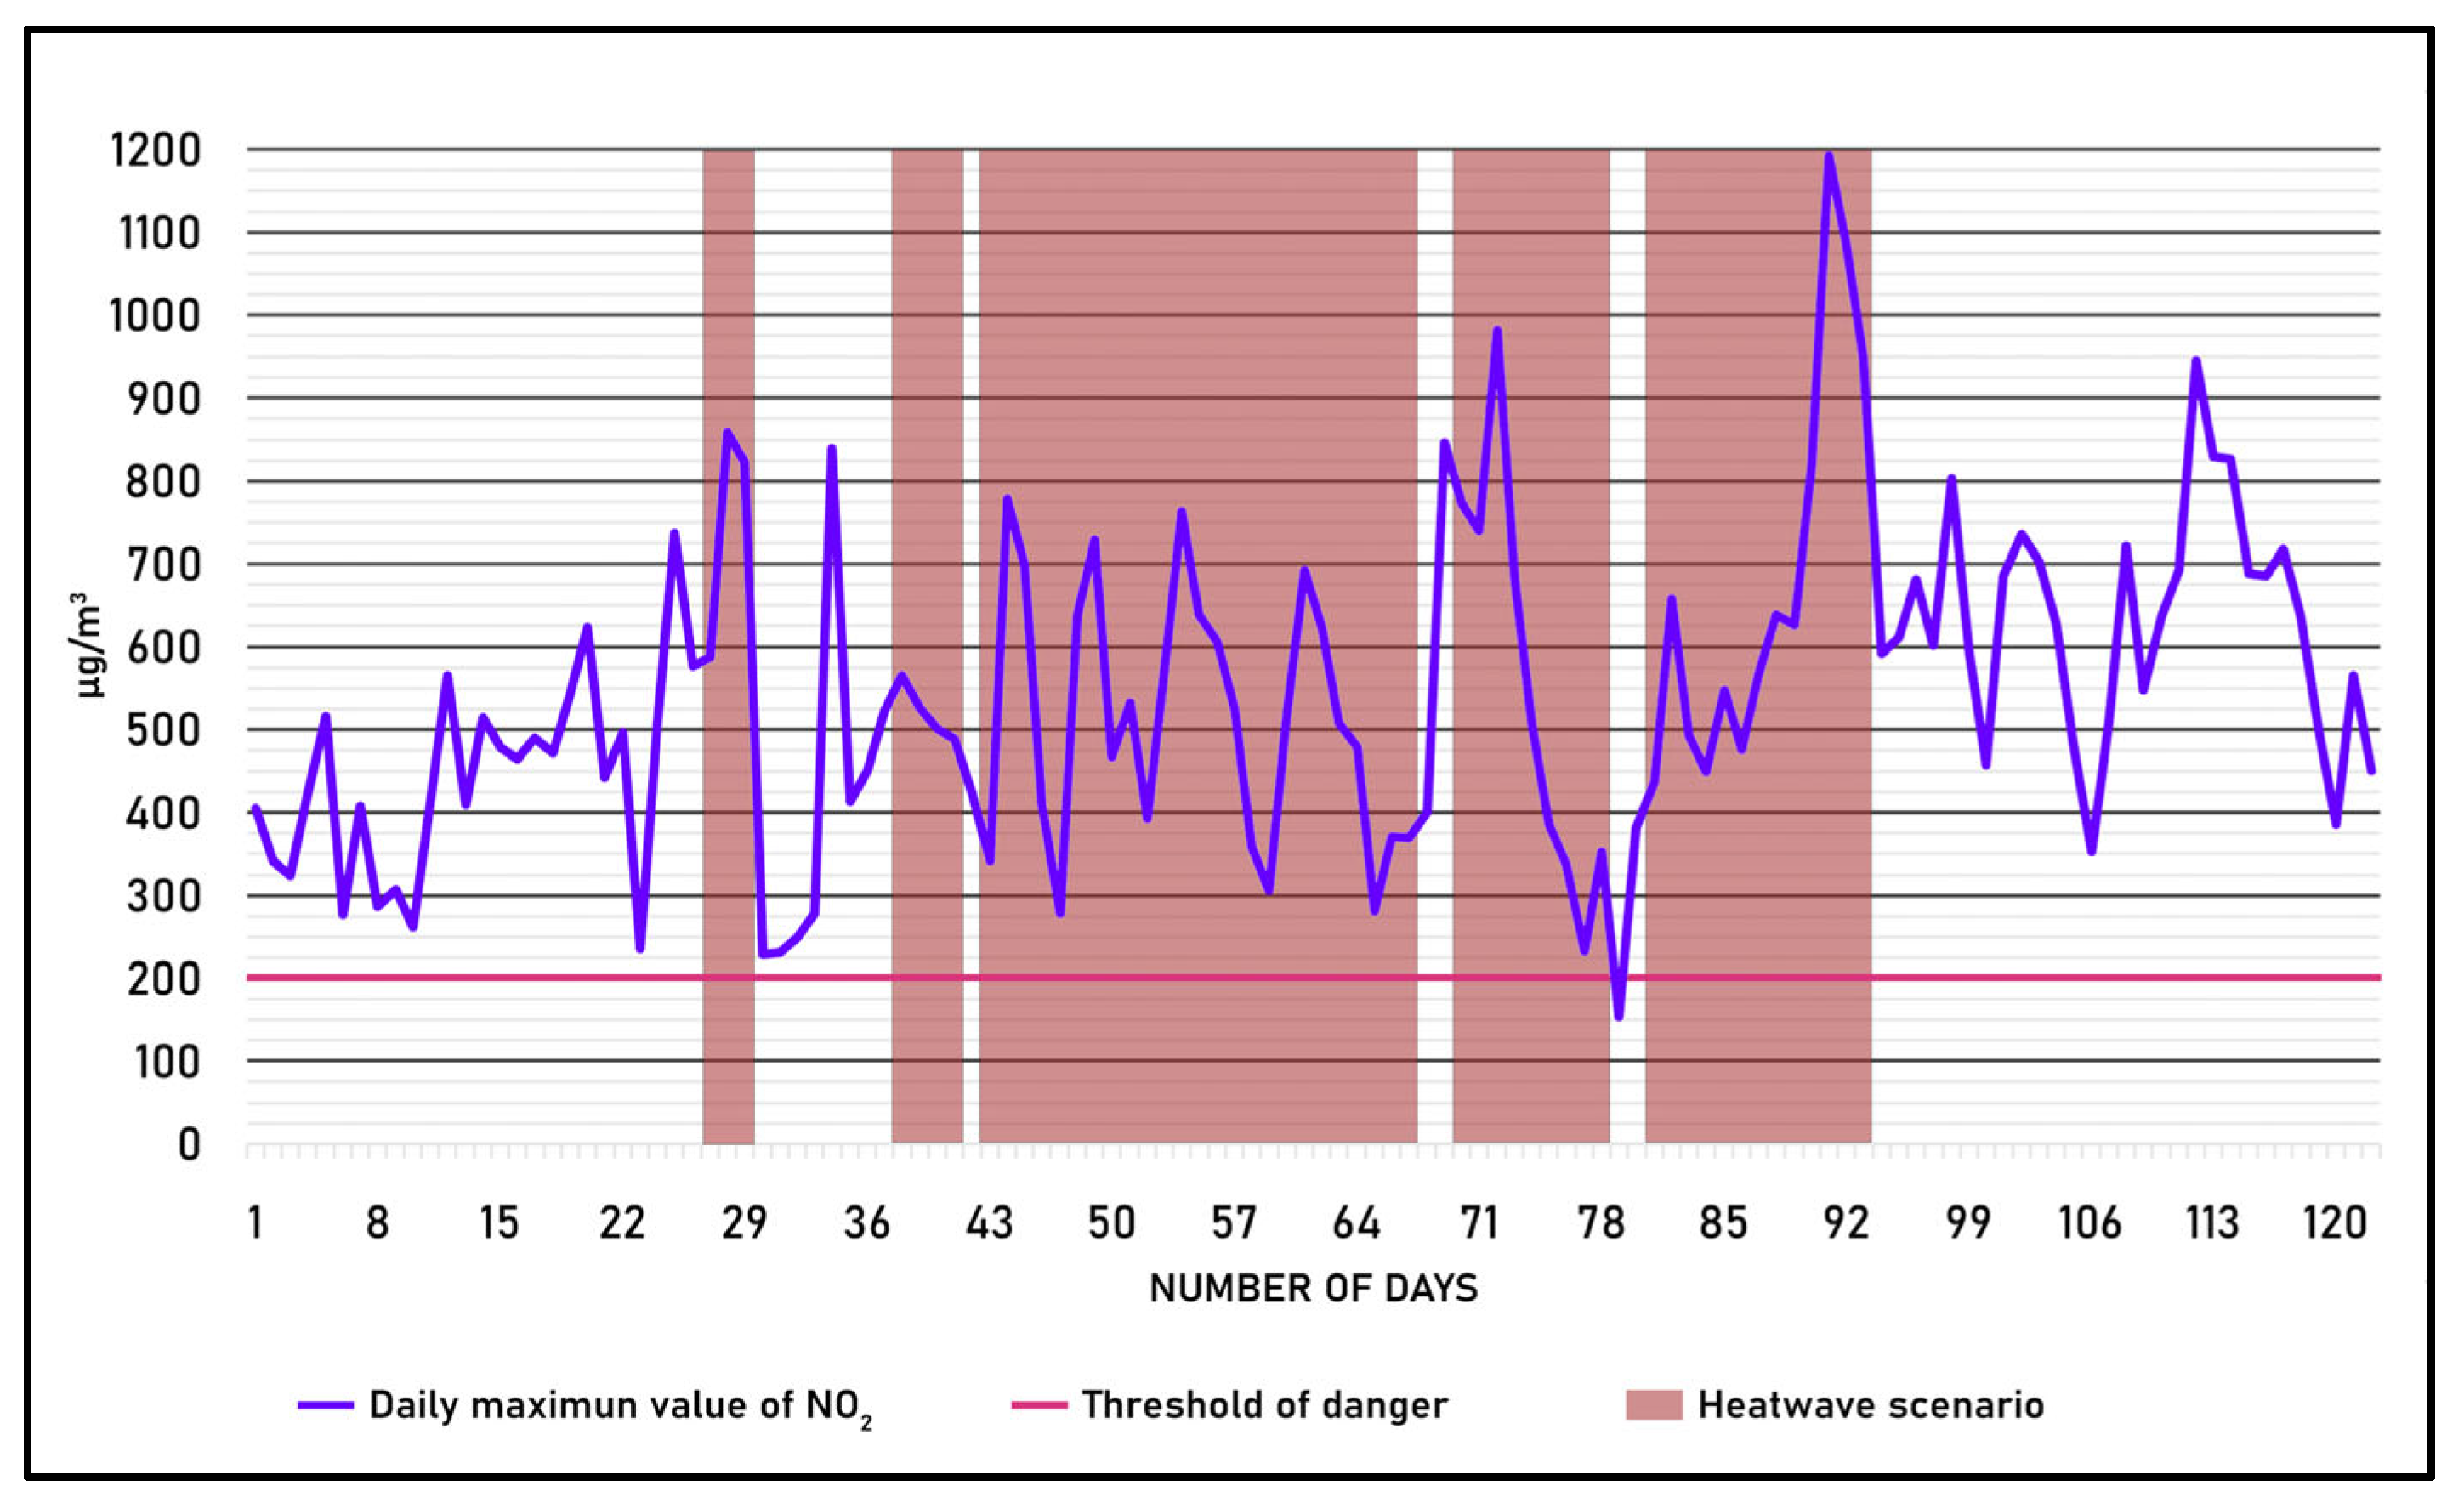
| Range Values | Class | Hotspost |
|---|---|---|
| NO2 < 100 μg/m3 | Normal | - |
| 100 μg/m3 ≤ NO2 < 140 μg/m3 | To be monitored | - |
| 140 μg/m3 ≤ NO2 < 200 μg/m3 | Dangerous | - |
| 200 μg/m3 ≤ NO2 < 400 μg/m3 | Critical | - |
| NO2 ≥ 400 μg/m3 | Very critical | Hotspot |
| Range Values [Inhabitants/km2] | Class |
|---|---|
| Density < 500 | Low |
| 500 ≤ Density < 2500 | Medium low |
| 2500 ≤ Density < 5000 | Medium |
| 5000 ≤ Density < 10,000 | Medium high |
| Density ≥ 10,000 | High |
Disclaimer/Publisher’s Note: The statements, opinions and data contained in all publications are solely those of the individual author(s) and contributor(s) and not of MDPI and/or the editor(s). MDPI and/or the editor(s) disclaim responsibility for any injury to people or property resulting from any ideas, methods, instructions or products referred to in the content. |
© 2025 by the authors. Licensee MDPI, Basel, Switzerland. This article is an open access article distributed under the terms and conditions of the Creative Commons Attribution (CC BY) license (https://creativecommons.org/licenses/by/4.0/).
Share and Cite
Cardone, B.; Di Martino, F.; Mauriello, C.; Miraglia, V. A Fuzzy-Based Model to Detect Hotspots of Air Pollutants During Heatwaves in Urban Settlements. Sensors 2025, 25, 2160. https://doi.org/10.3390/s25072160
Cardone B, Di Martino F, Mauriello C, Miraglia V. A Fuzzy-Based Model to Detect Hotspots of Air Pollutants During Heatwaves in Urban Settlements. Sensors. 2025; 25(7):2160. https://doi.org/10.3390/s25072160
Chicago/Turabian StyleCardone, Barbara, Ferdinando Di Martino, Cristiano Mauriello, and Vittorio Miraglia. 2025. "A Fuzzy-Based Model to Detect Hotspots of Air Pollutants During Heatwaves in Urban Settlements" Sensors 25, no. 7: 2160. https://doi.org/10.3390/s25072160
APA StyleCardone, B., Di Martino, F., Mauriello, C., & Miraglia, V. (2025). A Fuzzy-Based Model to Detect Hotspots of Air Pollutants During Heatwaves in Urban Settlements. Sensors, 25(7), 2160. https://doi.org/10.3390/s25072160