

Potential Pneumoconiosis Patients Monitoring and Warning System with Acoustic Signal †


Abstract
1. Introduction
- To the best of our knowledge, it is the first time that commercial acoustic devices are applied to potential pneumoconiosis patients monitoring and warning via contactless sensing. We believe is a critical step towards potential pneumoconiosis monitoring in the real world.
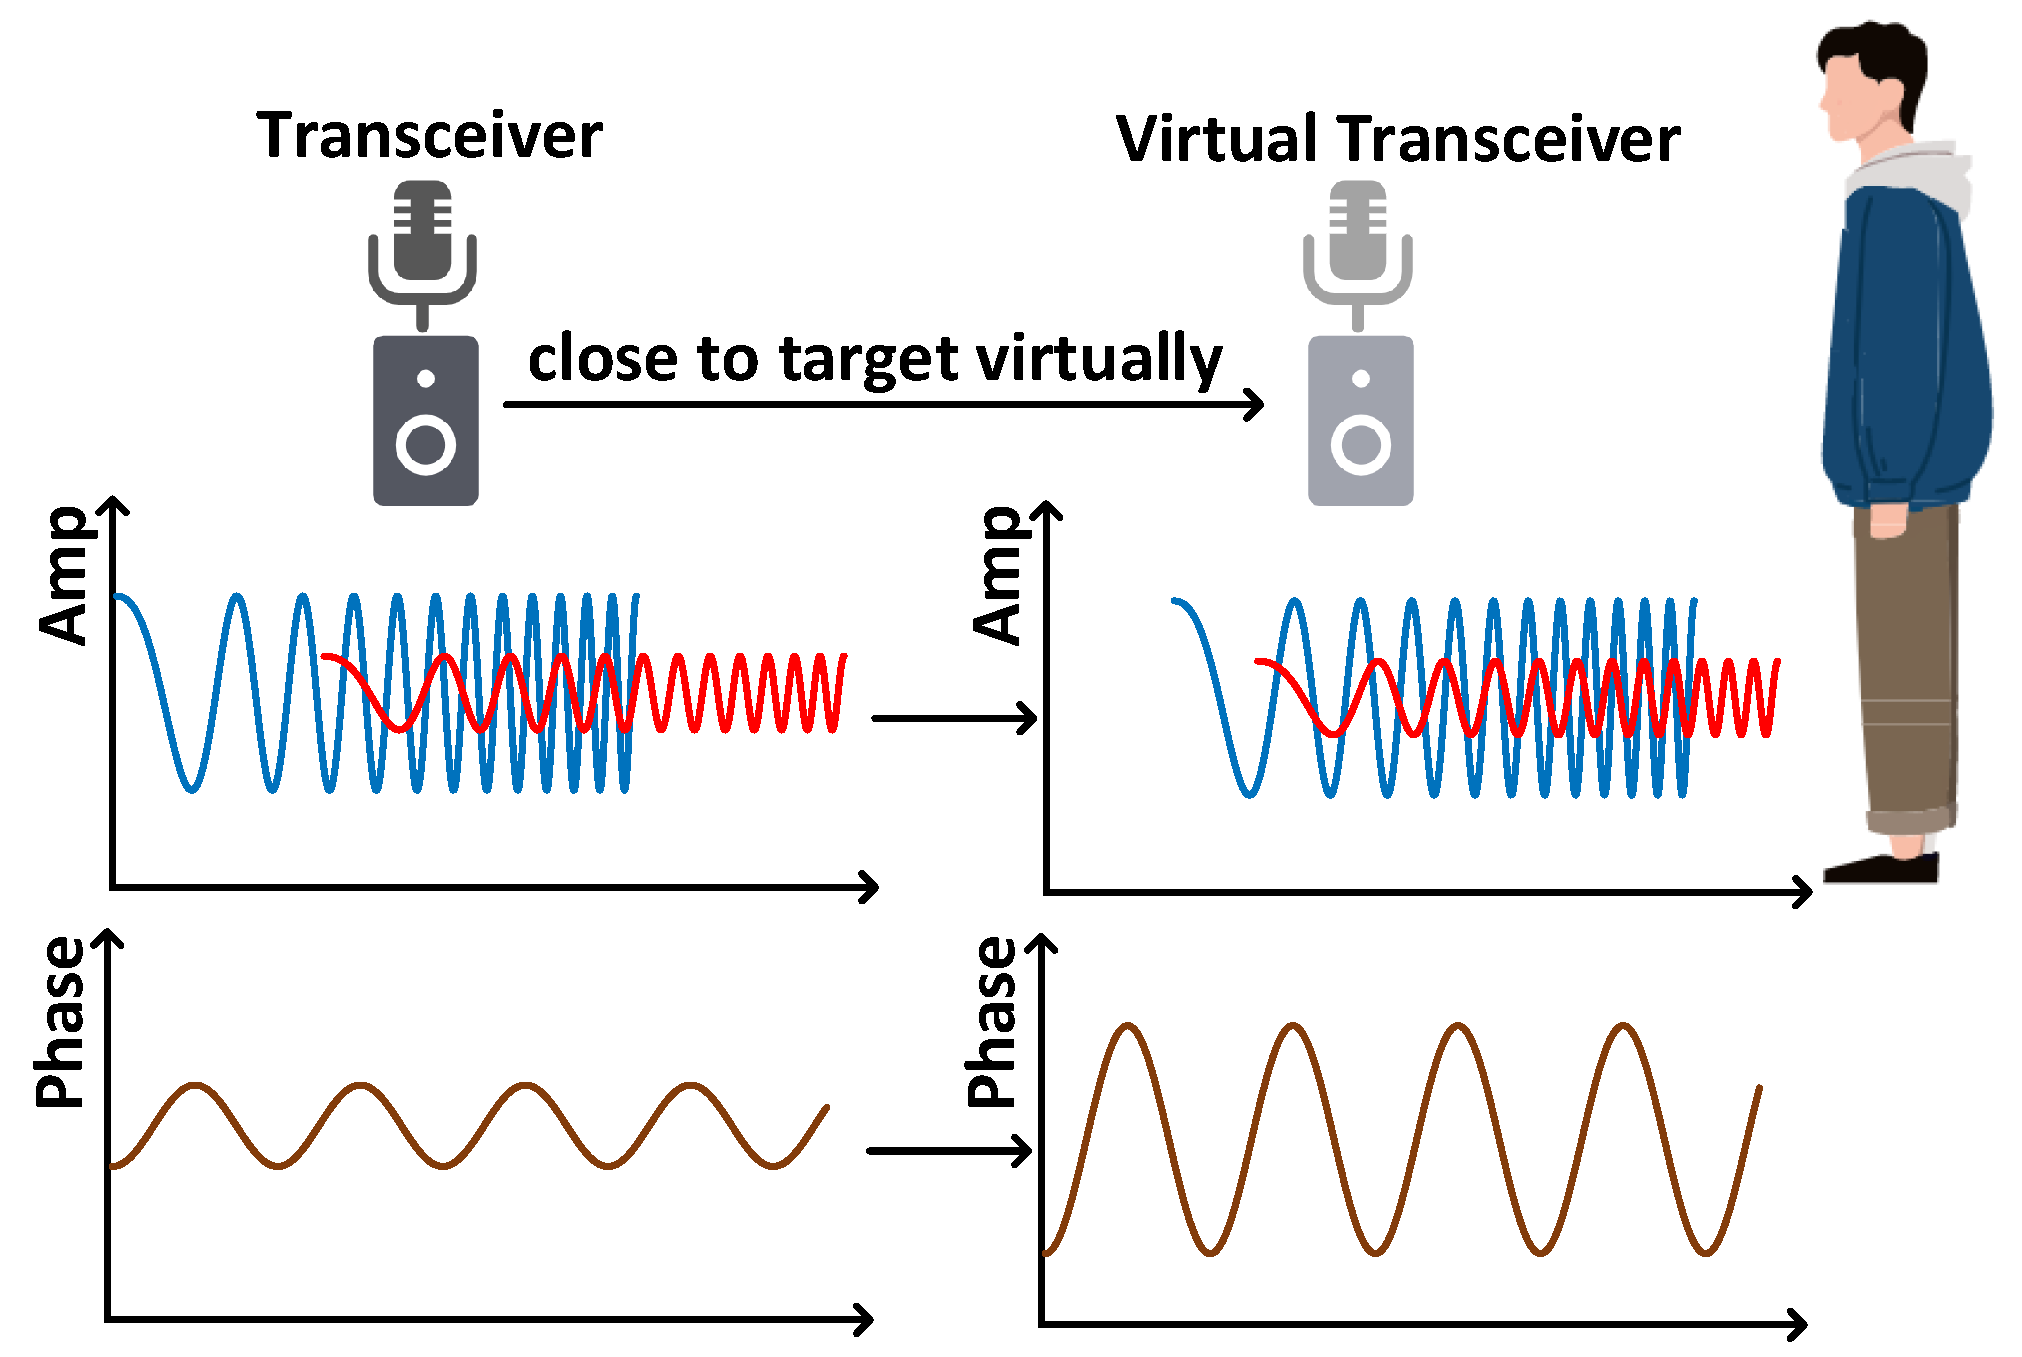
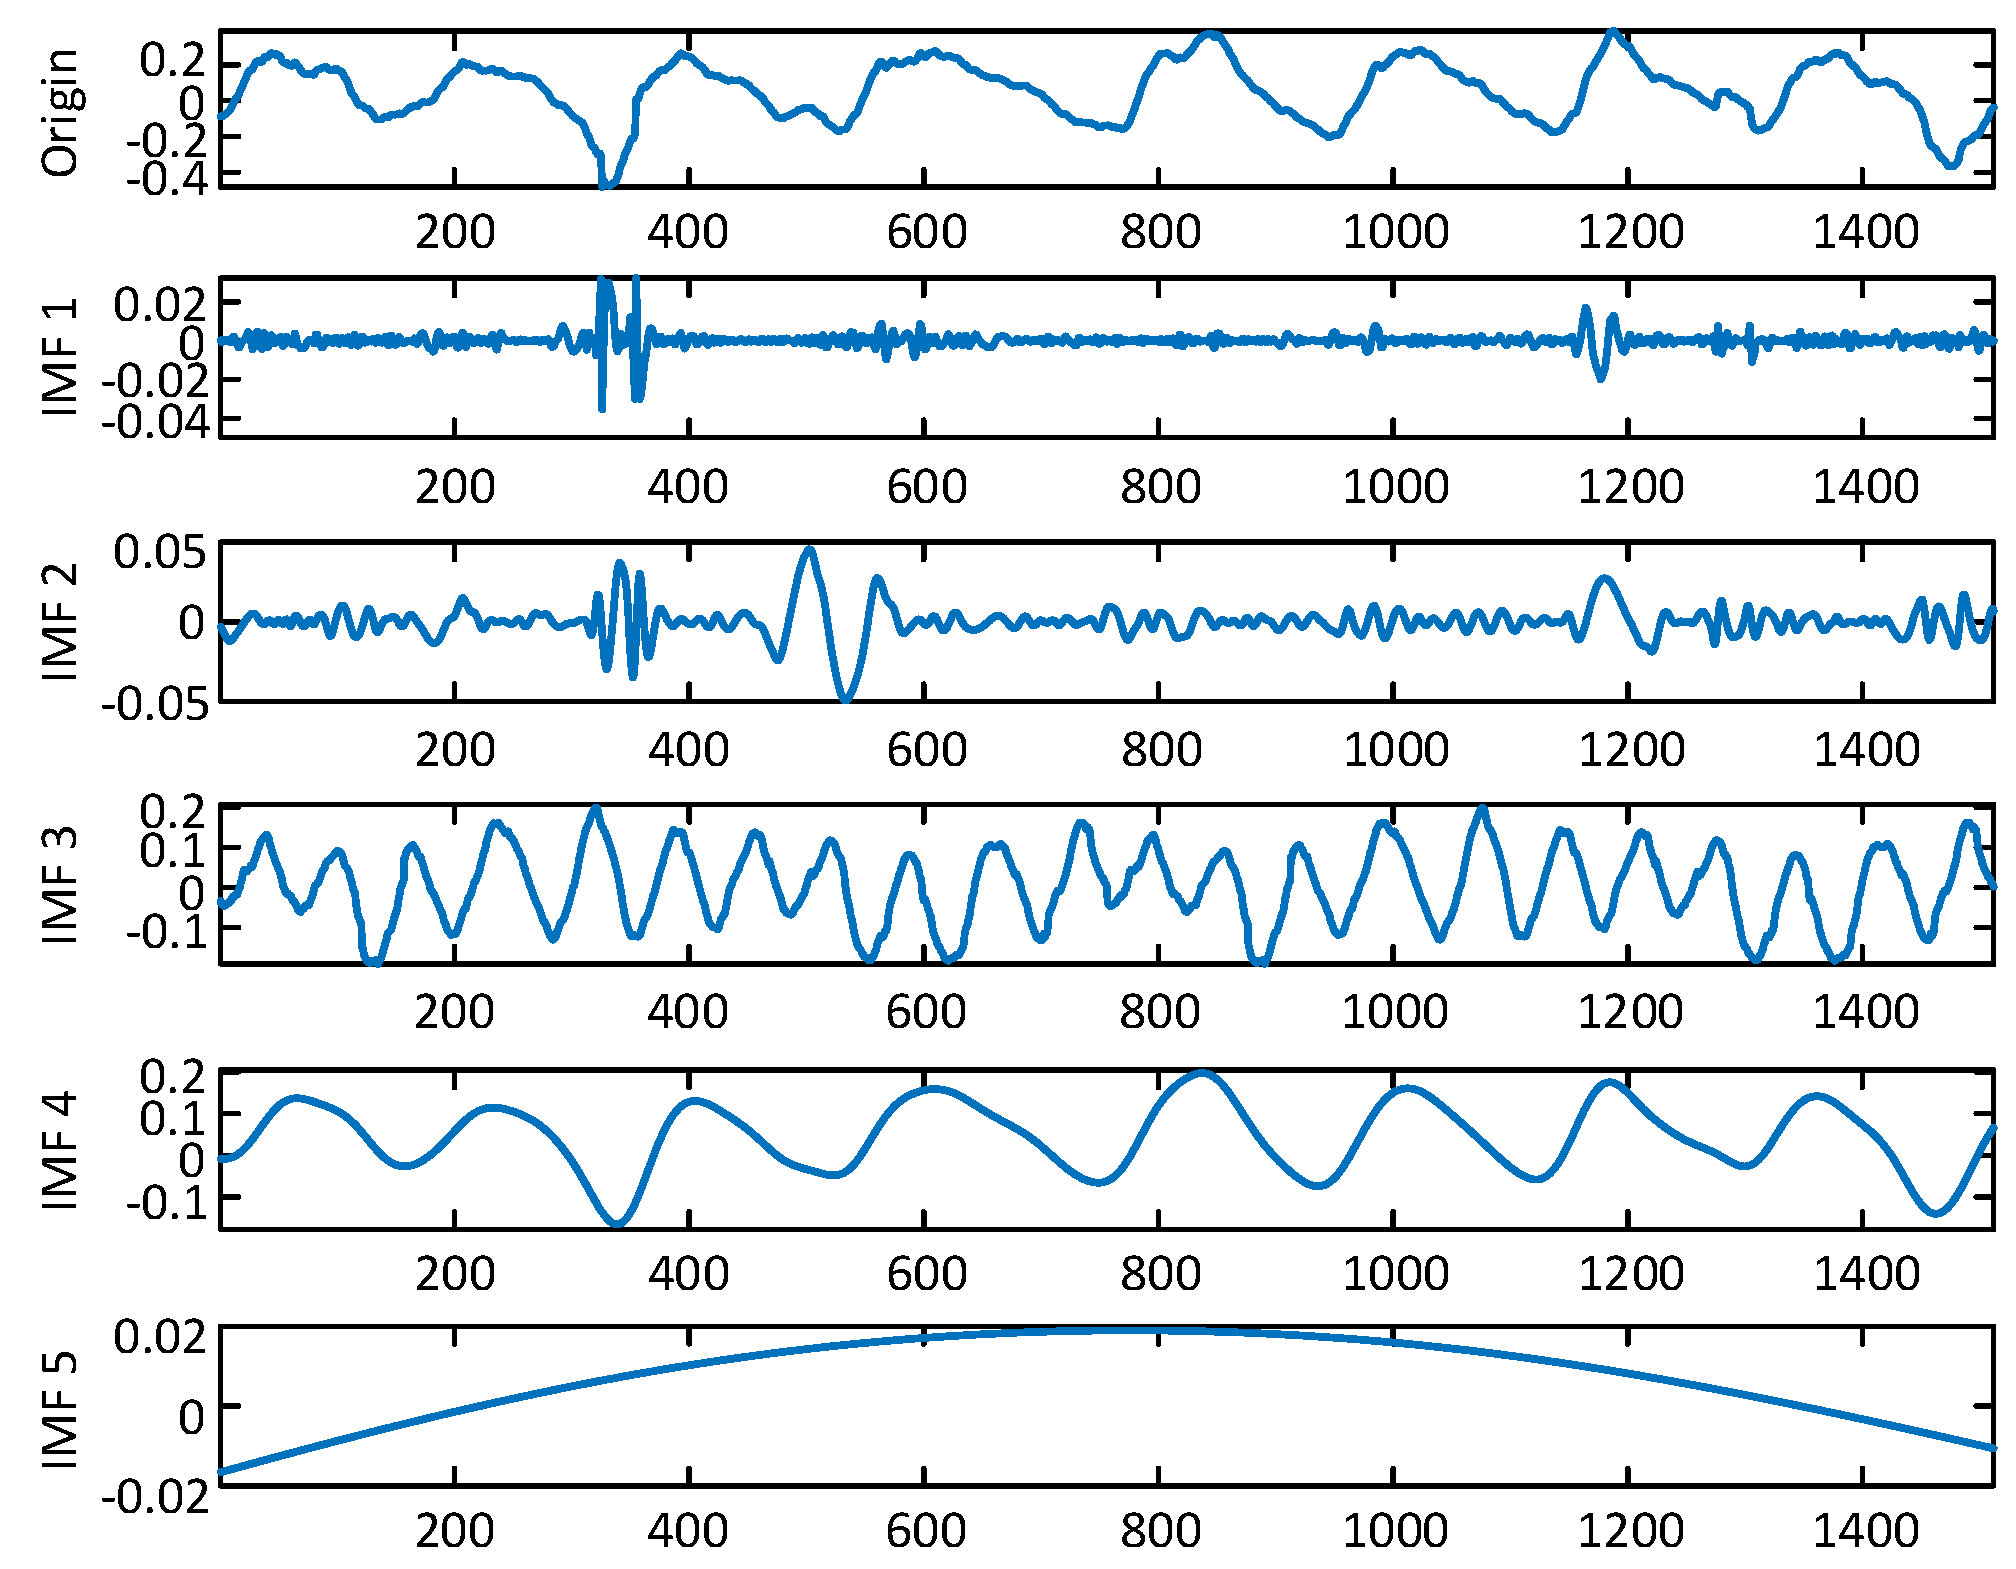
- We introduce an innovative approach for synchronizing acoustic signals by eliminating the unpredictable system latency from the speaker. Additionally, we advocate for a search-oriented technique to enhance signal phase differences, aimed at identifying targets at extended ranges. Finally, we propose a respiration extraction method by ICEEMDAN and extract suitable features to detect cough.
- We carry out extensive testing to assess the efficacy of . The findings indicate that is capable of attaining a median error rate of 0.52 beats per minute (bpm) in monitoring irregular respiration patterns, with a 95% success rate in detecting coughs overall, and is effective up to a maximum distance of 4 m.
2. Related Work
2.1. Vital Sign Monitoring
2.1.1. Device-Based Vital Sign Monitoring
2.1.2. Device-Free Vital Sign Monitoring
2.2. Wireless Sensing Based on Acoustic Signals
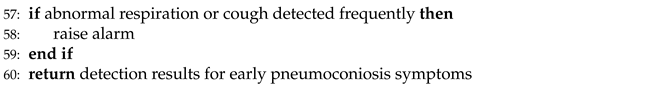
3. Preliminaries
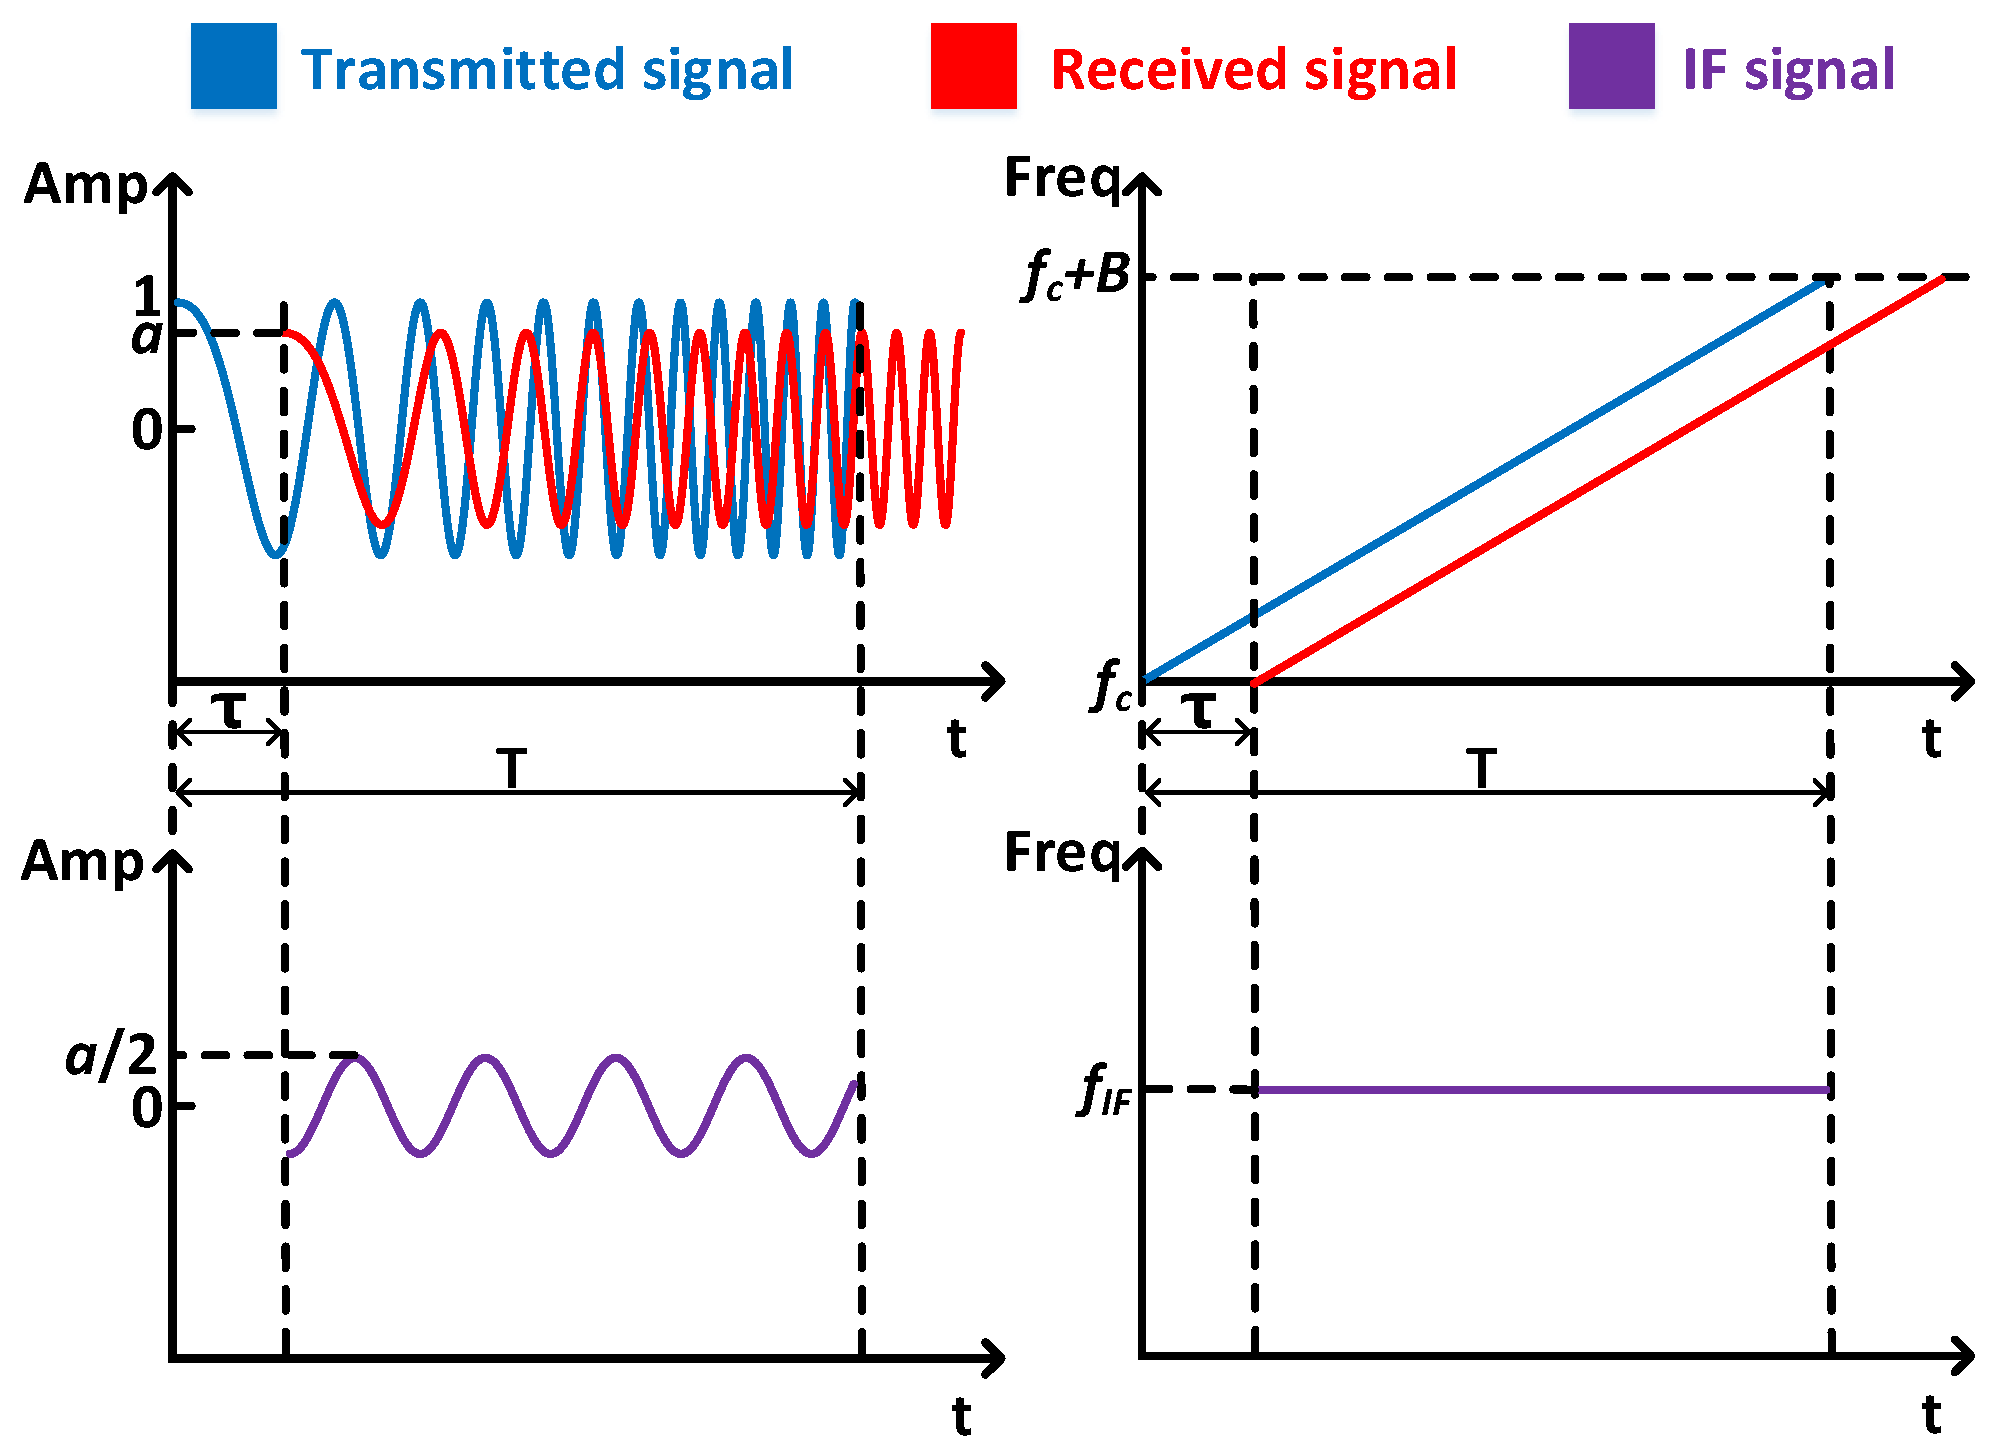
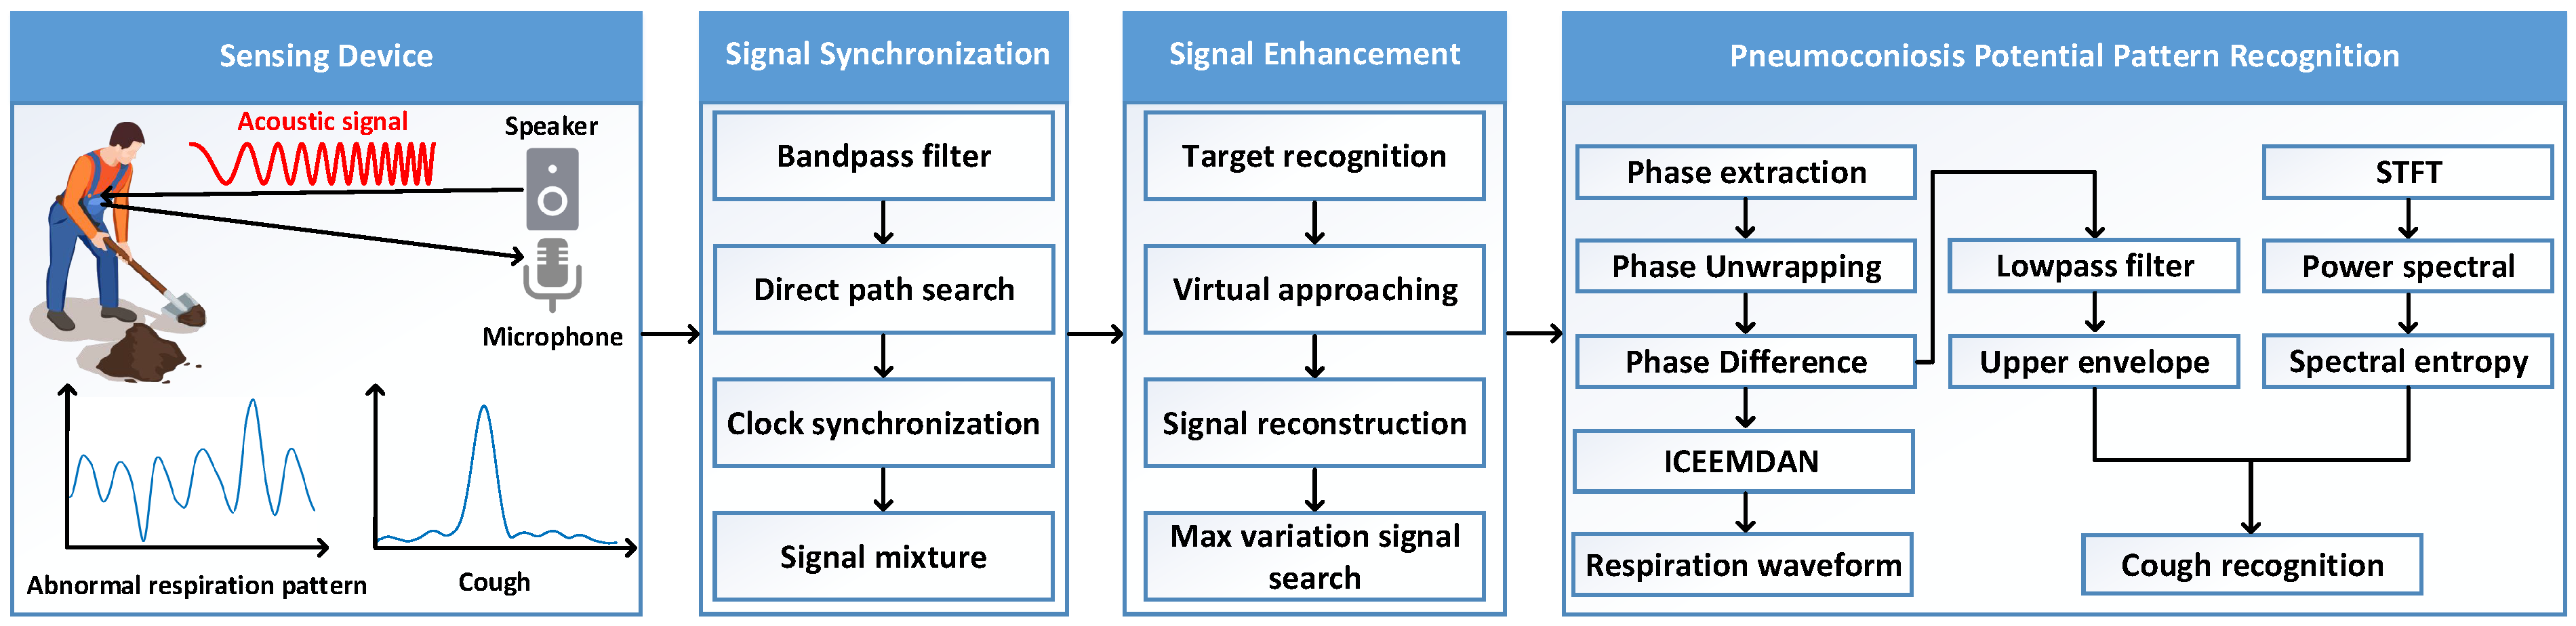
4. Architecture Design
4.1. Overview
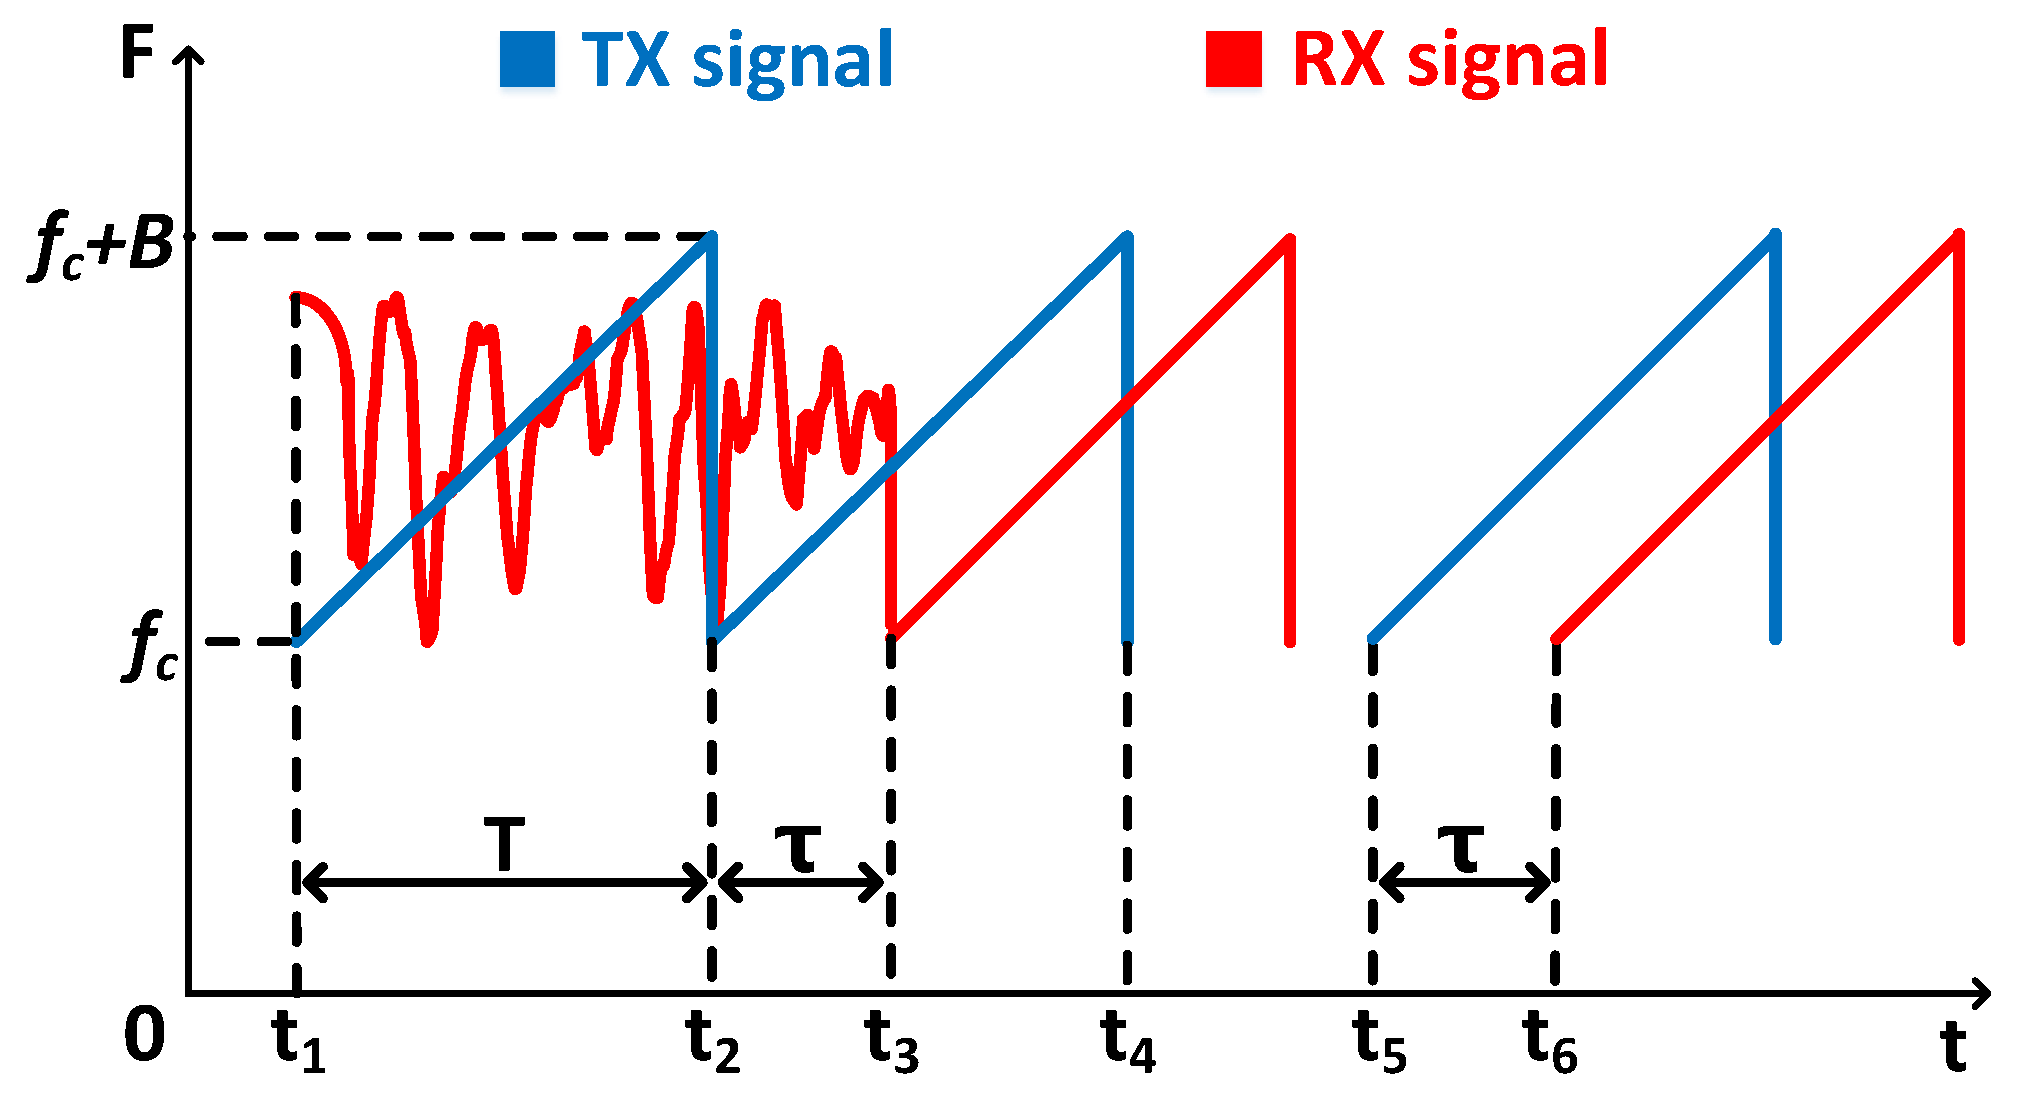
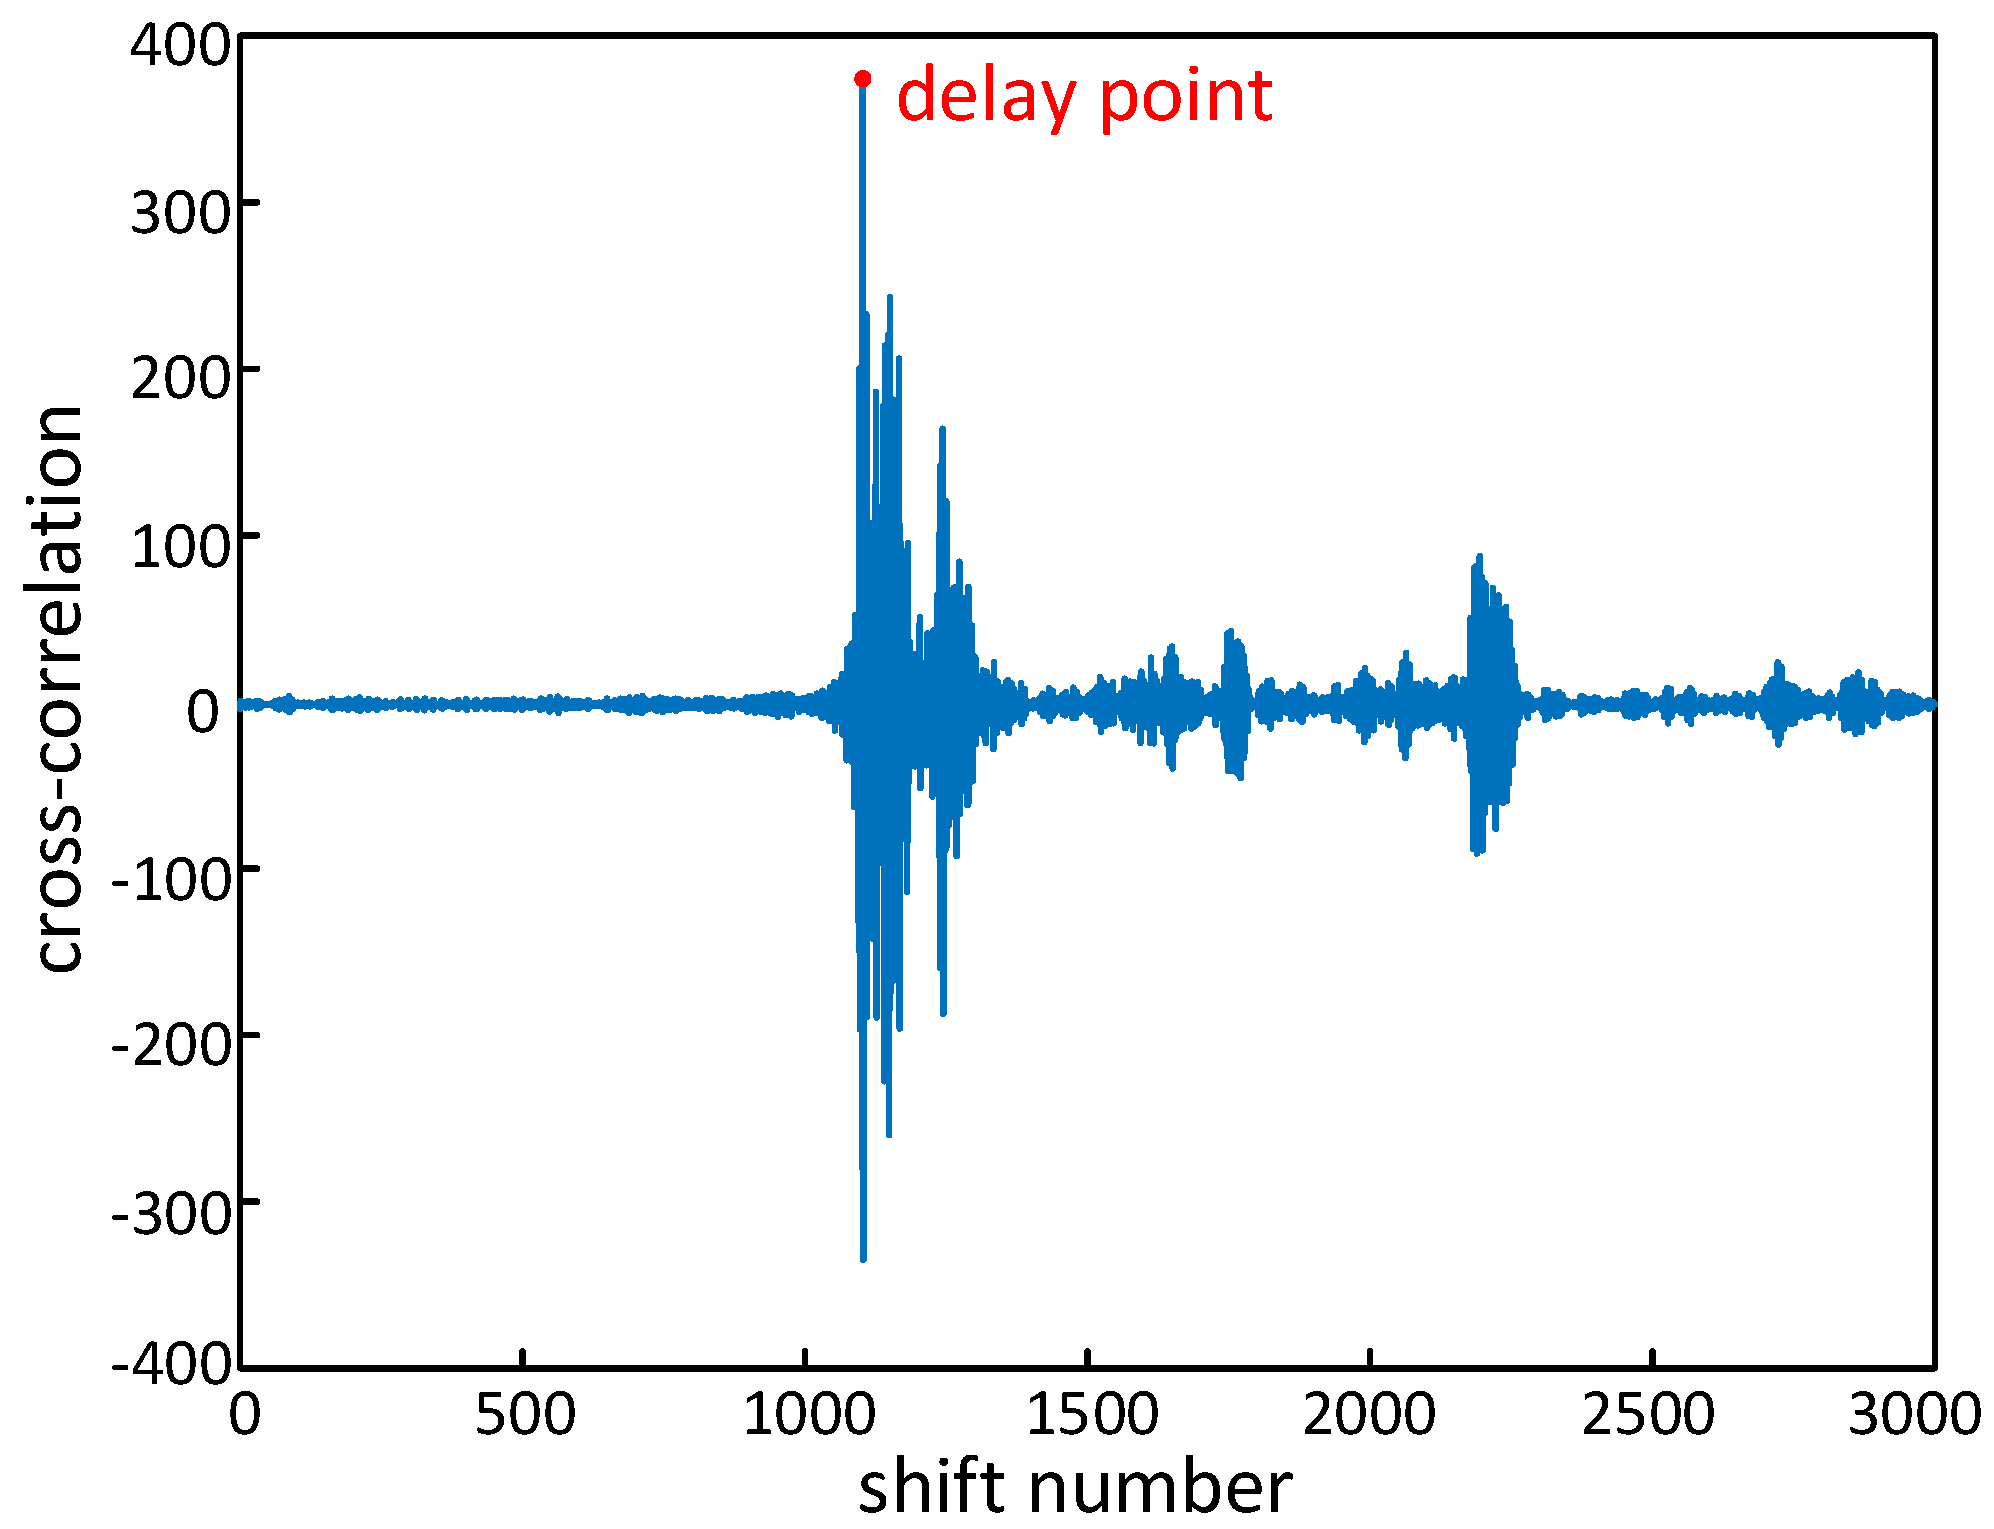
4.2. Acoustic Signal Synchronization
4.3. Acoustic Signal Enhancement
4.4. Pneumoconiosis Potential Pattern Recognition
4.4.1. Fine-Grained Activity Information Extraction
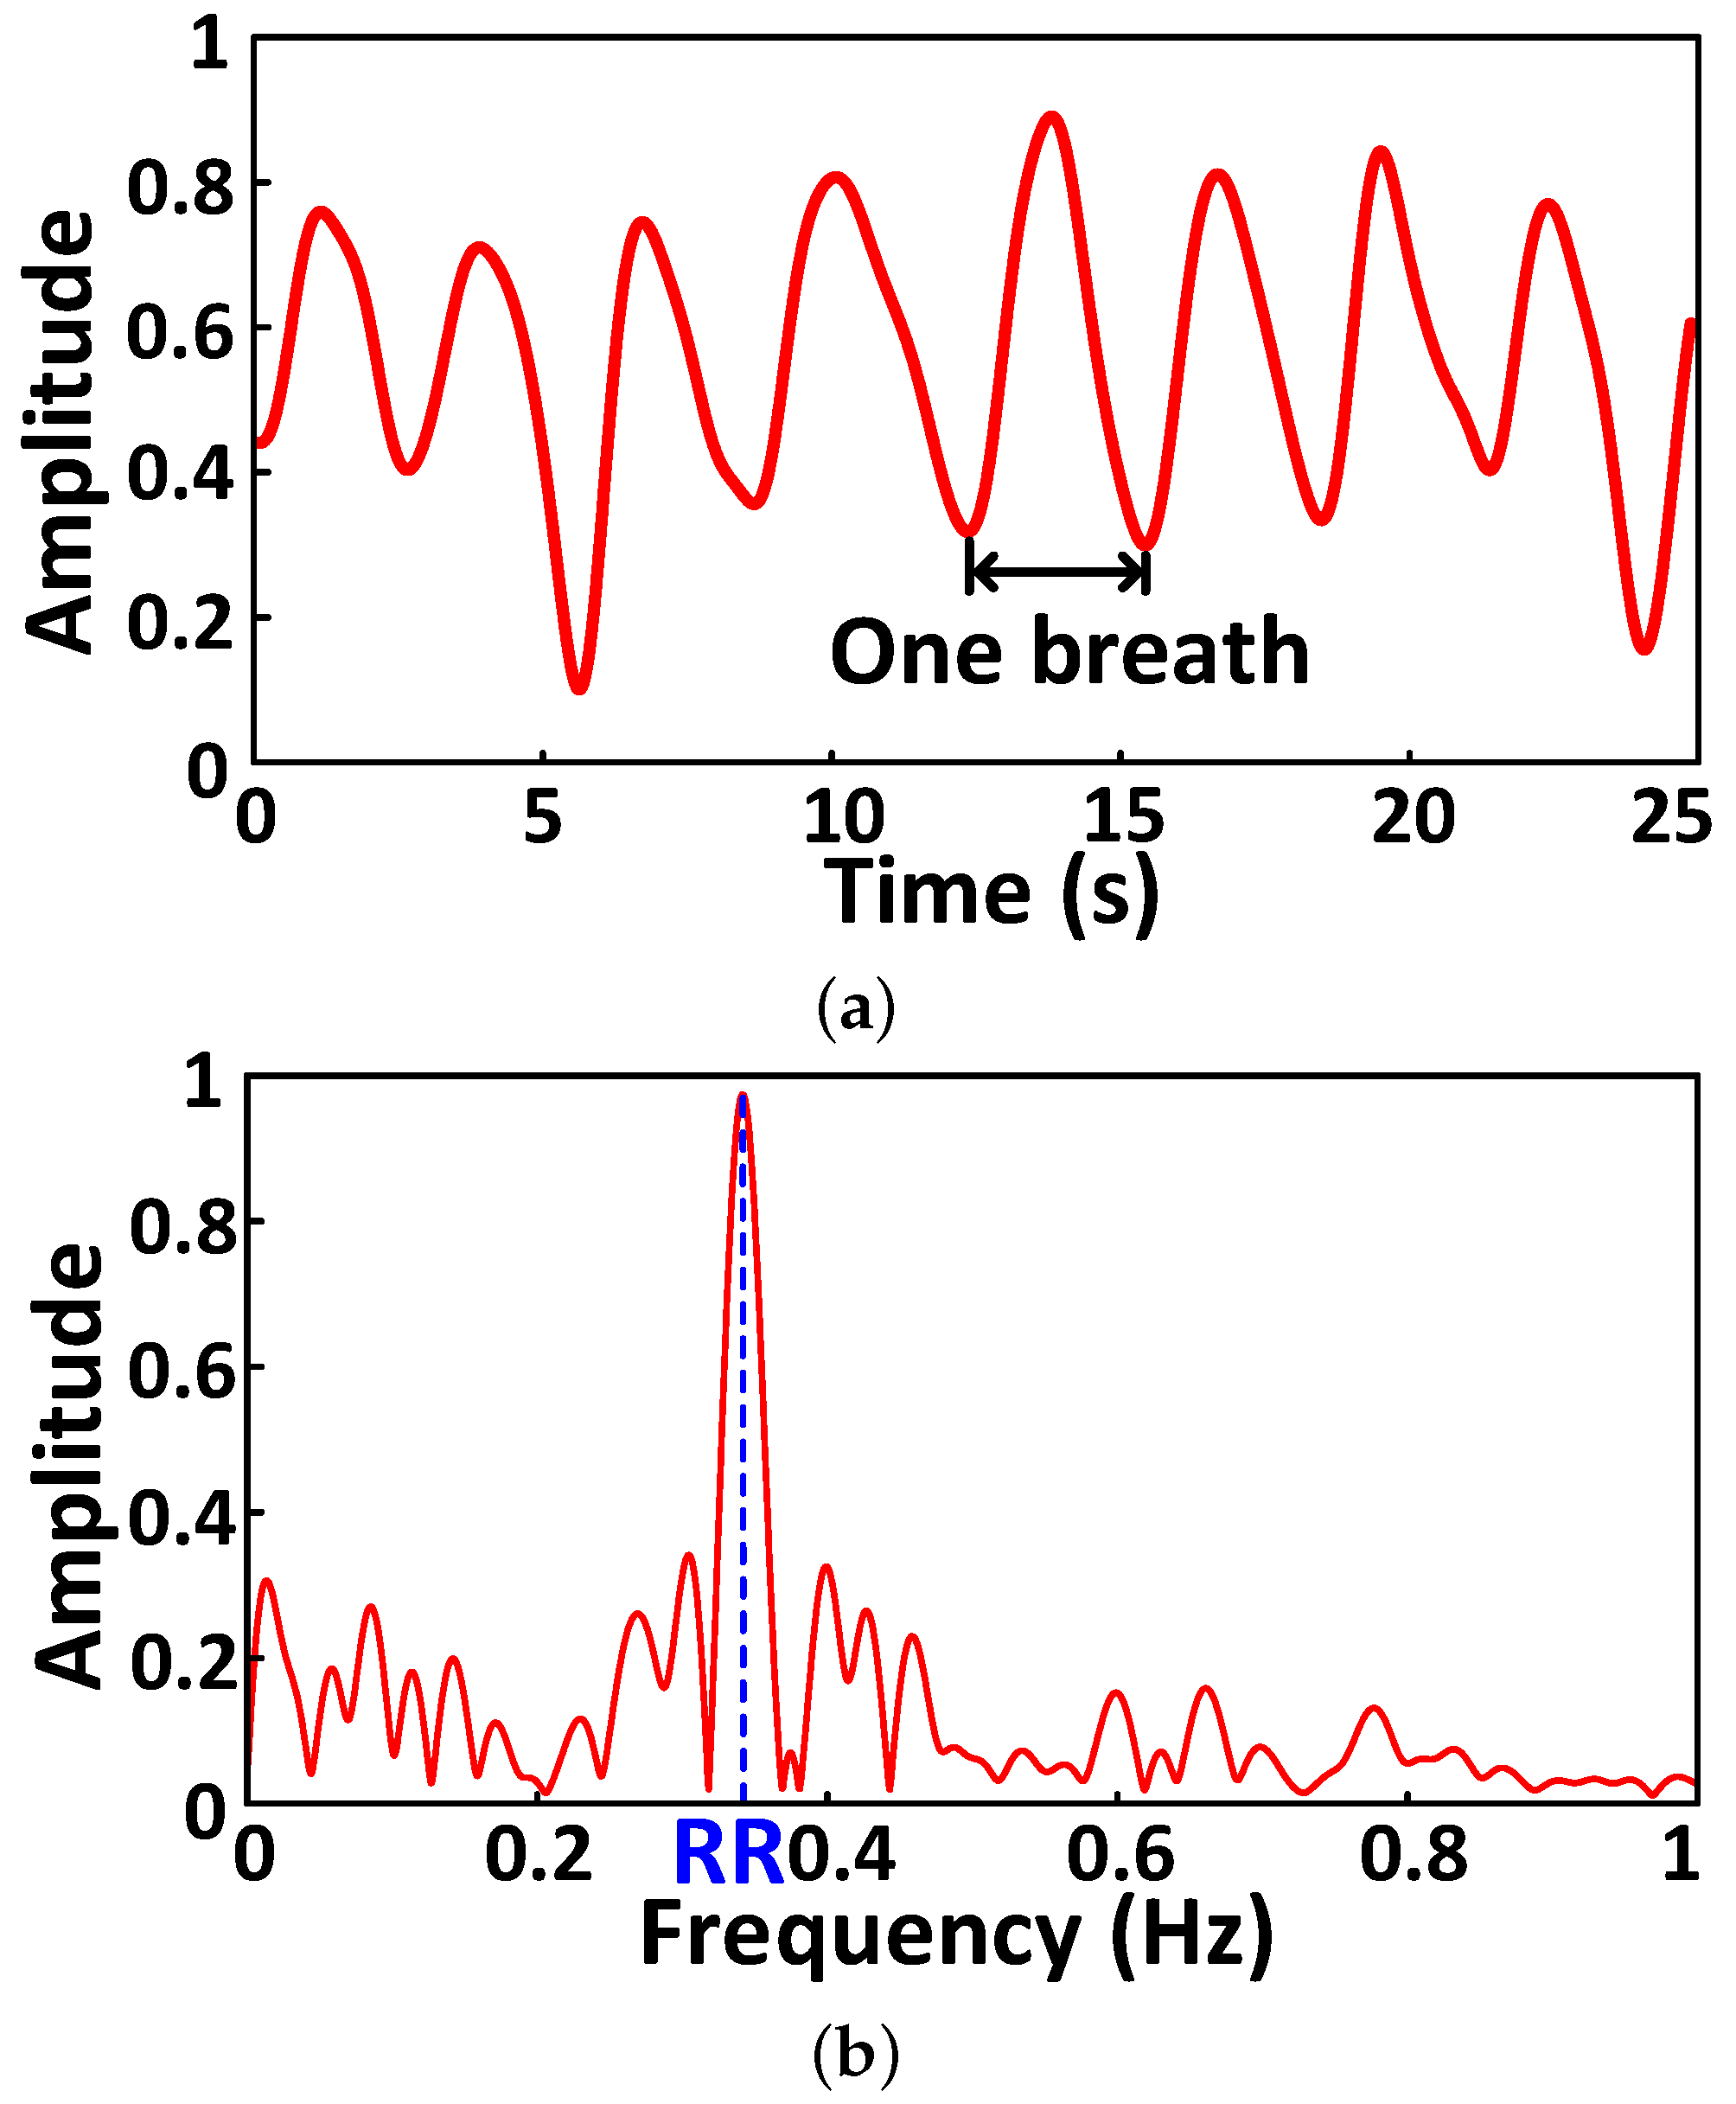
4.4.2. Abnormal Respiration Pattern Monitoring
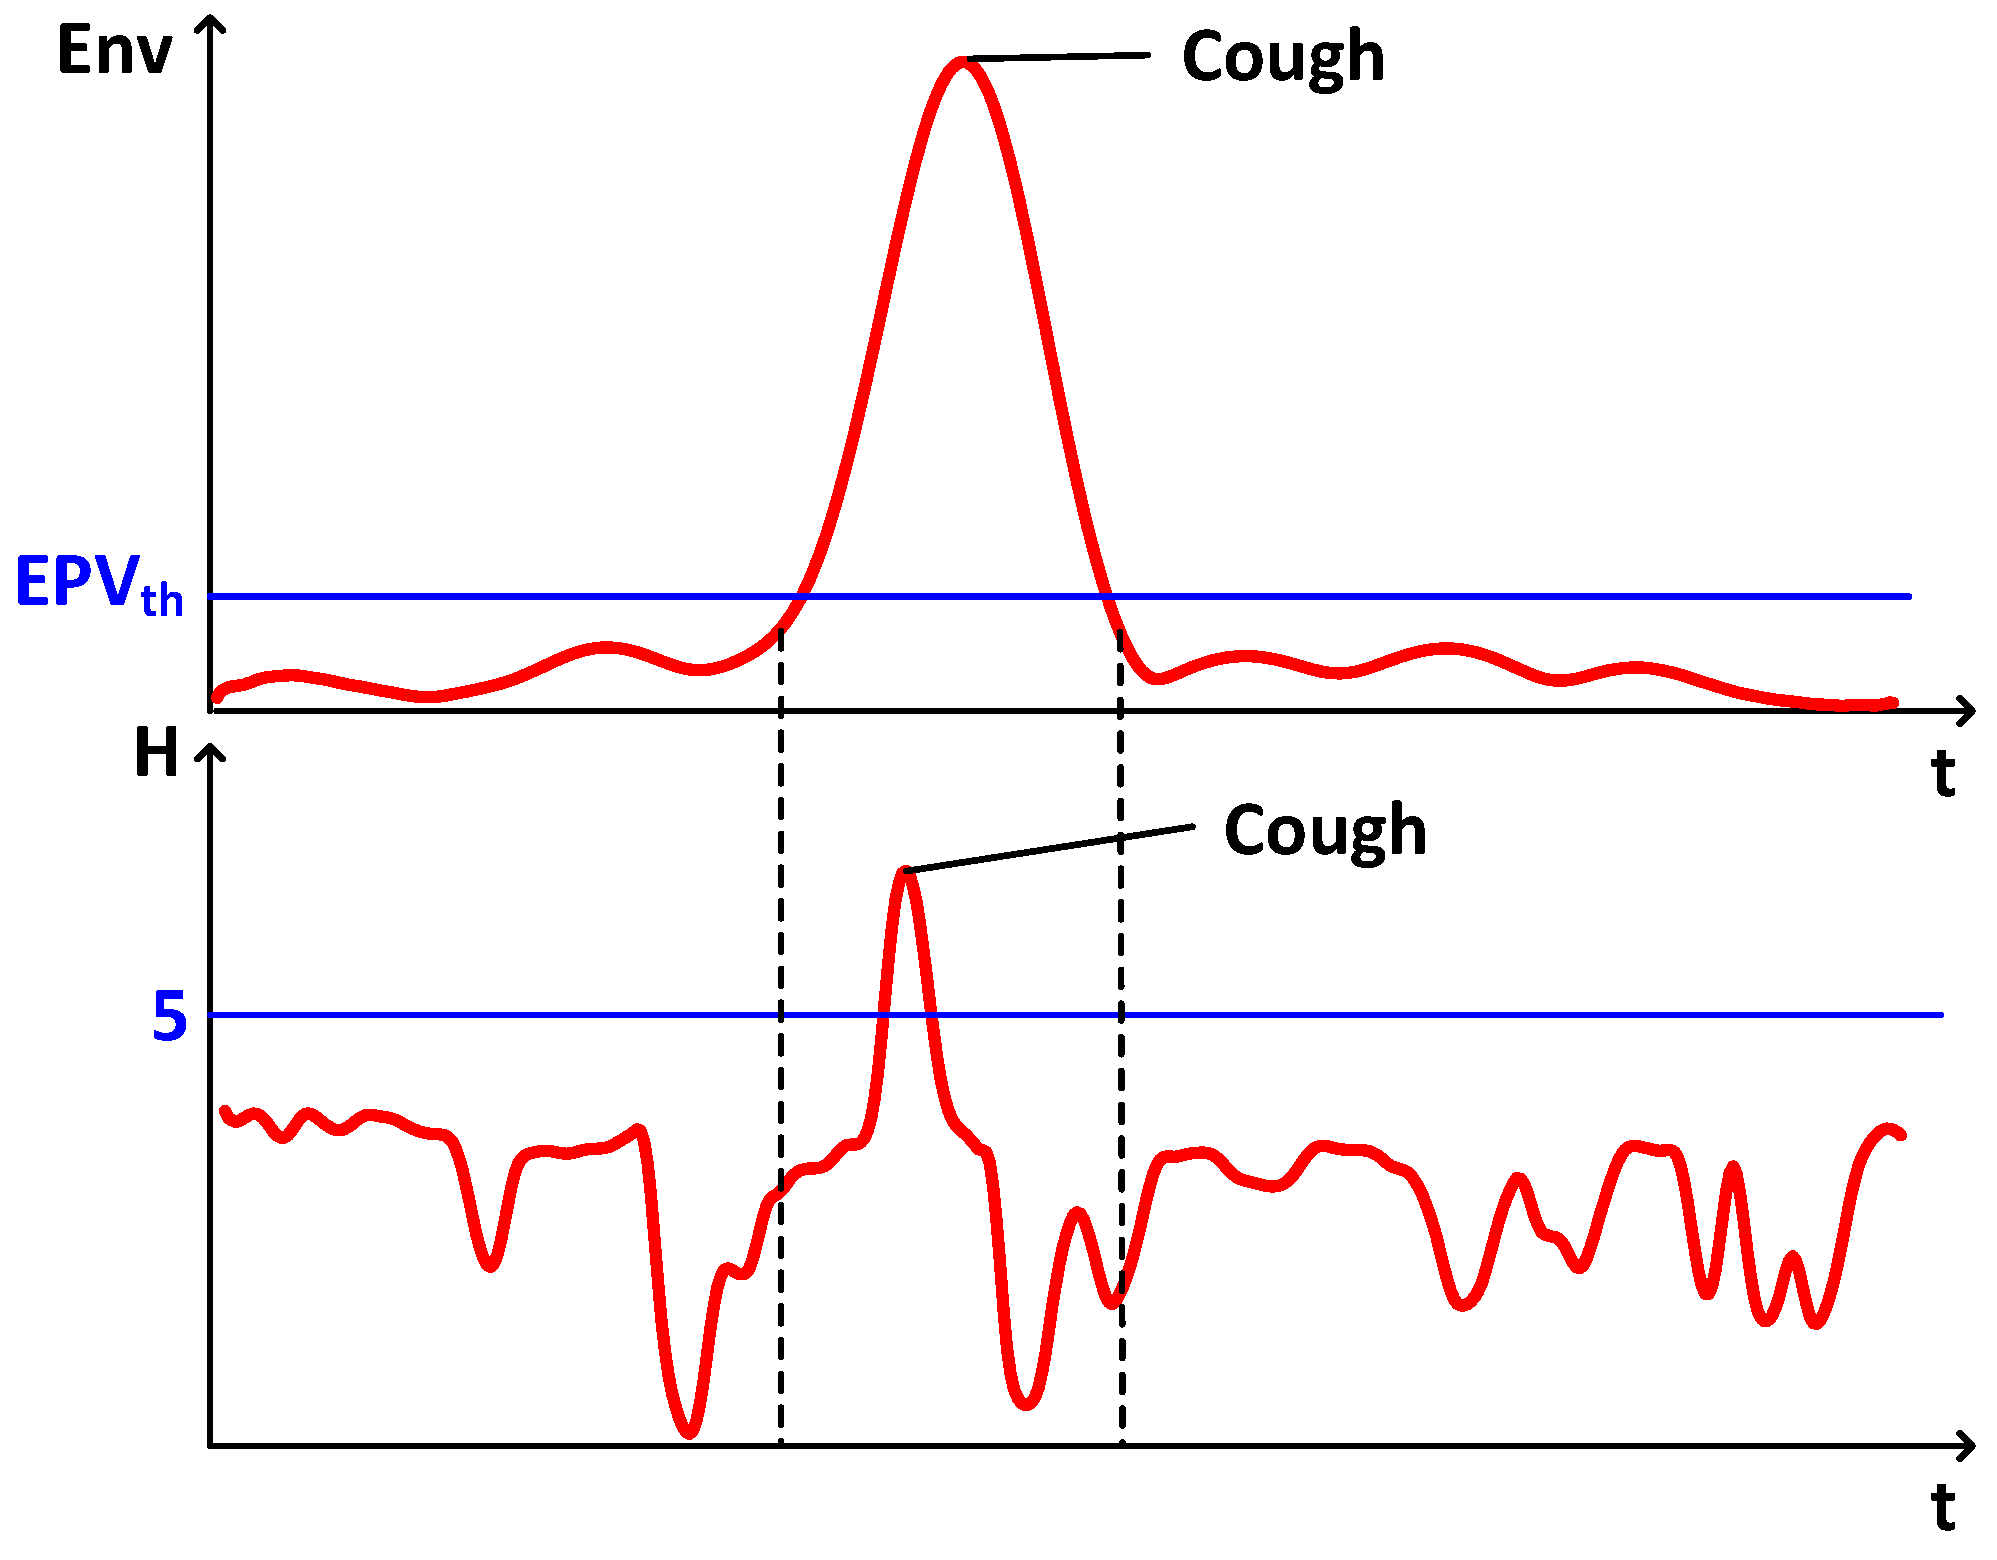
4.4.3. Cough Detection
4.4.4. Alarm
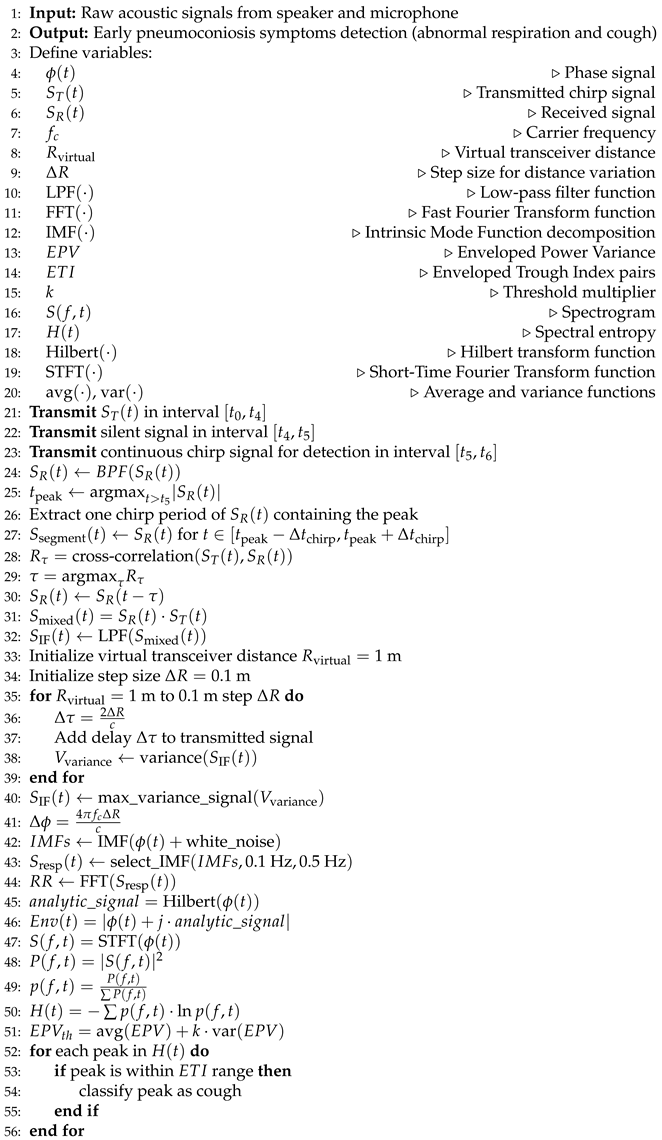
| Algorithm 1: System Architecture Design |
 |
 |
5. Evaluation
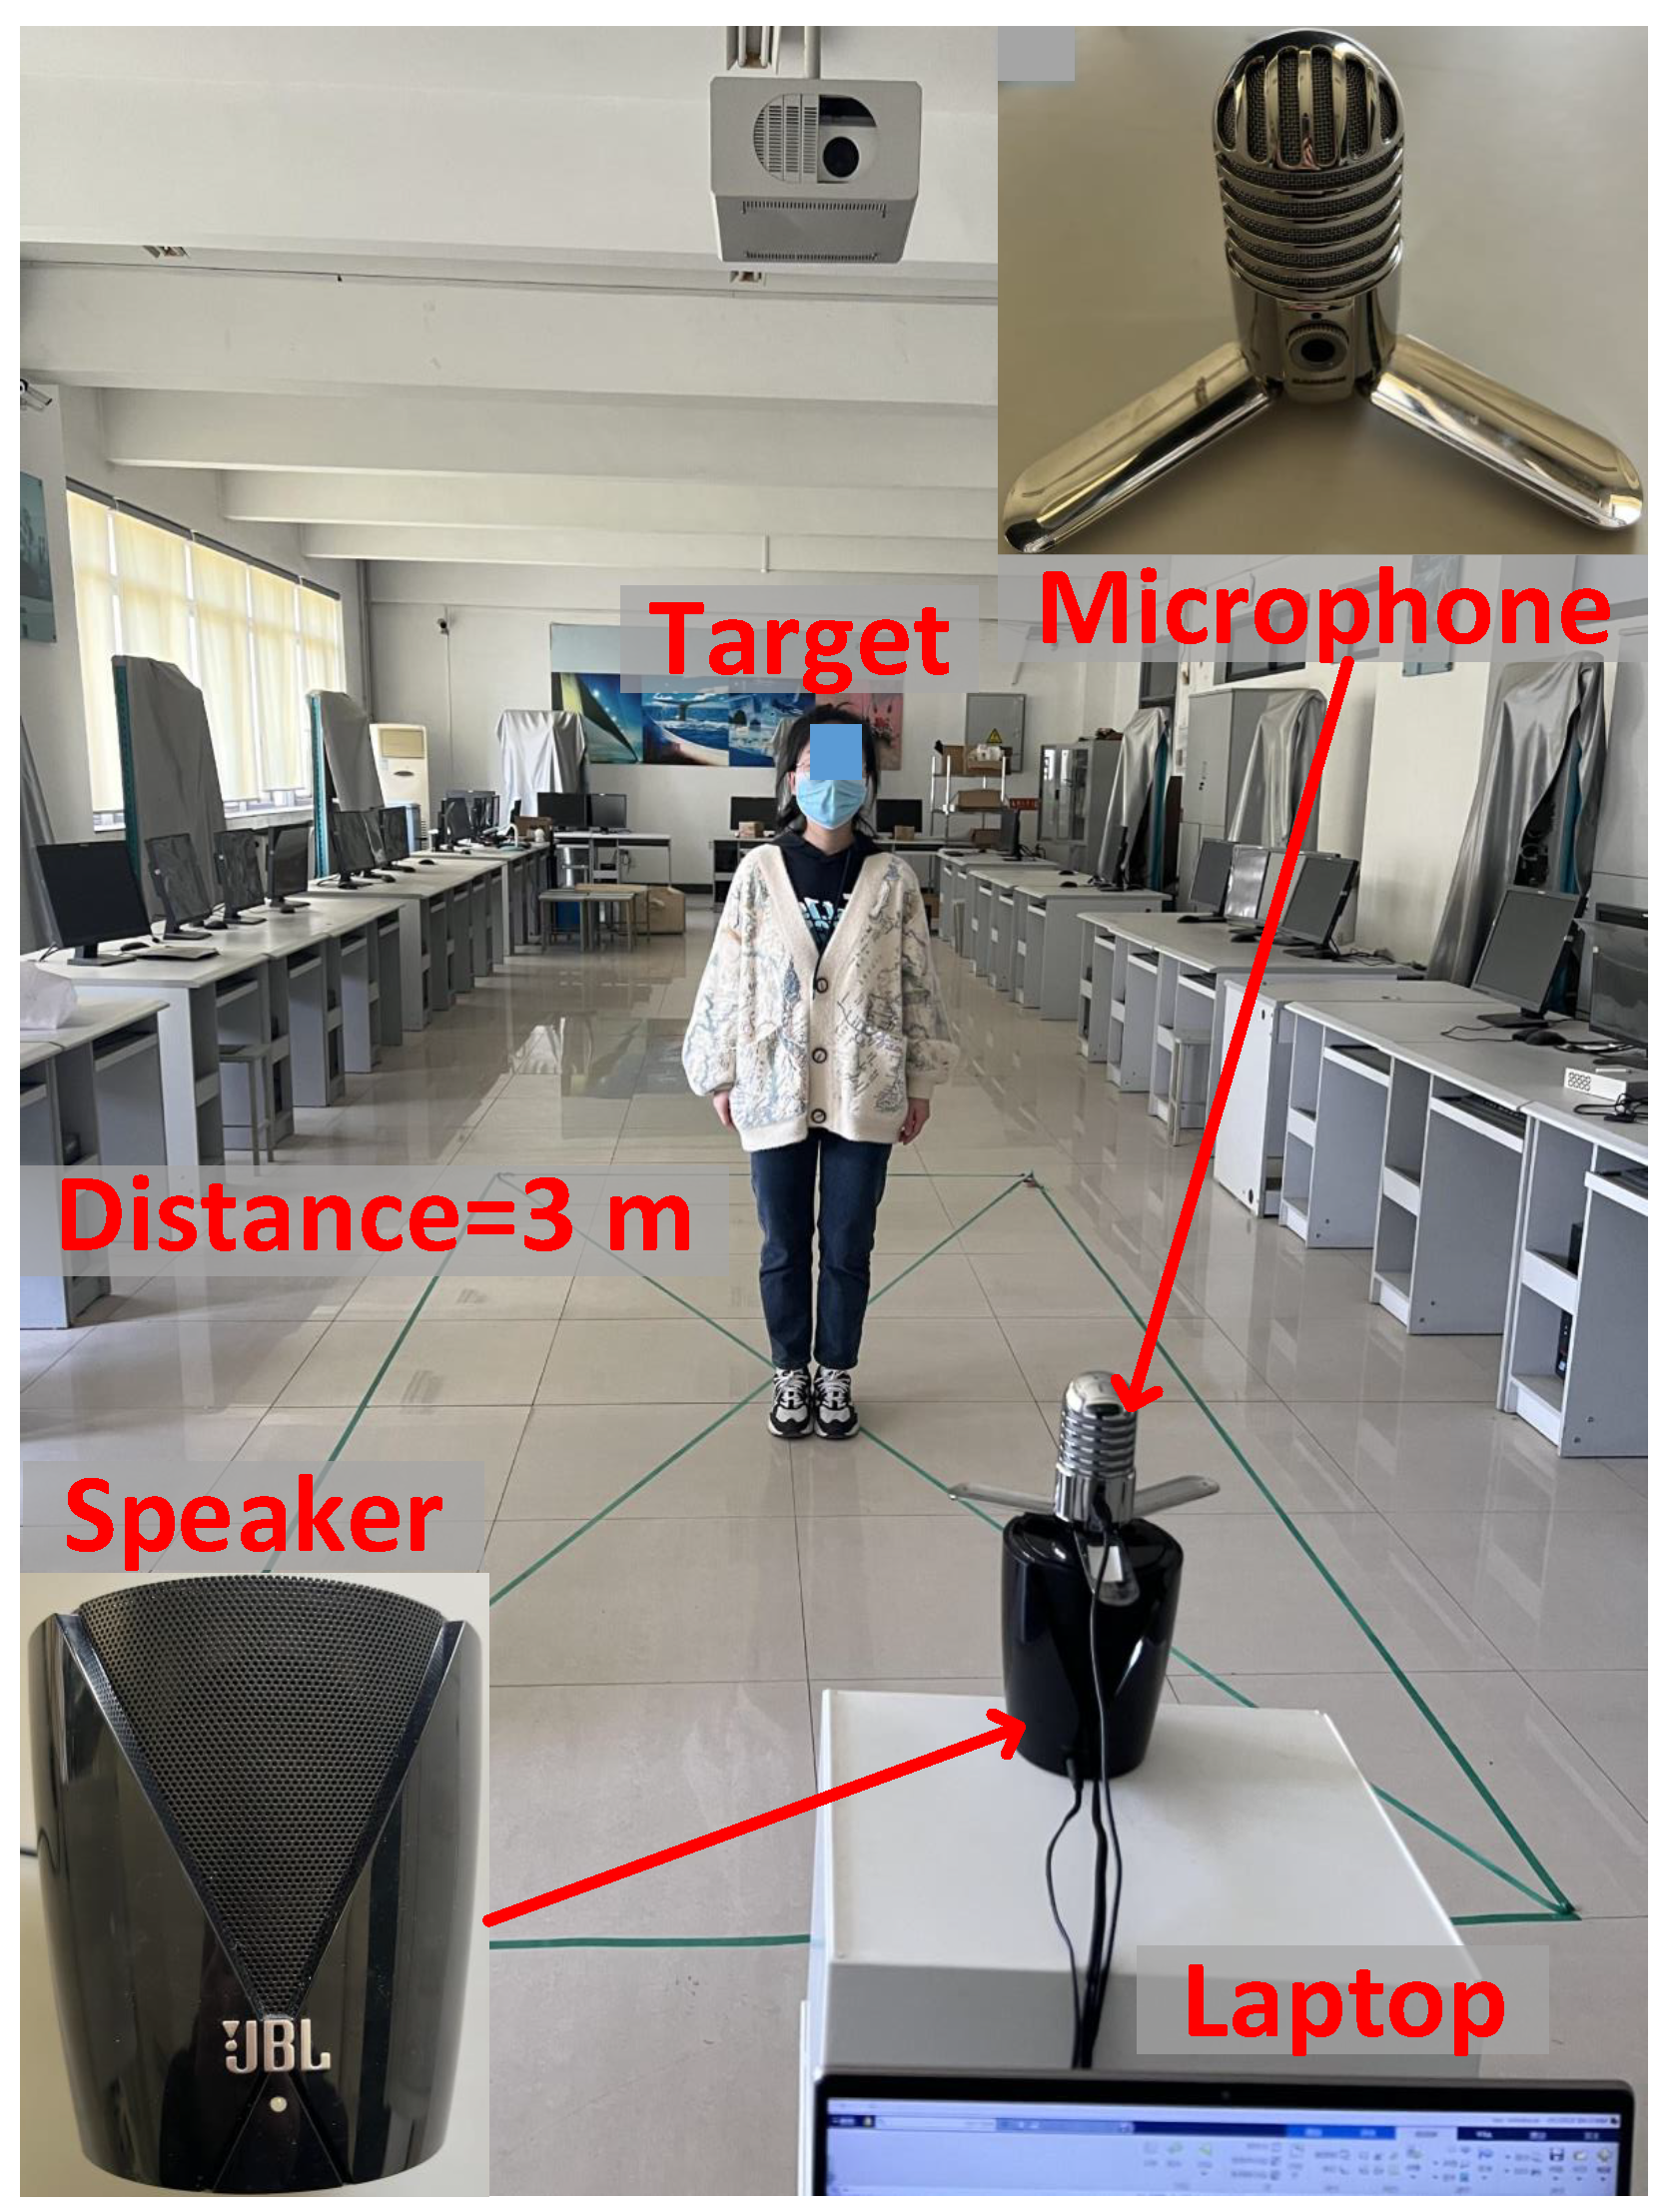
5.1. Experiment Setup
5.2. Performance Metrics
5.3. Experiments in a Indoor Laboratory
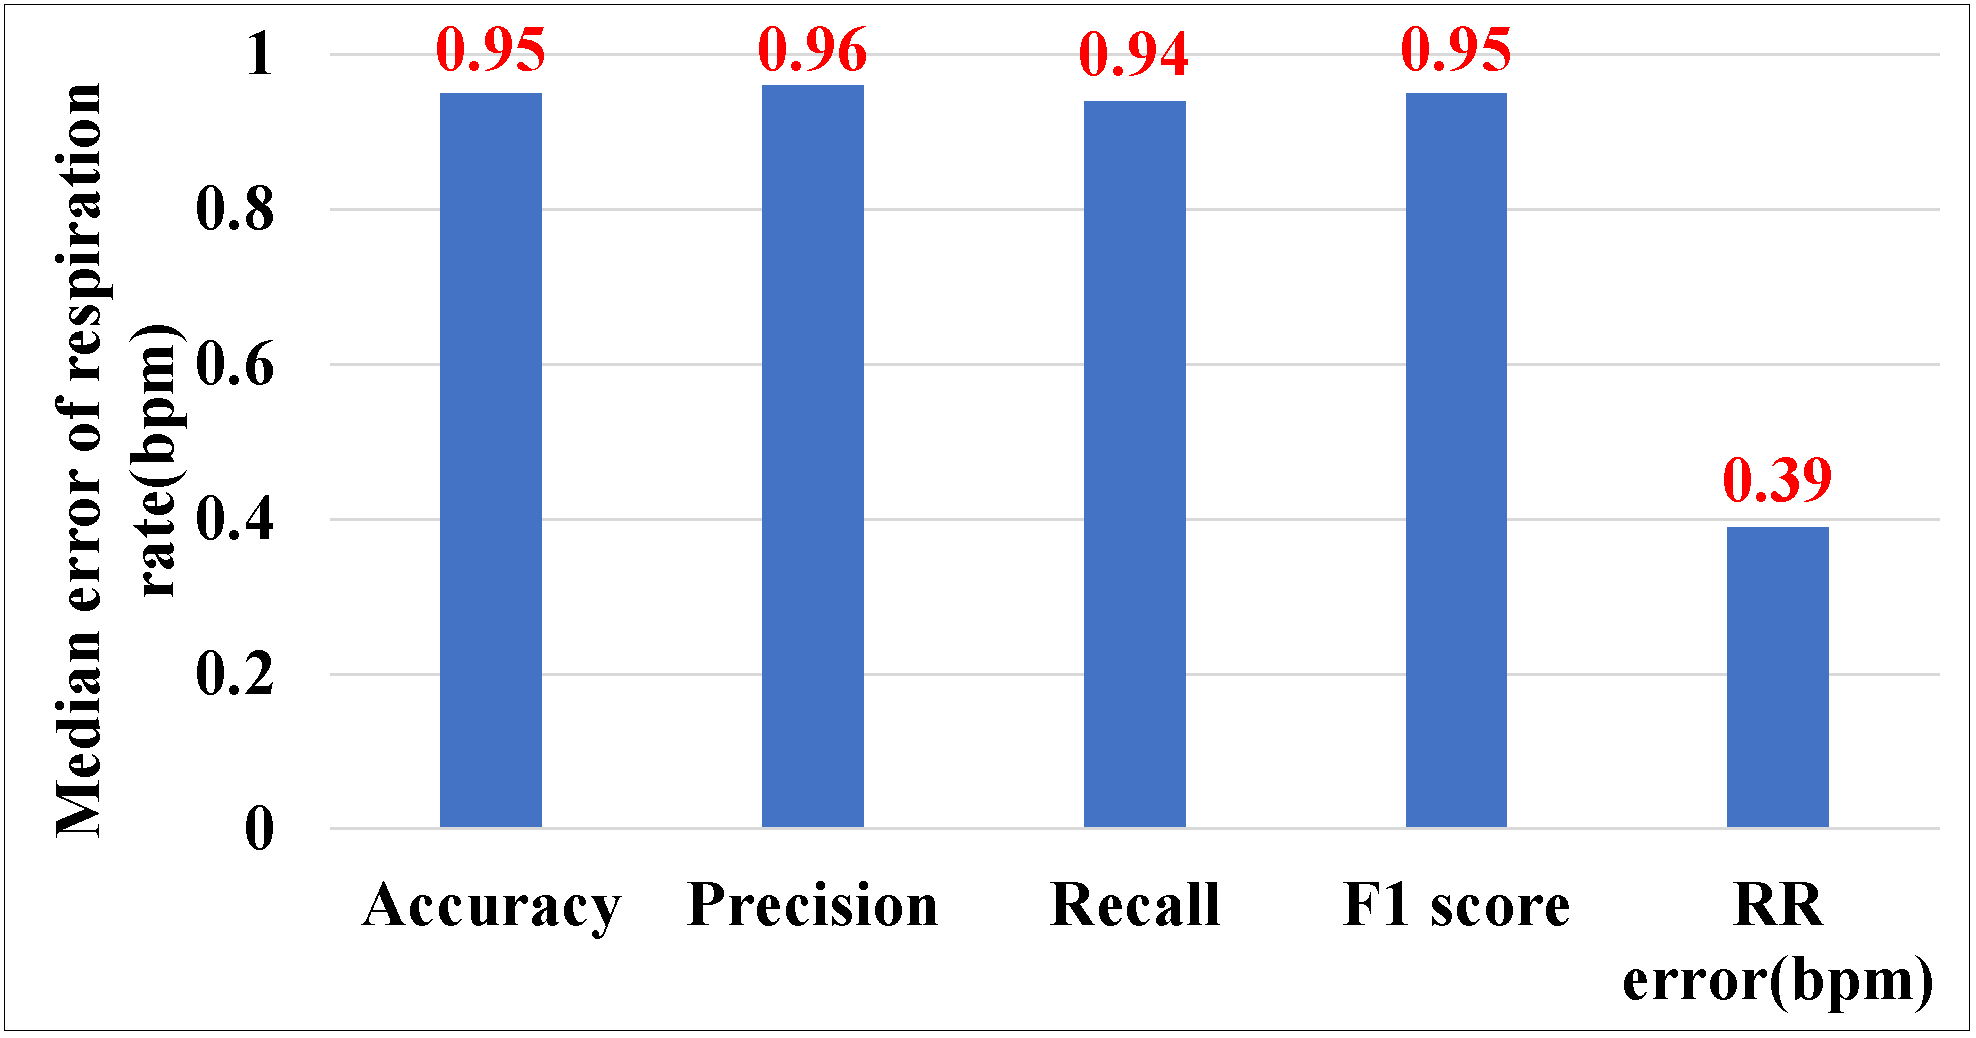
5.3.1. Overall Performance
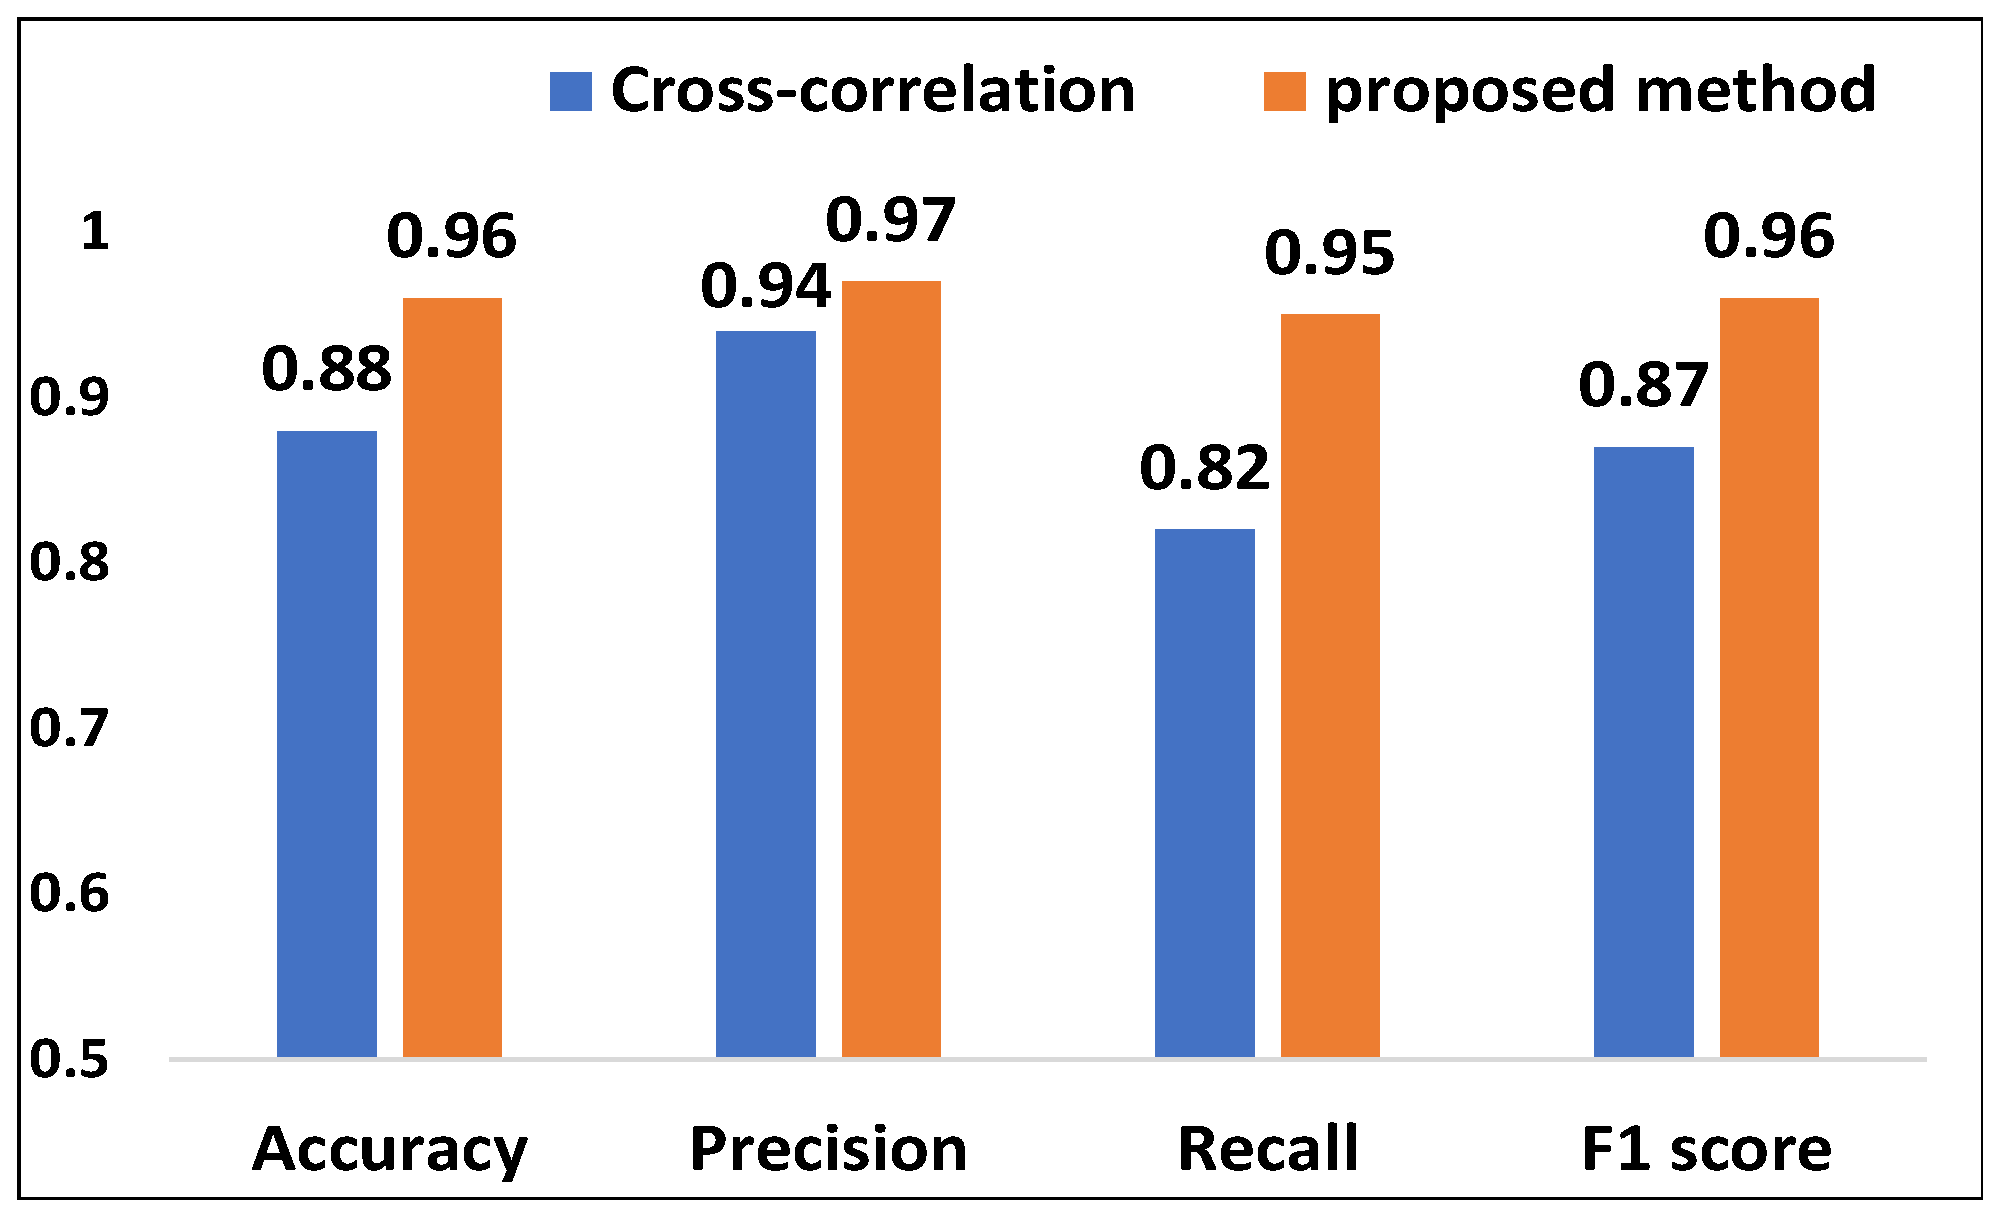
5.3.2. Evaluation of Acoustic Signal Synchronization
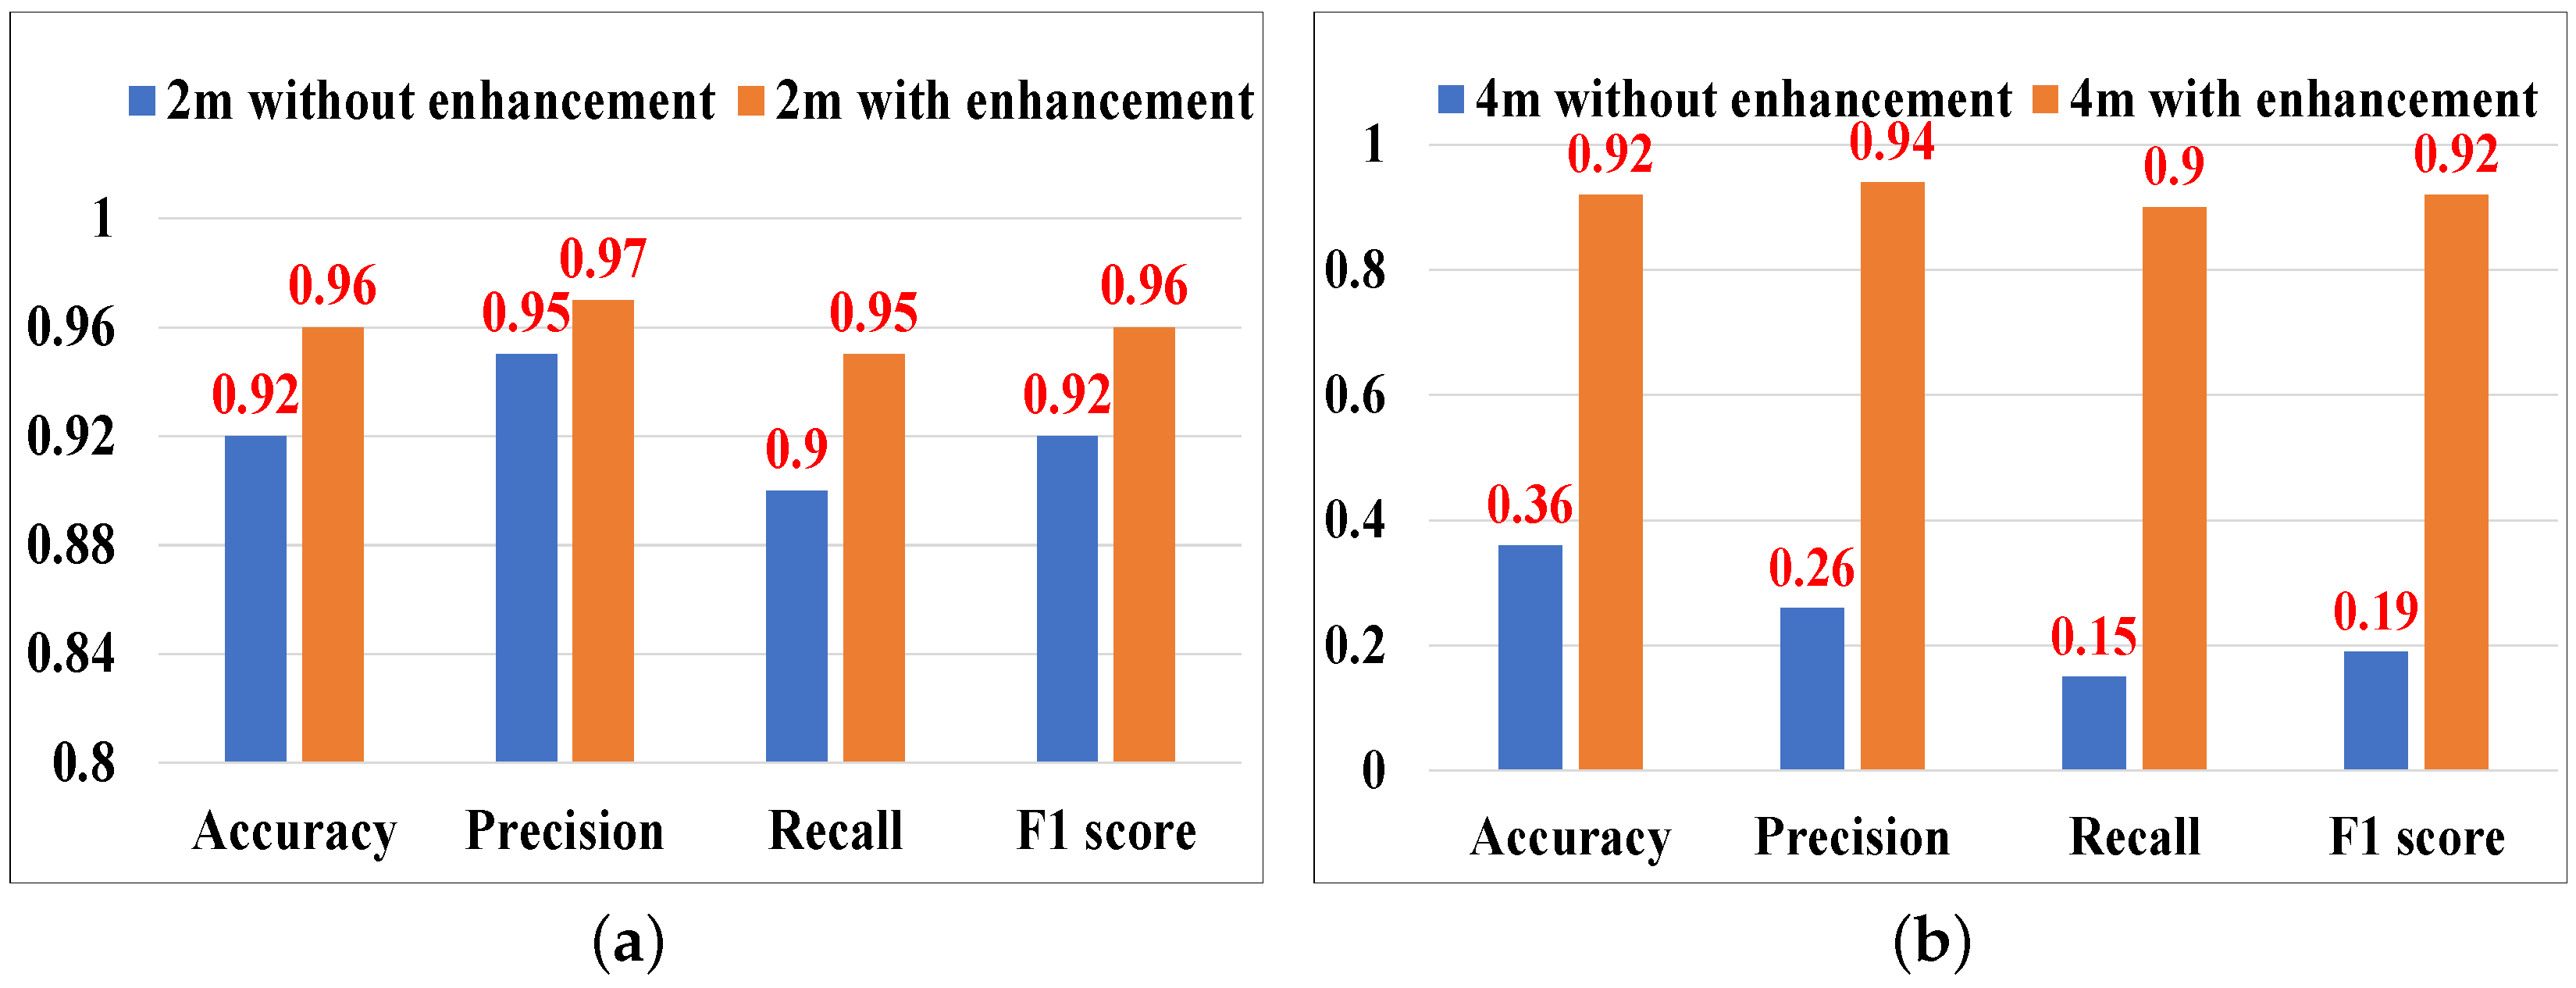
5.3.3. Evaluation of Acoustic Signal Enhancement
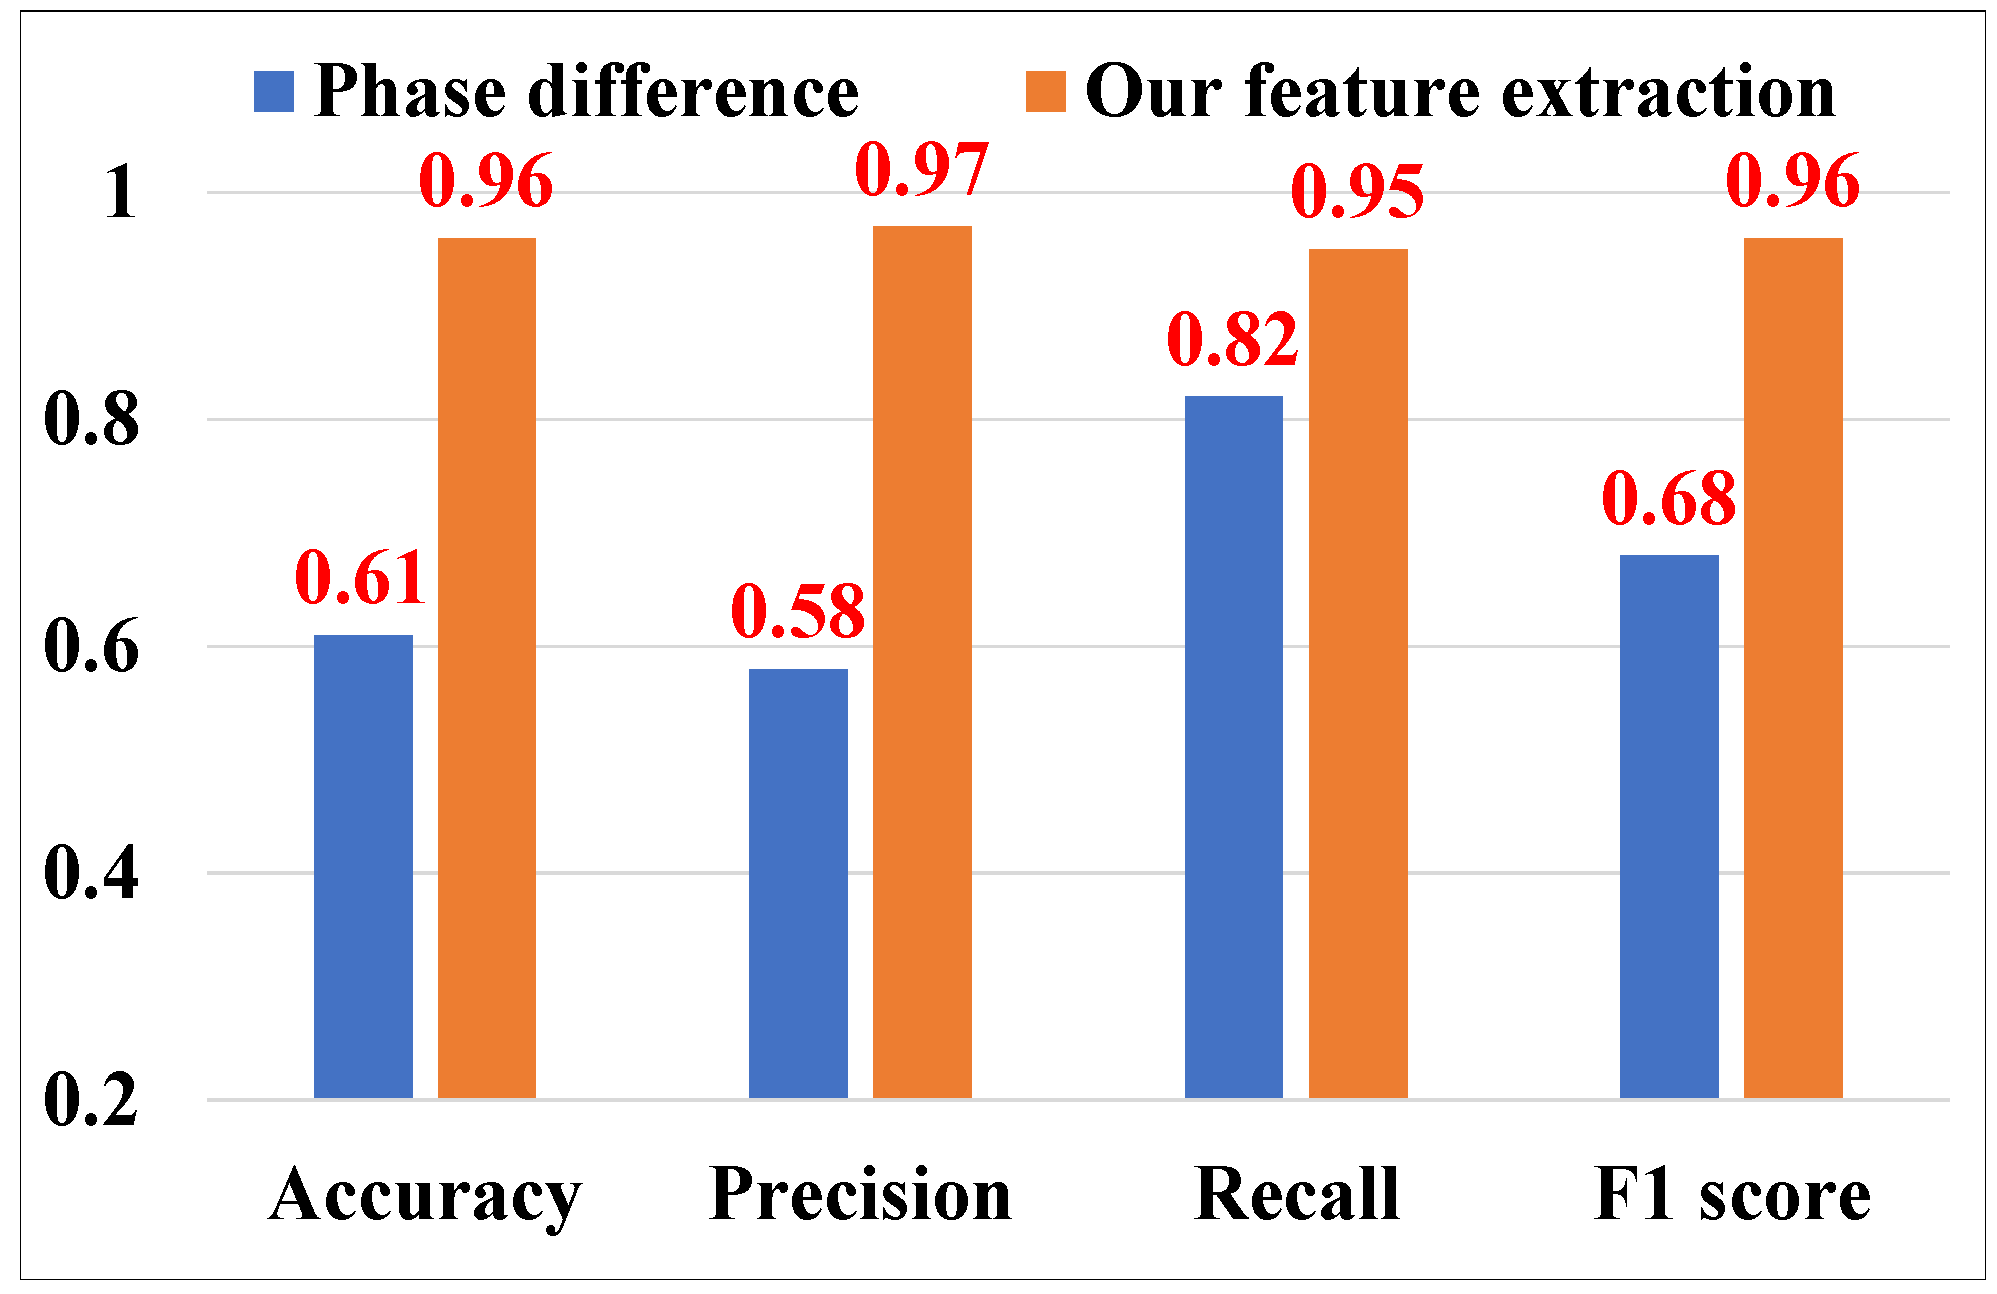
5.3.4. Evaluation of Cough Feature Extraction
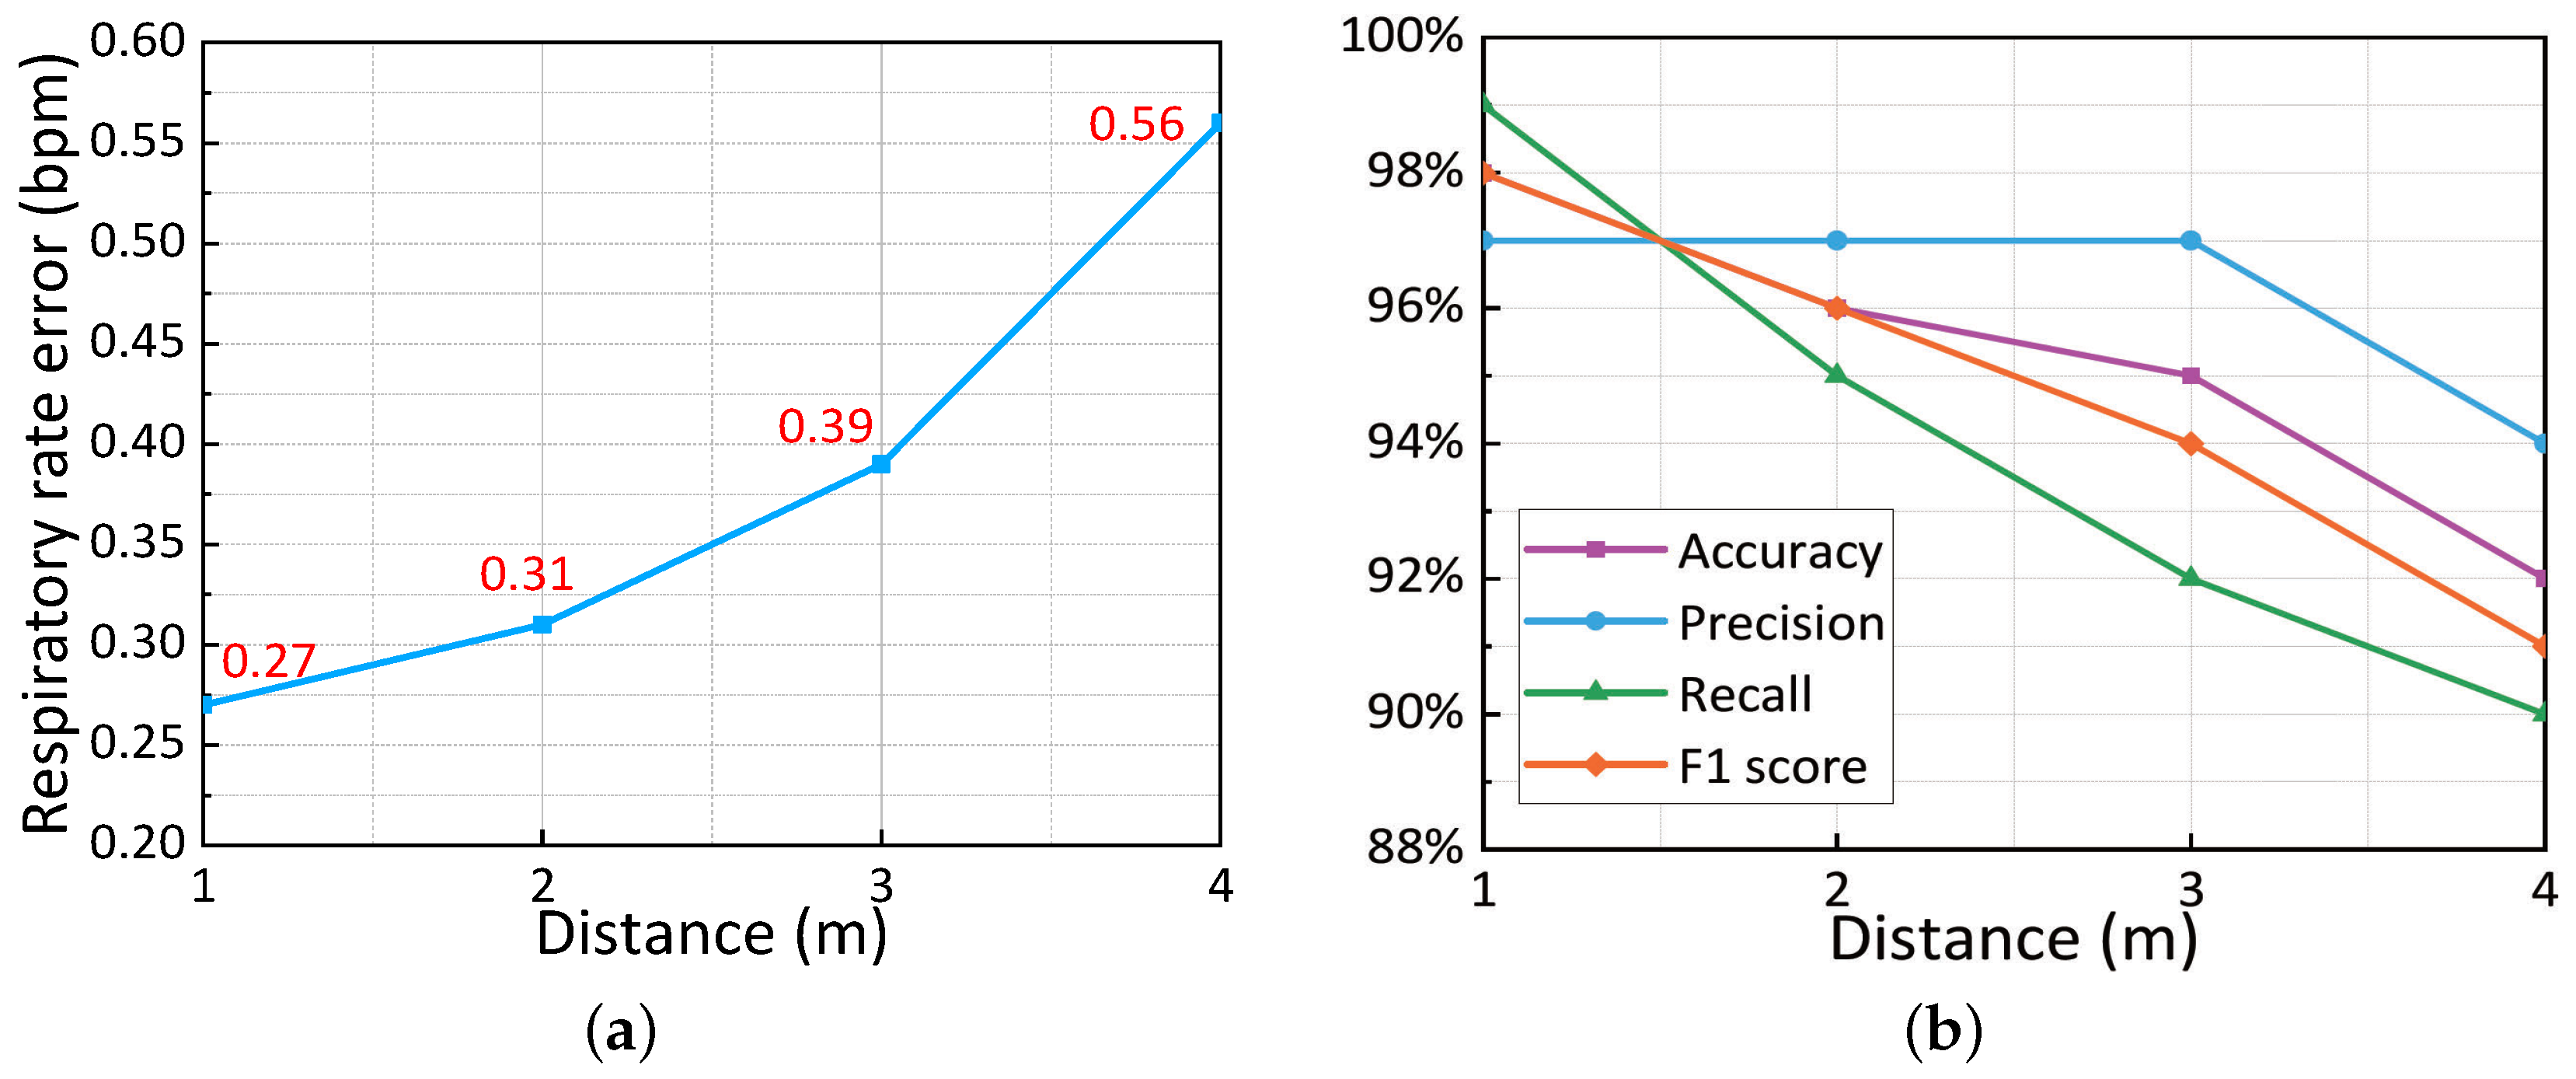
5.3.5. Impact of Different Distances
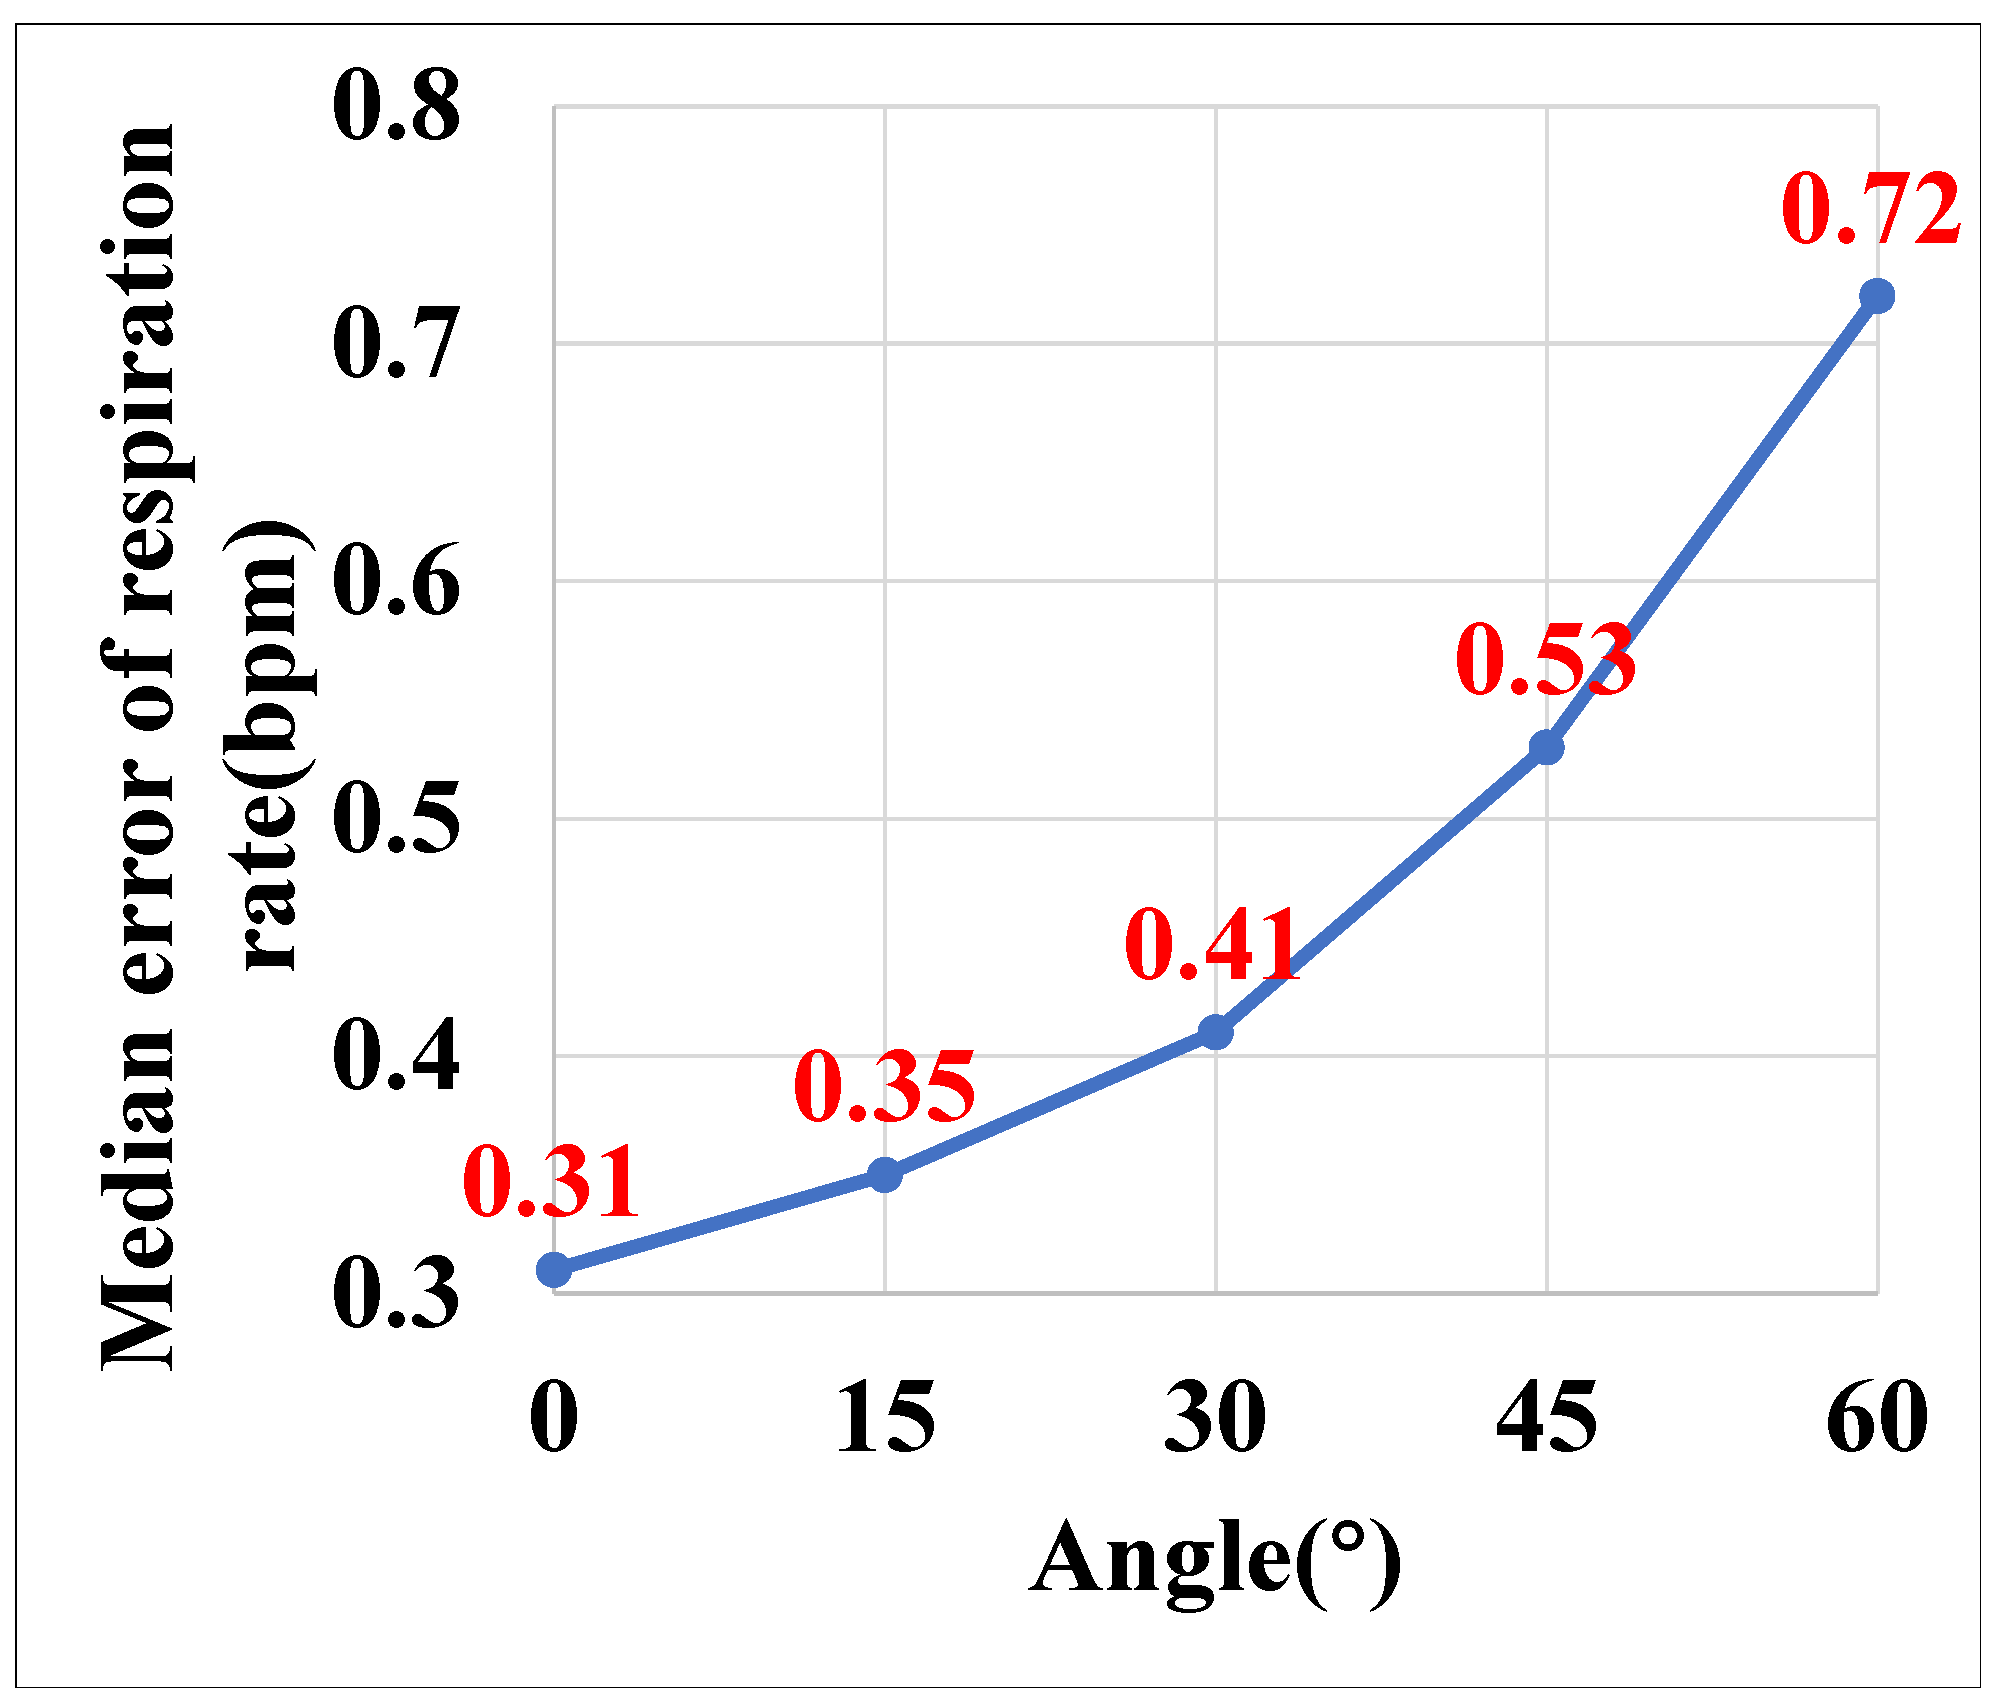
5.3.6. Impact of Different Angles
5.3.7. Impact of Different Microphones
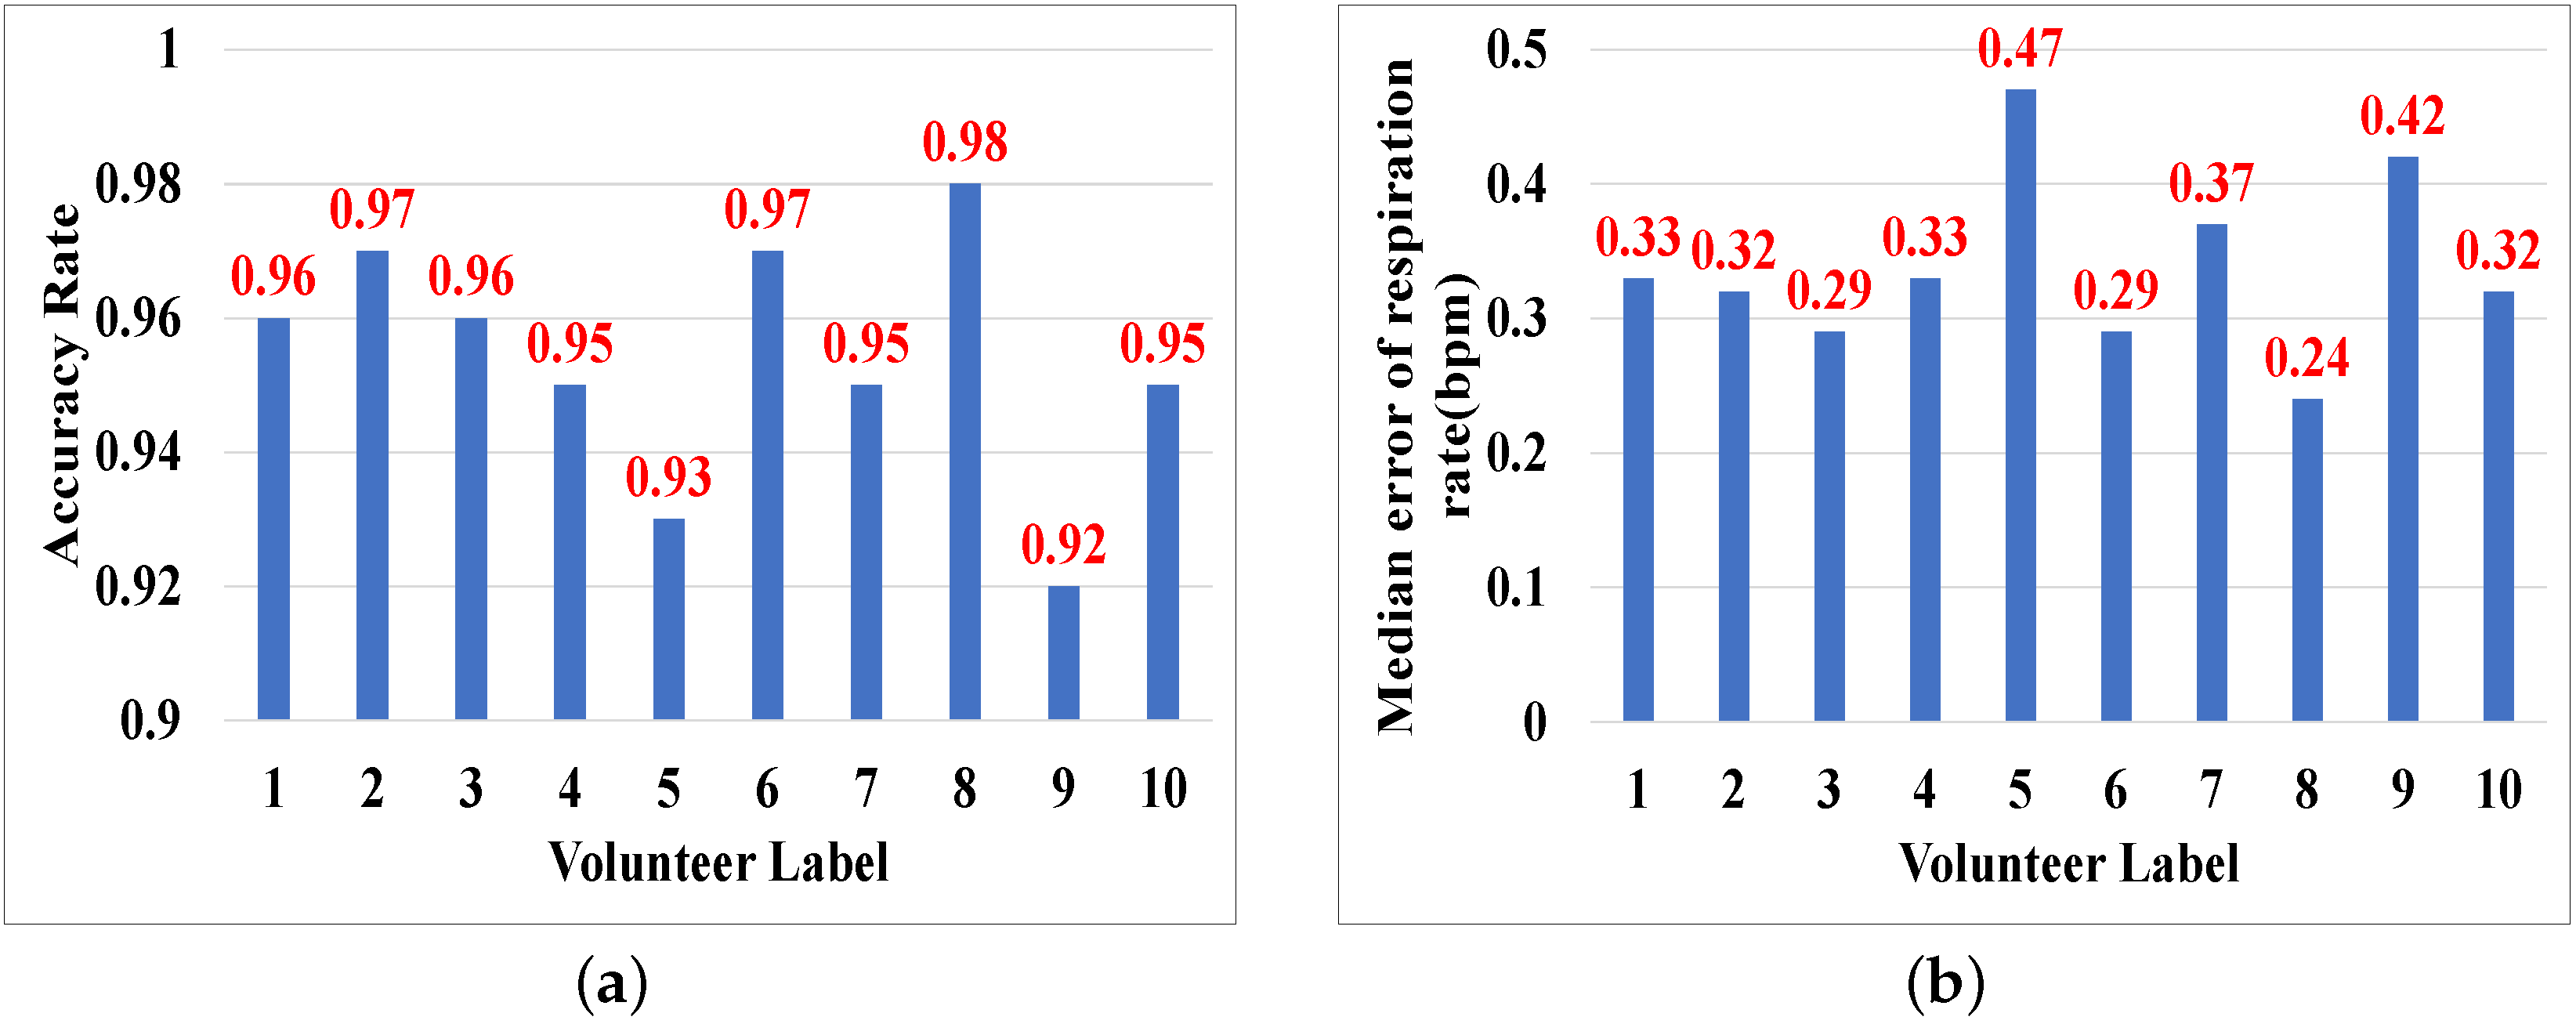
5.3.8. Impact of User Diversity
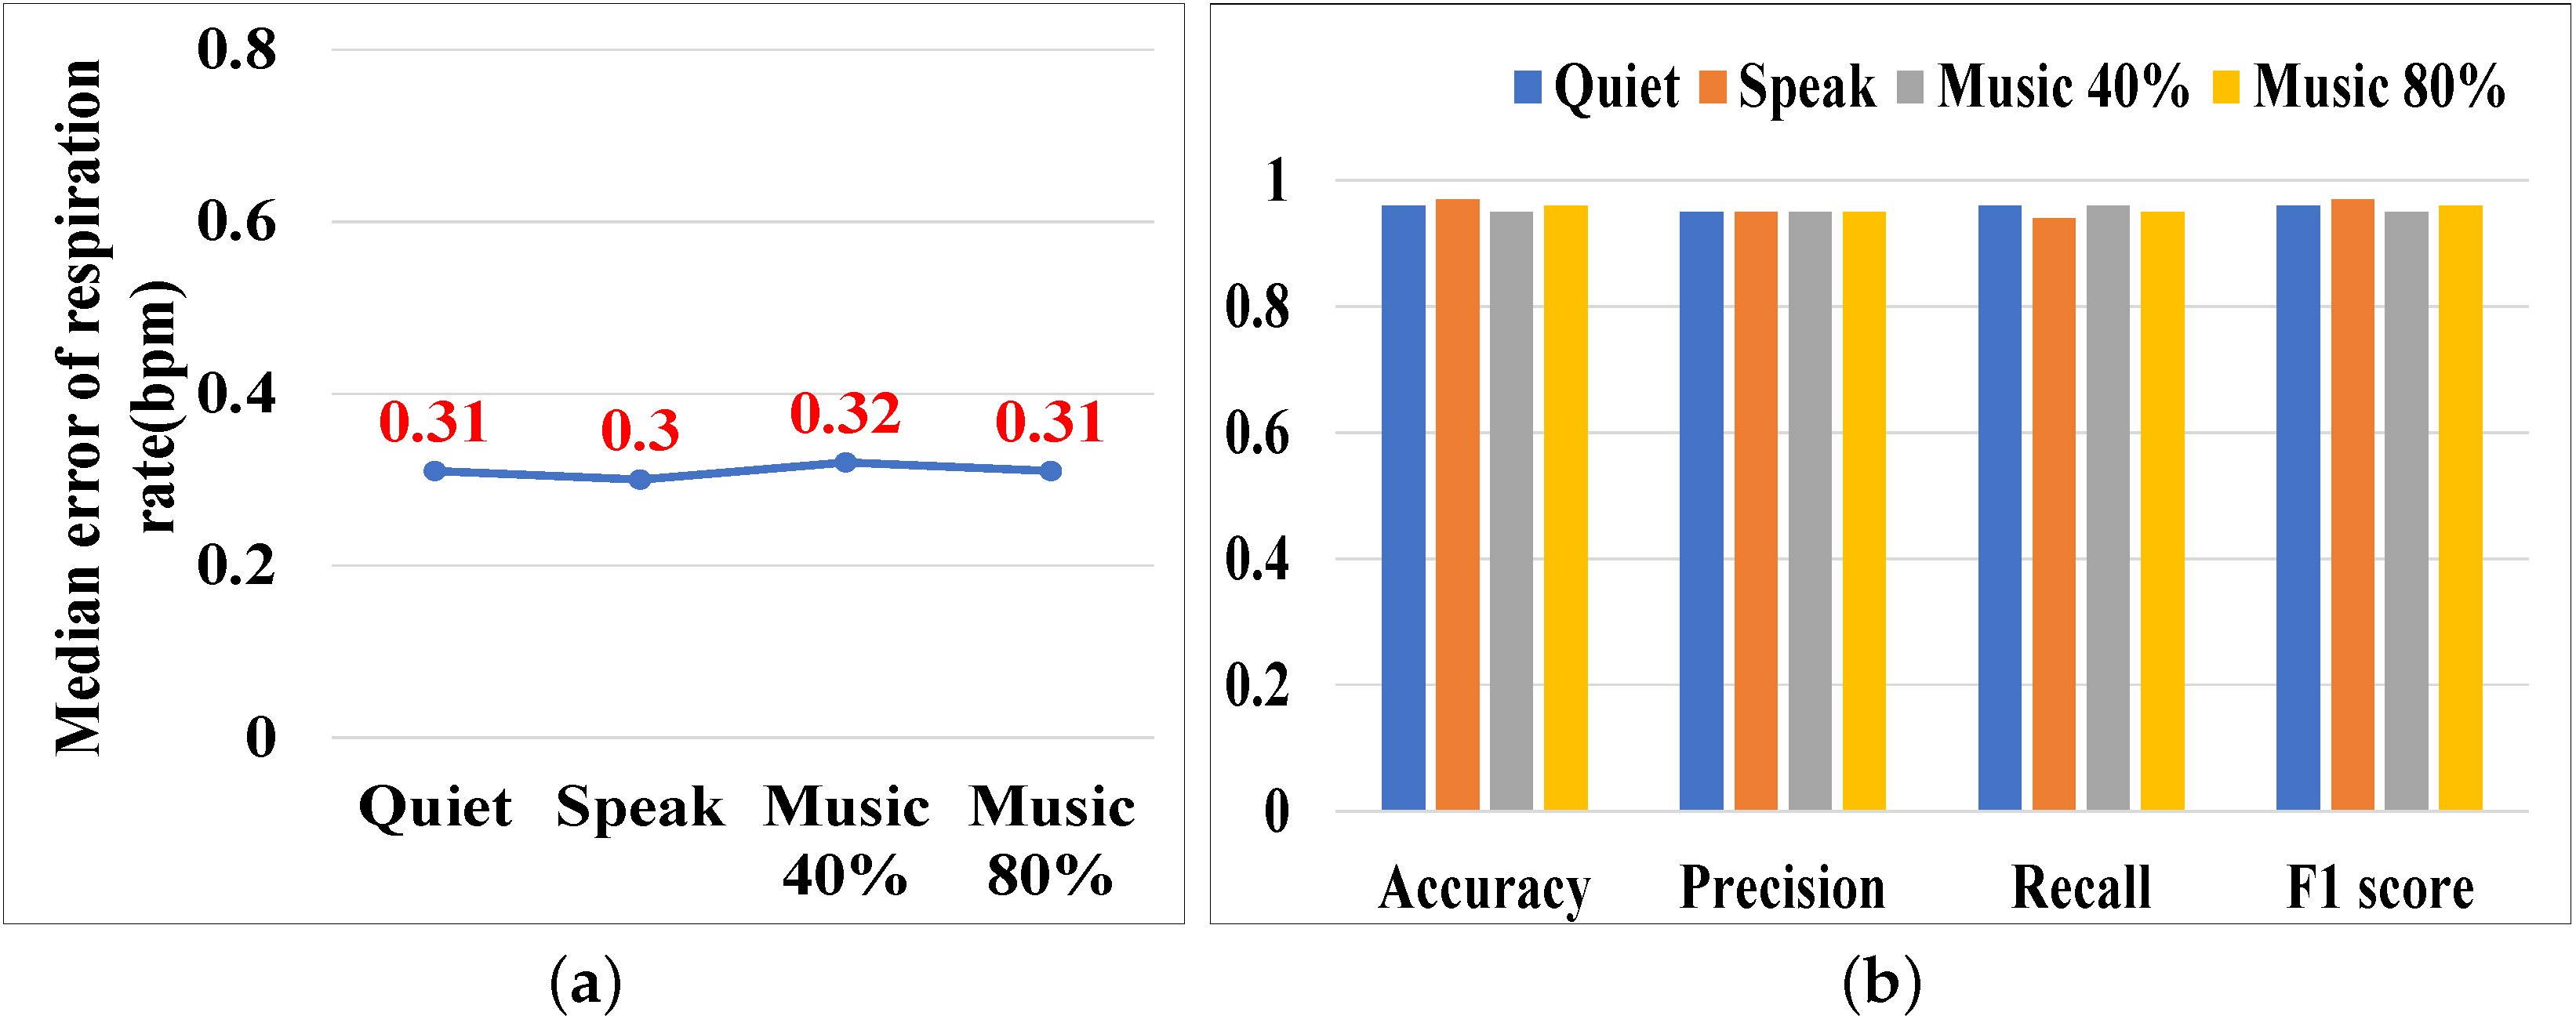
5.3.9. Impact of Ambient Noise
5.4. Experiments in a Coal Mine Laboratory
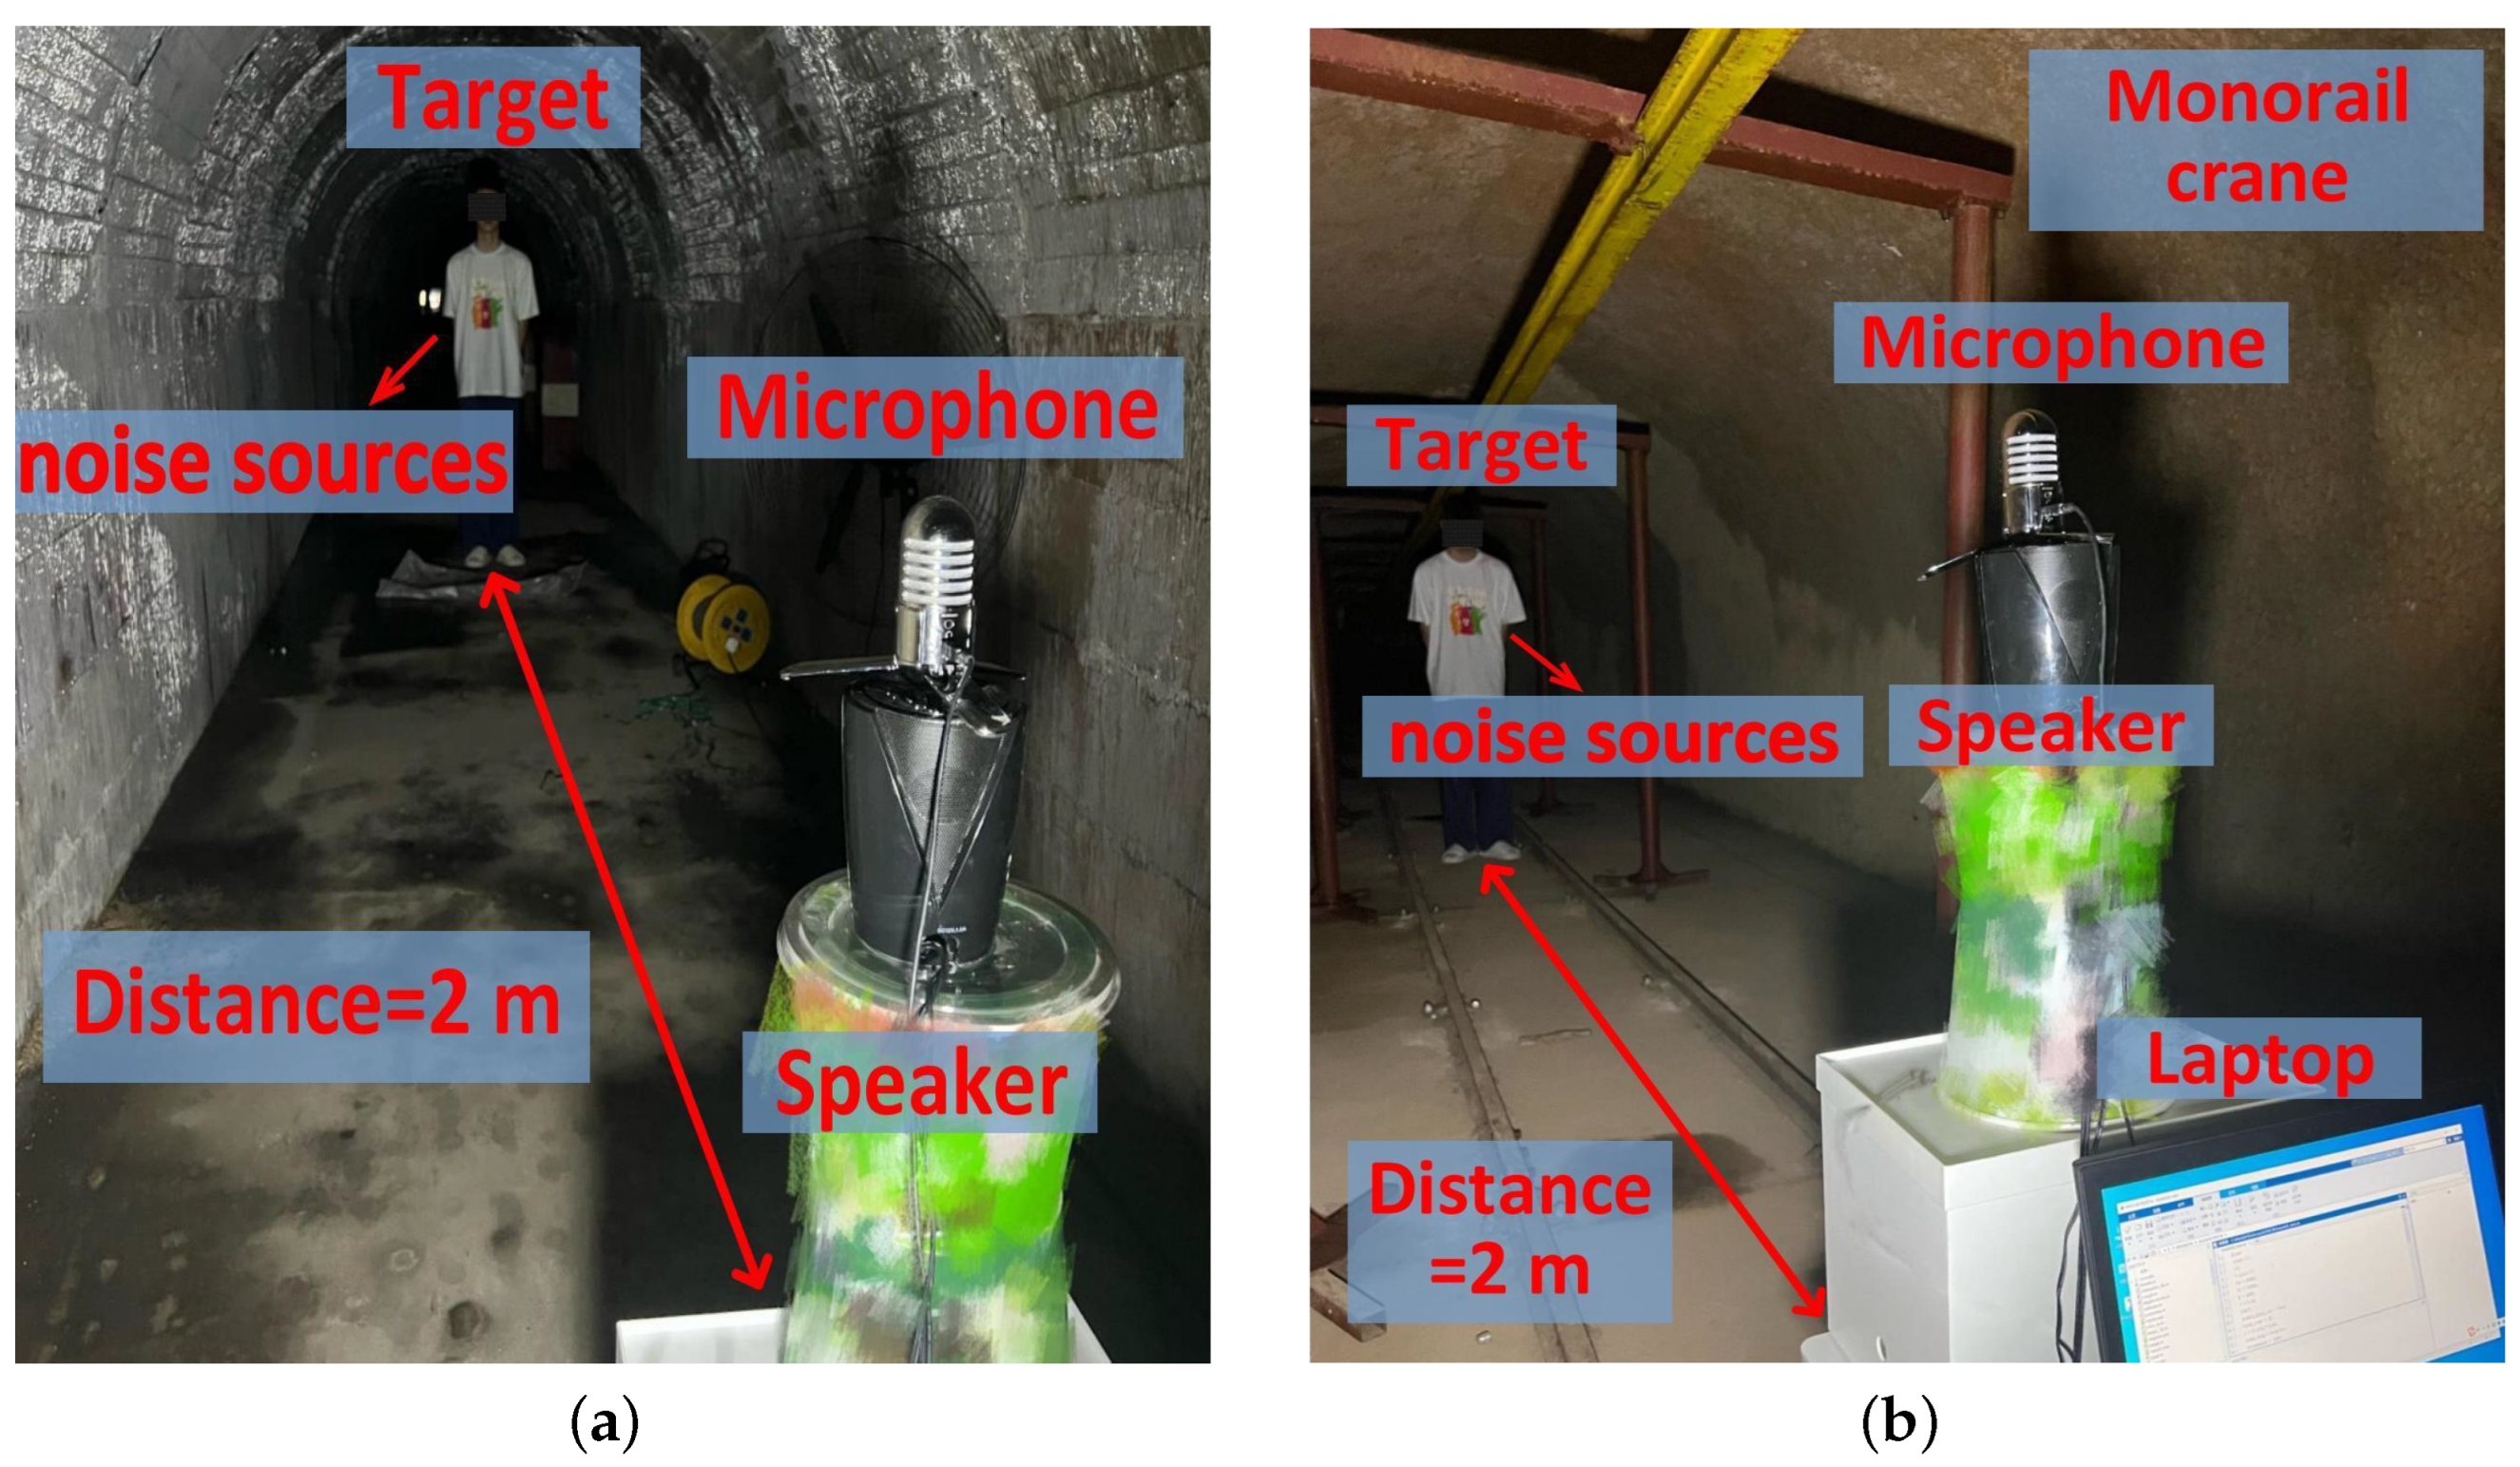
5.4.1. Implementation
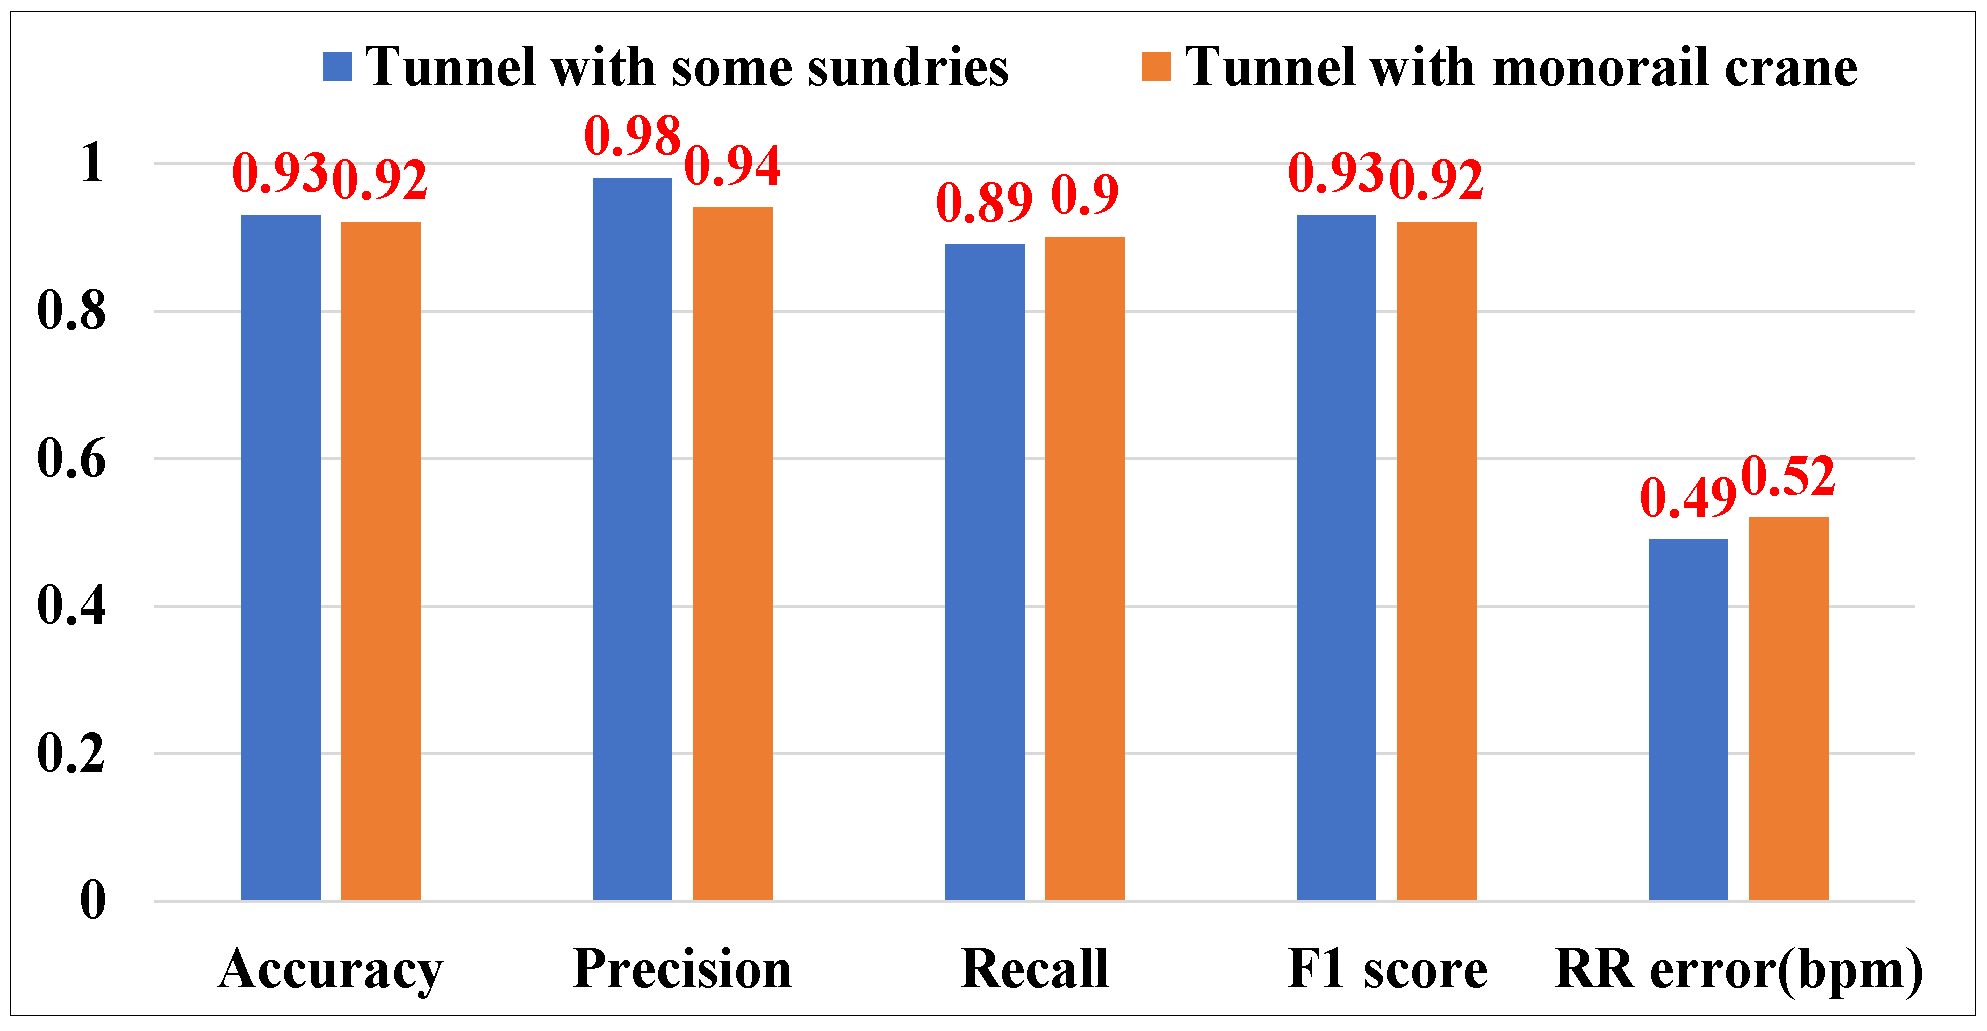
5.4.2. Sensing Performance in the Coal Mine Laboratory
6. Discussion
6.1. Multi-Target Sensing
6.2. Motion Interference
6.3. Practical Usage
7. Conclusions
Author Contributions
Funding
Institutional Review Board Statement
Informed Consent Statement
Data Availability Statement
Acknowledgments
Conflicts of Interest
References
- Liu, G.; Xu, Q.; Zhao, J.; Nie, W.; Guo, Q.; Ma, G. Research Status of Pathogenesis of Pneumoconiosis and Dust Control Technology in Mine—A Review. Appl. Sci. 2021, 11, 10313. [Google Scholar] [CrossRef]
- Xuan, W.; Zheng, L.; Bunes, B.R.; Crane, N.; Zhou, F.; Zang, L. Engineering solutions to breath tests based on an e-nose system for silicosis screening and early detection in miners. J. Breath Res. 2022, 16, 036001. [Google Scholar] [CrossRef] [PubMed]
- Fahier, N.; Yang, C.-J.; Fang, W.-C. Wearable cardiovascular monitoring system design using human body communication. In Proceedings of the 2021 IEEE International Symposium on Circuits and Systems (ISCAS), Daegu, Republic of Korea, 22–28 May 2021; IEEE: Piscataway, NJ, USA, 2021; pp. 1–5. [Google Scholar]
- Bhaskarpandit, S.; Gade, A.; Dash, S.; Tripathy, R.K.; Pachori, R. Detection of Myocardial Infarction from 12-Lead ECG Trace Images Using Eigendomain Deep Representation Learning. IEEE Trans. Instrum. Meas. 2023, 72, 1–12. [Google Scholar] [CrossRef]
- Pang, Y.-N.; Liu, B.; Wan, S.P.; Wu, T.; He, X.; Yuan, J.; Long, K.; Wu, Q. Wearable optical fiber sensor based on a bend singlemode-multimode-singlemode fiber structure for respiration monitoring. IEEE Sens. J. 2020, 21, 4610–4617. [Google Scholar] [CrossRef]
- Dai, Y.; Liang, X.; Wang, L.; Duan, Q.; Yang, H.; Zhang, C.; Chen, X. MultiChannelSleepNet: A Transformer-based Model for Automatic Sleep Stage Classification with PSG. IEEE J. Biomed. Health Inform. 2023, 27, 4204–4215. [Google Scholar] [CrossRef] [PubMed]
- Aarts, V.; Dellimore, K.H.; Wijshoff, R.; Derkx, R.; van de Laar, J.; Muehlstedt, J. Performance of an accelerometer-based pulse presence detection approach compared to a reference sensor. In Proceedings of the 2017 IEEE 14th International Conference on Wearable and Implantable Body Sensor Networks (BSN), Eindhoven, The Netherlands, 9–12 May 2017; IEEE: Piscataway, NJ, USA, 2017; pp. 165–168. [Google Scholar]
- Zschocke, J.; Leube, J.; Glos, M.; Penzel, T.; Bartsch, R.; Kantelhardt, J.W. Construction of pulse wave and respiration from wrist accelerometer during sleep. IEEE Trans. Biomed. Eng. 2021, 69, 830–839. [Google Scholar] [CrossRef]
- Földesy, P.; Zarándy, Á.; Szabó, M. Reference free incremental deep learning model applied for camera-based respiration monitoring. IEEE Sens. J. 2020, 21, 2346–2352. [Google Scholar] [CrossRef]
- Yin, Y.; Yang, X.; Xiong, J.; Niu, Q. Ubiquitous Smartphone-Based Respiration Sensing with Wi-Fi Signal. IEEE Internet Things J. 2021, 9, 1479–1490. [Google Scholar] [CrossRef]
- Ali, K.; Alloulah, M.; Kawsar, F.; Liu, A.X. On goodness of wi-fi based monitoring of sleep vital signs in the wild. IEEE Trans. Mob. Comput. 2021, 22, 341–355. [Google Scholar] [CrossRef]
- Liu, C.; Xiong, J.; Cai, L.; Feng, L.; Fang, D.Y. Beyond respiration: Contactless sleep sound-activity recognition using RF signals. Proc. ACM Interact. Mob. Wearable Ubiquitous Technol. 2019, 3, 1–22. [Google Scholar] [CrossRef]
- Rong, Y.; Mishra, K.V.; Bliss, D.W. Sparse processing for driver respiration monitoring using in-vehicle mmwave radar. In Proceedings of the 2022 IEEE/MTT-S International Microwave Symposium-IMS 2022, Denver, CO, USA, 19–24 June 2022; IEEE: Piscataway, NJ, USA, 2022; pp. 440–443. [Google Scholar]
- Xie, B.; Xiong, J. Pushing the limits of long range wireless sensing with lora. Proc. ACM Interact. Mob. Wearable Ubiquitous Technol. 2021, 5, 1–21. [Google Scholar] [CrossRef]
- Xie, B.; Xiong, J. Combating interference for long range LoRa sensing. In Proceedings of the 18th Conference on Embedded Networked Sensor Systems, Yokohama, Japan, 16–19 November 2020; pp. 69–81. [Google Scholar]
- Abuella, H.; Ekin, S. Non-contact vital signs monitoring through visible light sensing. IEEE Sens. J. 2019, 20, 3859–3870. [Google Scholar] [CrossRef]
- Van Der Zwaag, K.M.; Marinho, M.; Pontara, W.D.S.; Dos Santos, F.D.A.S.; Bastos-Filho, T.; Rocha, H.; Segatto, M.E.V. A manchester-ook visible light communication system for patient monitoring in intensive care units. IEEE Access 2021, 9, 104217–104226. [Google Scholar] [CrossRef]
- Wu, Y.; Li, F.; Xie, Y.; Wang, Y.; Zhang, D. SymListener: Detecting Respiratory Symptoms via Acoustic Sensing in Driving Environments. Acm Trans. Sens. Netw. 2023, 19, 1–21. [Google Scholar] [CrossRef]
- Wang, L.; Gu, T.; Li, W.; Dai, H.; Zhang, Y.; Yu, D.; Xu, C.; Zhang, D.Q. DF-Sense: Multi-user Acoustic Sensing for Heartbeat Monitoring with Dualforming. In Proceedings of the 21st Annual International Conference on Mobile Systems, Applications and Services, Helsinki Finland, 18–22 June 2023; pp. 1–13. [Google Scholar]
- Zhang, F.; Wang, Z.; Jin, B.; Xiong, J.; Zhang, D. Your Smart Speaker Can “Hear” Your Heartbeat! Proc. ACM Interact. Mob. Wearable Ubiquitous Technol. 2020, 4, 1–24. [Google Scholar] [CrossRef]
- Møller, H.; Pedersen, C.S. Hearing at low and infrasonic frequencies. Noise Health 2004, 6, 37–57. [Google Scholar]
- Zhang, X.; Bao, Z.; Yin, Y.; Yang, X.; Xu, X.; Niu, Q. Finding Potential Pneumoconiosis Patients with Commercial Acoustic Device. In Proceedings of the 2023 IEEE Symposium on Computers and Communications (ISCC), Gammarth, Tunisia, 9–12 July 2023; IEEE: Piscataway, NJ, USA, 2023; pp. 310–315. [Google Scholar]
- Lázaro, J.; Reljin, N.; Bailón, R.; Gil, E.; Noh, Y.; Laguna, P.; Chon, K.; Ki, H. Electrocardiogram derived respiratory rate using a wearable armband. IEEE Trans. Biomed. Eng. 2020, 68, 1056–1065. [Google Scholar] [CrossRef]
- Shi, C.; Tang, Z.; Zhang, H.; Liu, Y. Development of an FBG-Based Wearable Sensor for Simultaneous Respiration and Heartbeat Measurement. IEEE Trans. Instrum. Meas. 2022, 72, 1–9. [Google Scholar]
- Qiu, C.; Yuce, M.R. A Wearable Bioimpedance Chest Patch for IoHT-Connected Respiration Monitoring. In Proceedings of the 2021 43rd Annual International Conference of the IEEE Engineering in Medicine & Biology Society (EMBC), Guadalajara, Mexico, 26–30 July 2021; IEEE: Piscataway, NJ, USA, 2021; pp. 6924–6927. [Google Scholar]
- Jeon, Y.; Heo, K.; Kang, S.J. Real-time sleep apnea diagnosis method using wearable device without external sensors. In Proceedings of the 2020 IEEE International Conference on Pervasive Computing and Communications Workshops (PerCom Workshops), Austin, TX, USA, 23–27 March 2020; IEEE: Piscataway, NJ, USA, 2020; pp. 1–5. [Google Scholar]
- Zhai, Q.; Han, X.; Yi, J.; Liu, T.; Gu, T.; Dorizzi, B. A contactless on-bed radar system for human respiration monitoring. IEEE Trans. Instrum. Meas. 2022, 71, 1–10. [Google Scholar] [CrossRef]
- Zhang, F.; Chang, Z.; Niu, K.; Xiong, J.; Jin, B. Exploring lora for long-range through-wall sensing. Proc. ACM Interact. Mob. Wearable Ubiquitous Technol. 2020, 4, 1–27. [Google Scholar] [CrossRef]
- Gabbrielli, A.; Bordoy, J.; Xiong, W.; Fischer, G.K.J.; Schaechtle, T.; Wendeberg, J.; Höflinger, F.; Schindelhauer, C. RAILS: 3-D Real-Time Angle of Arrival Ultrasonic Indoor Localization System. IEEE Trans. Instrum. Meas. 2022, 72, 1–15. [Google Scholar] [CrossRef]
- Li, D.; Liu, J.; Xiong, J. Room-Scale Hand Gesture Recognition Using Smart Speakers. In Proceedings of the 20th ACM Conference on Embedded Networked Sensor System, Istanbul, Türkiye, 12–17 November 2023; pp. 462–475. [Google Scholar]
- Xu, W.; Yu, Z.; Wang, Z.; Guo, B. Acousticid: Gait-based human identification using acoustic signal. Proc. ACM Interact. Mob. Wearable Ubiquitous Technol. 2019, 3, 1–25. [Google Scholar] [CrossRef]
- Lian, J.; Yuan, X.; Li, M.; Tzeng, N.-F. Fall Detection via Inaudible Acoustic Sensing. Proc. ACM Interact. Mob. Wearable Ubiquitous Technol. 2021, 5, 1–21. [Google Scholar] [CrossRef]
- Liu, J.; Li, D.; Wang, L.; Xiong, J. BlinkListener: “Listen” to Your Eye Blink Using Your Smartphone. Proc. ACM Interact. Mob. Wearable Ubiquitous Technol. 2021, 5, 1–27. [Google Scholar] [CrossRef]
- Wang, T.; Zhang, D.; Wang, L.; Zheng, Y.; Gu, T.; Dorizzi, B. Contactless respiration monitoring using ultrasound signal with off-the-shelf audio devices. IEEE Internet Things J. 2018, 6, 2959–2973. [Google Scholar] [CrossRef]
- Nandakumar, R.; Gollakota, S.; Watson, N. Contactless sleep apnea detection on smartphones. In Proceedings of the 13th Annual International Conference on Mobile Systems, Applications, and Services, Florence, Italy, 18–22 May 2015; pp. 45–57. [Google Scholar]
- Liang, X.; Wang, G.; Han, Z. A low-cost collaborative indoor localization system based on smartphone platform. In Proceedings of the 2018 IEEE International Conference on Internet of Things (iThings) and IEEE Green Computing and Communications (GreenCom) and IEEE Cyber, Physical and Social Computing (CPSCom) and IEEE Smart Data (SmartData), Halifax, NS, Canada, 30 July–3 August 2018; IEEE: Piscataway, NJ, USA, 2018; pp. 404–411. [Google Scholar]
- John, A.; Sadasivan, J.; Seelamantula, C. Adaptive Savitzky-Golay filtering in non-Gaussian noise. IEEE Trans. Signal Process. 2021, 69, 5021–5036. [Google Scholar] [CrossRef]
- Li, D.; Liu, J.; Lee, S.I.; Xiong, J. LASense: Pushing the limits of fine-grained activity sensing using acoustic signals. Proc. ACM Interact. Mob. Wearable Ubiquitous Technol. 2022, 6, 1–27. [Google Scholar] [CrossRef]
- Zeiler, A.; Faltermeier, R.; Keck, I.R.; Tomé, A.M.; Puntonet, C.G.; Lang, E.W. Empirical mode decomposition—An introduction. In Proceedings of the 2010 International Joint Conference on Neural Networks (IJCNN), Barcelona, Spain, 18–23 July 2010; IEEE: Piscataway, NJ, USA, 2010; pp. 1–8. [Google Scholar]
Disclaimer/Publisher’s Note: The statements, opinions and data contained in all publications are solely those of the individual author(s) and contributor(s) and not of MDPI and/or the editor(s). MDPI and/or the editor(s) disclaim responsibility for any injury to people or property resulting from any ideas, methods, instructions or products referred to in the content. |
© 2025 by the authors. Licensee MDPI, Basel, Switzerland. This article is an open access article distributed under the terms and conditions of the Creative Commons Attribution (CC BY) license (https://creativecommons.org/licenses/by/4.0/).
Share and Cite
Bao, Z.; Xu, B.; Zhang, X.; Yin, Y.; Yang, X.; Niu, Q. Potential Pneumoconiosis Patients Monitoring and Warning System with Acoustic Signal. Sensors 2025, 25, 1874. https://doi.org/10.3390/s25061874
Bao Z, Xu B, Zhang X, Yin Y, Yang X, Niu Q. Potential Pneumoconiosis Patients Monitoring and Warning System with Acoustic Signal. Sensors. 2025; 25(6):1874. https://doi.org/10.3390/s25061874
Chicago/Turabian StyleBao, Zhongxu, Baoxuan Xu, Xuehan Zhang, Yuqing Yin, Xu Yang, and Qiang Niu. 2025. "Potential Pneumoconiosis Patients Monitoring and Warning System with Acoustic Signal" Sensors 25, no. 6: 1874. https://doi.org/10.3390/s25061874
APA StyleBao, Z., Xu, B., Zhang, X., Yin, Y., Yang, X., & Niu, Q. (2025). Potential Pneumoconiosis Patients Monitoring and Warning System with Acoustic Signal. Sensors, 25(6), 1874. https://doi.org/10.3390/s25061874