
Robust Human Tracking Using a 3D LiDAR and Point Cloud Projection for Human-Following Robots

Abstract
1. Introduction
2. Related Works
2.1. Human Tracking Using 2D LRFs
2.2. Human Tracking Using a 3D LiDAR
3. Method
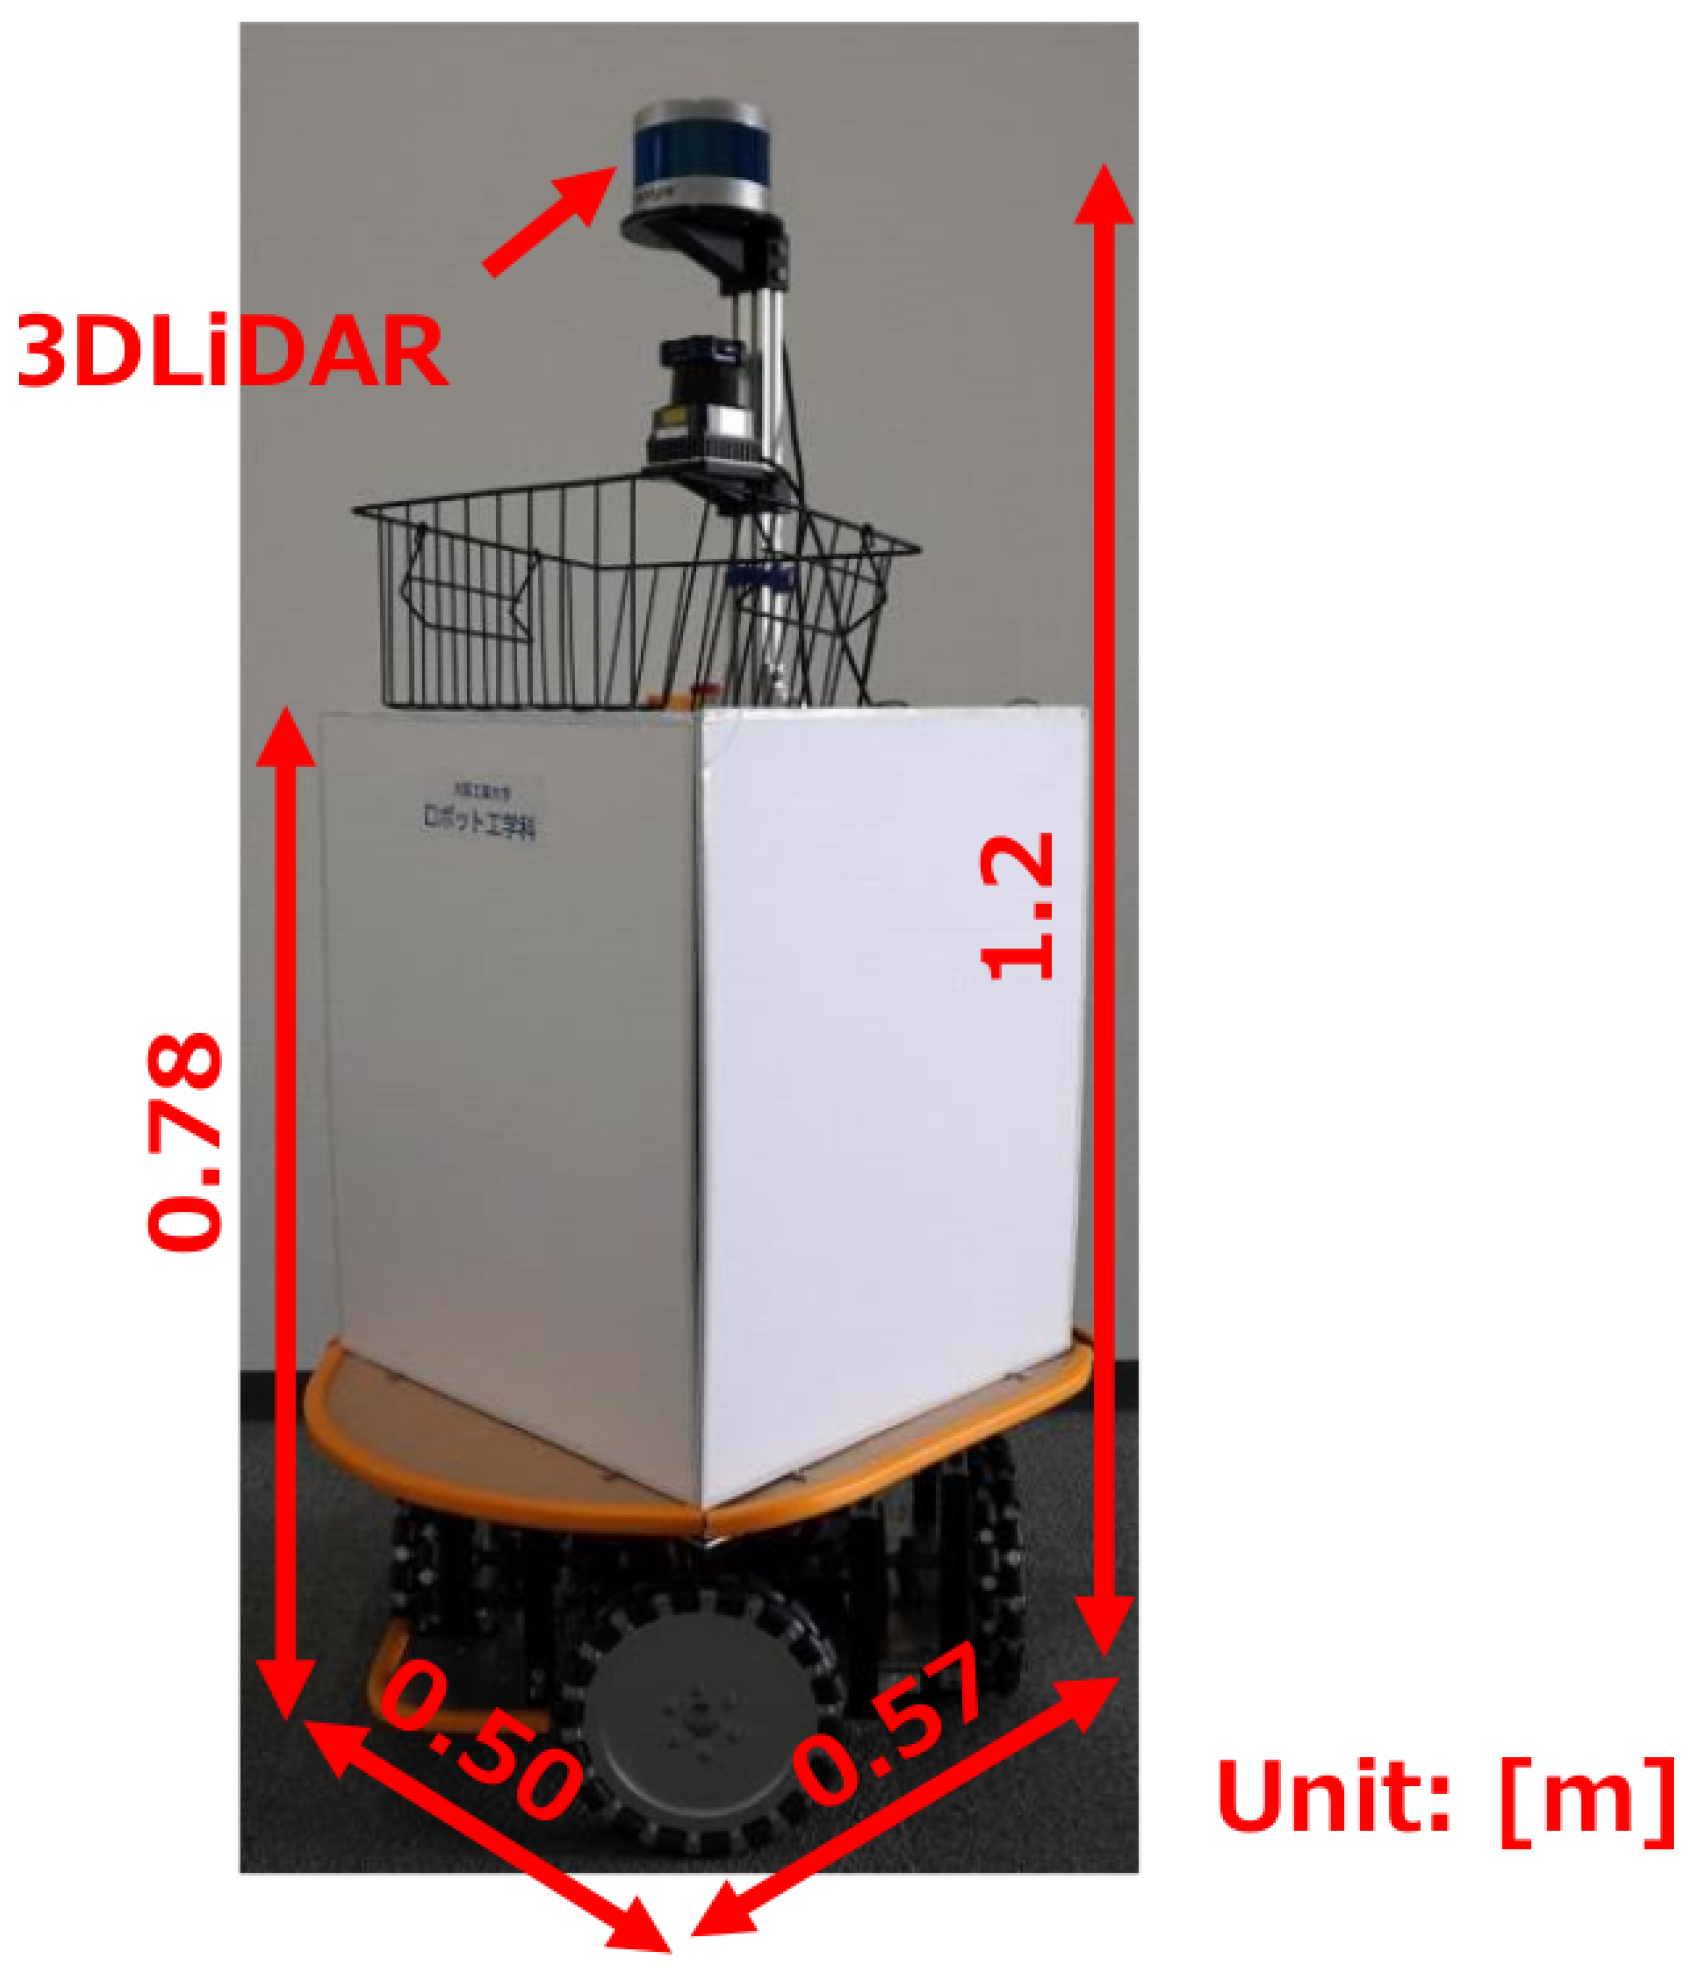
3.1. Overview
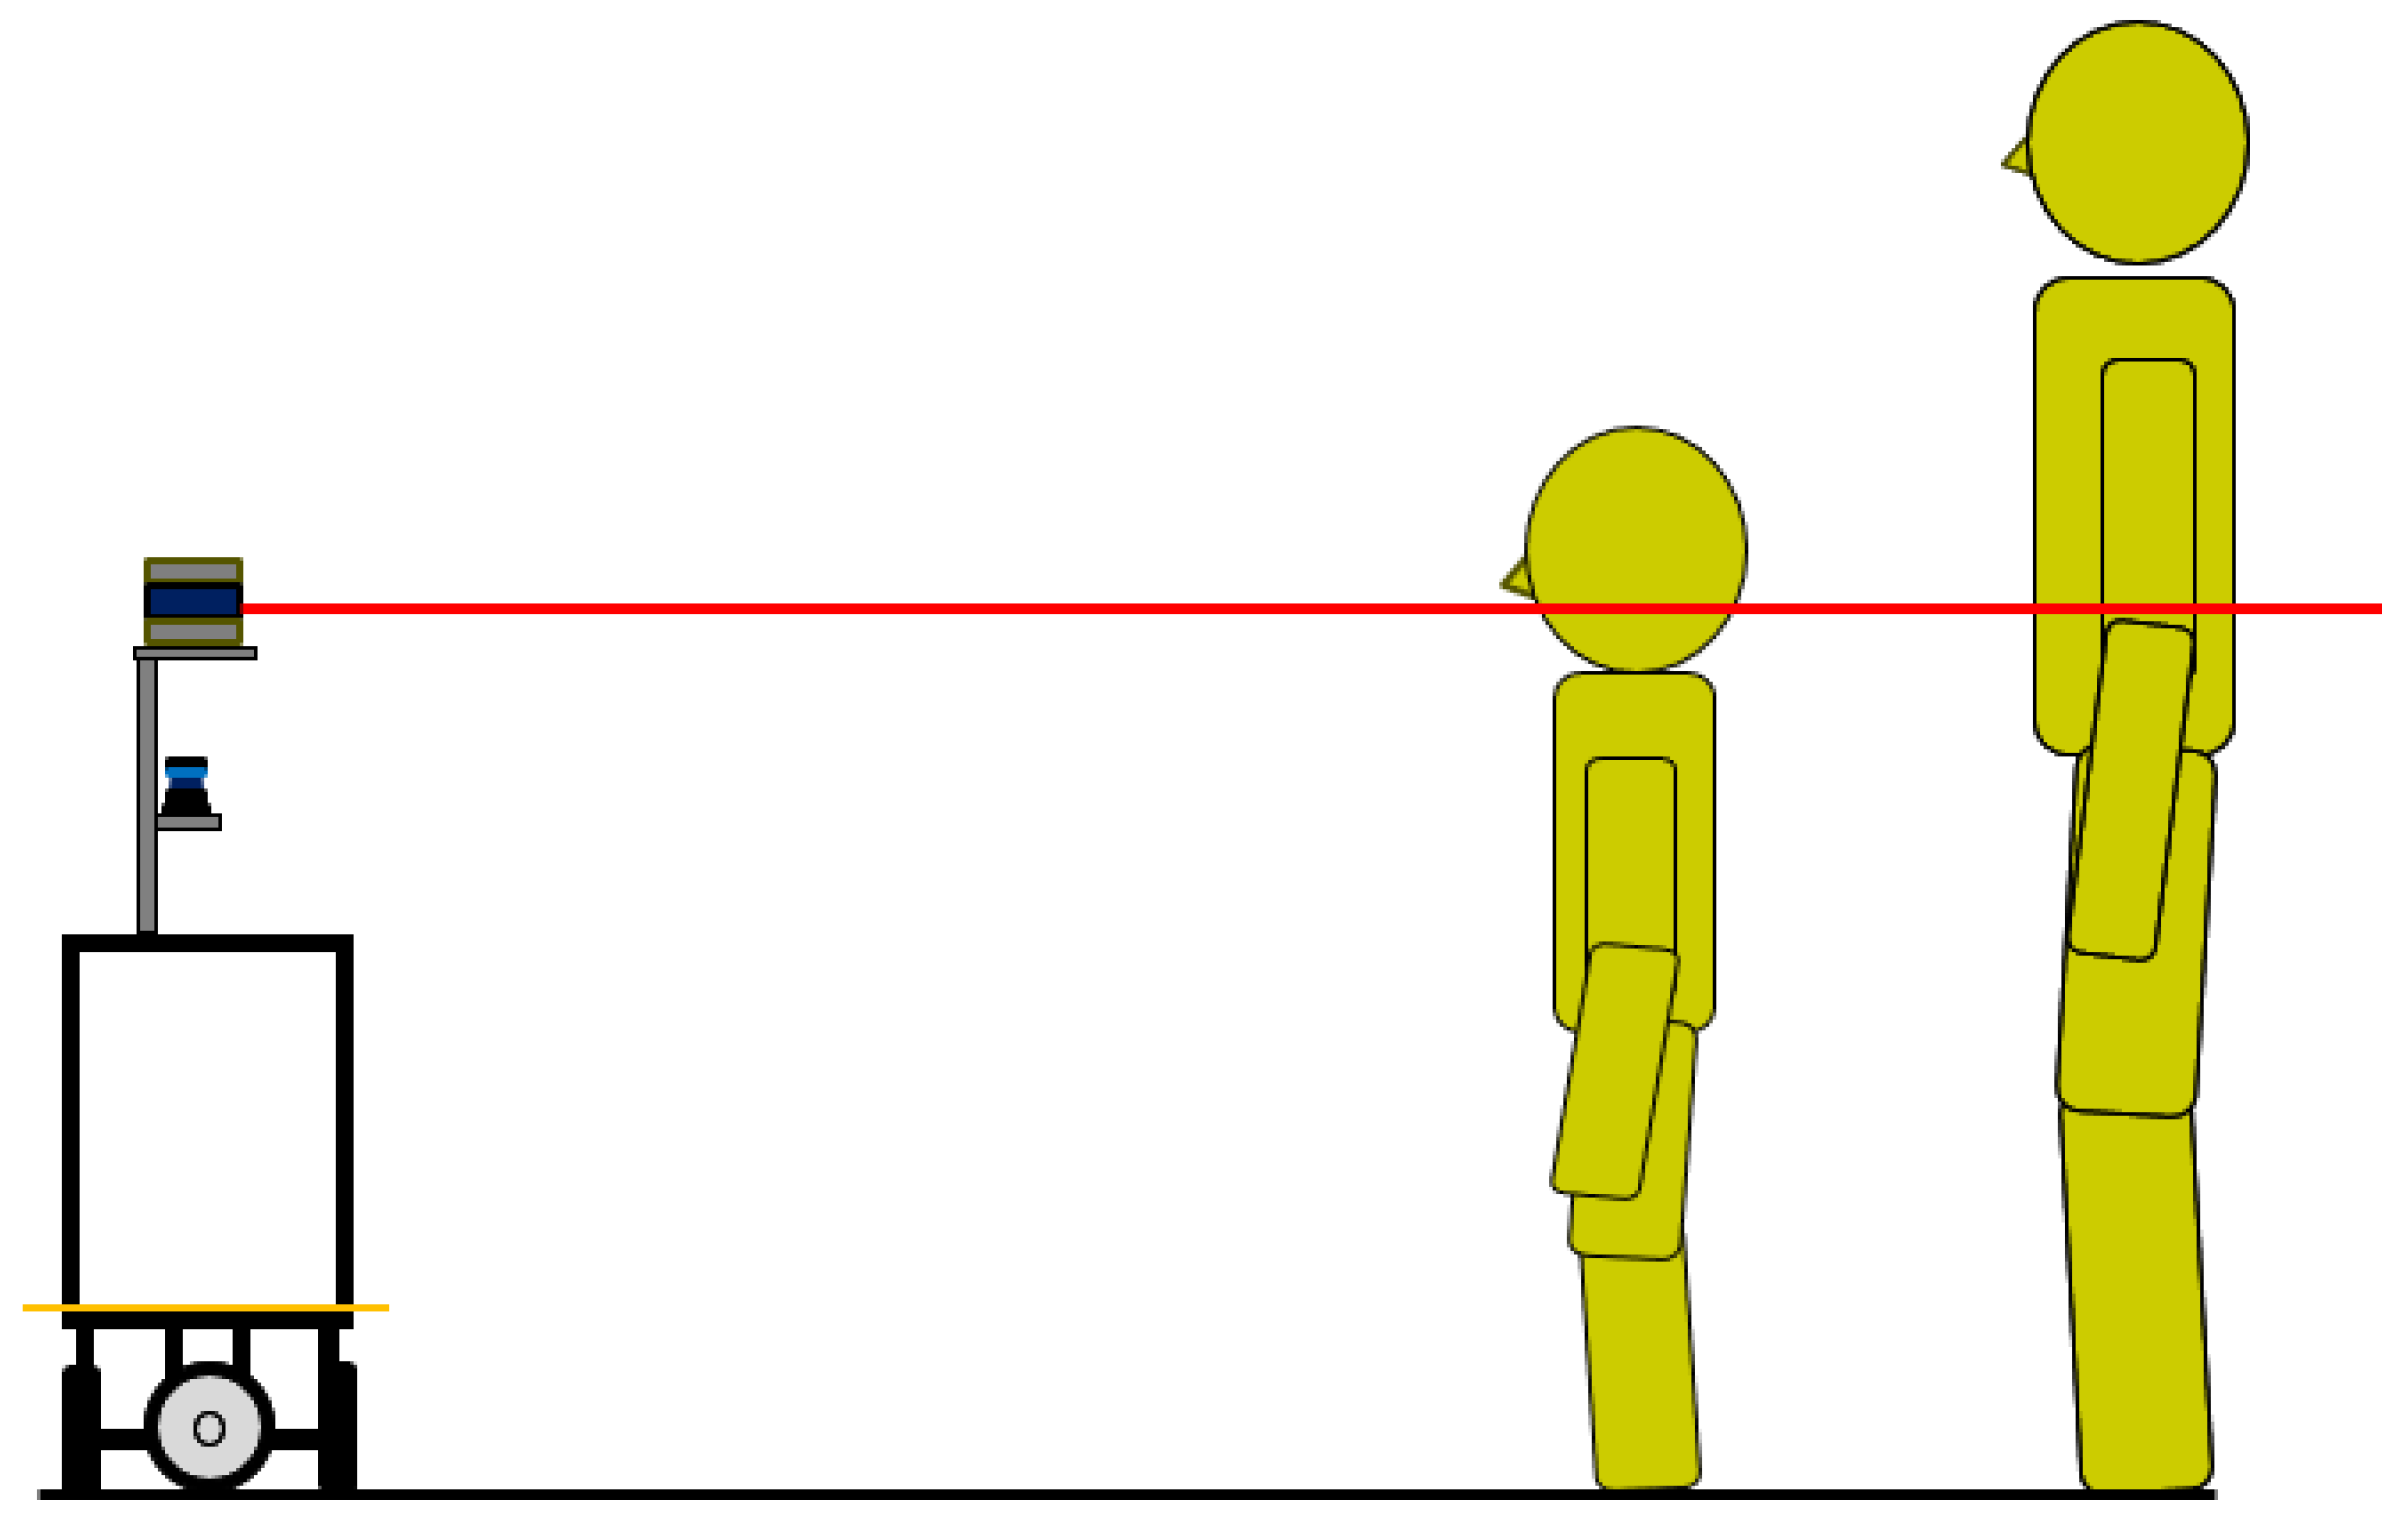
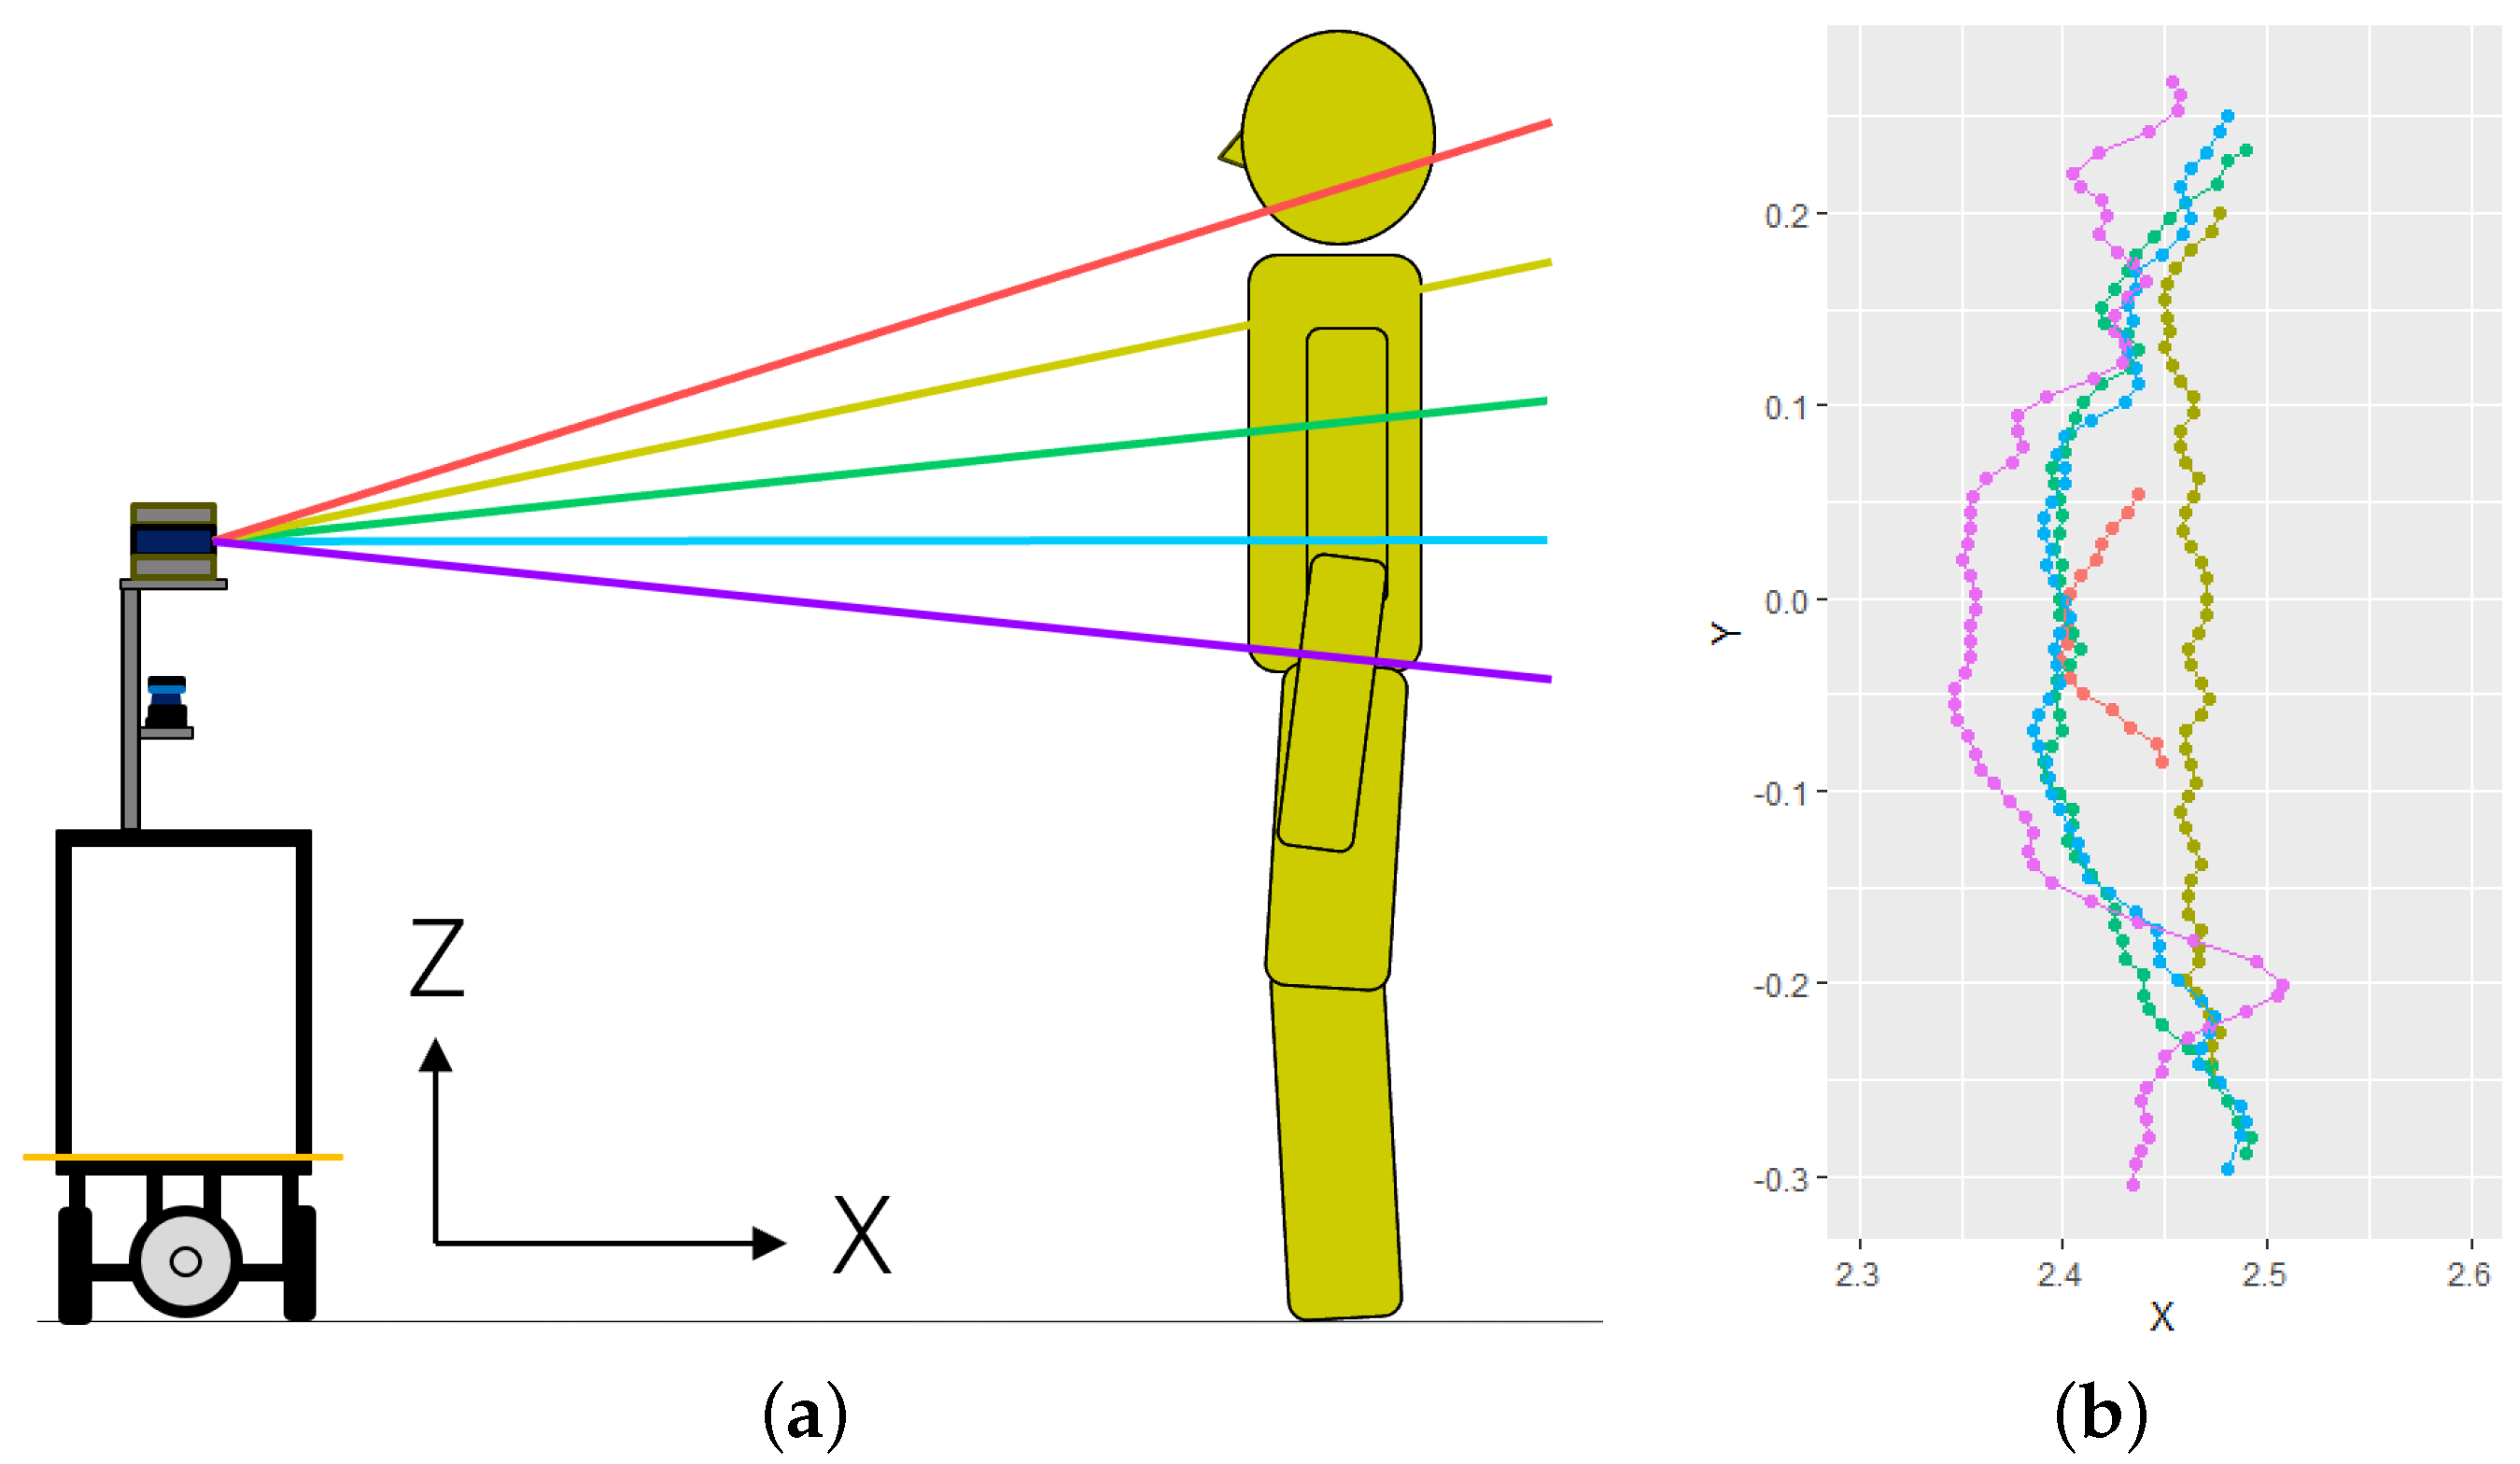
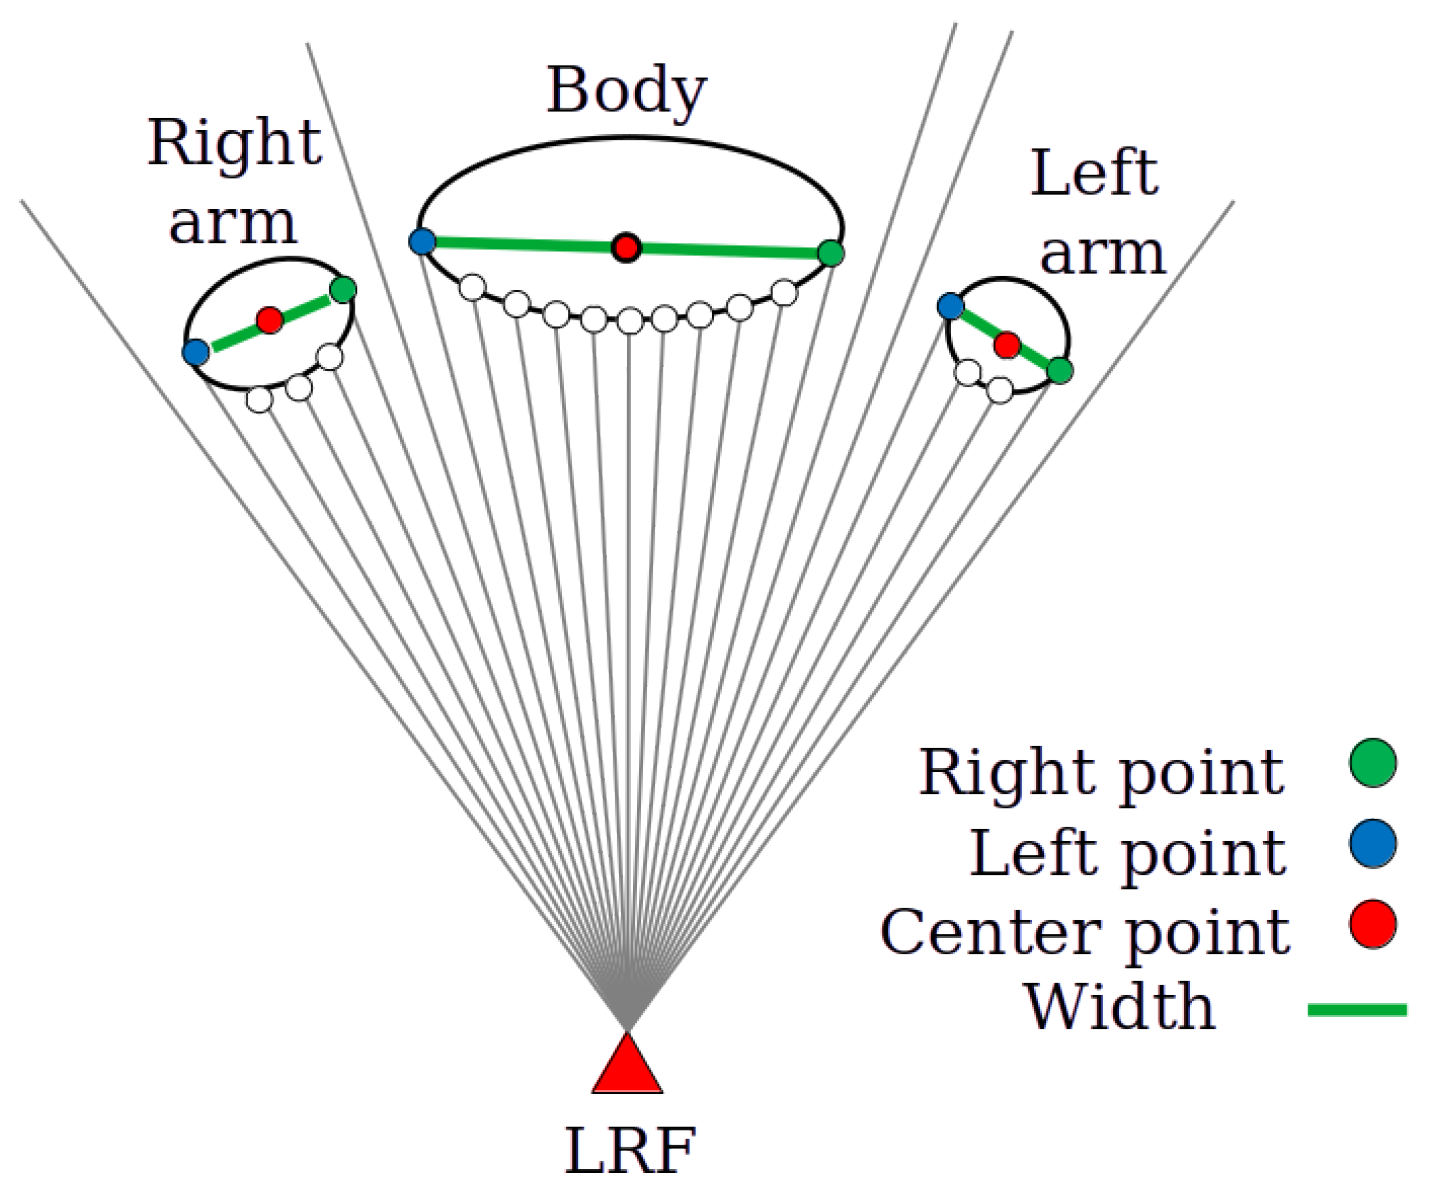
3.2. Measurement of Human Height
3.3. Human Following
4. Experiment
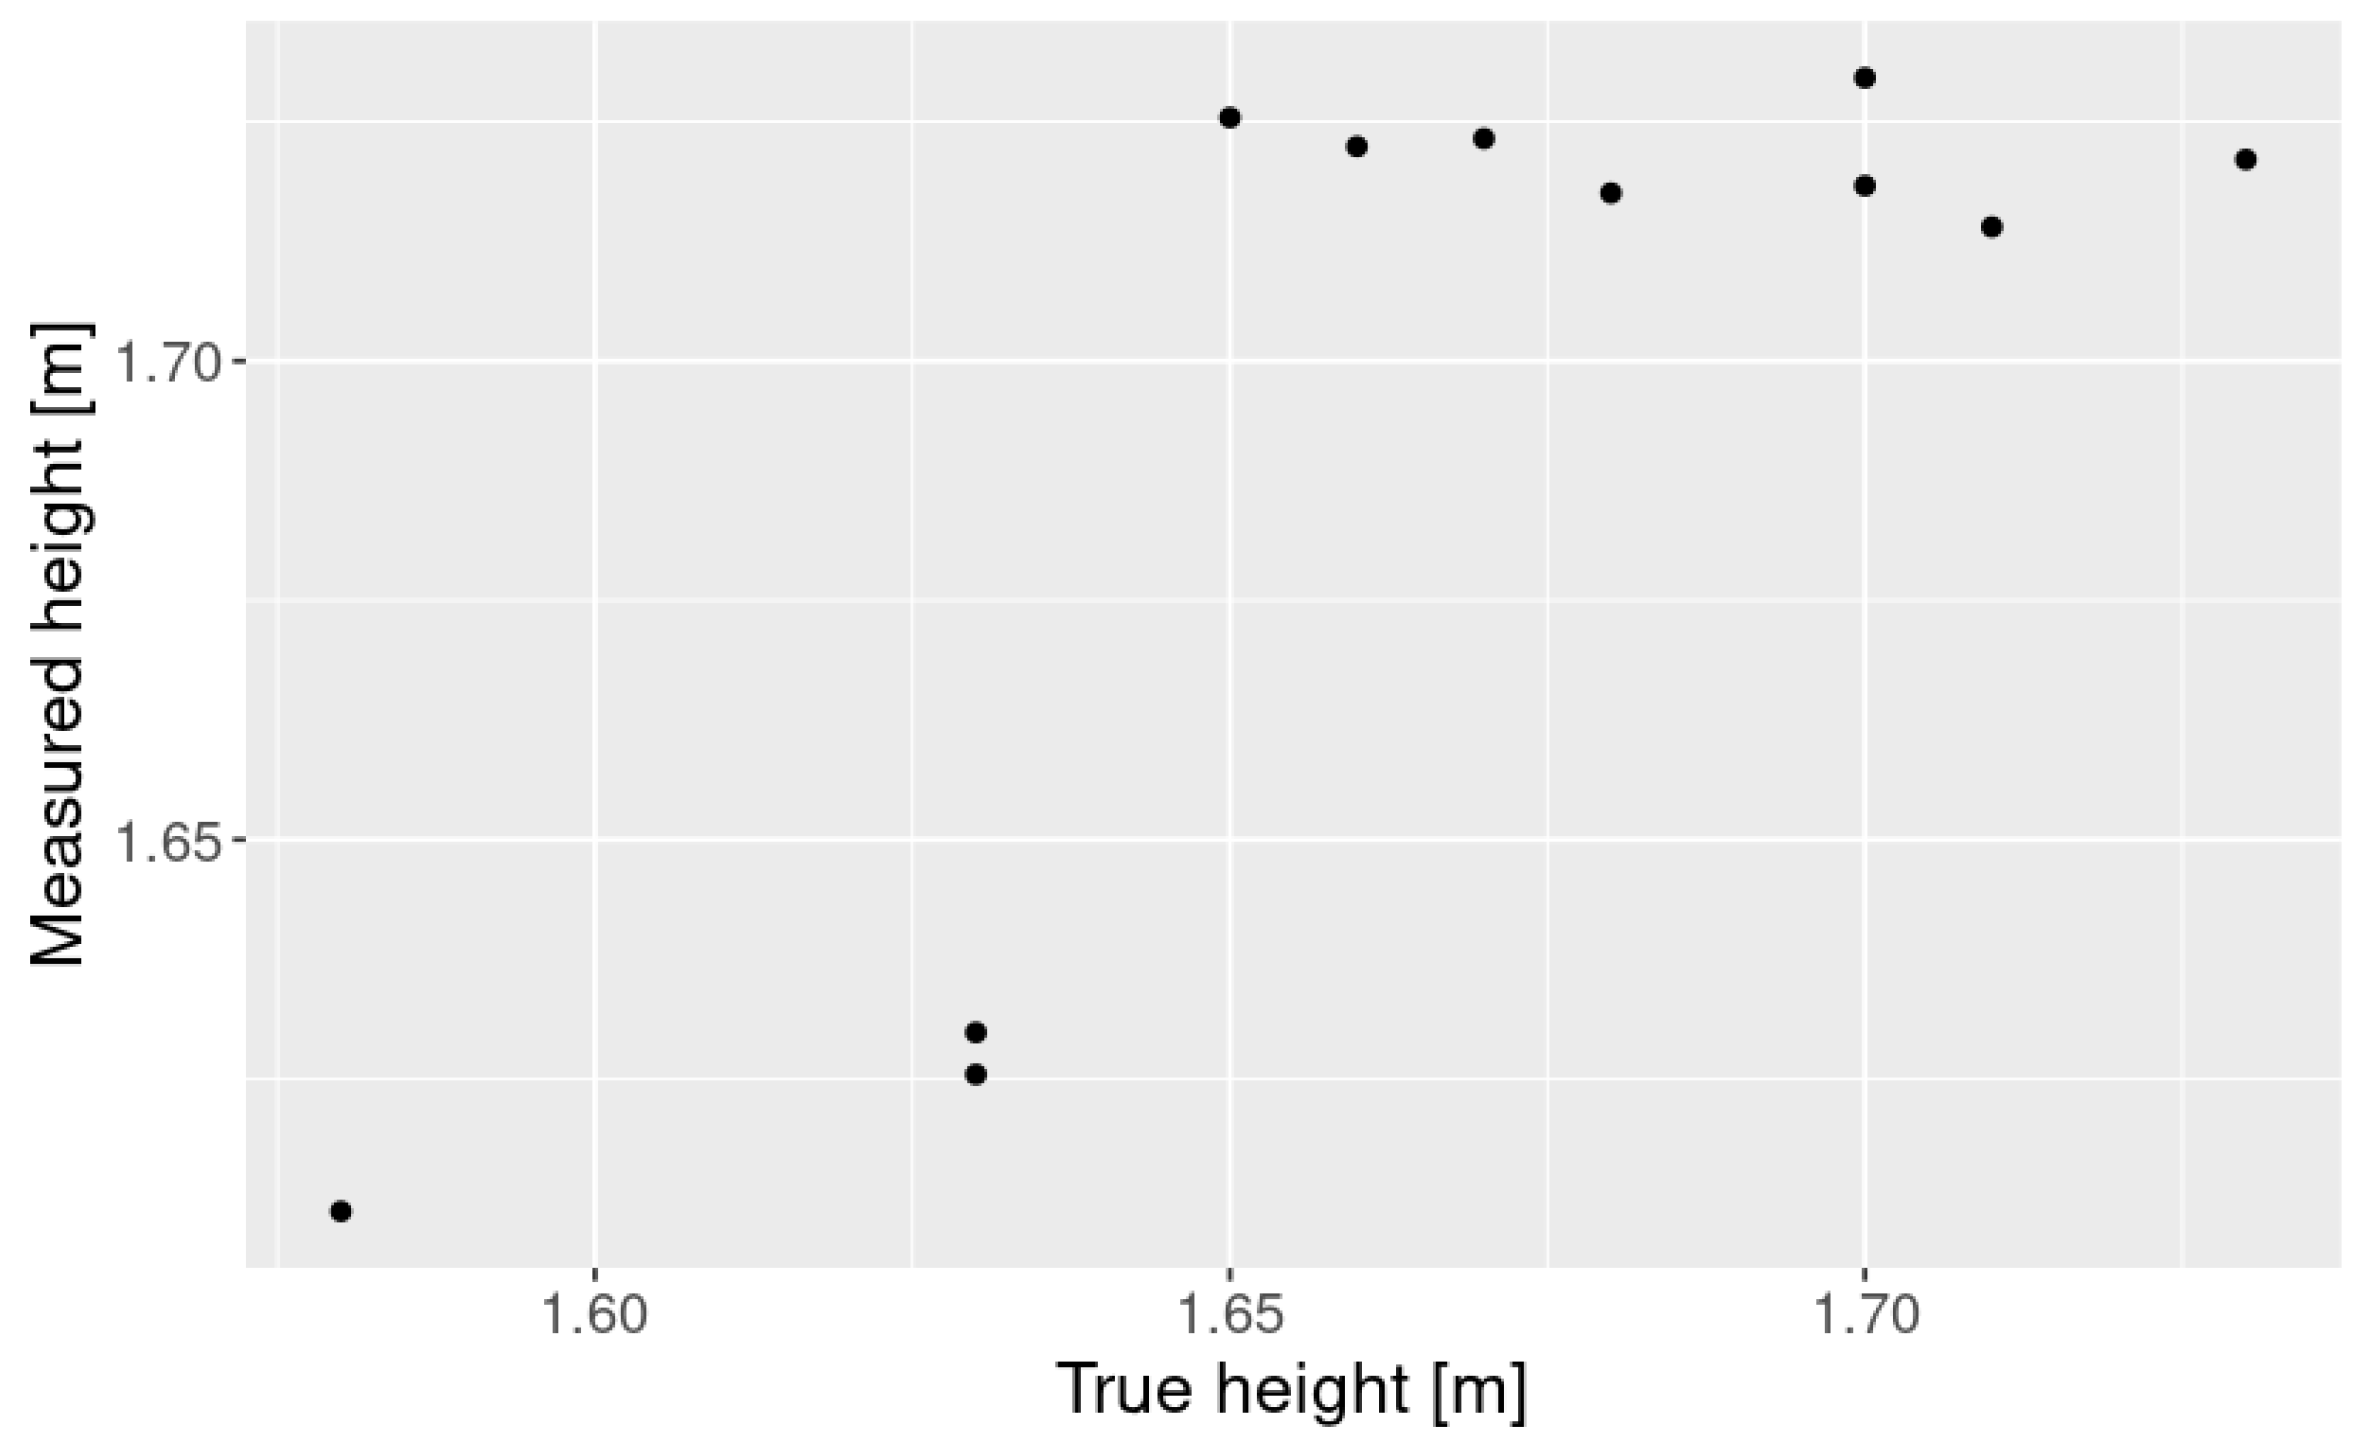
4.1. Height Measurement
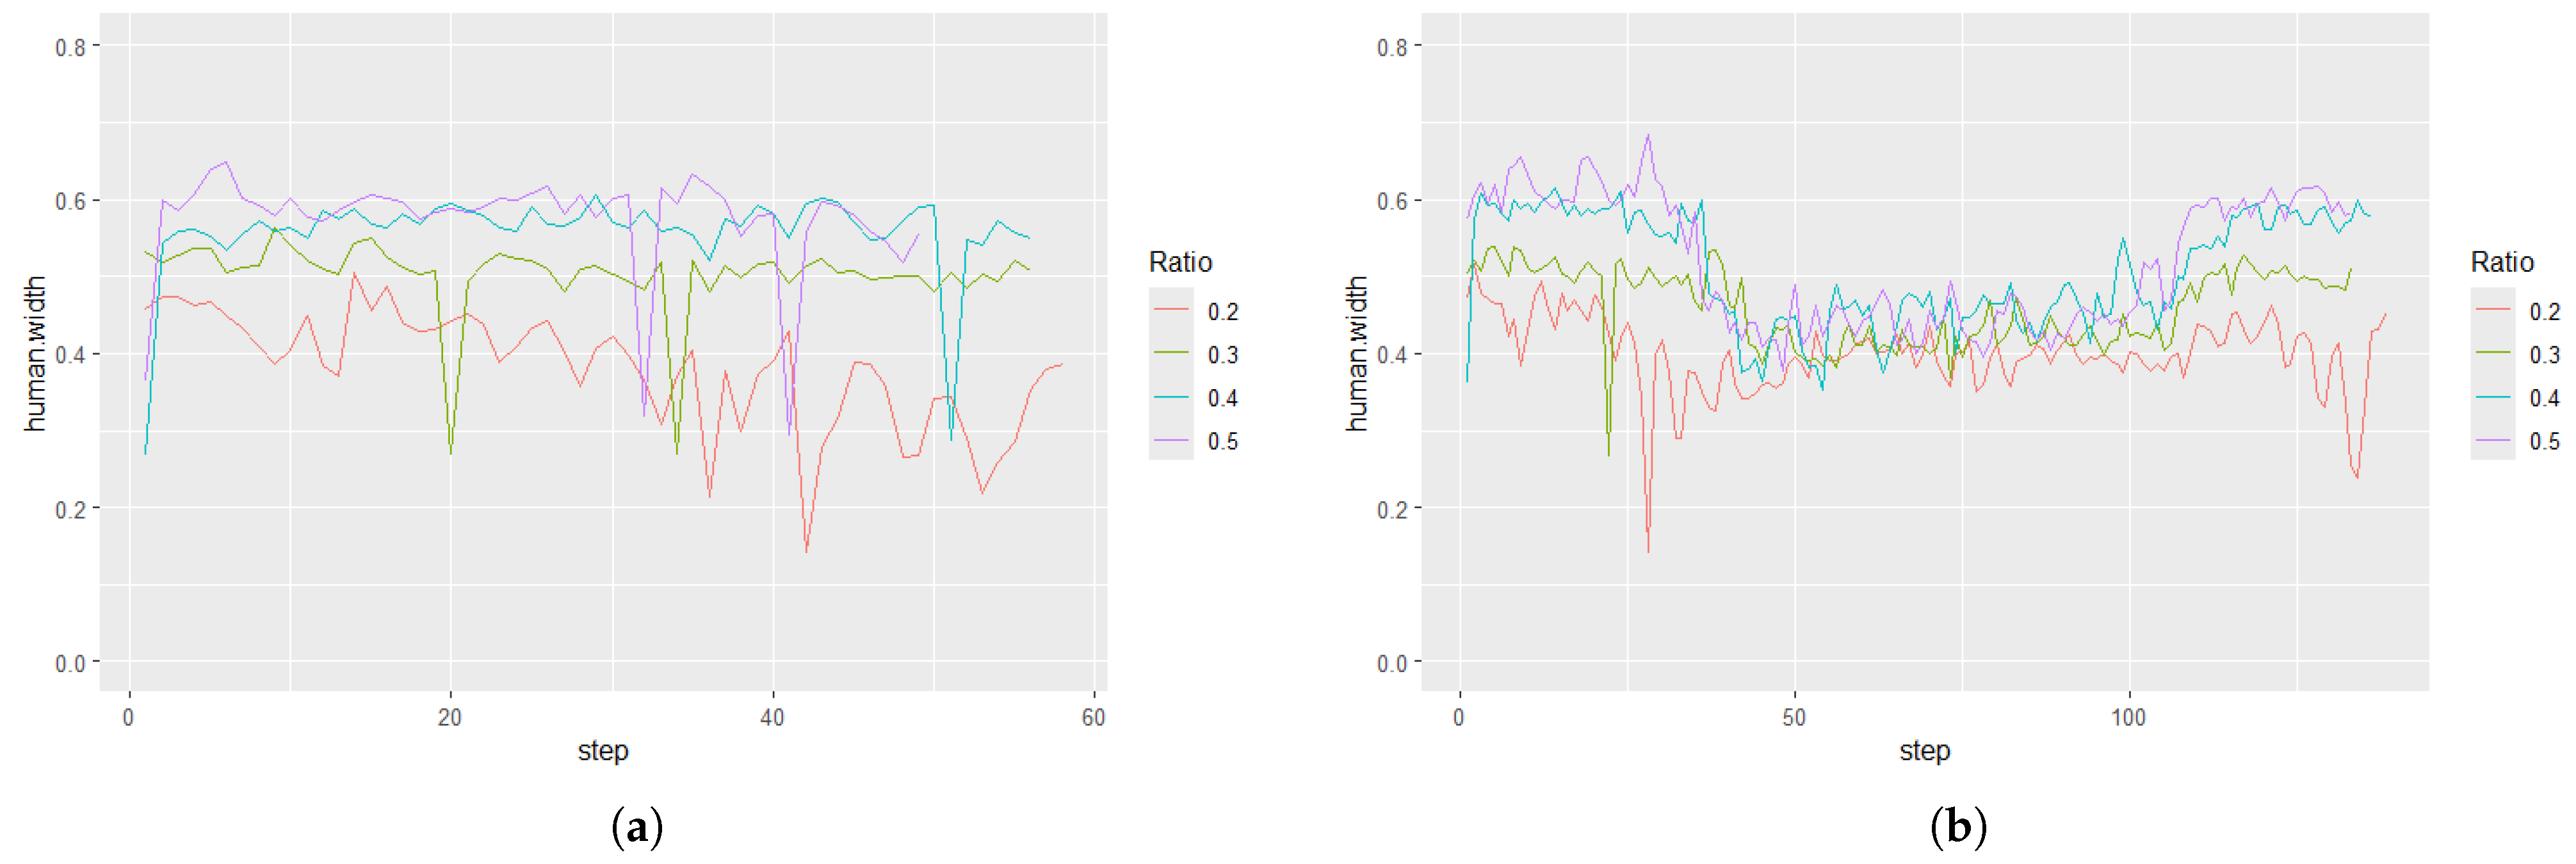
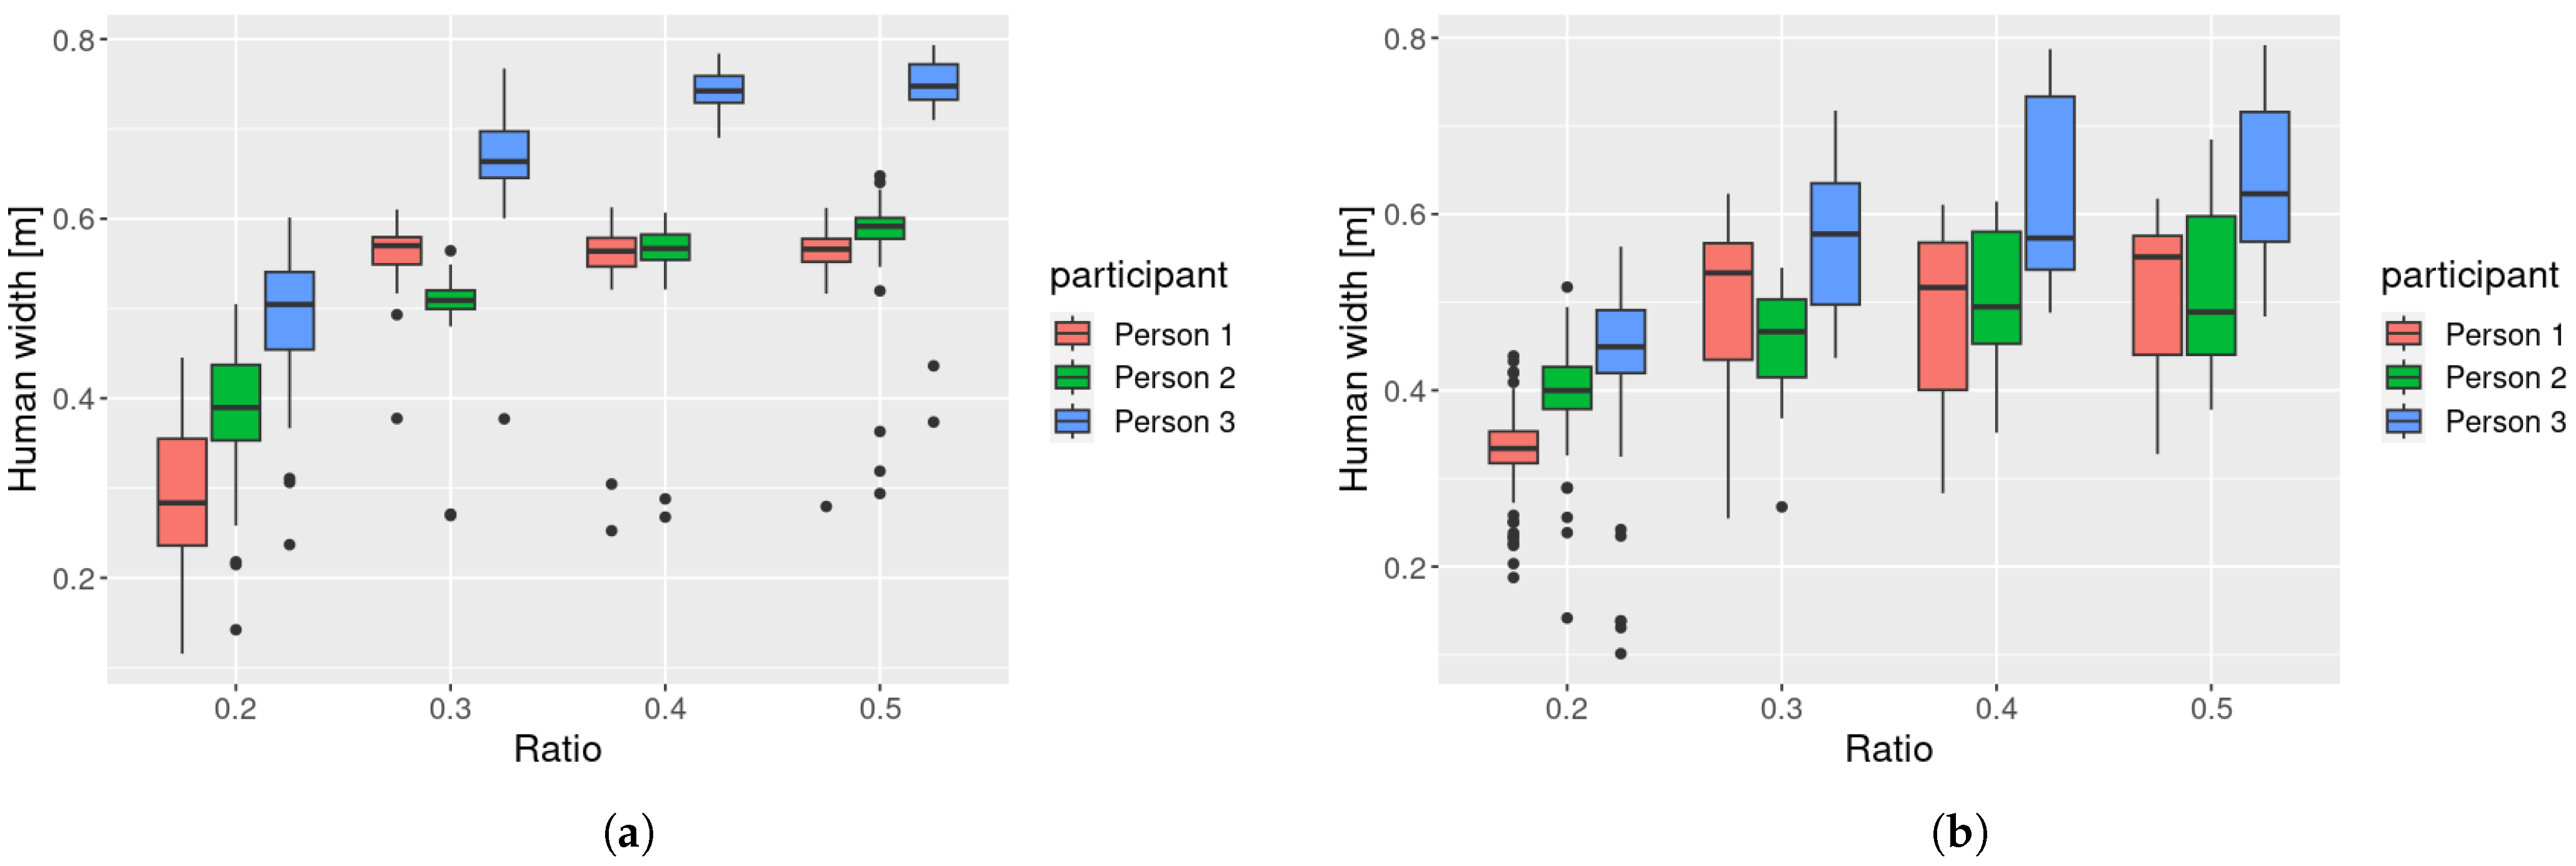
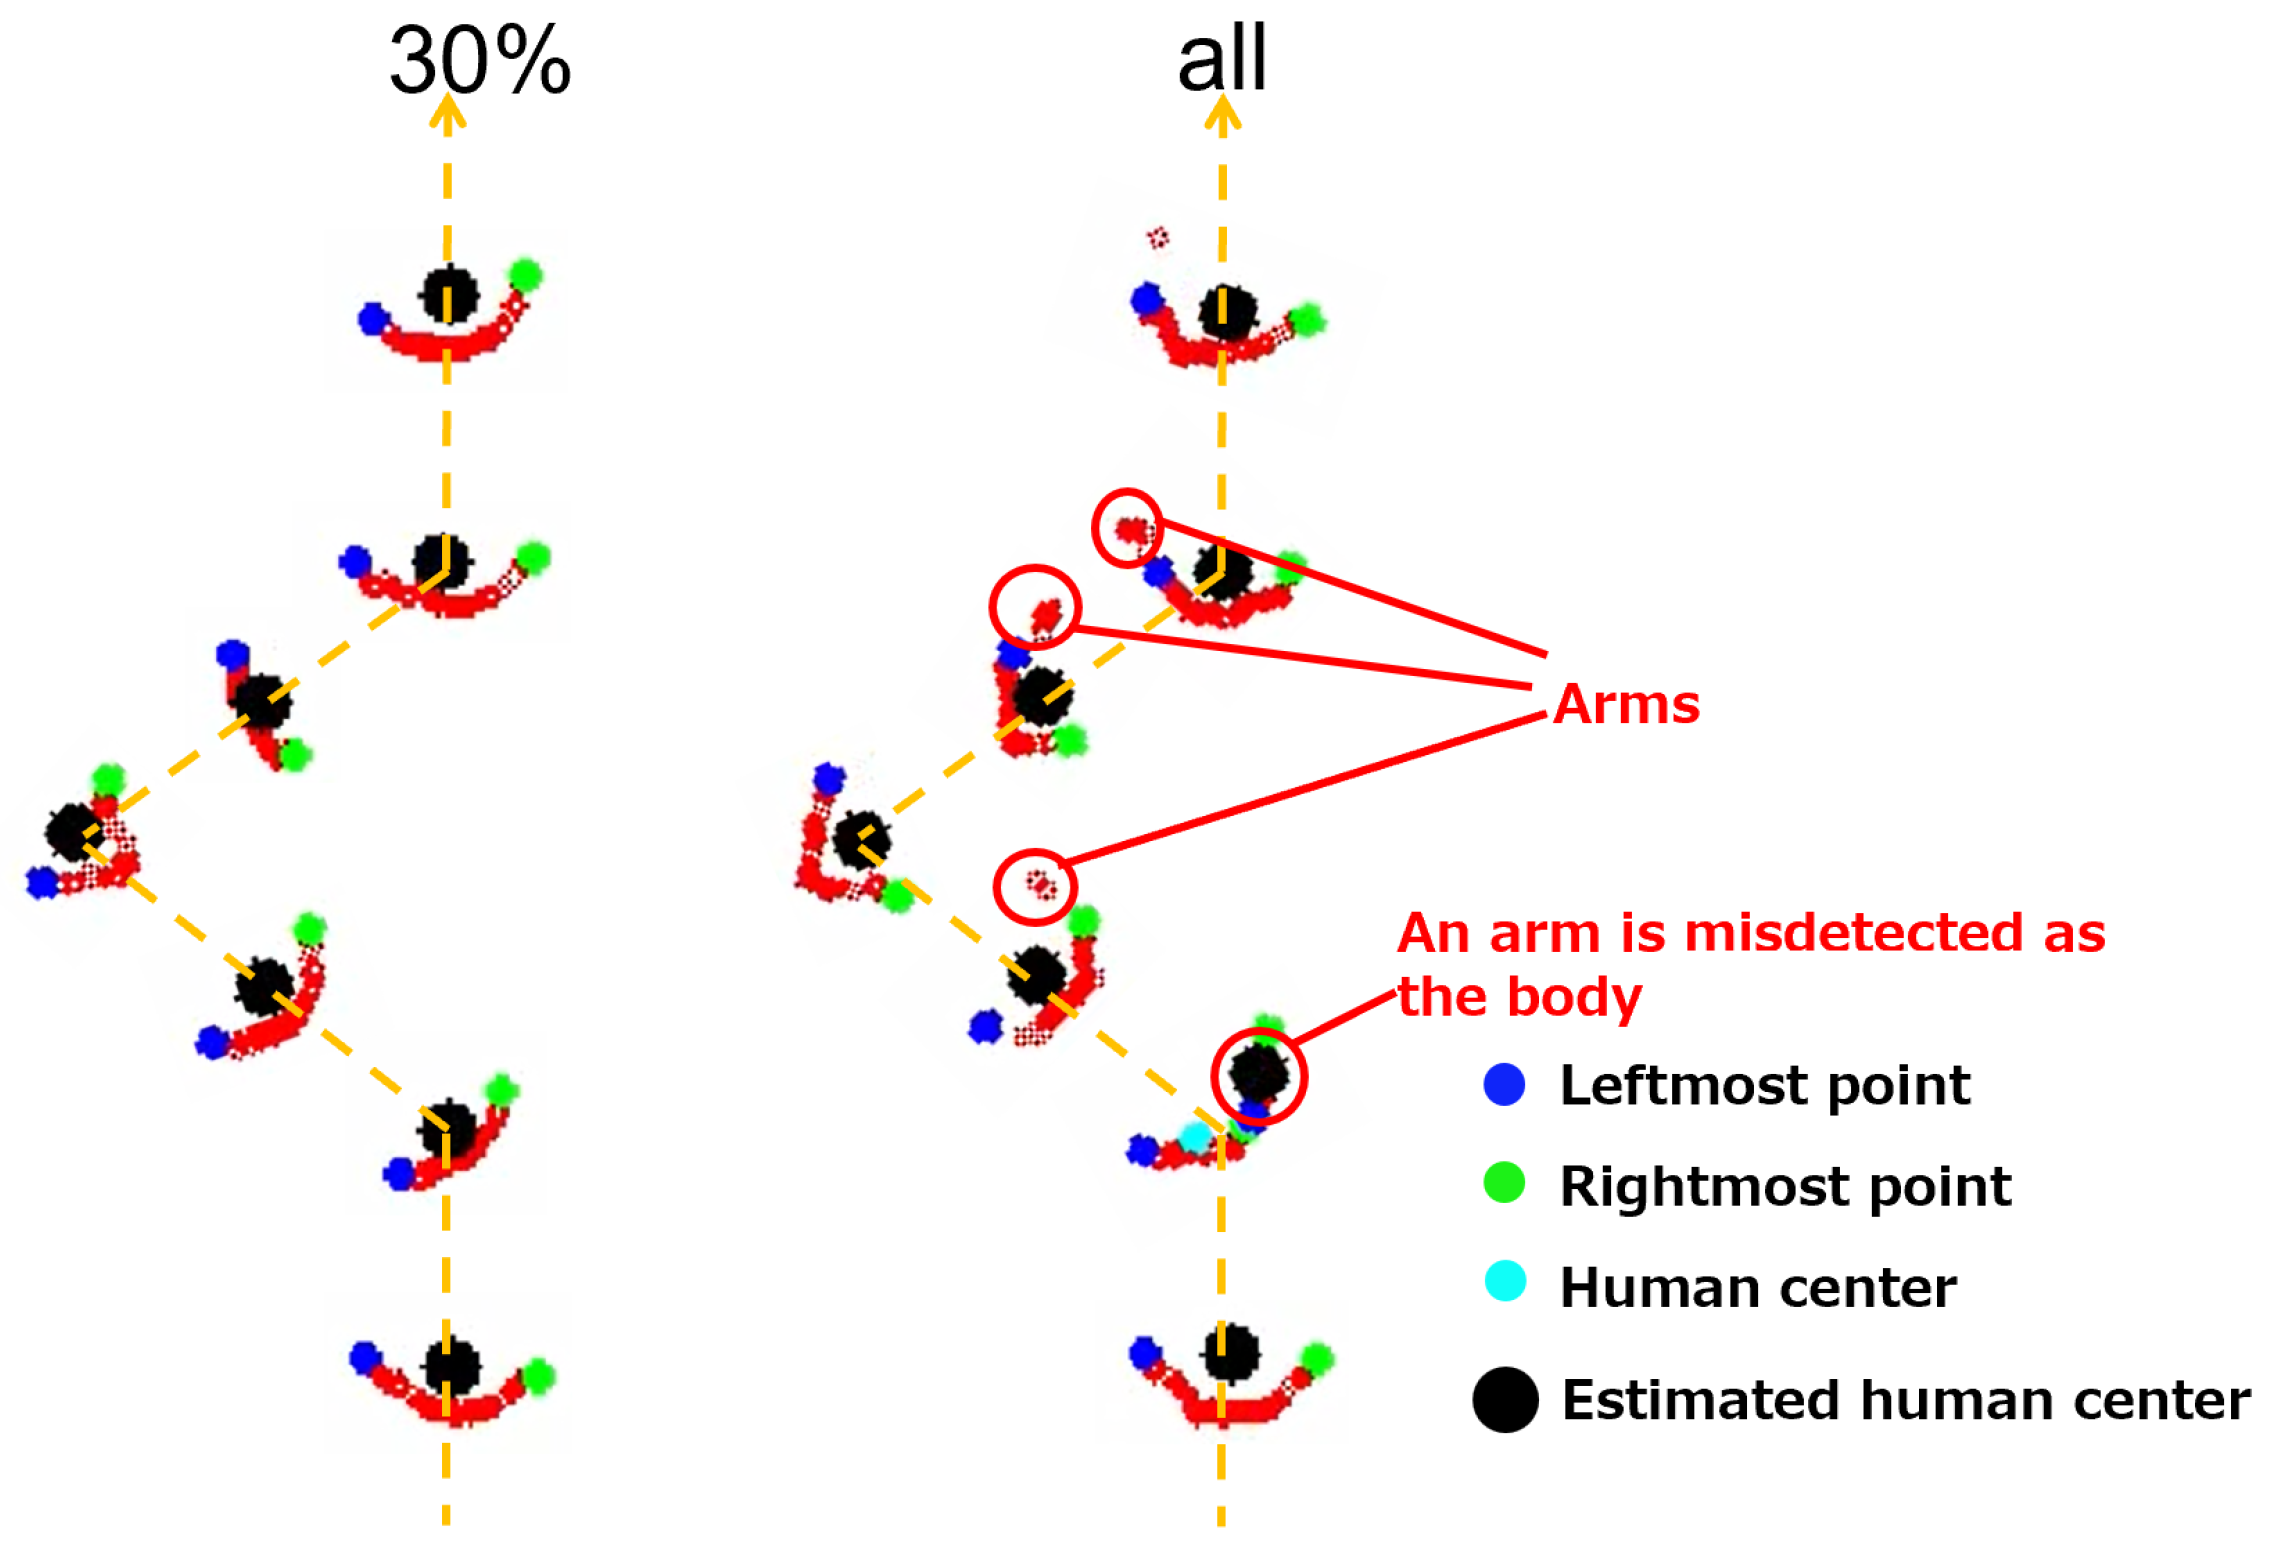
4.2. Optimal Projection Range
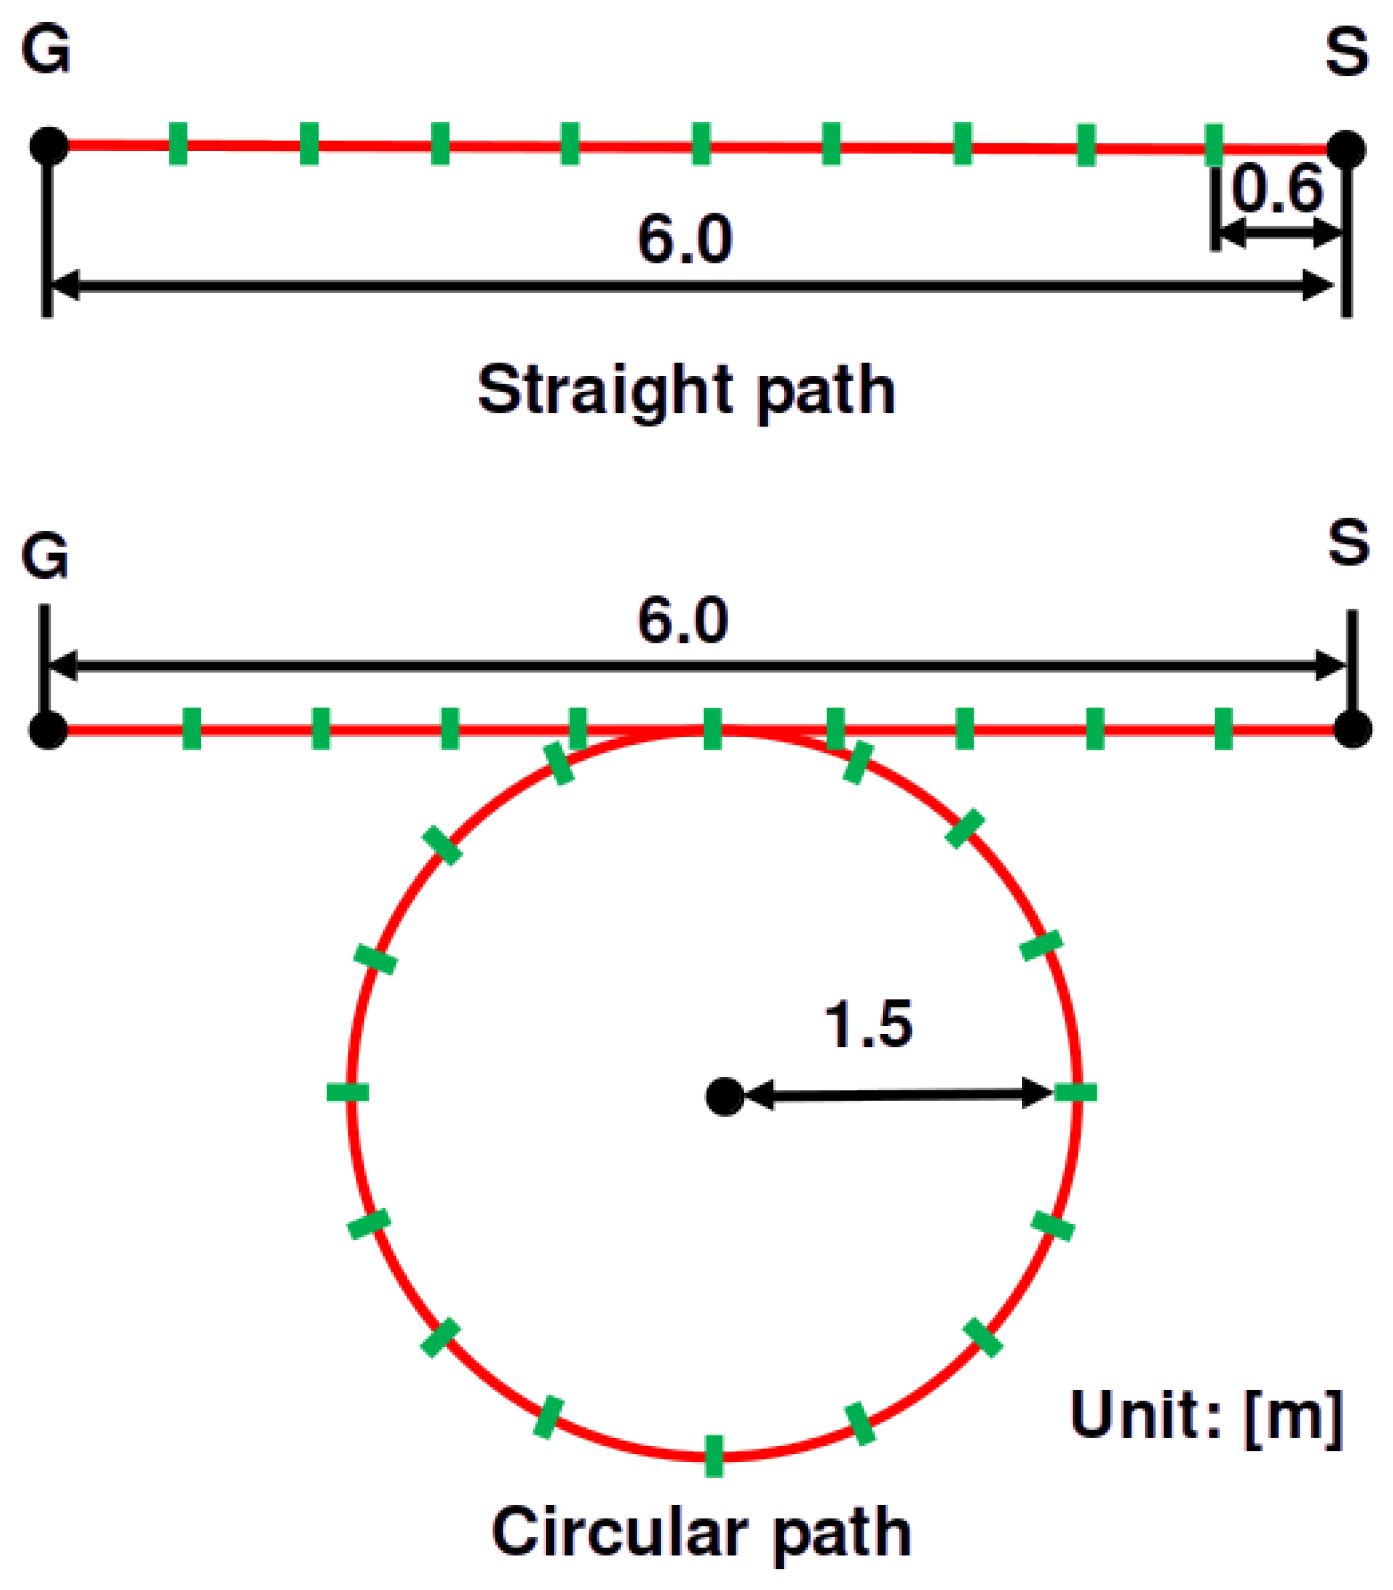
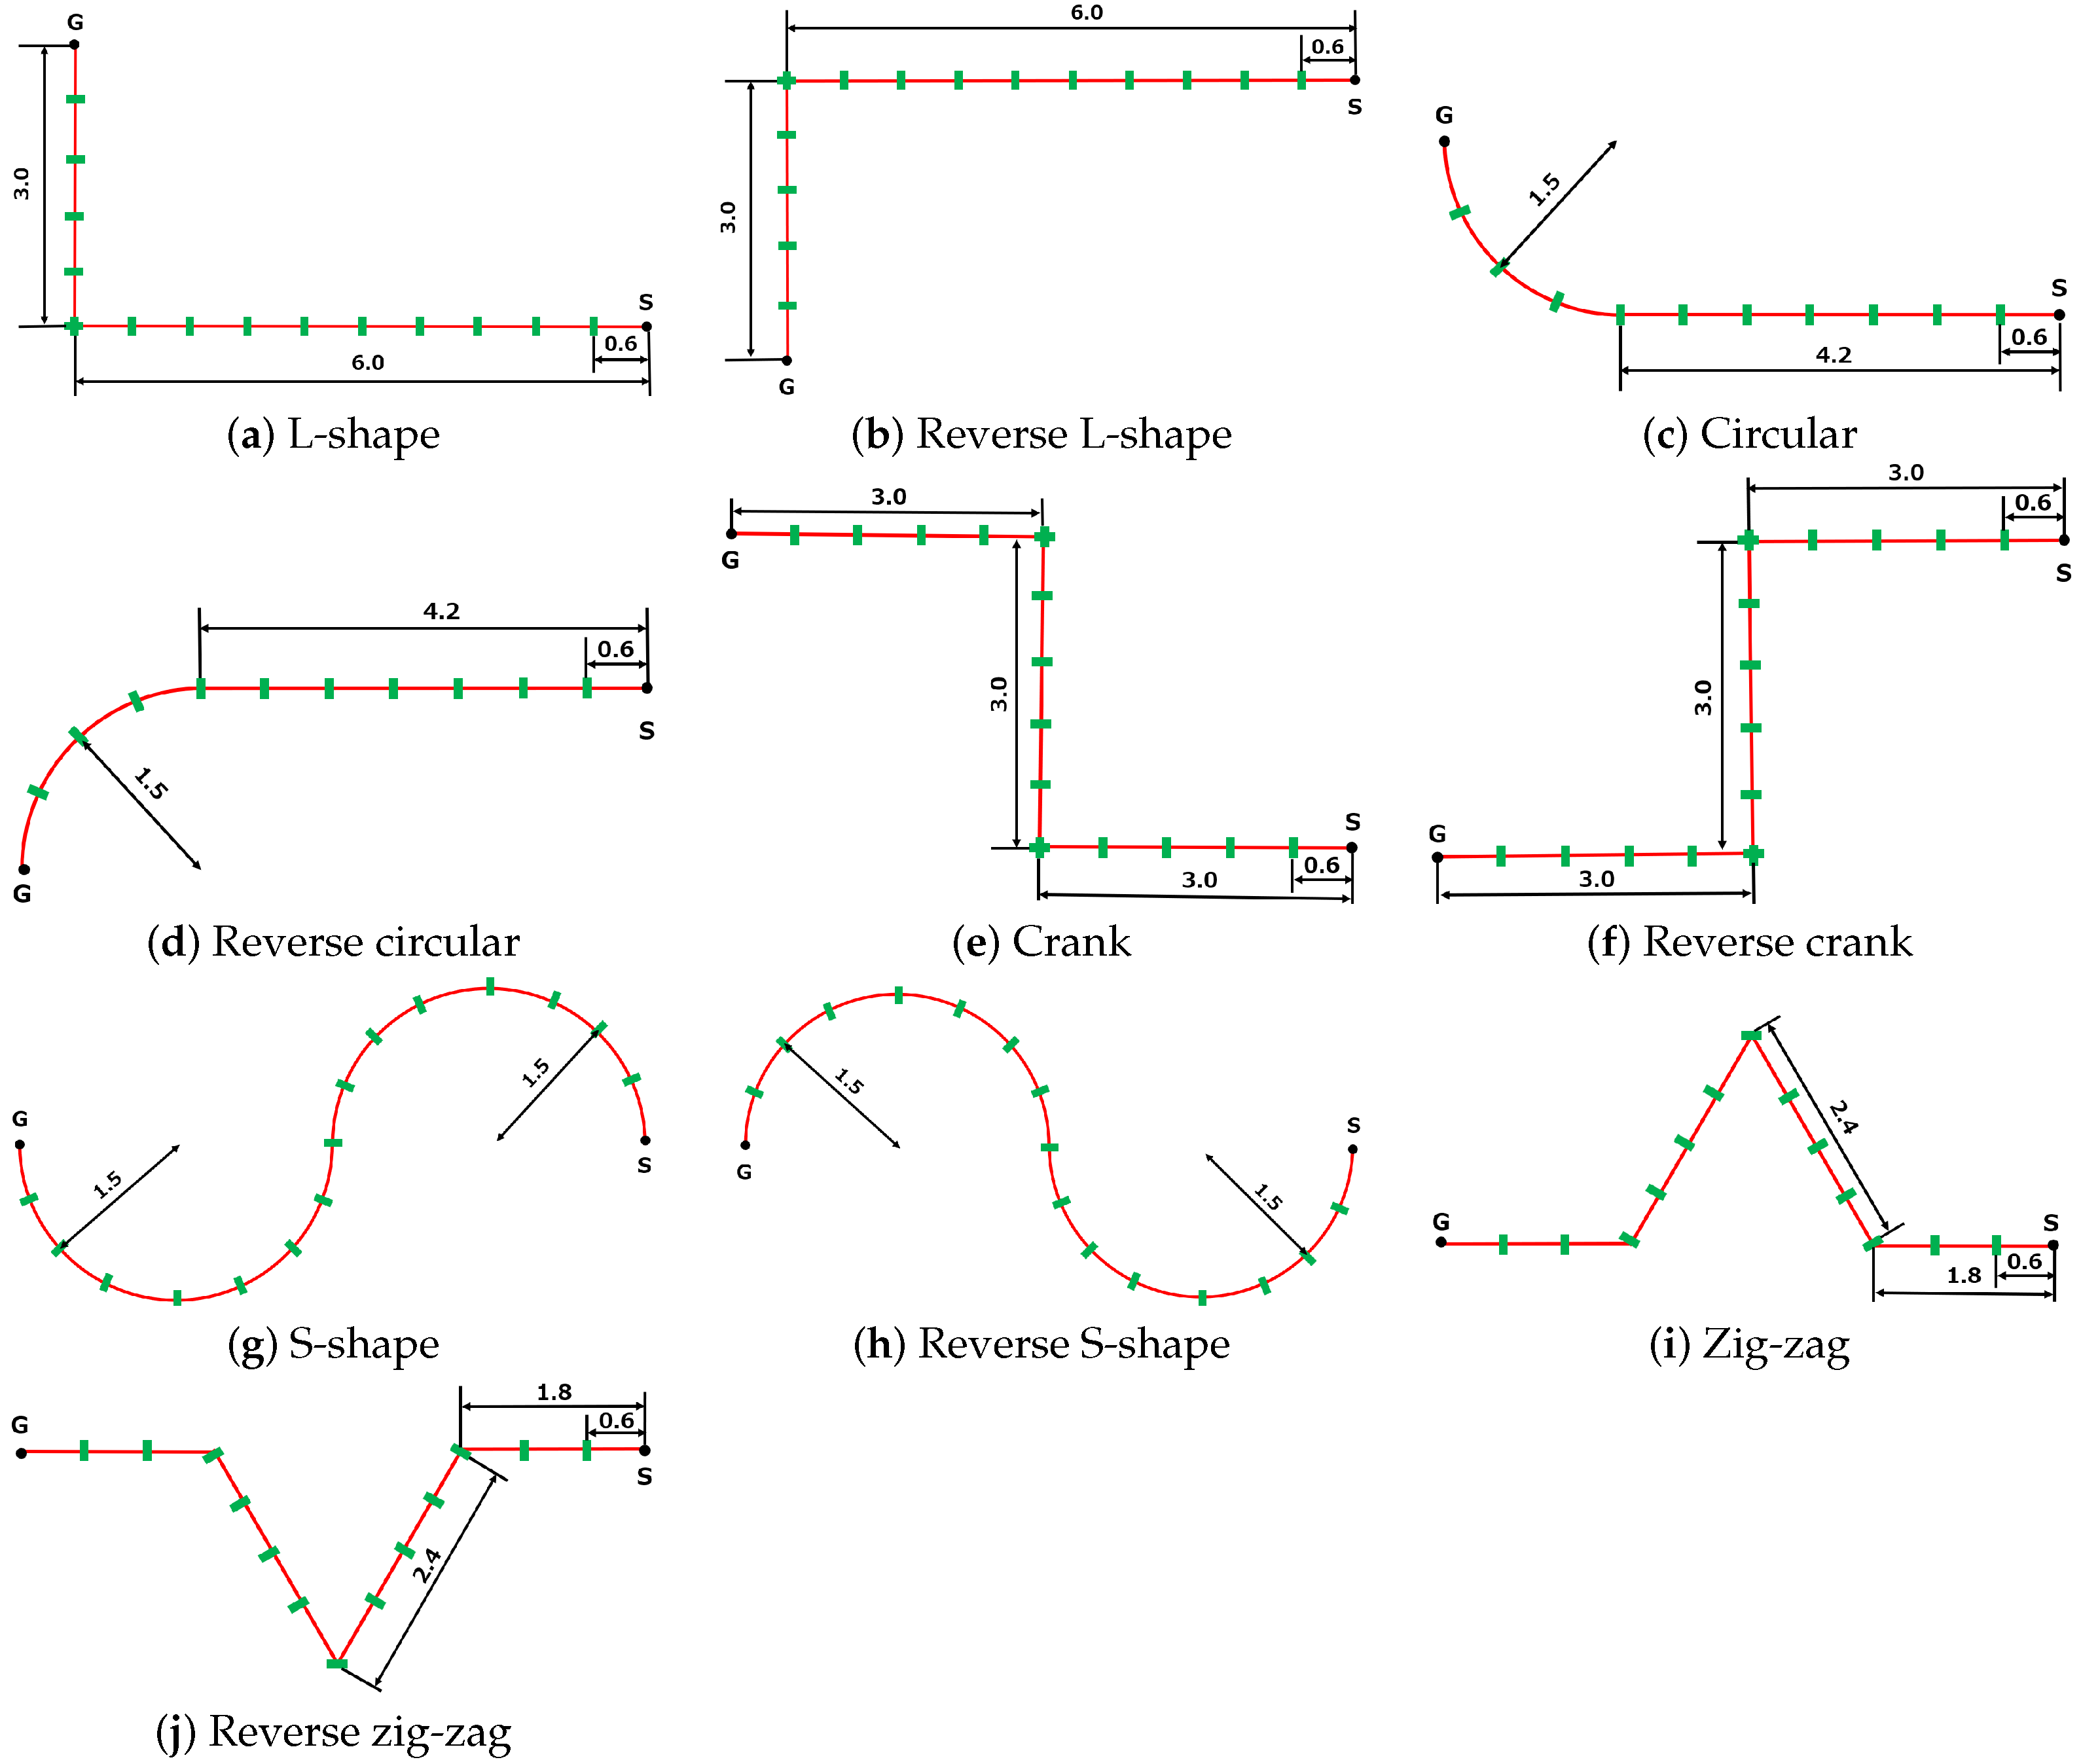
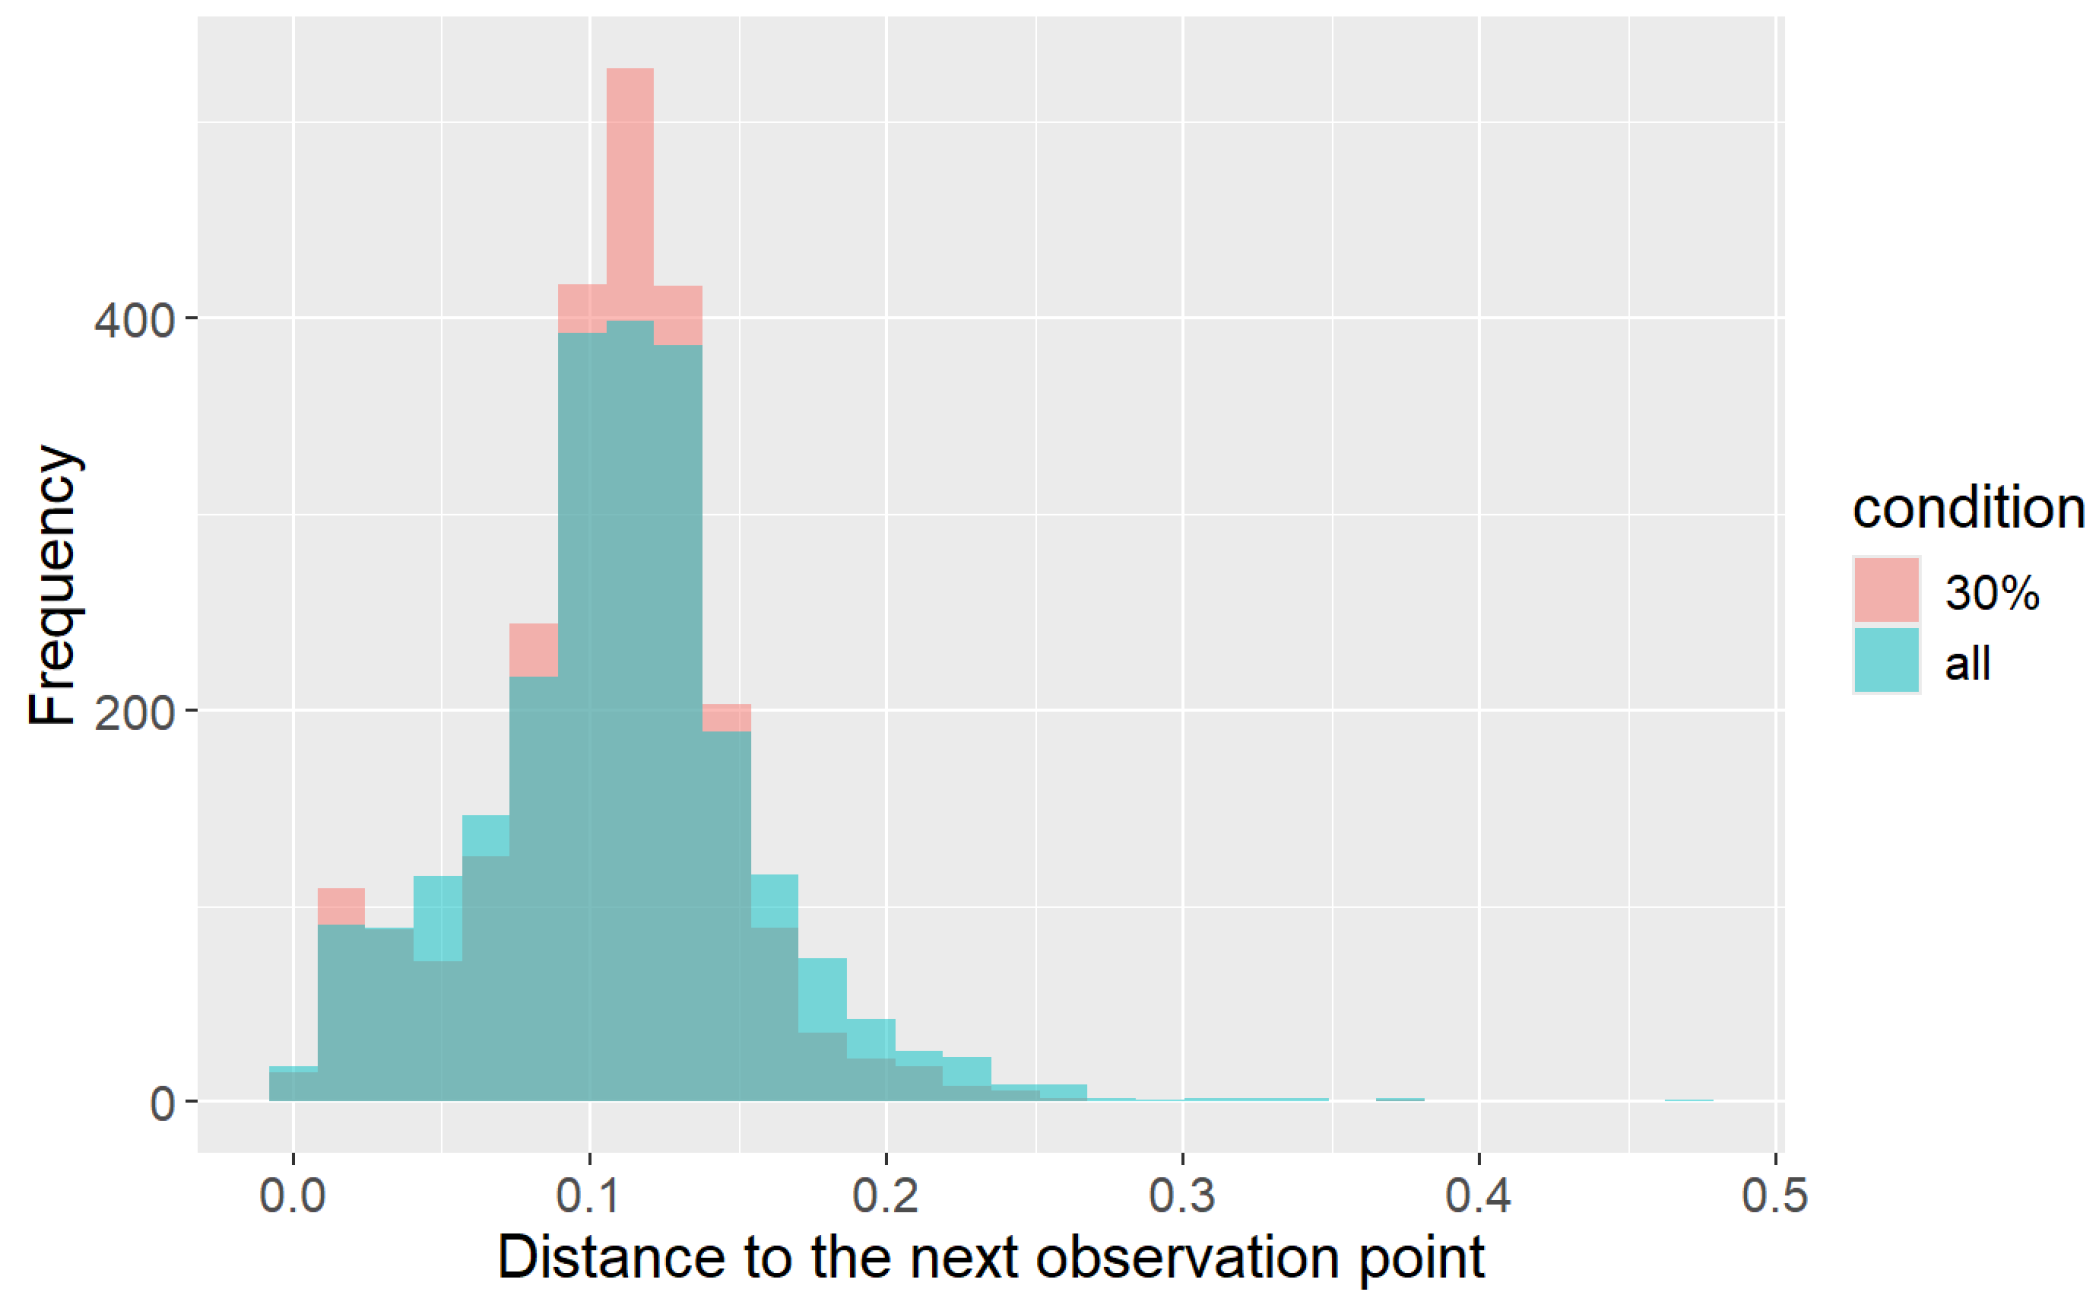
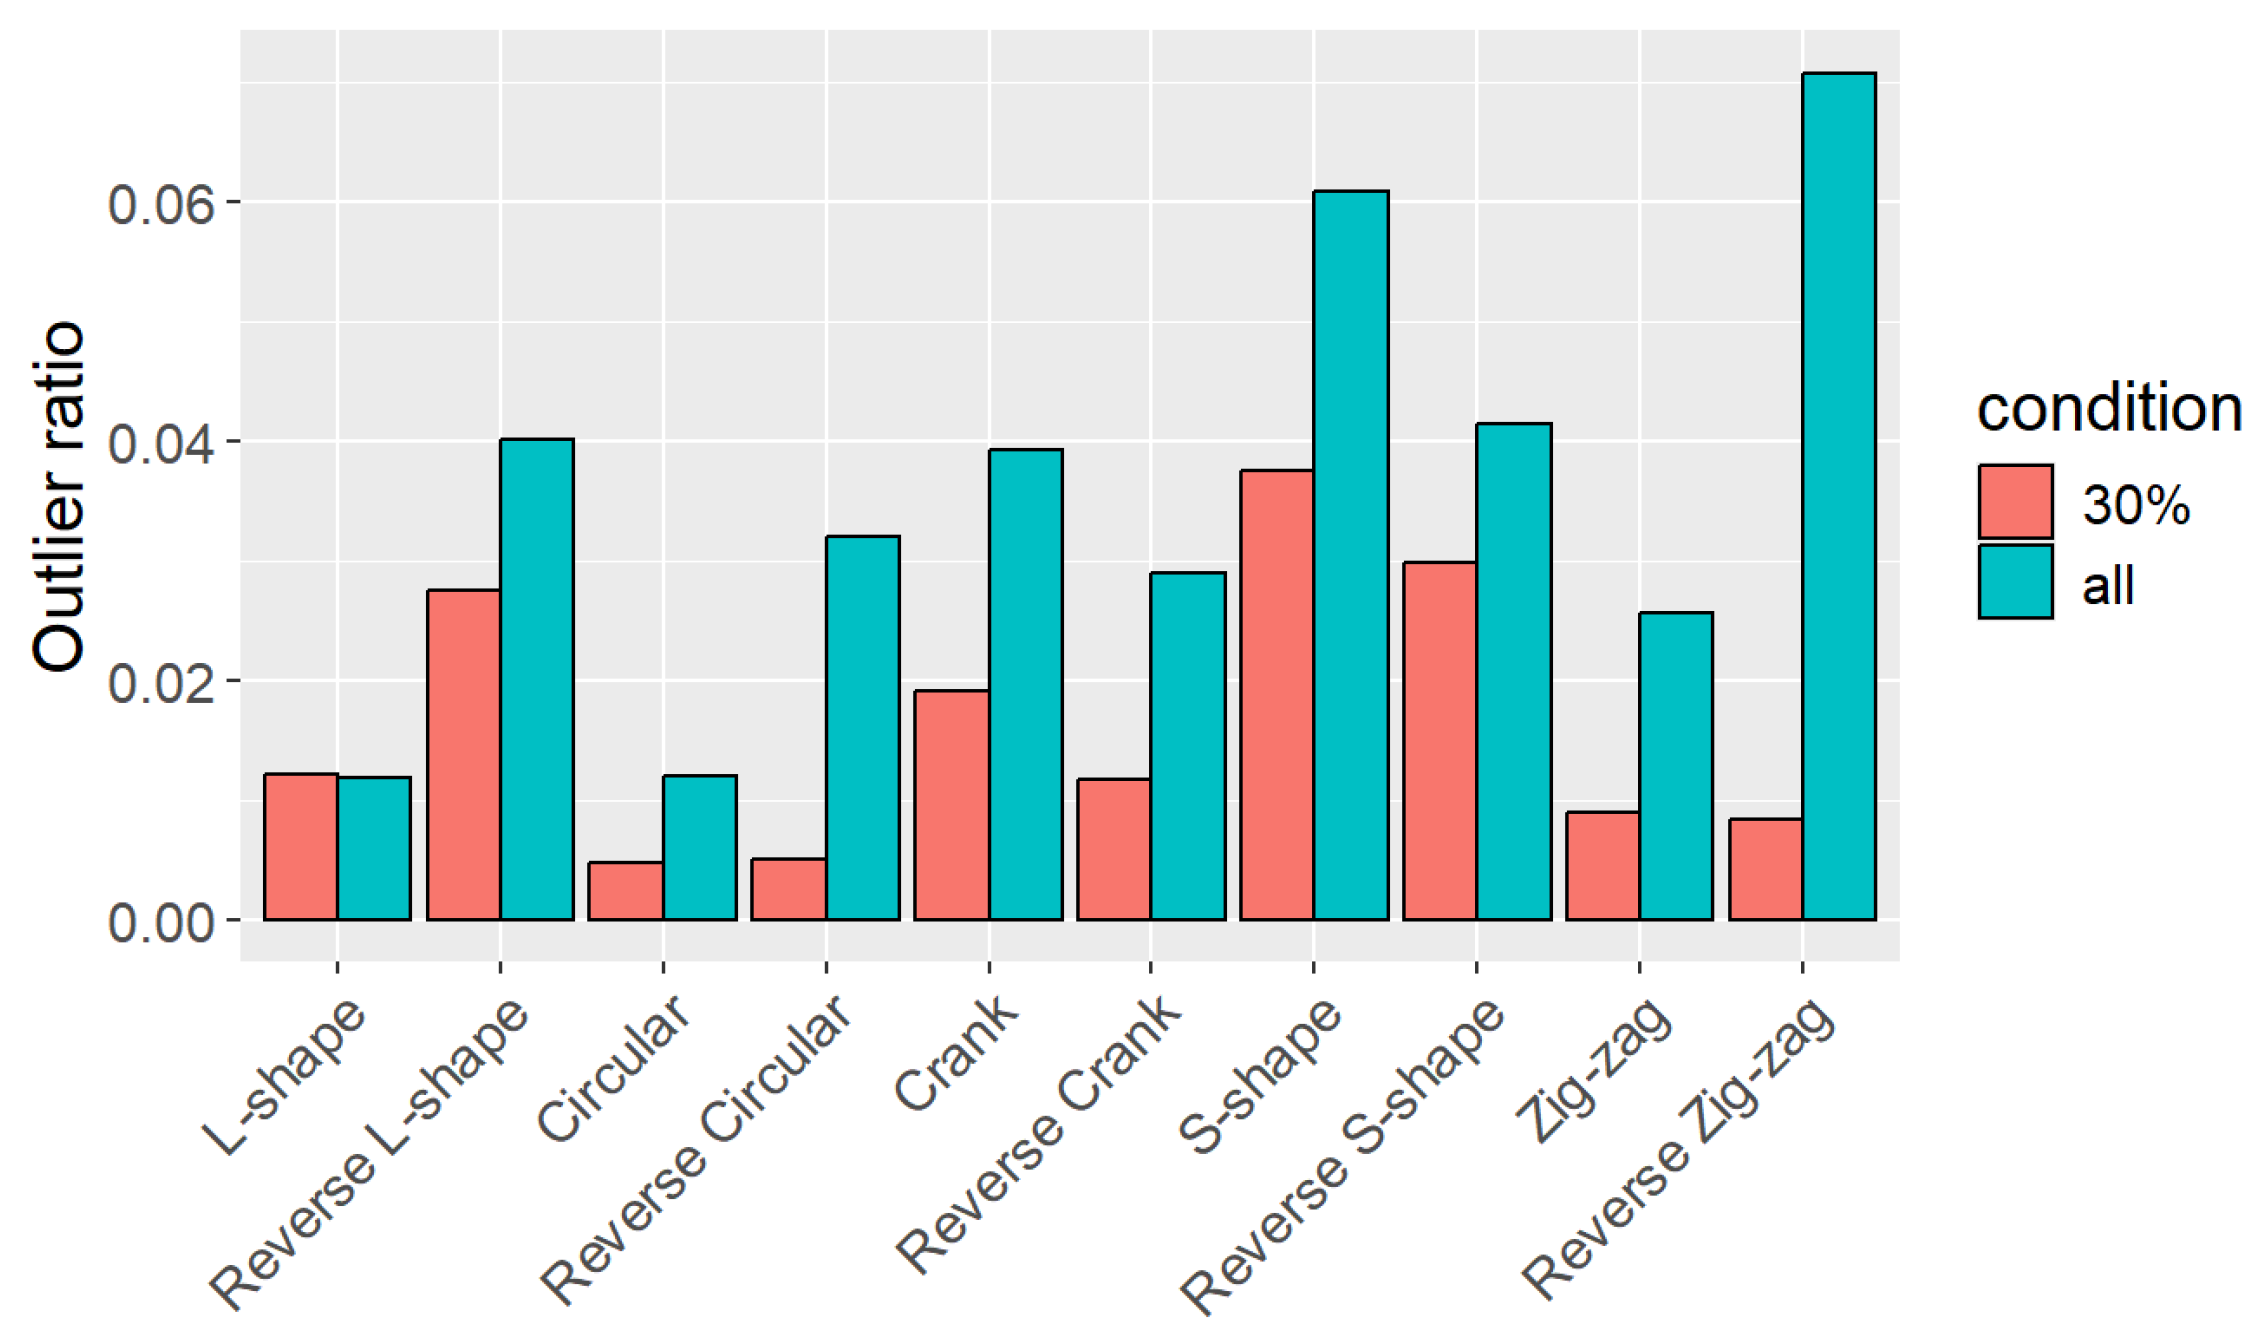
4.3. Human-Tracking Experiment with Various Paths
5. Discussion
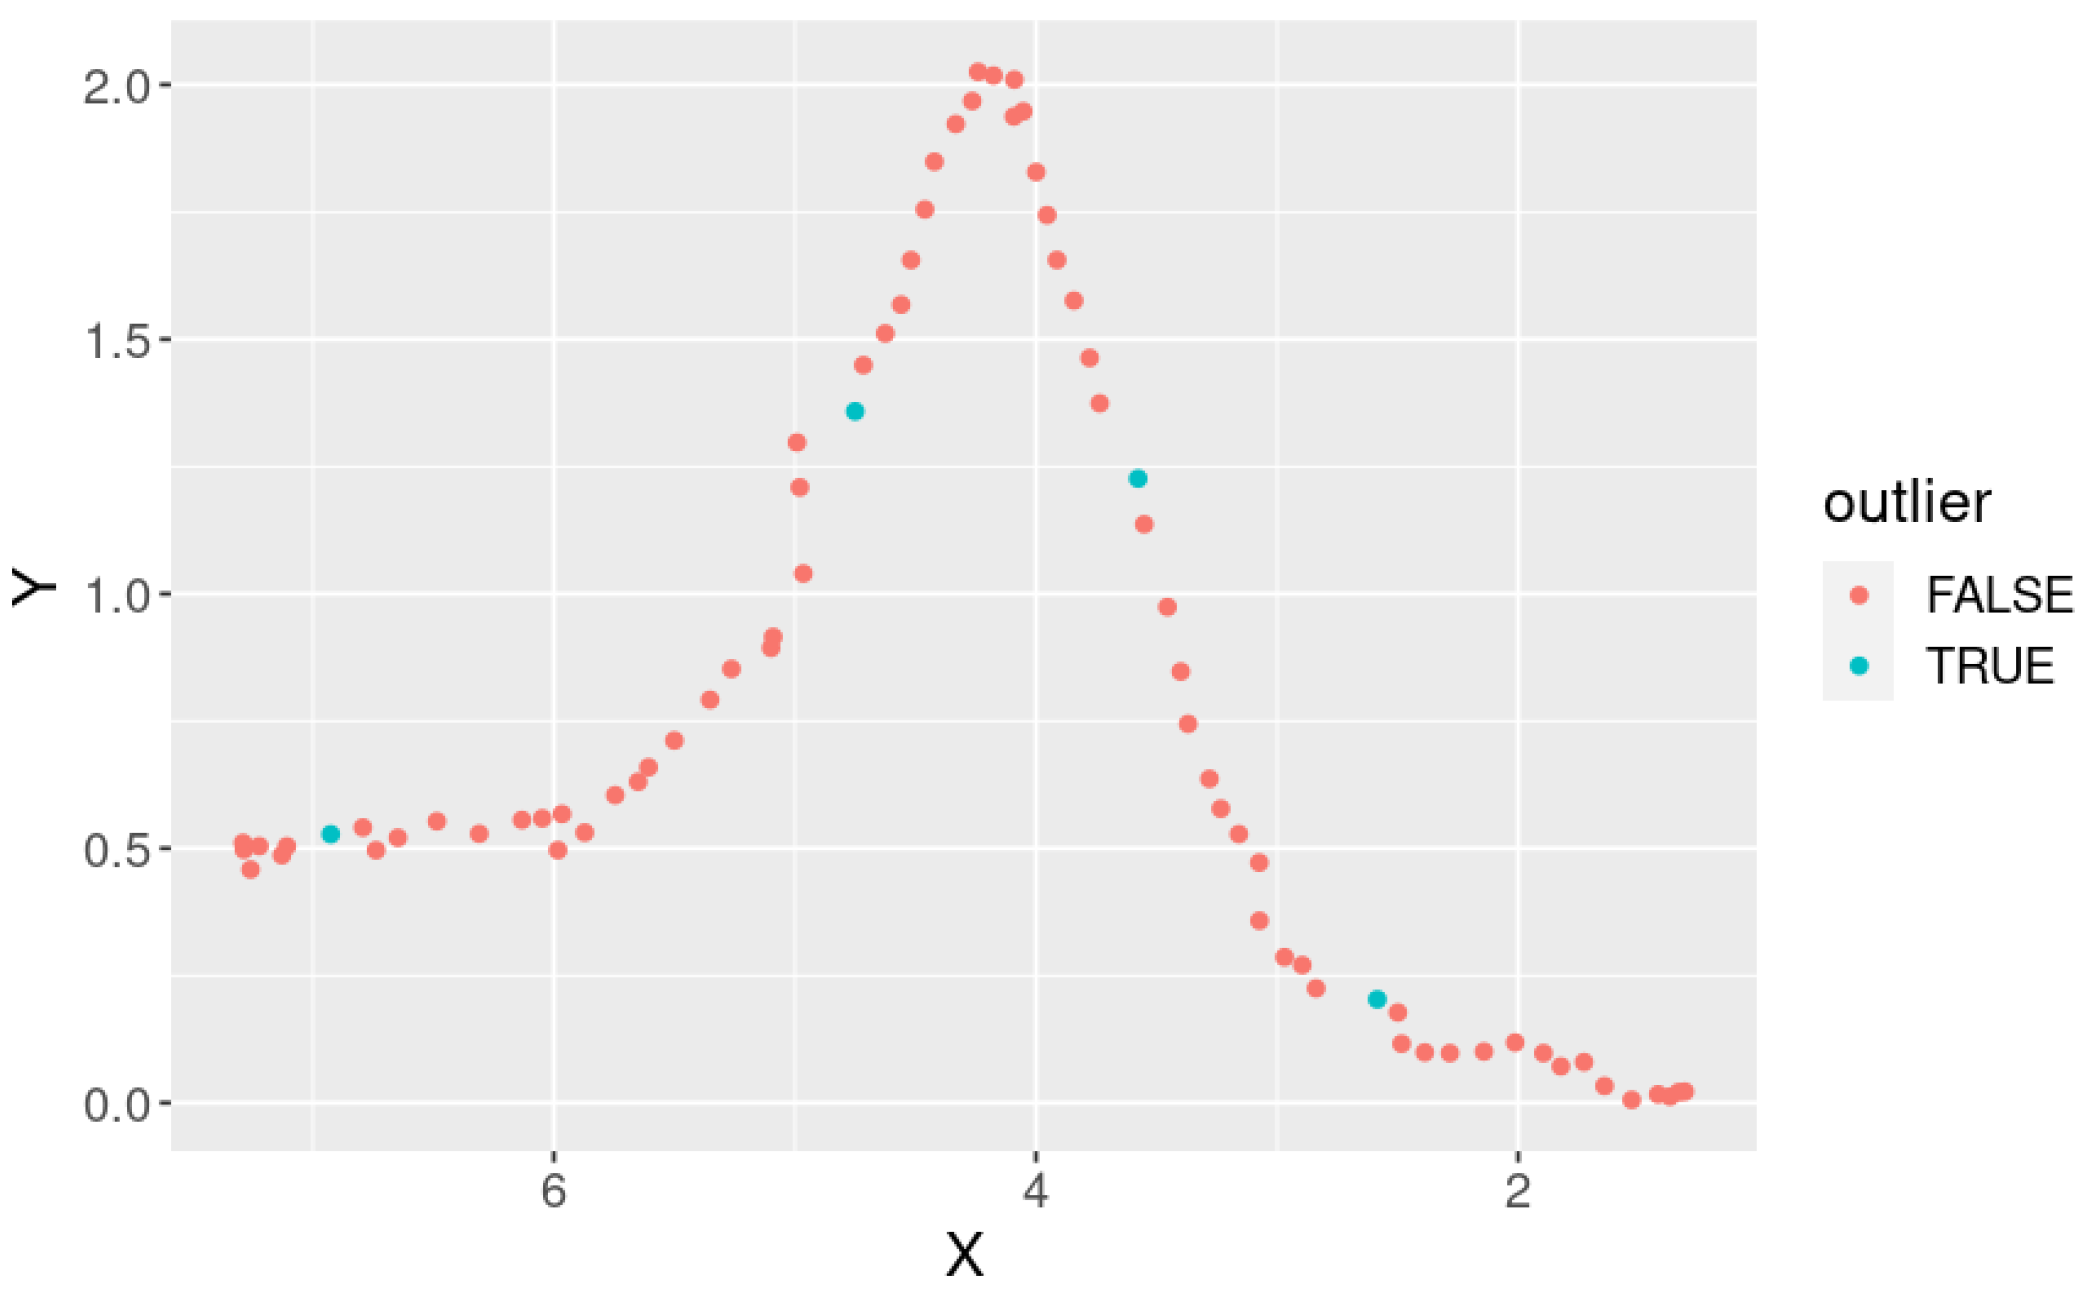
5.1. Robustness of Human Tracking
5.2. Computational Efficiency
6. Conclusions
Author Contributions
Funding
Institutional Review Board Statement
Informed Consent Statement
Data Availability Statement
Conflicts of Interest
References
- Brunetti, A.; Buongiorno, D.; Trotta, G.F.; Bevilacqua, V. Computer vision and deep learning techniques for pedestrian detection and tracking: A survey. Neurocomputing 2018, 300, 17–33. [Google Scholar] [CrossRef]
- Dutta, A.; Mondal, A.; Dey, N.; Sen, S.; Moraru, L.; Hassanien, A.E. Vision tracking: A survey of the state-of-the-art. SN Comput. Sci. 2020, 1, 57. [Google Scholar] [CrossRef]
- Xin, S.; Zhang, Z.; Wang, M.; Hou, X.; Guo, Y.; Kang, X.; Liu, L.; Liu, Y. Multi-modal 3d human tracking for robots in complex environment with siamese point-video transformer. In Proceedings of the 2024 IEEE International Conference on Robotics and Automation (ICRA), Yokohama, Japan, 13–17 May 2024; pp. 337–344. [Google Scholar]
- Munaro, M.; Menegatti, E. Fast RGB-D people tracking for service robots. Auton. Robot. 2014, 37, 227–242. [Google Scholar] [CrossRef]
- Rasoulidanesh, M.; Yadav, S.; Herath, S.; Vaghei, Y.; Payandeh, S. Deep attention models for human tracking using RGBD. Sensors 2019, 19, 750. [Google Scholar] [CrossRef]
- Liu, H.; Luo, J.; Wu, P.; Xie, S.; Li, H. People detection and tracking using RGB-D cameras for mobile robots. Int. J. Adv. Robot. Syst. 2016, 13, 1729881416657746. [Google Scholar] [CrossRef]
- Cui, H.; Dahnoun, N. High precision human detection and tracking using millimeter-wave radars. IEEE Aerosp. Electron. Syst. Mag. 2021, 36, 22–32. [Google Scholar] [CrossRef]
- Shen, Z.; Nunez-Yanez, J.; Dahnoun, N. Advanced Millimeter-Wave Radar System for Real-Time Multiple-Human Tracking and Fall Detection. Sensors 2024, 24, 3660. [Google Scholar] [CrossRef]
- Zhao, P.; Lu, C.X.; Wang, J.; Chen, C.; Wang, W.; Trigoni, N.; Markham, A. Human tracking and identification through a millimeter wave radar. Ad Hoc Netw. 2021, 116, 102475. [Google Scholar] [CrossRef]
- Ishihara, Y.; Uchitane, T.; Ito, N.; Iwata, K. Validation of Multiple Visitor Tracking with a Laser Rangefinder Using SMC Implementation of PHD Filter. In Proceedings of the 2022 Joint 12th International Conference on Soft Computing and Intelligent Systems and 23rd International Symposium on Advanced Intelligent Systems (SCIS&ISIS), Ise-Shima, Japan, 29 November–2 December 2022; pp. 1–6. [Google Scholar]
- Hu, W.; Fang, S.; Wang, Y.; Luo, D. A 2D-Laser-based Pedestrian Detector for Mobile Robots via Self-Supervised Transfer Learning. In Proceedings of the 2023 IEEE International Conference on Mechatronics and Automation (ICMA), Harbin, China, 6–9 August 2023; pp. 291–295. [Google Scholar]
- Chebotareva, E.; Safin, R.; Hsia, K.H.; Carballo, A.; Magid, E. Person-following algorithm based on laser range finder and monocular camera data fusion for a wheeled autonomous mobile robot. In Proceedings of the International Conference on Interactive Collaborative Robotics, St Petersburg, Russia, 7–9 October 2020; Springer: Berlin/Heidelberg, Germany, 2020; pp. 21–33. [Google Scholar]
- Bozorgi, H.; Truong, X.T.; La, H.M.; Ngo, T.D. 2D laser and 3D camera data integration and filtering for human trajectory tracking. In Proceedings of the 2021 IEEE/SICE International Symposium on System Integration (SII), Iwaki, Japan, 11–14 January 2021; pp. 634–639. [Google Scholar]
- Funato, K.; Tasaki, R.; Sakurai, H.; Terashima, K. Development and experimental verification of a person tracking system of mobile robots using sensor fusion of inertial measurement unit and laser range finder for occlusion avoidance. J. Robot. Mechatron. 2021, 33, 33–43. [Google Scholar] [CrossRef]
- Raj, T.; Hanim Hashim, F.; Baseri Huddin, A.; Ibrahim, M.F.; Hussain, A. A survey on LiDAR scanning mechanisms. Electronics 2020, 9, 741. [Google Scholar] [CrossRef]
- Wang, H.; Wang, B.; Liu, B.; Meng, X.; Yang, G. Pedestrian recognition and tracking using 3D LiDAR for autonomous vehicle. Robot. Auton. Syst. 2017, 88, 71–78. [Google Scholar] [CrossRef]
- Yan, Z.; Duckett, T.; Bellotto, N. Online learning for 3D LiDAR-based human detection: Experimental analysis of point cloud clustering and classification methods. Auton. Robot. 2020, 44, 147–164. [Google Scholar] [CrossRef]
- Gómez, J.; Aycard, O.; Baber, J. Efficient detection and tracking of human using 3D LiDAR sensor. Sensors 2023, 23, 4720. [Google Scholar] [CrossRef] [PubMed]
- Nakamori, Y.; Hiroi, Y.; Ito, A. Multiple player detection and tracking method using a laser range finder for a robot that plays with human. ROBOMECH J. 2018, 5, 25. [Google Scholar] [CrossRef]
- Kasai, Y.; Hiroi, Y.; Miyawaki, K.; Ito, A. Development of a mobile robot that plays tag with touch-and-away behavior using a laser range finder. Appl. Sci. 2021, 11, 7522. [Google Scholar] [CrossRef]
- Fod, A.; Howard, A.; Mataric, M. A laser-based people tracker. In Proceedings of the 2002 IEEE International Conference on Robotics and Automation (Cat. No. 02CH37292), Washington, DC, USA, 11–15 May 2002; Volume 3, pp. 3024–3029. [Google Scholar]
- Horiuchi, T.; Thompson, S.; Kagami, S.; Ehara, Y. Pedestrian tracking from a mobile robot using a laser range finder. In Proceedings of the 2007 IEEE International Conference on Systems, Man and Cybernetics, Montreal, QC, Canada, 7–10 October 2007; pp. 931–936. [Google Scholar]
- Chung, W.; Kim, H.; Yoo, Y.; Moon, C.B.; Park, J. The detection and following of human legs through inductive approaches for a mobile robot with a single laser range finder. IEEE Trans. Ind. Electron. 2011, 59, 3156–3166. [Google Scholar] [CrossRef]
- Hiroi, Y.; Matsunaka, S.; Ito, A. A mobile robot system with semi-autonomous navigation using simple and robust person following behavior. J. Man Mach. Technol. 2012, 1, 44–62. [Google Scholar]
- Zainudin, Z.; Kodagoda, S.; Dissanayake, G. Torso detection and tracking using a 2D laser range finder. In Proceedings of the 2010 Australasian Conference on Robotics and Automation, ACRA 2010, Brisbane, Australia, 1–3 December 2010. [Google Scholar]
- Kohara, Y.; Nakazawa, M. Human Tracking of Single Laser Range Finder Using Features Extracted by Deep Learning. In Proceedings of the 2019 Twelfth International Conference on Mobile Computing and Ubiquitous Network (ICMU), Kathmandu, Nepal, 4–6 November 2019; pp. 1–5. [Google Scholar] [CrossRef]
- Abrego-González, J.; Aguirre, E.; García-Silvente, M. People detection on 2D laser range finder data using deep learning and machine learning. In Proceedings of the XXIV Workshop of Physical Agents, Alicante, Spain, 5–6 September 2024; pp. 235–249. [Google Scholar]
- Hasan, M.; Uddin, M.K.; Suzuki, R.; Kuno, Y.; Kobayashi, Y. PerFication: A Person Identifying Technique by Evaluating Gait with 2D LiDAR Data. Electronics 2024, 13, 3137. [Google Scholar] [CrossRef]
- Aguirre, E.; García-Silvente, M. Detecting and tracking using 2D laser range finders and deep learning. Neural Comput. Appl. 2023, 35, 415–428. [Google Scholar] [CrossRef]
- Kutyrev, A.I.; Kiktev, N.A.; Smirnov, I.G. Laser Rangefinder Methods: Autonomous-Vehicle Trajectory Control in Horticultural Plantings. Sensors 2024, 24, 982. [Google Scholar] [CrossRef]
- Hiroi, Y.; Ito, A. Realization of a robot system that plays “Darumasan-Ga-Koronda” Game with Humans. Robotics 2019, 8, 55. [Google Scholar] [CrossRef]
- Yin, T.; Zhou, X.; Krahenbuhl, P. Center-based 3D object detection and tracking. In Proceedings of the IEEE/CVF Conference on Computer Vision and Pattern Recognition, Nashville, TN, USA, 20–25 June 2021; pp. 11784–11793. [Google Scholar]
- Yoon, S.; Choi, S.; An, J. Effective Denoising Algorithms for Converting Indoor Blueprints Using a 3D Laser Scanner. Electronics 2024, 13, 2275. [Google Scholar] [CrossRef]
- Kouchi, M.; Mochimaru, M. AIST Anthropometric Database. H16PRO 287, 2005. Available online: https://www.airc.aist.go.jp/dhrt/91-92/index.html (accessed on 1 February 2025).


| Sensors | 16 laser emitters and receivers |
| Field of View | Horizontal 360 degrees, vertical degrees |
| Range | 0.1 to 100 m |
| Sampling frequency | 5 to 20 Hz |
| Sampling speed | ≈300,000 point/s |
| Precision | cm ( @ 25 m) |
| Angle resolution | Horizontal 0.1 to 0.4 degrees, vertical 2.0 degrees |
| Ratio | Mean [m] | Standard Dev. [m] |
|---|---|---|
| 0.2 | 0.392 | 0.087 |
| 0.3 | 0.532 | 0.092 |
| 0.4 | 0.564 | 0.110 |
| 0.5 | 0.579 | 0.108 |
| Ratio | 0.2 | 0.3 | 0.4 |
|---|---|---|---|
| 0.3 | 1.0 | - | - |
| 0.4 | - | ||
| 0.5 | 1.0 |
Disclaimer/Publisher’s Note: The statements, opinions and data contained in all publications are solely those of the individual author(s) and contributor(s) and not of MDPI and/or the editor(s). MDPI and/or the editor(s) disclaim responsibility for any injury to people or property resulting from any ideas, methods, instructions or products referred to in the content. |
© 2025 by the authors. Licensee MDPI, Basel, Switzerland. This article is an open access article distributed under the terms and conditions of the Creative Commons Attribution (CC BY) license (https://creativecommons.org/licenses/by/4.0/).
Share and Cite
Kitamoto, S.; Hiroi, Y.; Miyawaki, K.; Ito, A. Robust Human Tracking Using a 3D LiDAR and Point Cloud Projection for Human-Following Robots. Sensors 2025, 25, 1754. https://doi.org/10.3390/s25061754
Kitamoto S, Hiroi Y, Miyawaki K, Ito A. Robust Human Tracking Using a 3D LiDAR and Point Cloud Projection for Human-Following Robots. Sensors. 2025; 25(6):1754. https://doi.org/10.3390/s25061754
Chicago/Turabian StyleKitamoto, Sora, Yutaka Hiroi, Kenzaburo Miyawaki, and Akinori Ito. 2025. "Robust Human Tracking Using a 3D LiDAR and Point Cloud Projection for Human-Following Robots" Sensors 25, no. 6: 1754. https://doi.org/10.3390/s25061754
APA StyleKitamoto, S., Hiroi, Y., Miyawaki, K., & Ito, A. (2025). Robust Human Tracking Using a 3D LiDAR and Point Cloud Projection for Human-Following Robots. Sensors, 25(6), 1754. https://doi.org/10.3390/s25061754