

Innovative Mining of User Requirements Through Combined Topic Modeling and Sentiment Analysis: An Automotive Case Study


Abstract
1. Introduction
2. Related Works
2.1. User Requirement Mining
2.2. Topic Modeling and Sentiment Analysis
3. A User Requirement Mining Analysis Method Based on BERTopic and RoBERTa
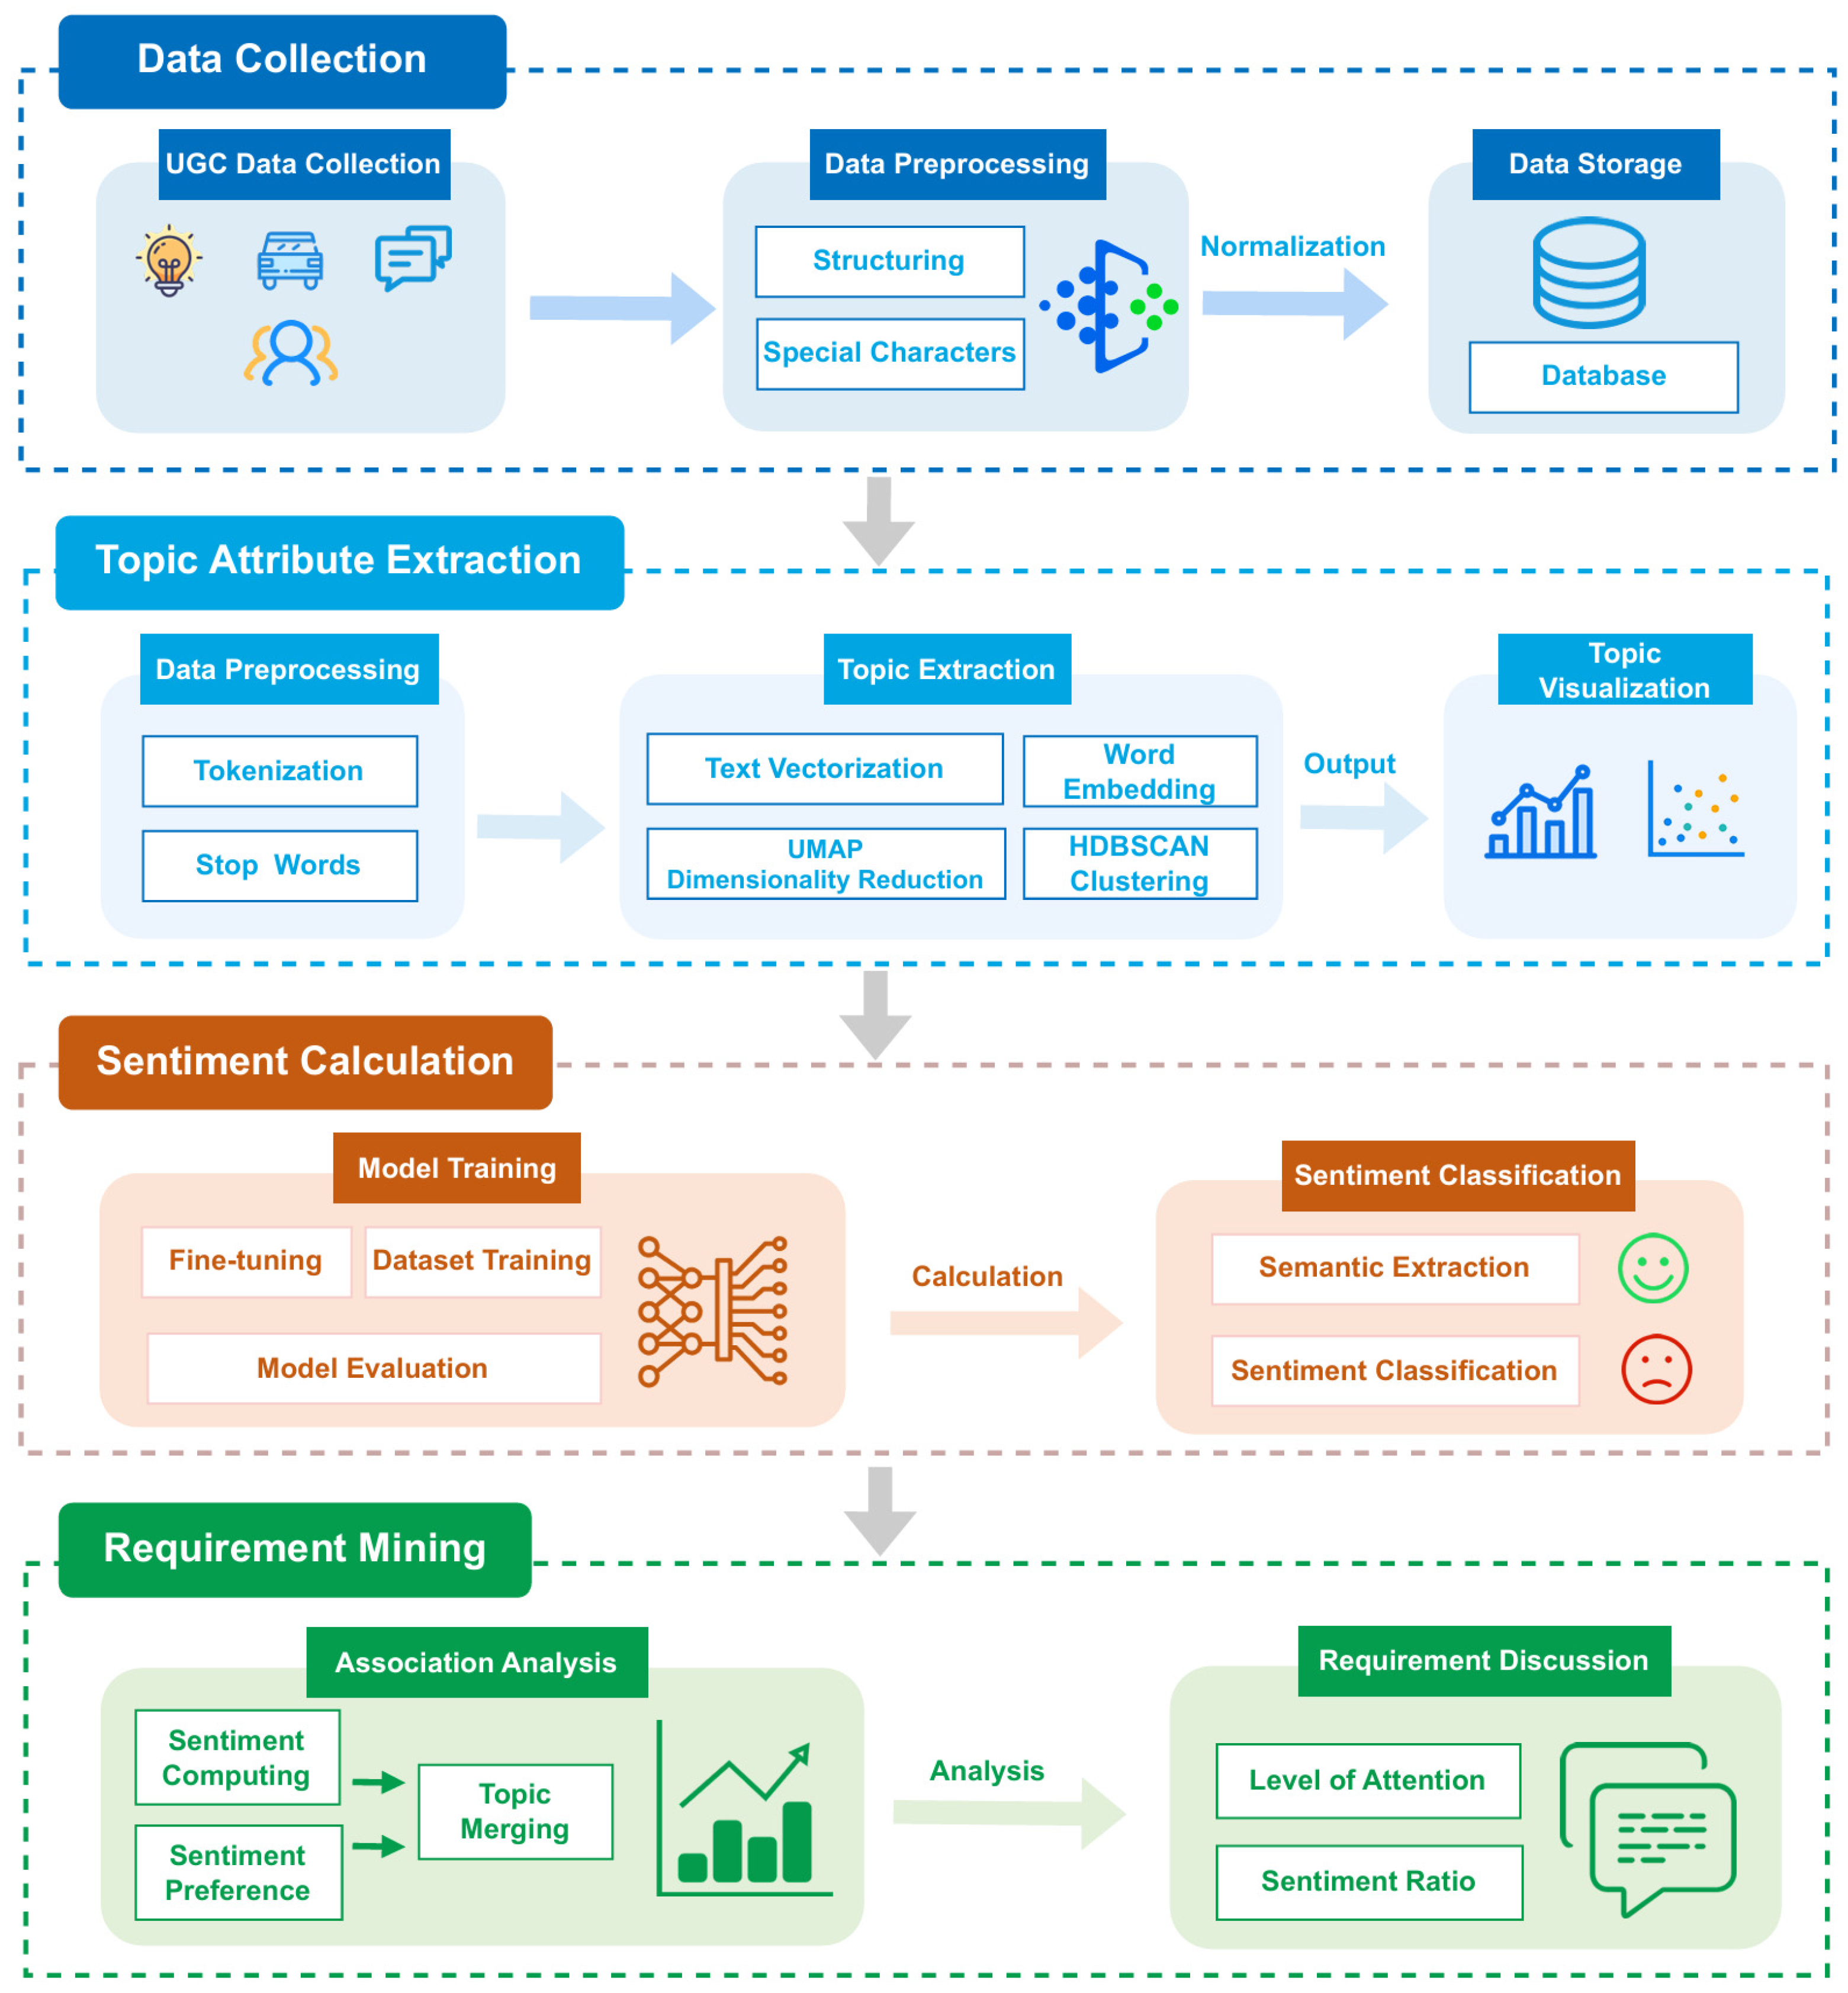
- (1)
- UGC Collection: We use Python (3.10) to develop a web scraping program that collects UGC related to automobiles from Chinese media platforms such as Autohome, Dongchedi, Weibo, and Zhihu. The data are processed using regular expressions to filter and extract content containing automotive keywords (e.g., “automobile”, “model”, “fuel consumption”, and “power”). After preliminary screening, the data undergo cleaning and preprocessing before being stored in a database for subsequent analysis;
- (2)
- Topic Attribute Extraction: Upon the completion of data preprocessing, we conduct feature extraction to obtain attribute information for each comment. The c-TF-IDF algorithm is employed to assess the importance of words within documents and convert the text into high-dimensional vector representations. Additionally, the RoBERTa model is utilized for the semantic encoding of feature vectors, capturing the deep semantic information of the text. Finally, the BERTopic model performs clustering analysis on the text to identify the main attributes of user comments;
- (3)
- Sentiment Calculation: After attribute extraction, we conduct sentiment analysis to identify the sentiment polarity and intensity of user comments. This involves constructing a sentiment lexicon and training a sentiment classification model to categorize the text into positive and negative sentiments. We combine this with the data encoded by RoBERTa for sentiment polarity determination, calculating the sentiment value for each text to obtain the sentiment distribution for each attribute cluster;
- (4)
- Requirement Mining: Following the completion of sentiment calculation, we conduct a comprehensive analysis of attribute clusters and sentiment values to systematically summarize user focus points and requirements. First, we calculate user attention to different attributes based on quantity and sentiment intensity. Next, we analyze specific evaluations and sentiment tendencies of users toward these attributes. Finally, we identify emerging needs and potential market opportunities, providing a scientific basis for brand growth in the automotive industry.
3.1. BERTopic Identification
3.1.1. c-TF-IDF-Based Keyword Extraction
3.1.2. Semantic Embedding Representation
3.1.3. UMAP Dimensionality Reduction
3.1.4. HDBSCAN Clustering Method
3.2. RoBERTa Sentiment Analysis
3.2.1. Bidirectional Transformer Architecture of RoBERTa
3.2.2. Pre-Training and Fine-Tuning Mechanism
3.2.3. Semantic Extraction Function of the [CLS] Token
3.2.4. Softmax Layer for Sentiment Classification
4. Empirical Method
4.1. UGC Data Collection
4.2. Topic Identification Using BERTopic
4.3. Sentiment Analysis with RoBERTa
4.4. Correlation Analysis Between Sentiment and Topics
4.4.1. Sentiment Distribution Calculation
4.4.2. Correlation Analysis of Topic Content and Sentiment Orientation
5. Discussion and Limitations
5.1. Comprehensive Analysis and Discussions Regarding Automotive User Needs
5.2. Limitations and Future Work
6. Conclusions
Author Contributions
Funding
Institutional Review Board Statement
Informed Consent Statement
Data Availability Statement
Acknowledgments
Conflicts of Interest
References
- Wolniak, R.; Grebski, W. The Customization and Personalization of Product in Industry 4.0; Scientific Papers of Silesian University of Technology Organization and Management Series; Silesian University of Technology: Gliwice, Poland, 2023; p. 180. [Google Scholar]
- Lee, J.; Mo, J. Analysis of technological innovation and environmental performance improvement in aviation sector. Int. J. Environ. Res. Public Health 2011, 8, 3777–3795. [Google Scholar] [CrossRef]
- Courage, C.; Baxter, K. Understanding Your Users: A Practical Guide to User Requirements Methods, Tools, and Techniques; Gulf Professional Publishing: Houston, TX, USA, 2005. [Google Scholar]
- Altarturi, H.H.; Ng, K.-Y.; Ninggal, M.I.H.; Nazri, A.S.A.; Abd Ghani, A.A. A requirement engineering model for big data software. In Proceedings of the 2017 IEEE Conference on Big Data and Analytics (ICBDA), Beijing, China, 10–12 March 2017; IEEE: Piscataway, NJ, USA, 2017. [Google Scholar]
- Zhao, L.; Alhoshan, W.; Ferrari, A.; Letsholo, K.J.; Ajagbe, M.A.; Chioasca, E.-V.; Batista-Navarro, R.T. Natural language processing for requirements engineering: A systematic mapping study. ACM Comput. Surv. (CSUR) 2021, 54, 55. [Google Scholar] [CrossRef]
- Wu, C.; Li, X.; Guo, Y.; Wang, J.; Ren, Z.; Wang, M.; Yang, Z. Natural language processing for smart construction: Current status and future directions. Autom. Constr. 2022, 134, 104059. [Google Scholar] [CrossRef]
- Mehdiyev, N.; Fettke, P. Explainable artificial intelligence for process mining: A general overview and application of a novel local explanation approach for predictive process monitoring. In Interpretable Artificial Intelligence: A Perspective of Granular Computing; Springer: Cham, Switzerland, 2021; pp. 1–28. [Google Scholar]
- Amoozad Mahdiraji, H.; Hafeez, K.; Kord, H.; Abbasi Kamardi, A. Analysing the voice of customers by a hybrid fuzzy decision-making approach in a developing country’s automotive market. Manag. Decis. 2022, 60, 399–425. [Google Scholar] [CrossRef]
- Li, S.; Liu, F.; Zhang, Y.; Zhu, B.; Zhu, H.; Yu, Z. Text mining of user-generated content (UGC) for business applications in e-commerce: A systematic review. Mathematics 2022, 10, 3554. [Google Scholar] [CrossRef]
- Li, H.; Zhang, L.; Hsu, C.H. Research on user-generated photos in tourism and hospitality: A systematic review and way forward. Tour. Manag. 2023, 96, 104714. [Google Scholar] [CrossRef]
- Stappen, L.; Baird, A.; Rizos, G.; Tzirakis, P.; Du, X.; Hafner, F.; Schumann, L.; Mallol-Ragolta, A.; Schuller, B.W.; Lefter, I.; et al. Muse 2020 challenge and workshop: Multimodal sentiment analysis, emotion-target engagement and trustworthiness detection in real-life media: Emotional car reviews in-the-wild. In Proceedings of the 1st International on Multimodal Sentiment Analysis in Real-life Media Challenge and Workshop, Seattle, WA, USA, 16 October 2020. [Google Scholar]
- Abdullah, M.H.A.; Aziz, N.; Abdulkadir, S.J.; Alhussian, H.S.A.; Talpur, N. Systematic literature review of information extraction from textual data: Recent methods, applications, trends, and challenges. IEEE Access 2023, 11, 10535–10562. [Google Scholar] [CrossRef]
- Blei, D.M.; Ng, A.Y.; Jordan, M.I. Latent dirichlet allocation. J. Mach. Learn. Res. 2003, 3, 993–1022. [Google Scholar]
- Gourisaria, M.K.; Chandra, S.; Das, H.; Patra, S.S.; Sahni, M.; Leon-Castro, E.; Singh, V.; Kumar, S. Semantic analysis and topic modelling of web-scrapped COVID-19 tweet corpora through data mining methodologies. Healthcare 2022, 10, 881. [Google Scholar] [CrossRef]
- Grootendorst, M. BERTopic: Neural topic modeling with a class-based TF-IDF procedure. arXiv 2022, arXiv:2203.05794. [Google Scholar]
- Liu, Y. Roberta: A robustly optimized bert pretraining approach. arXiv 2019, arXiv:1907.11692. [Google Scholar]
- Wang, Z.; Chen, J.; Chen, J.; Chen, H. Identifying interdisciplinary topics and their evolution based on BERTopic. Scientometrics 2023, 129, 7359–7384. [Google Scholar] [CrossRef]
- Liao, W.; Zeng, B.; Yin, X.; Wei, P. An improved aspect-category sentiment analysis model for text sentiment analysis based on RoBERTa. Appl. Intell. 2021, 51, 3522–3533. [Google Scholar] [CrossRef]
- Sun, H.; Guo, W.; Shao, H.; Rong, B. Dynamical mining of ever-changing user requirements: A product design and improvement perspective. Adv. Eng. Inform. 2020, 46, 101174. [Google Scholar] [CrossRef]
- Bhat, S.Y.; Abulaish, M. Analysis and mining of online social networks: Emerging trends and challenges. Wiley Interdiscip. Rev. Data Min. Knowl. Discov. 2013, 3, 408–444. [Google Scholar] [CrossRef]
- Baxter, K.; Courage, C.; Caine, K. Understanding Your Users: A Practical Guide to User Research Methods; Morgan Kaufmann: Burlington, MA, USA, 2015. [Google Scholar]
- Price, R.A.; Wrigley, C.; Straker, K. Not just what they want, but why they want it: Traditional market research to deep customer insights. Qual. Mark. Res. Int. J. 2015, 18, 230–248. [Google Scholar] [CrossRef]
- Shaw, M.J.; Subramaniam, C.; Tan, G.W.; Welge, M.E. Knowledge management and data mining for marketing. Decis. Support Syst. 2001, 31, 127–137. [Google Scholar] [CrossRef]
- Tsytsarau, M.; Palpanas, T. Survey on mining subjective data on the web. Data Min. Knowl. Discov. 2012, 24, 478–514. [Google Scholar] [CrossRef]
- Biswas, S.; Poornalatha, G. Opinion Mining Using Multi-Dimensional Analysis. IEEE Access 2023, 11, 25906–25916. [Google Scholar] [CrossRef]
- Santos, M.L.B.d. The “so-called” UGC: An updated definition of user-generated content in the age of social media. Online Inf. Rev. 2022, 46, 95–113. [Google Scholar] [CrossRef]
- Sykora, M.; Elayan, S.; Hodgkinson, I.R.; Jackson, T.W.; West, A. The power of emotions: Leveraging user generated content for customer experience management. J. Bus. Res. 2022, 144, 997–1006. [Google Scholar] [CrossRef]
- Yim, J.G.; Wang, Y.; Birkbeck, N.; Adsumilli, B. Subjective quality assessment for youtube ugc dataset. In Proceedings of the 2020 IEEE International Conference on Image Processing (ICIP), Virtual, 25–28 October 2020; IEEE: Piscataway, NJ, USA. [Google Scholar]
- Kang, Y.; Cai, Z.; Tan, C.-W.; Huang, Q.; Liu, H. Natural language processing (NLP) in management research: A literature review. J. Manag. Anal. 2020, 7, 139–172. [Google Scholar] [CrossRef]
- Martineau, J.; Finin, T. Delta tfidf: An improved feature space for sentiment analysis. In Proceedings of the International AAAI Conference on Web and Social Media, San Jose, CA, USA, 17–20 May 2009. [Google Scholar]
- Das, M.; Alphonse, P. A comparative study on tf-idf feature weighting method and its analysis using unstructured dataset. arXiv 2023, arXiv:2308.04037. [Google Scholar]
- Li, Z.; Yang, C.; Huang, C. A Comparative Sentiment Analysis of Airline Customer Reviews Using Bidirectional Encoder Representations from Transformers (BERT) and Its Variants. Mathematics 2023, 12, 53. [Google Scholar] [CrossRef]
- Yang, J.; Yecies, B. Mining Chinese social media UGC: A big-data framework for analyzing Douban movie reviews. J. Big Data 2016, 3, 3. [Google Scholar] [CrossRef]
- Jeong, B.; Yoon, J.; Lee, J.-M. Social media mining for product planning: A product opportunity mining approach based on topic modeling and sentiment analysis. Int. J. Inf. Manag. 2019, 48, 280–290. [Google Scholar] [CrossRef]
- Jelodar, H.; Wang, Y.; Yuan, C.; Feng, X.; Jiang, X.; Li, Y.; Zhao, L. Latent Dirichlet allocation (LDA) and topic modeling: Models, applications, a survey. Multimed. Tools Appl. 2019, 78, 15169–15211. [Google Scholar] [CrossRef]
- Liu, B. Sentiment Analysis and Opinion Mining; Springer Nature: Berlin/Heidelberg, Germany, 2022. [Google Scholar]
- Yi, X.; Allan, J. A comparative study of utilizing topic models for information retrieval. In Proceedings of the Advances in Information Retrieval: 31th European Conference on IR Research, ECIR 2009, Toulouse, France, 6–9 April 2009. Proceedings 31; Springer: Berlin/Heidelberg, Germany, 2009. [Google Scholar]
- Nallapati, R.M.; Ahmed, A.; Xing, E.P.; Cohen, W.W. Joint latent topic models for text and citations. In Proceedings of the 14th ACM SIGKDD International Conference on Knowledge Discovery and Data Mining, Las Vegas, NV, USA, 24–27 August 2008. [Google Scholar]
- Borčin, M.; Jose, J.M. Optimizing BERTopic: Analysis and Reproducibility Study of Parameter Influences on Topic Modeling. In Proceedings of the European Conference on Information Retrieval, Glasgow, UK, 24–28 March 2024; Springer: Berlin/Heidelberg, Germany, 2024. [Google Scholar]
- Khodeir, N.; Elghannam, F. Efficient topic identification for urgent MOOC Forum posts using BERTopic and traditional topic modeling techniques. Educ. Inf. Technol. 2024, 1–27. [Google Scholar] [CrossRef]
- Mohammad, S.M. Sentiment analysis: Detecting valence, emotions, and other affectual states from text. In Emotion Measurement; Elsevier: Amsterdam, The Netherlands, 2016; pp. 201–237. [Google Scholar]
- Guo, J. Deep learning approach to text analysis for human emotion detection from big data. J. Intell. Syst. 2022, 31, 113–126. [Google Scholar] [CrossRef]
- Cheruku, R.; Hussain, K.; Kavati, I.; Reddy, A.M.; Reddy, K.S. Sentiment classification with modified RoBERTa and recurrent neural networks. Multimed. Tools Appl. 2024, 83, 29399–29417. [Google Scholar] [CrossRef]
- Vaswani, A. Attention is all you need. In Proceedings of the Advances in Neural Information Processing Systems, Long Beach, CA, USA, 4–9 December 2017. [Google Scholar]
- McInnes, L.; Healy, J.; Melville, J. Umap: Uniform manifold approximation and projection for dimension reduction. arXiv 2018, arXiv:1802.03426. [Google Scholar]
- McInnes, L.; Healy, J.; Astels, S. hdbscan: Hierarchical density based clustering. J. Open Source Softw. 2017, 2, 205. [Google Scholar] [CrossRef]
- Adoma, A.F.; Henry, N.-M.; Chen, W. Comparative analyses of bert, roberta, distilbert, and xlnet for text-based emotion recognition. In Proceedings of the 2020 17th International Computer Conference on Wavelet Active Media Technology and Information Processing (ICCWAMTIP), Chengdu, China, 18–20 December 2020; IEEE: Piscataway, NJ, USA, 2020. [Google Scholar]
- Salazar, J.; Liang, D.; Nguyen, T.Q.; Kirchhoff, K. Masked language model scoring. arXiv 2019, arXiv:1910.14659. [Google Scholar]
- Zhang, H.; Hao, Y.; Ngo, C.-W. Token shift transformer for video classification. In Proceedings of the 29th ACM International Conference on Multimedia, Virtual, 20–24 October 2021. [Google Scholar]
- Friedl, J. Mastering Regular Expressions; O’Reilly Media, Inc.: Sebastopol, CA, USA, 2006. [Google Scholar]

| Field Name | Field Annotation | Field Function |
|---|---|---|
| platformId | Platform ID | Used to distinguish the source of platform data |
| contentId | Article ID | Used to uniquely identify articles |
| title | Article Title | The main title of the article |
| content | Article Content | The thematic content of the article |
| likesCount | Number of Likes | The total count of likes or positive feedback |
| commentsCount | Number of Comments | Records user engagement and interest in article content |
| Category | Regular Keywords |
|---|---|
| Brands | BMW|Mercedes-Benz|Audi|Tesla|Toyota|Honda|Ford|Volkswagen|Lexus|Volvo|Mazda|Porsche|Nissan|Chevrolet|Cadillac|BYD|Geely|Changan|Great Wall|Chery|NIO|Xpeng|Lixiang|Hongqi|Roewe|MG|GAC|Dongfeng|FAW|Haval|JAC|Wei|Baojun|Venucia|Bestune|Ora|SAIC|Bisu |
| Models | SUV|Sedan|Sports Car|Convertible|MPV|Pickup|Electric Vehicle|Plug-in Hybrid|Hybrid Power|New Energy Vehicle|Fuel Vehicle|Supercar|Hatchback|Sedan|Crossover|Mini Car |
| Related Terms | Engine|Gearbox|Brake|Suspension|Chassis|Tire|Interior|Seat|Steering Wheel|Center Console|Headlight|Battery|Electric Motor|Air Conditioner|Instrument Panel|Window|Headlight|Reversing Radar|Sunroof|Heated Seat|Onboard Charger|Fuel Consumption|Endurance|Control|Power|Comfort|Acceleration|Braking Distance|Noise|Emission|Cost-Effectiveness|Value Retention Rate|Body Stability|Driving Assistance|Automatic Driving|Four-wheel Drive System|Suspension Comfort|100 km/h Acceleration|Battery Life|Smooth Shifting|Noise Isolation |
| Title | Text Content | Platform Source | Likes Count | Comments Count |
|---|---|---|---|---|
| 4 March 2024 | What impact will the BYD Qin new car at 79,800 have on joint venture cars? | Zhihu | 303 | 46 |
| 9 November 2023 | I don’t know about others, but Tesla is worth a try. | Autohome | 12 | 49 |
| 5 January 2024 | The panoramic sunroof is really nice. | Dongchedi | 127 | 345 |
| 11 March 2024 | How is the Audi A5’s intelligent driving? | 68 | 122 |
| Parameter | Value |
|---|---|
| batch_size | 128 |
| learning_rate | 5 × 10⁻⁵ |
| epoch | 4 |
| hidden_size | 768 |
| Model | Accuracy | Precision | Recall | F1-Score |
|---|---|---|---|---|
| RoBERTa | 0.9091 | 0.8621 | 0.8929 | 0.8771 |
| BERT | 0.8734 | 0.8547 | 0.8612 | 0.8579 |
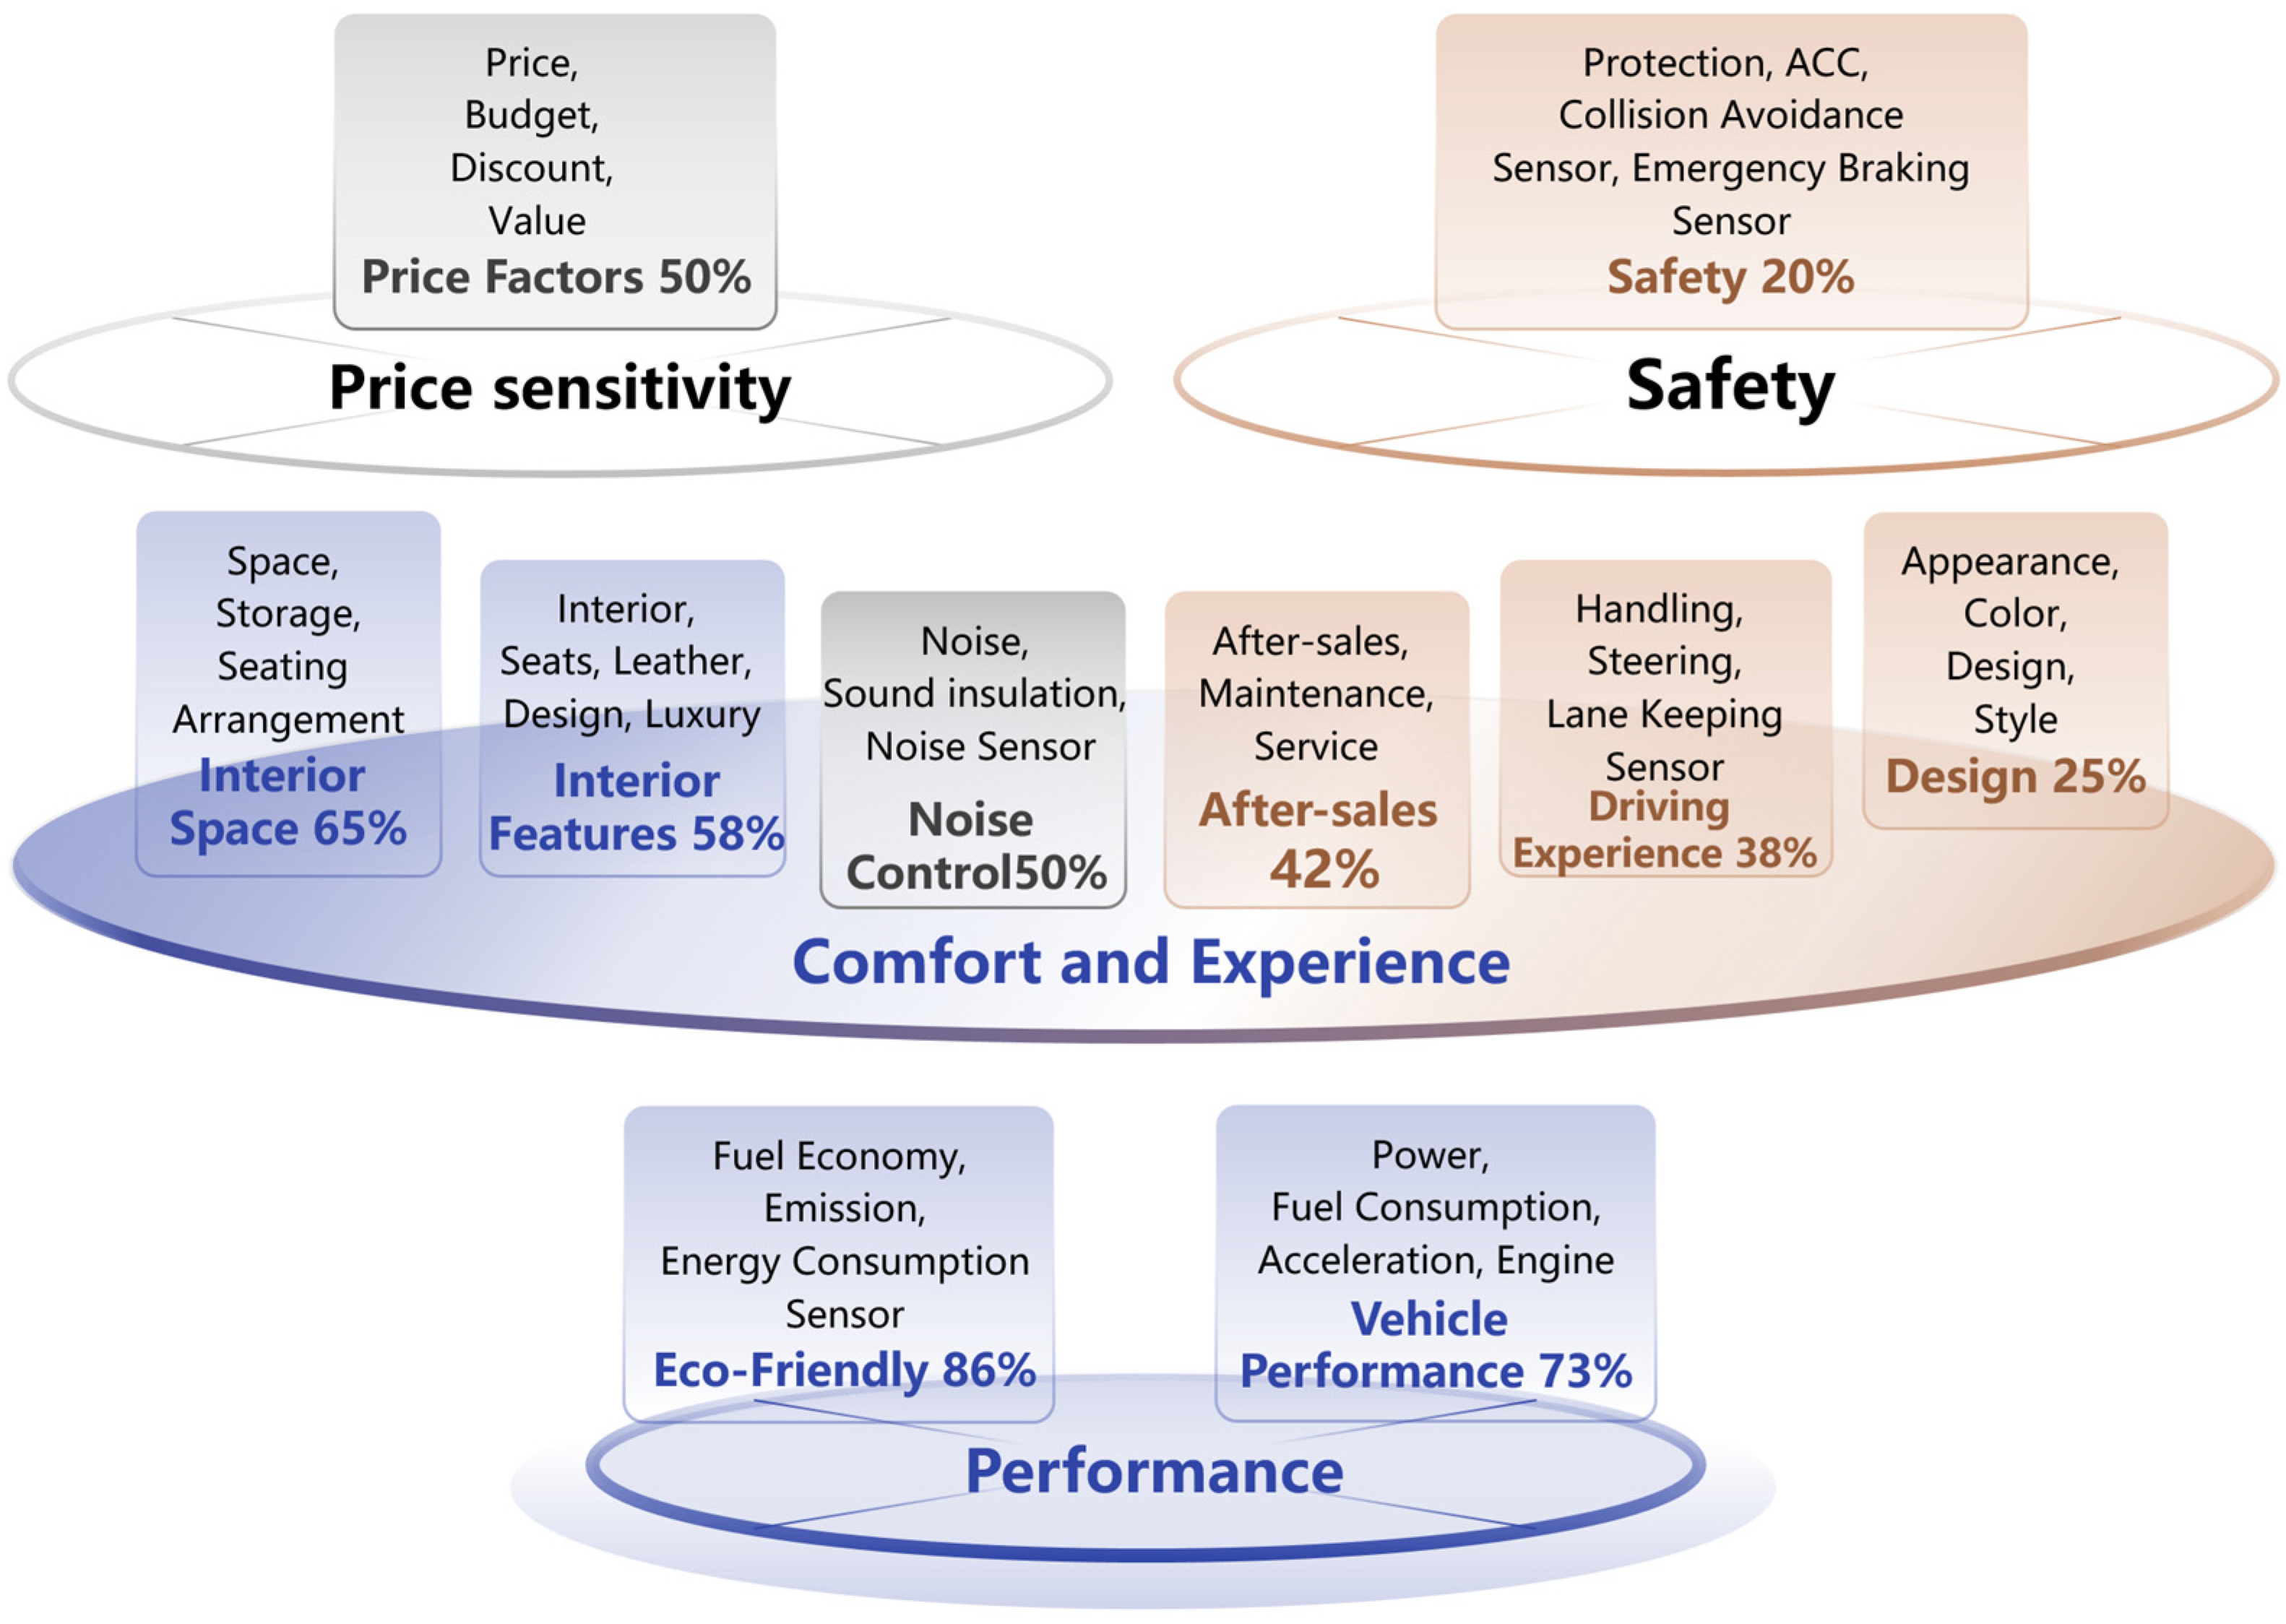
| Topic ID | Keywords | Category | Positive Sentiment Ratio | Negative Sentiment Ratio | Text Count |
|---|---|---|---|---|---|
| 1 | Fuel Economy, Emission, Hybrid, Electric, and Energy Consumption Sensor | Eco-Friendly | 86% | 14% | 3712 |
| 2 | Power, Fuel Consumption, Acceleration, and Engine | Vehicle Performance | 73% | 27% | 11,524 |
| 3 | Space, Storage, and Seating Arrangement | Interior Space | 65% | 35% | 3956 |
| 4 | Interior, Seats, Leather, Design, and Luxury | Interior Features | 58% | 42% | 8316 |
| 5 | Noise, Sound insulation, Quiet effect, Wind noise, Engine noise, and Noise Sensor | Noise Control | 50% | 50% | 4729 |
| 6 | Price, Budget, Discount, and Value | Price Factors | 50% | 50% | 6429 |
| 7 | After-sales, Maintenance, and Service | After-sales | 42% | 58% | 5382 |
| 8 | Handling, Steering, Suspension, Feedback, and Lane Keeping Sensor | Driving Experience | 38% | 62% | 5212 |
| 9 | Appearance, Color, Design, and Style | Design | 25% | 75% | 4263 |
| 10 | Safety, Collision, Airbags, Protection, ACC, Collision Avoidance Sensor, and Emergency Braking Sensor | Safety | 20% | 80% | 7673 |
Disclaimer/Publisher’s Note: The statements, opinions and data contained in all publications are solely those of the individual author(s) and contributor(s) and not of MDPI and/or the editor(s). MDPI and/or the editor(s) disclaim responsibility for any injury to people or property resulting from any ideas, methods, instructions or products referred to in the content. |
© 2025 by the authors. Licensee MDPI, Basel, Switzerland. This article is an open access article distributed under the terms and conditions of the Creative Commons Attribution (CC BY) license (https://creativecommons.org/licenses/by/4.0/).
Share and Cite
Liu, Y.; Zhang, D.; Wan, Q.; Lin, Z. Innovative Mining of User Requirements Through Combined Topic Modeling and Sentiment Analysis: An Automotive Case Study. Sensors 2025, 25, 1731. https://doi.org/10.3390/s25061731
Liu Y, Zhang D, Wan Q, Lin Z. Innovative Mining of User Requirements Through Combined Topic Modeling and Sentiment Analysis: An Automotive Case Study. Sensors. 2025; 25(6):1731. https://doi.org/10.3390/s25061731
Chicago/Turabian StyleLiu, Yujia, Dong Zhang, Qian Wan, and Zhongzhen Lin. 2025. "Innovative Mining of User Requirements Through Combined Topic Modeling and Sentiment Analysis: An Automotive Case Study" Sensors 25, no. 6: 1731. https://doi.org/10.3390/s25061731
APA StyleLiu, Y., Zhang, D., Wan, Q., & Lin, Z. (2025). Innovative Mining of User Requirements Through Combined Topic Modeling and Sentiment Analysis: An Automotive Case Study. Sensors, 25(6), 1731. https://doi.org/10.3390/s25061731