

Measurement of Human Body Segment Properties Using Low-Cost RGB-D Cameras

 ,
,  ,
,  ,
,  ,
,  and
and 
Abstract
1. Introduction
- 1.
- The acquisition setup adopts a single Kinect Azure, which is an RGB-D camera with enhanced performance compared with its predecessors, positioned atop the experimental bed, thus producing a refined subject point cloud with reduced noise [26].
- 2.
- A total of 60 healthy subjects (30 males and 30 females) participated in this study (two times more than the previous work). It is worth noting that conducting measurement tests on a gender-balanced dataset is uncommon in the research community.
- 3.
- 4.
- The proposed volume estimation method is based on a Monte Carlo generation of points inside the alpha shape approximation of a 3D body segment, a procedure that any computer can conduct without employing heavy and complex deep learning models. Consequently, the output volume is the result of a measurement conducted on the subject body, in contrast with generalized anthropometric tables.
- 5.
- The resulting gender-specific data are validated by comparing them with the anthropometric tables [12] and manual measurements, especially focusing on the limbs since they account for the majority of the inertia during kinematic analysis of moving subjects. In addition to the volume comparison, we propose a novel method based on the computation of “equivalent diameters” to better analyze the model’s results. The evaluation part of this article is the strong feature of our study, whihc is often overlooked in the majority of articles on the matter.
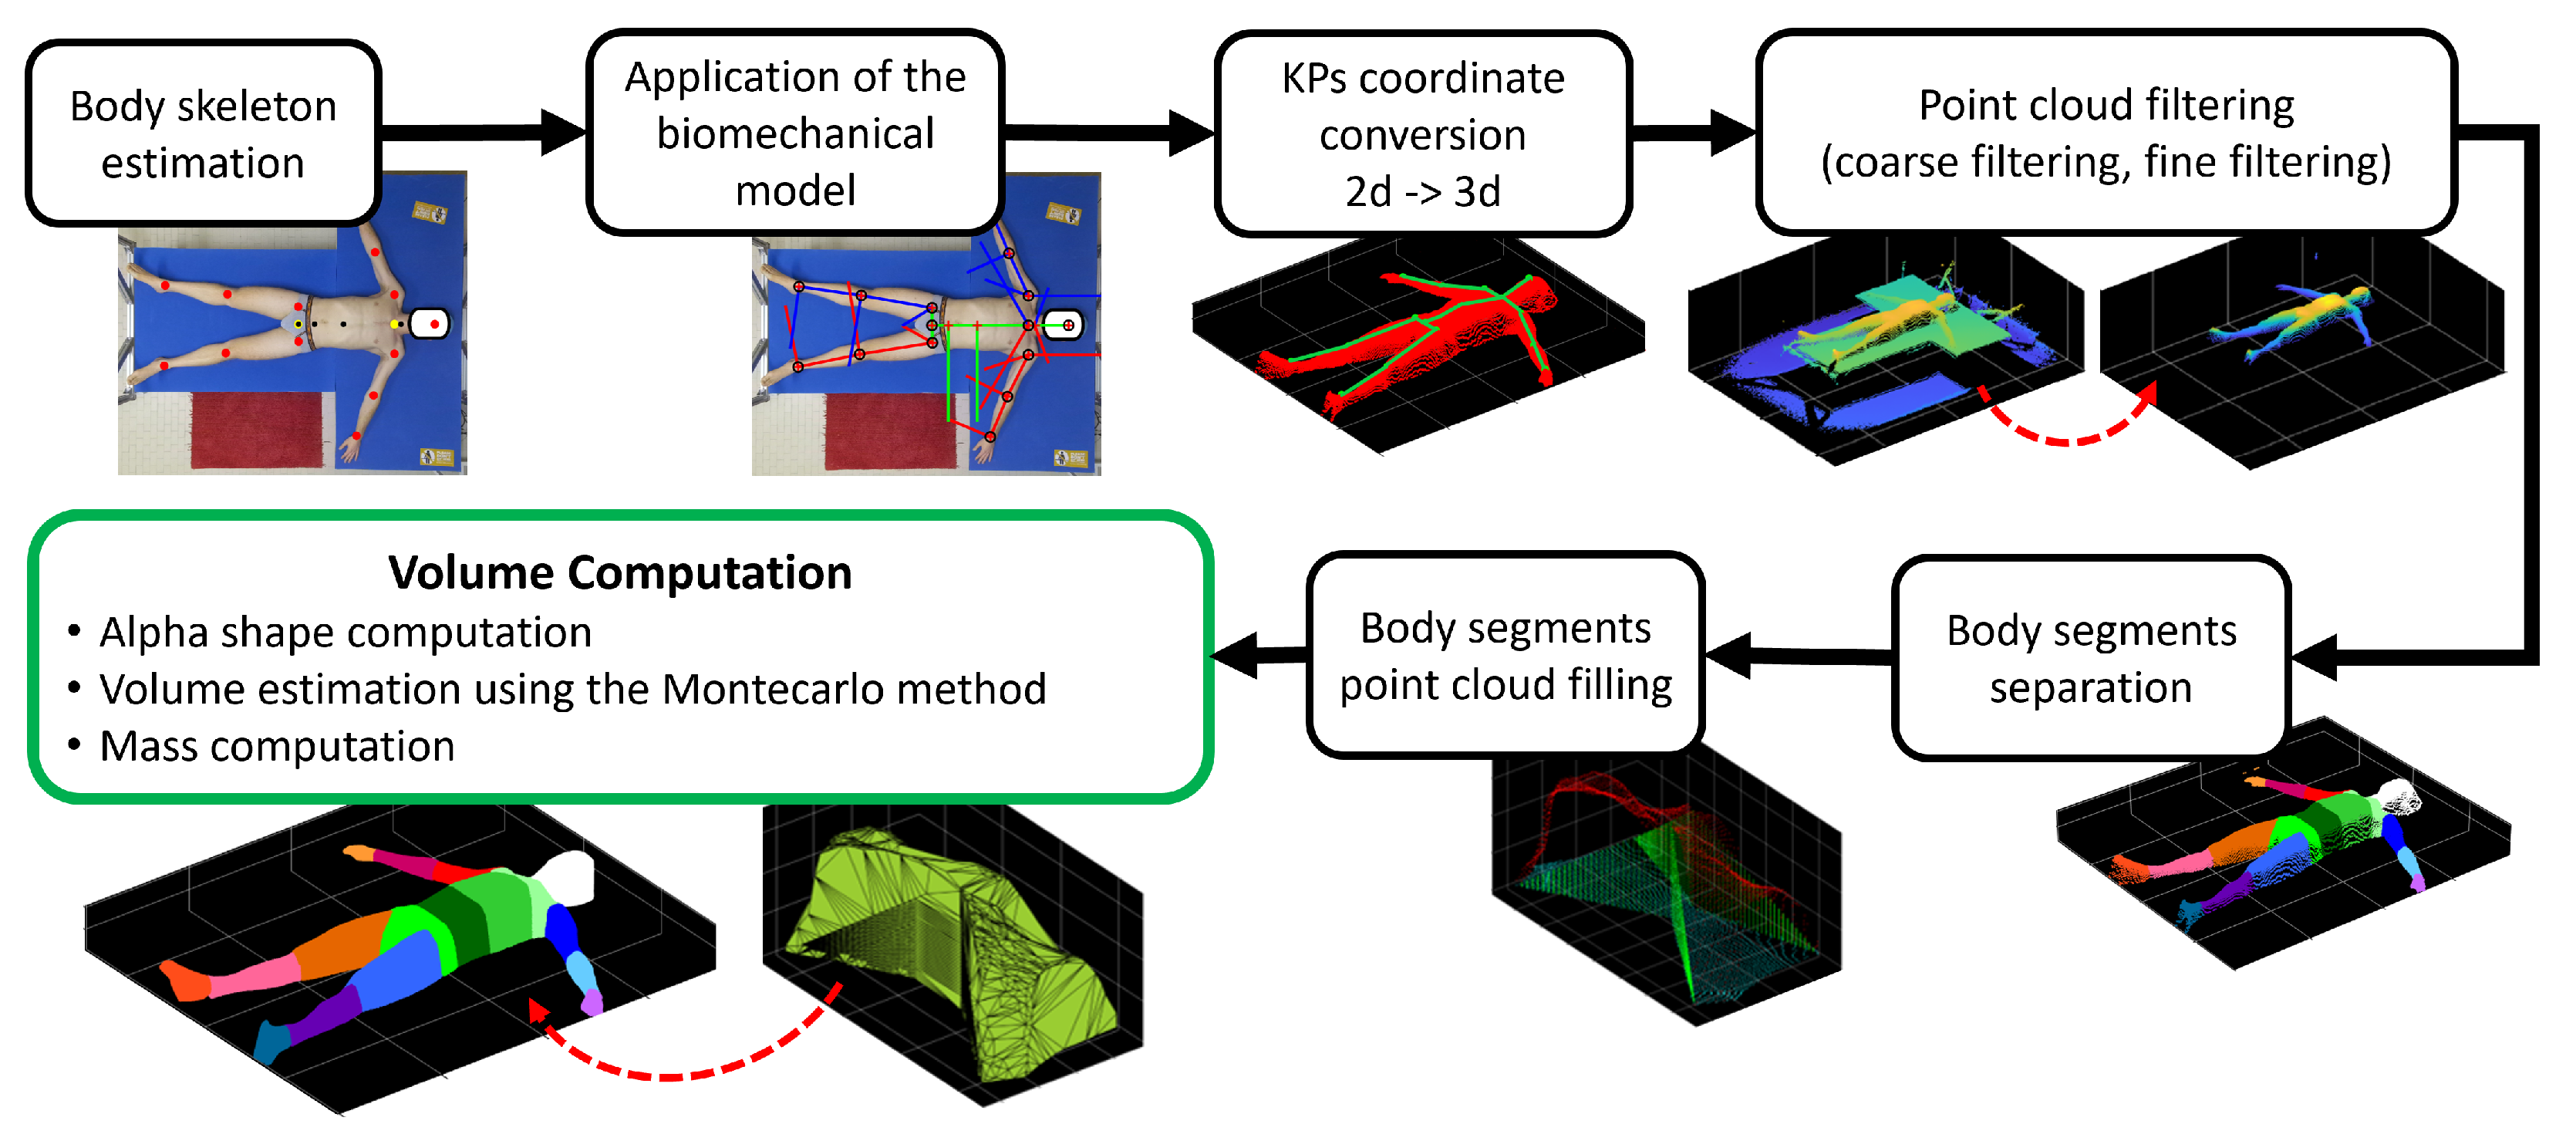
2. Materials and Methods
2.1. Experimental Protocol
- 1.
- Length measurements: these were taken considering the body segment’s length (L) from the distal and proximal joints using sartorial tape.
- 2.
- Width measurements: these were taken using the anthropometric compass to measure the distances (D) between joints or the width (W) of the body segment from side to side (usually from the front) corresponding to specific joint positions.
- 3.
- Circumferences: these were taken using sartorial tape in correspondence with specific joints or when the body segment is circular (O).
2.2. Experimental Campaign
2.3. Materials
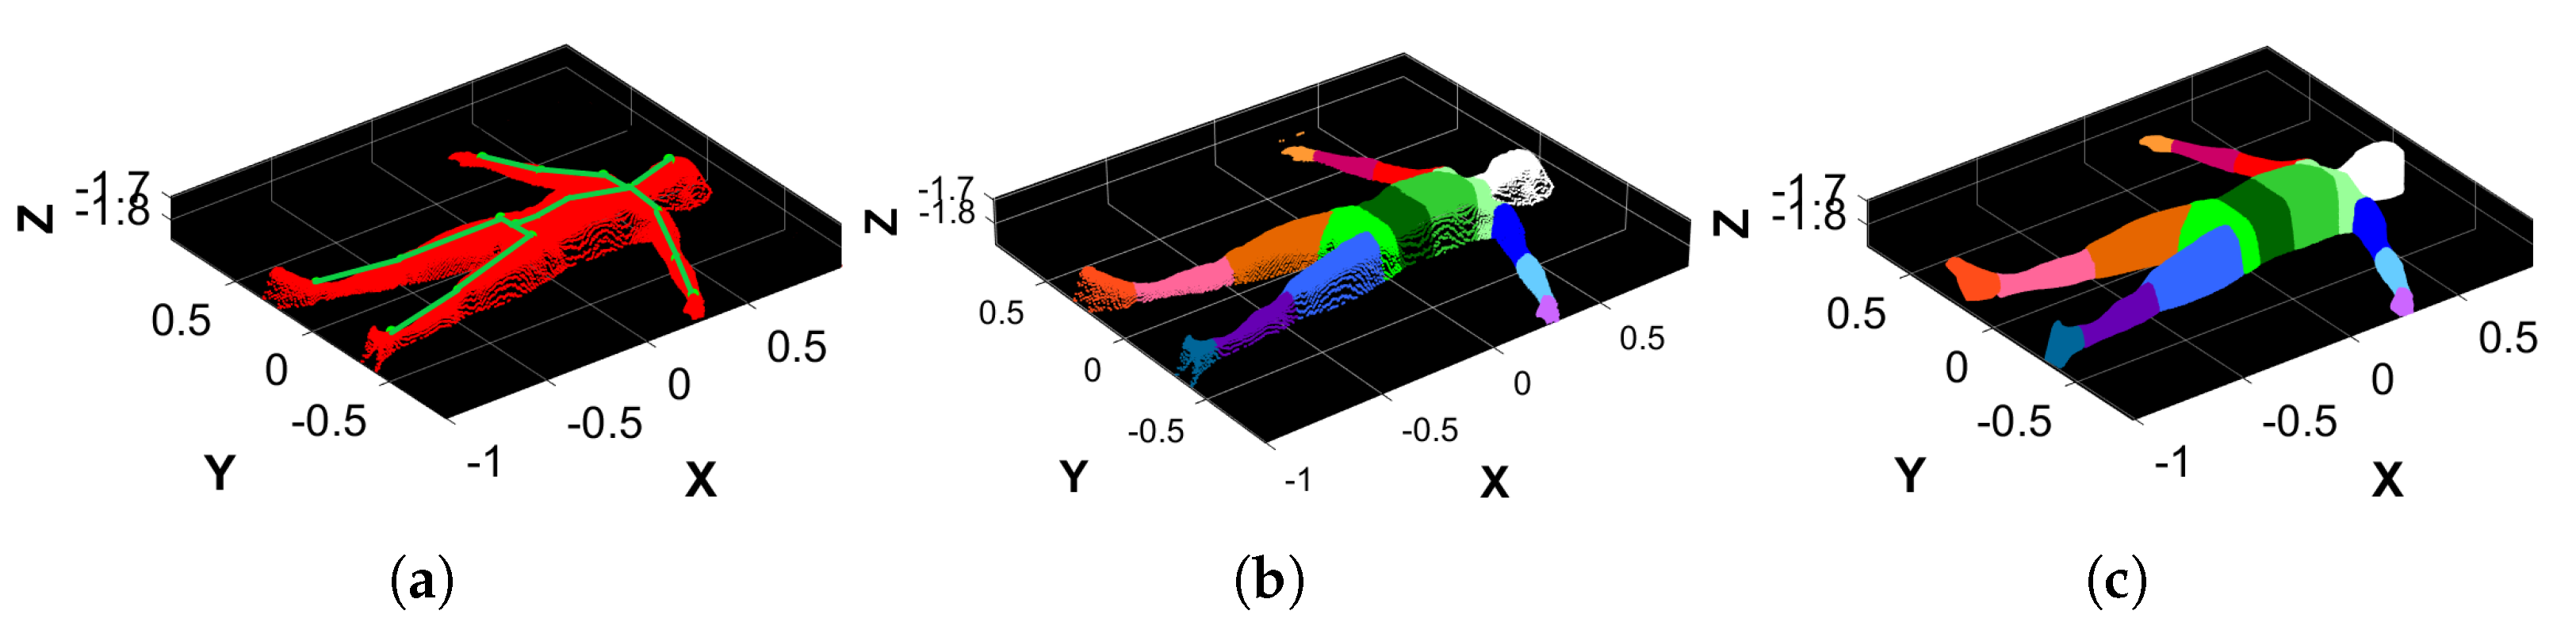
2.4. Body Skeleton Estimation
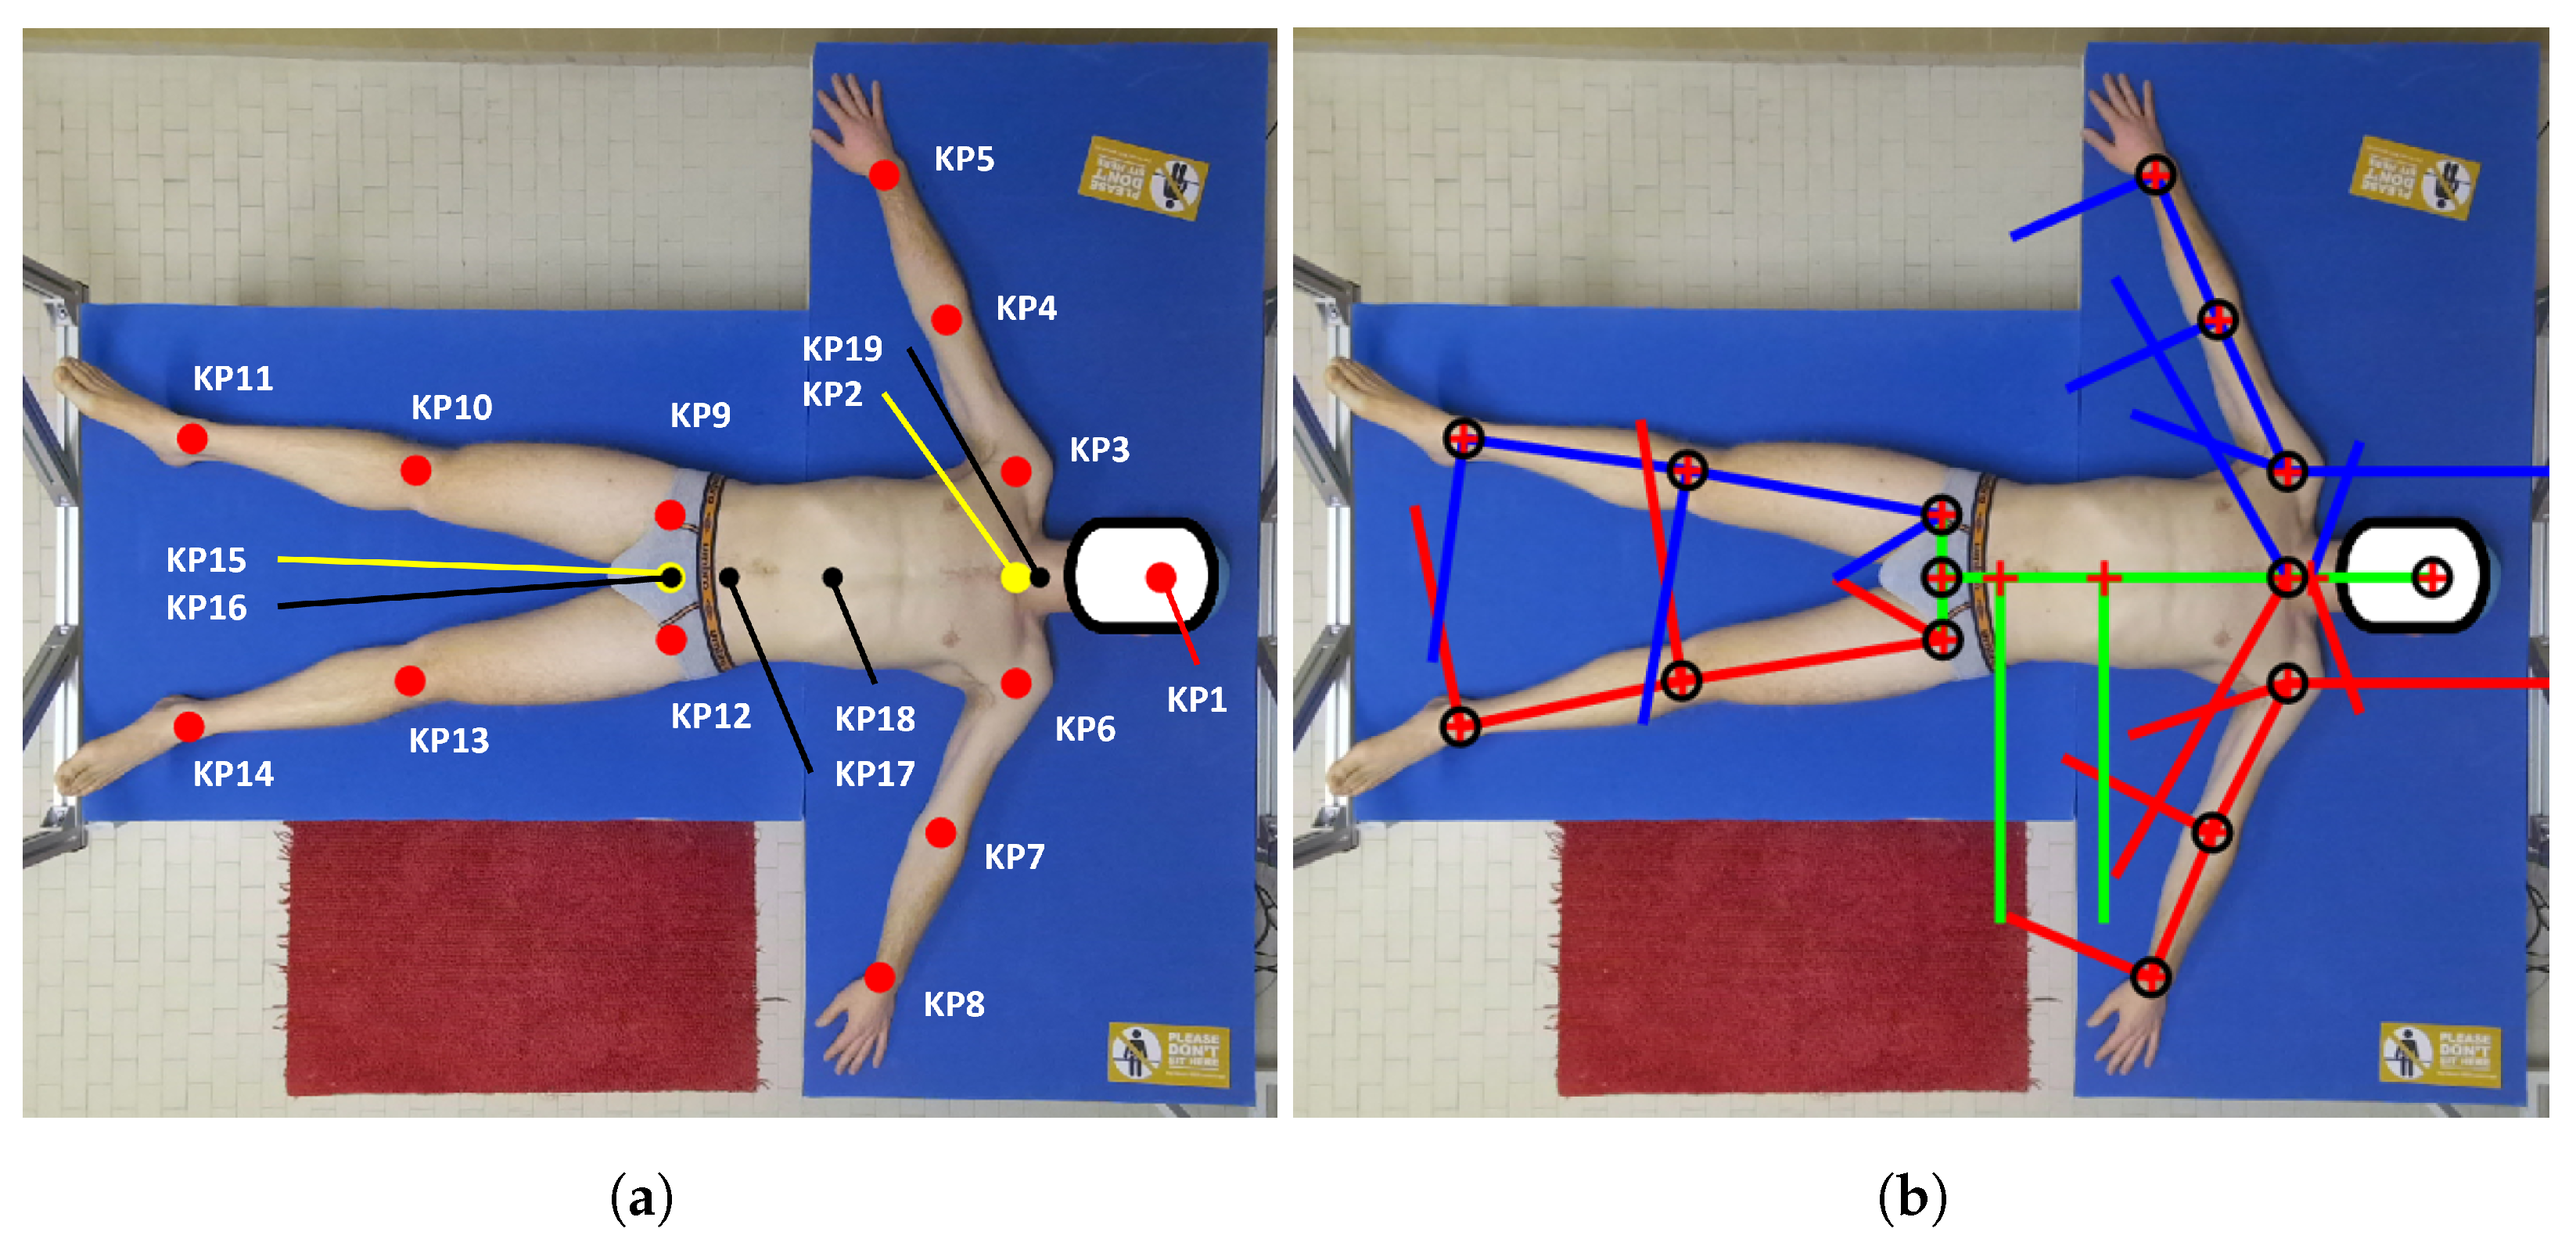
2.5. Biomechanical Model
- 1.
- 2.
- A vector is computed by joining KP2 and KP15.
- 3.
- The position of (KP19) is estimated starting from the neck joint (KP2) and moving upward a fraction of , which is estimated according to the angle between the suprasternal notch and the cervical joint center, as reported in [13]:
- 4.
- KP17 represents the midpoint between the anterior superior iliac spines, and it is computed using the normative proportion of the hip that was reported in [12] by moving KP15 (mid hip) upward by a fraction of the width of the hip :
- 5.
- The location of the last thoracic vertebra, (KP18), is computed as a point on the at a fraction of its length, as determined in [12]:
2.6. KP Coordinate Conversion
2.7. Point Cloud Filtering
2.7.1. Coarse Filtering
- 1.
- Calculate the minimum and maximum values , , , and along both X and Y coordinates.
- 2.
- Correct them by adding or subtracting the padding of known values to properly discard points belonging to the mechanical structure and keep those belonging to the bed’s area.
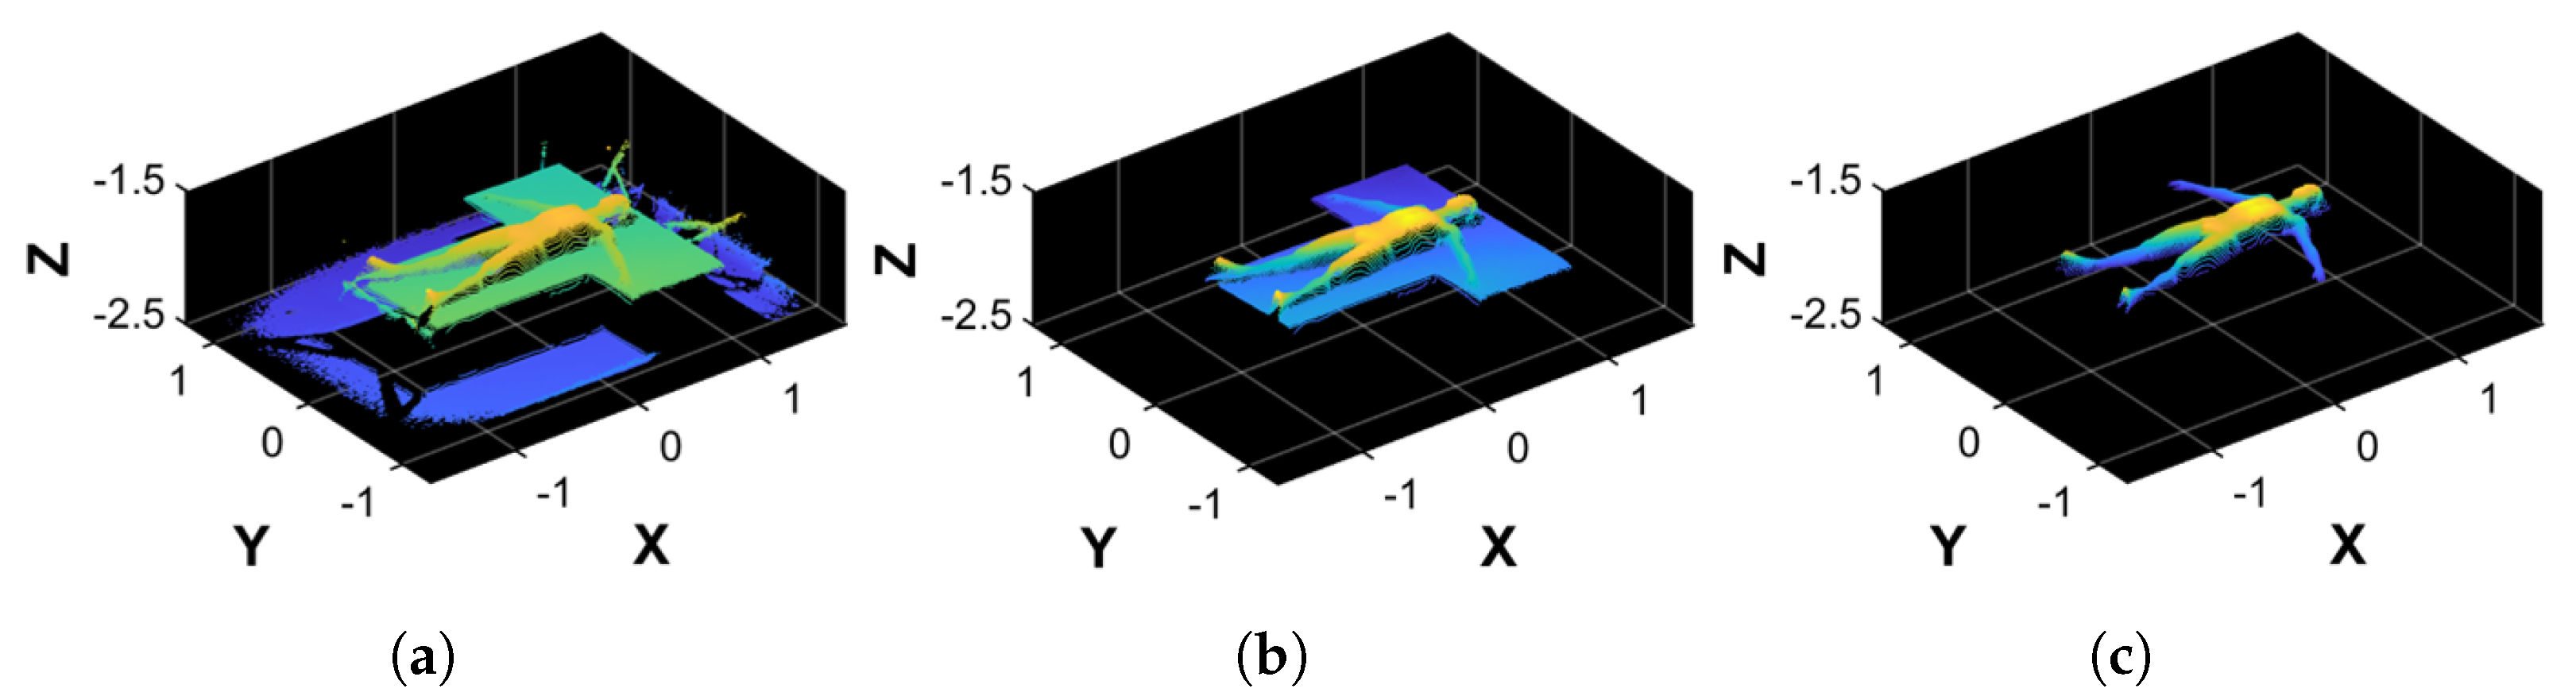
2.7.2. Fine Filtering
- 1.
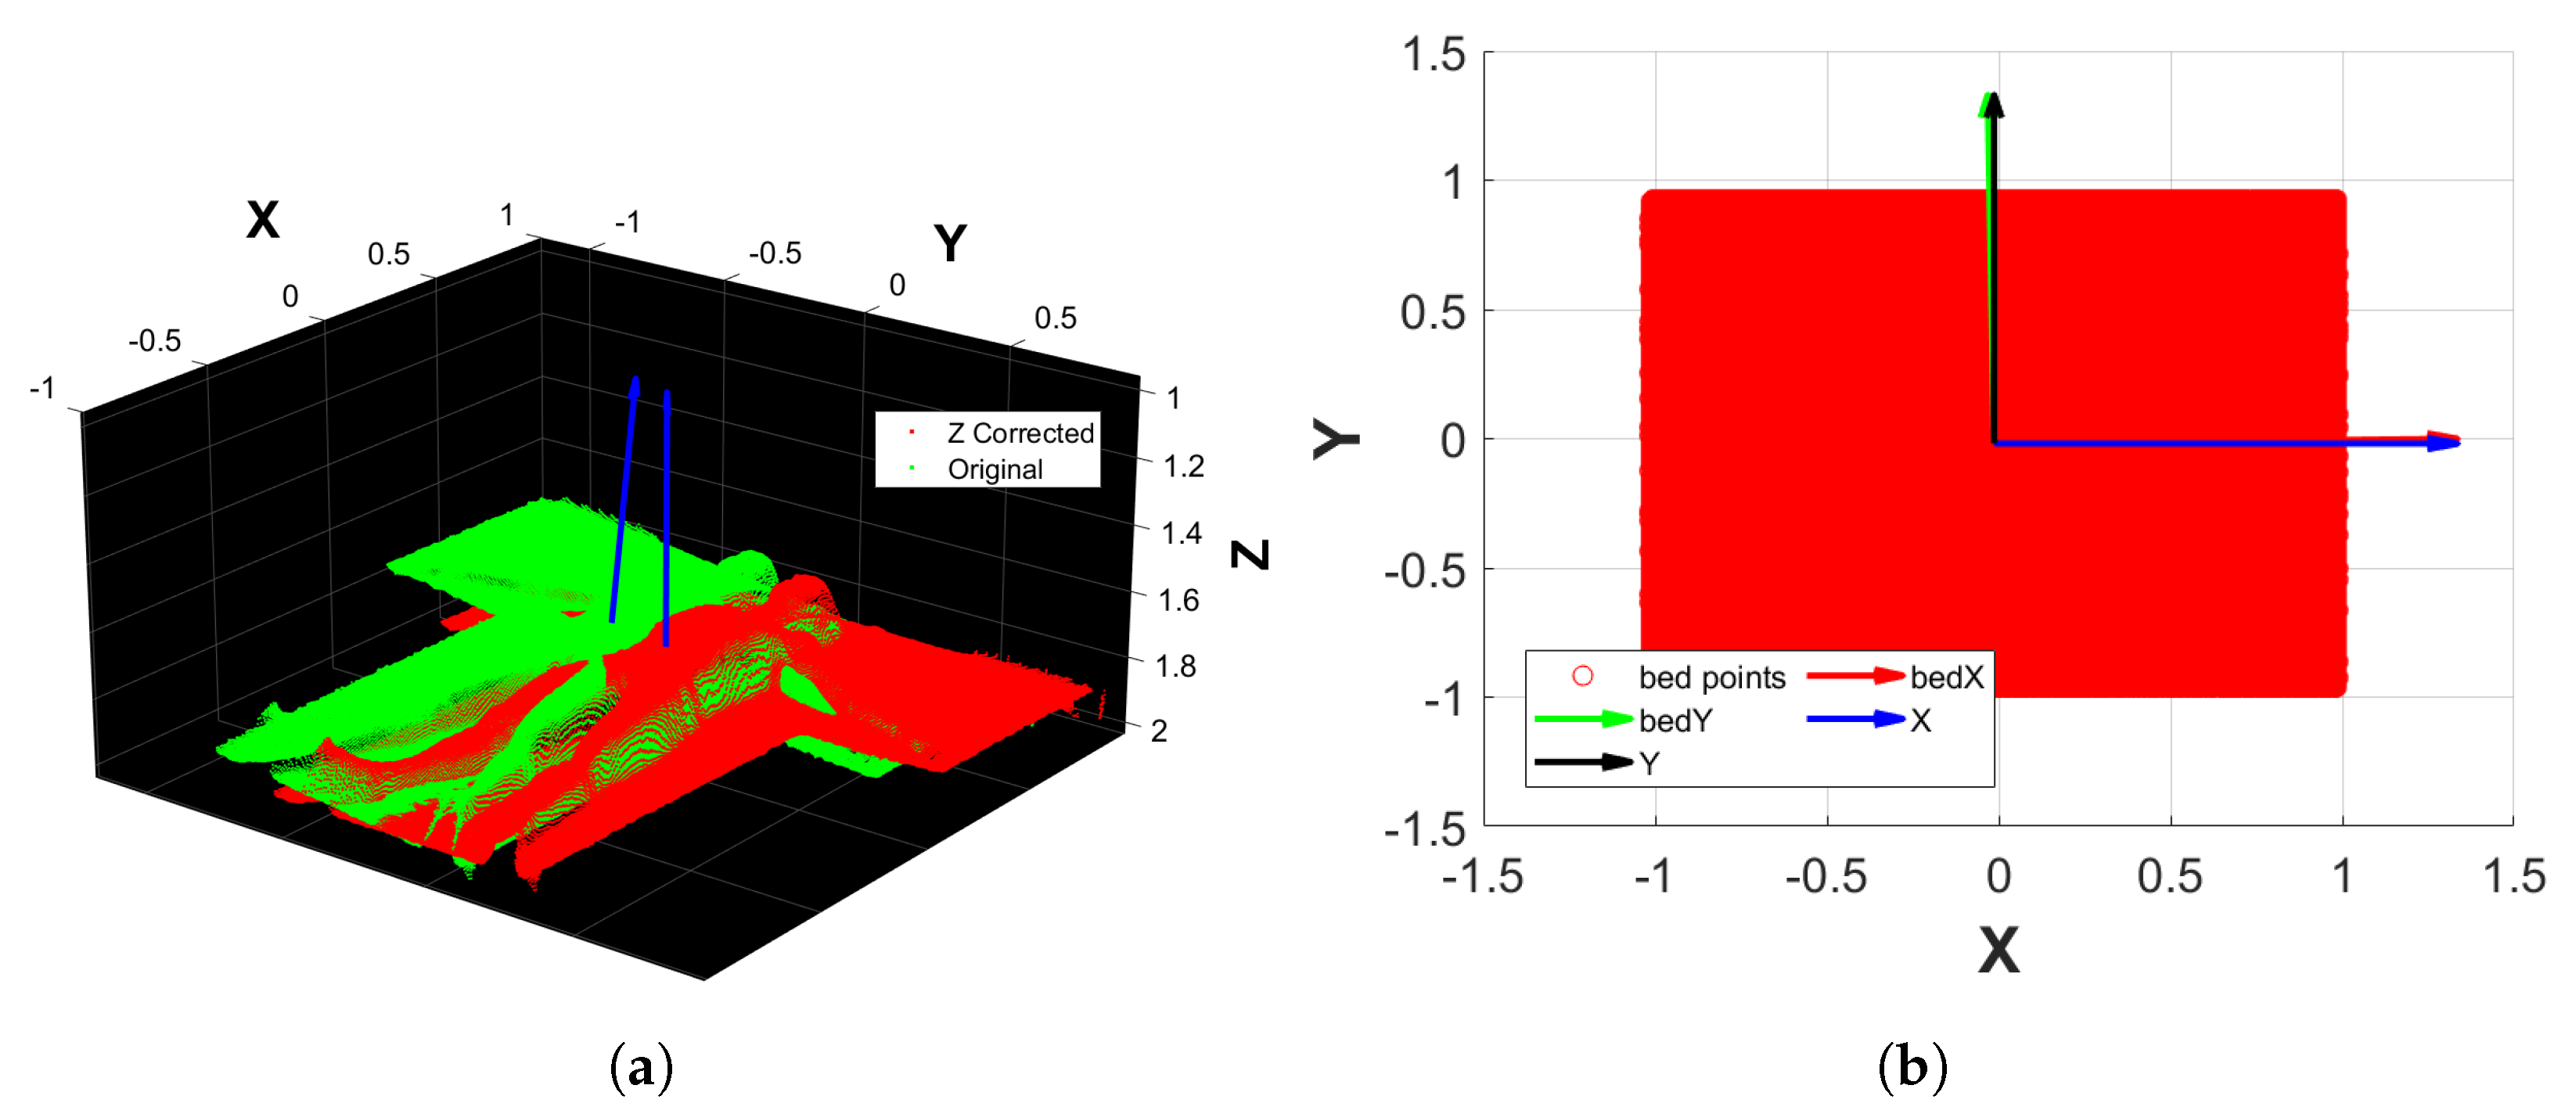
- Apply a plane fitting on to extract the bed’s plane normal, which is aligned to the upward direction of the Z reference axis. This results in a transformation matrix and a transformed point cloud (Figure 4a).
- 2.
- From the bed’s point cloud of , create a 2D rectangular region that inscribes the bed using its minimum and maximum values along X and Y. The rectangular region is then filled with Monte Carlo points.
- 3.
- Conduct a principal component analysis (PCA) on the rectangular region that approximates the bed, thus finding its orientation along the X and Y axes.
- 4.
- Align the rectangular region principal components to the reference axes X and Y. This results in the transformation matrix that, when applied to , outputs (Figure 4b).
- 5.
- Perform another plane fitting on to find and remove the points belonging to the bed’s plane, thus obtaining only the points of the subject’s body.
- 6.
- The resulting point cloud is then filtered by applying an outlier removal procedure based on RANSAC, which is followed by a denoising step. The final point cloud obtained is (Figure 3c).
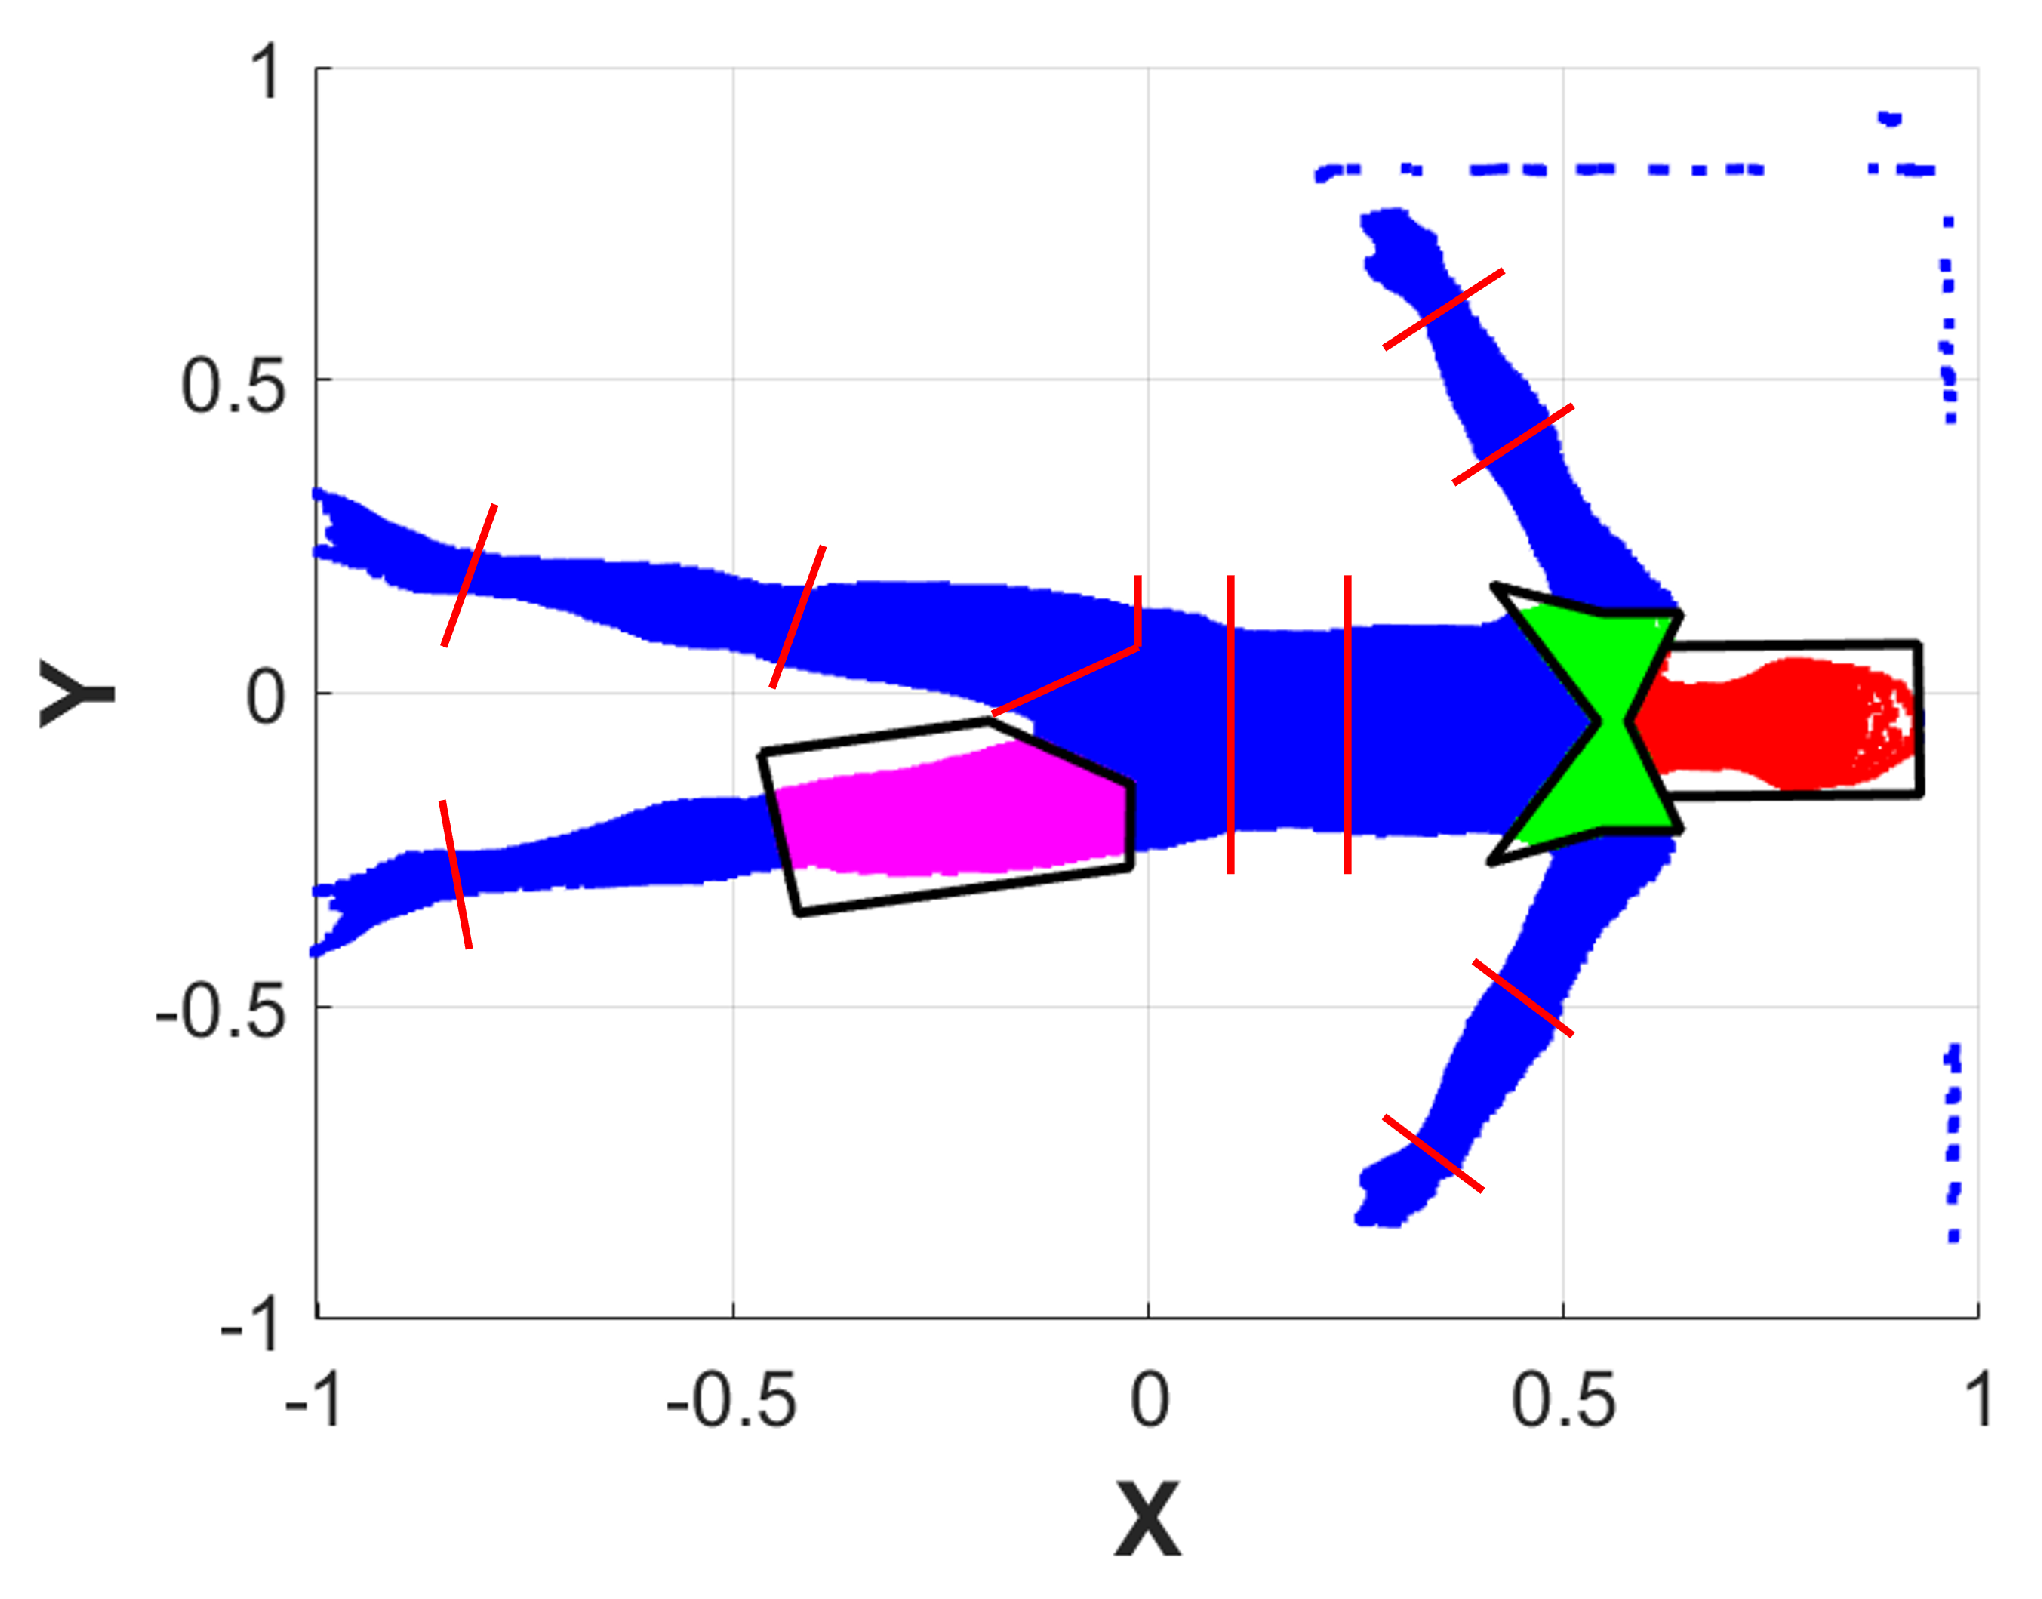
2.8. Body Segment Separation
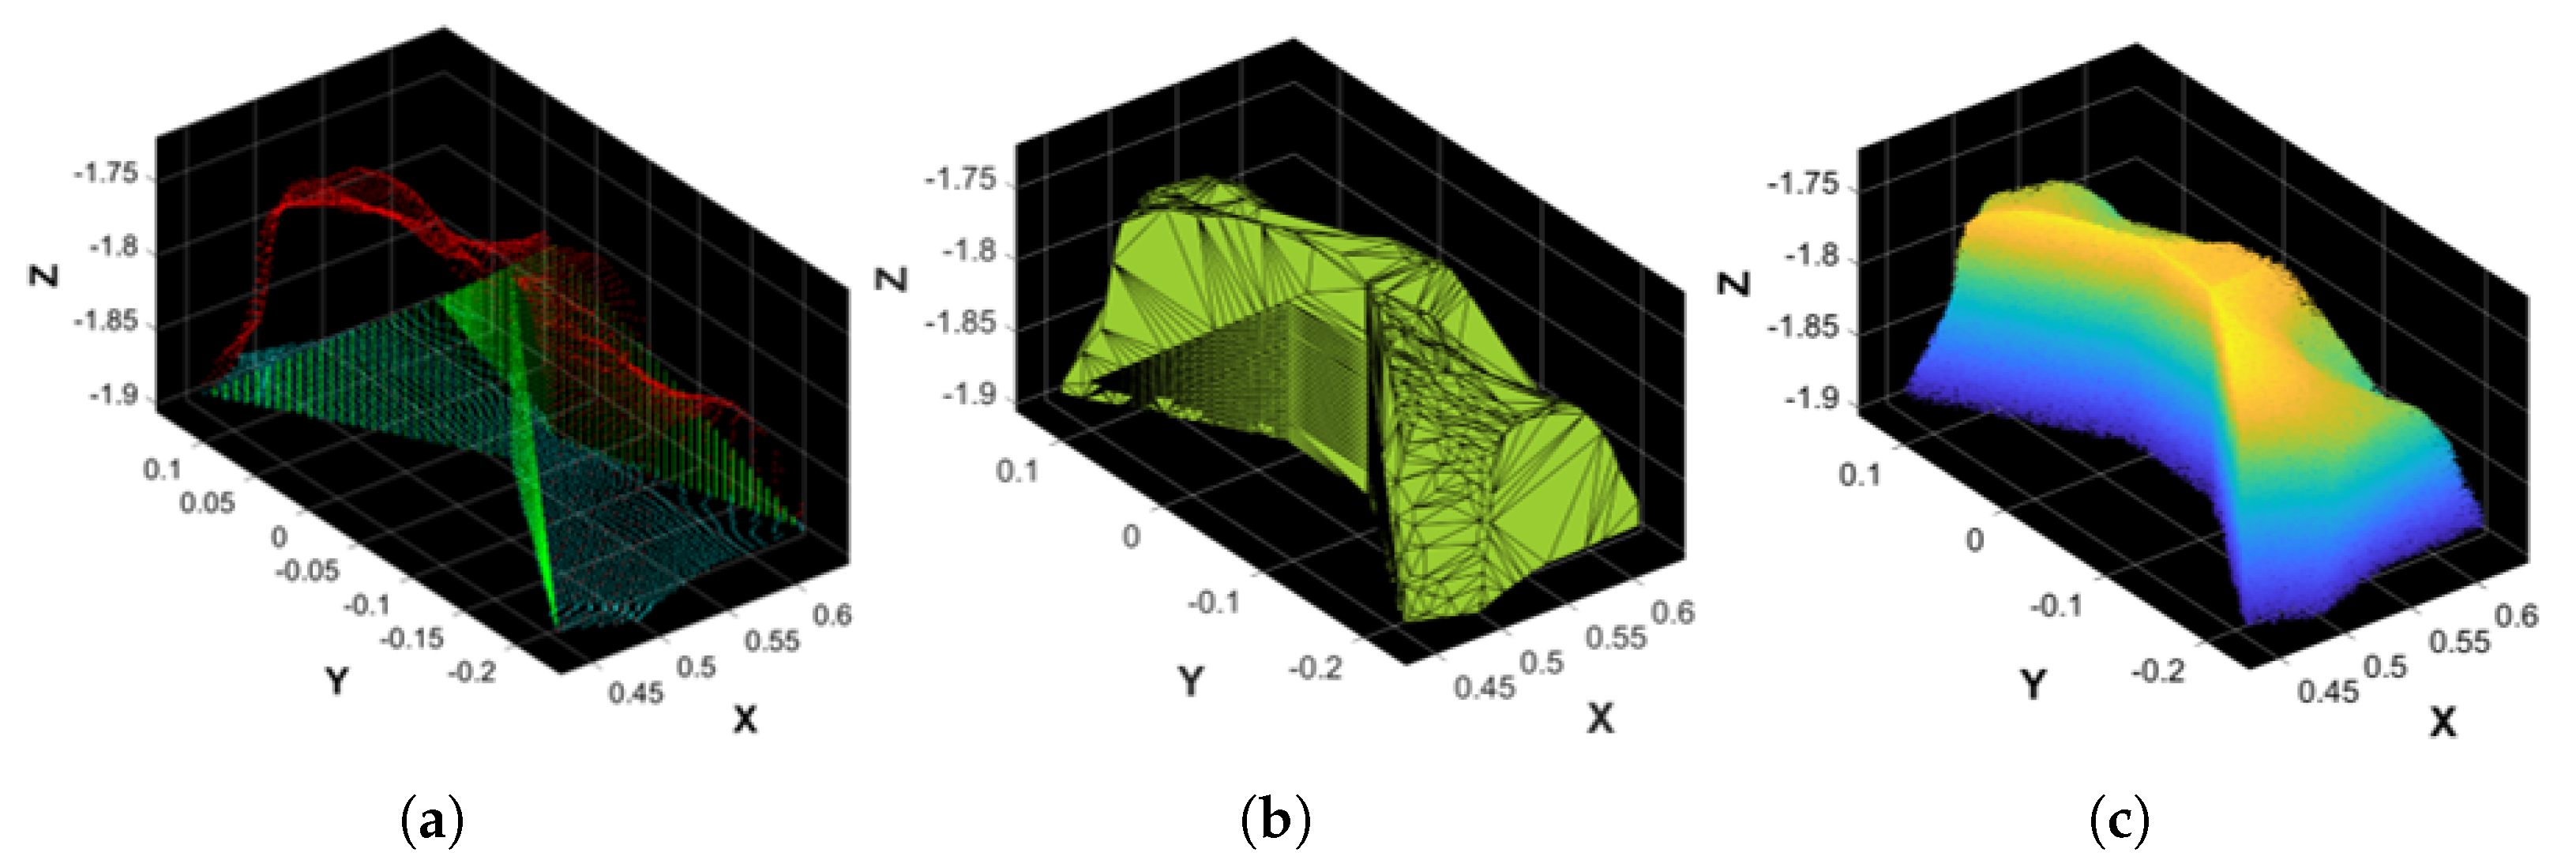
2.9. Body Segment Point Cloud Filling
2.10. Volume and Mass Computation
3. Results and Discussion
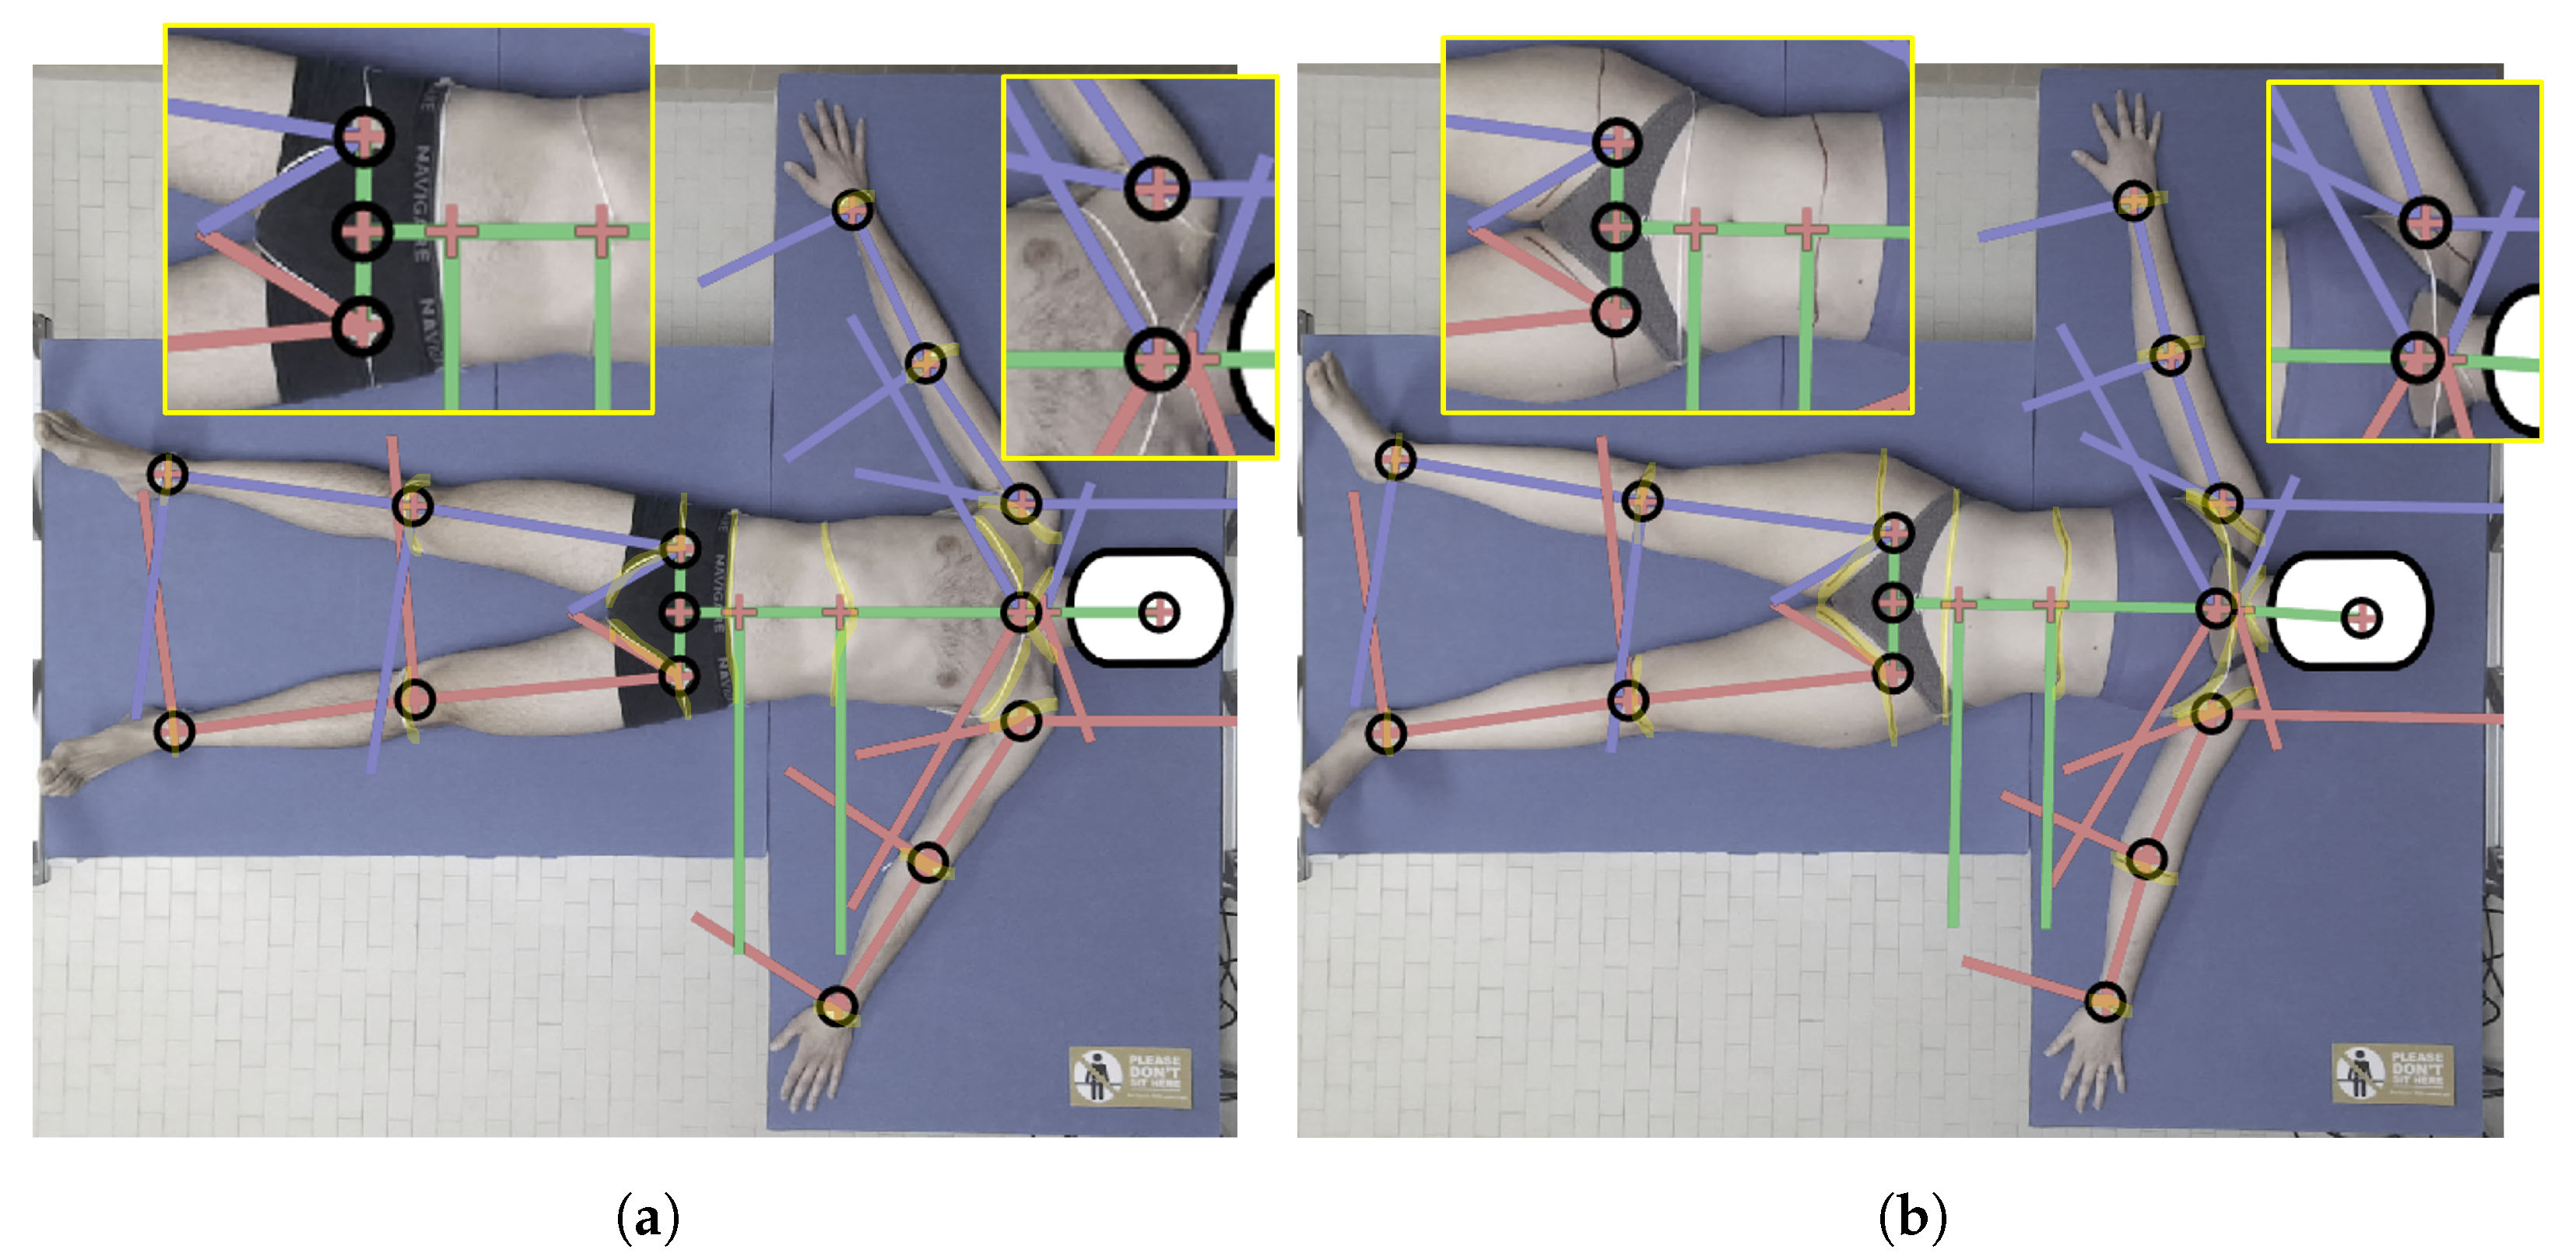
3.1. Biomechanical Model Robustness
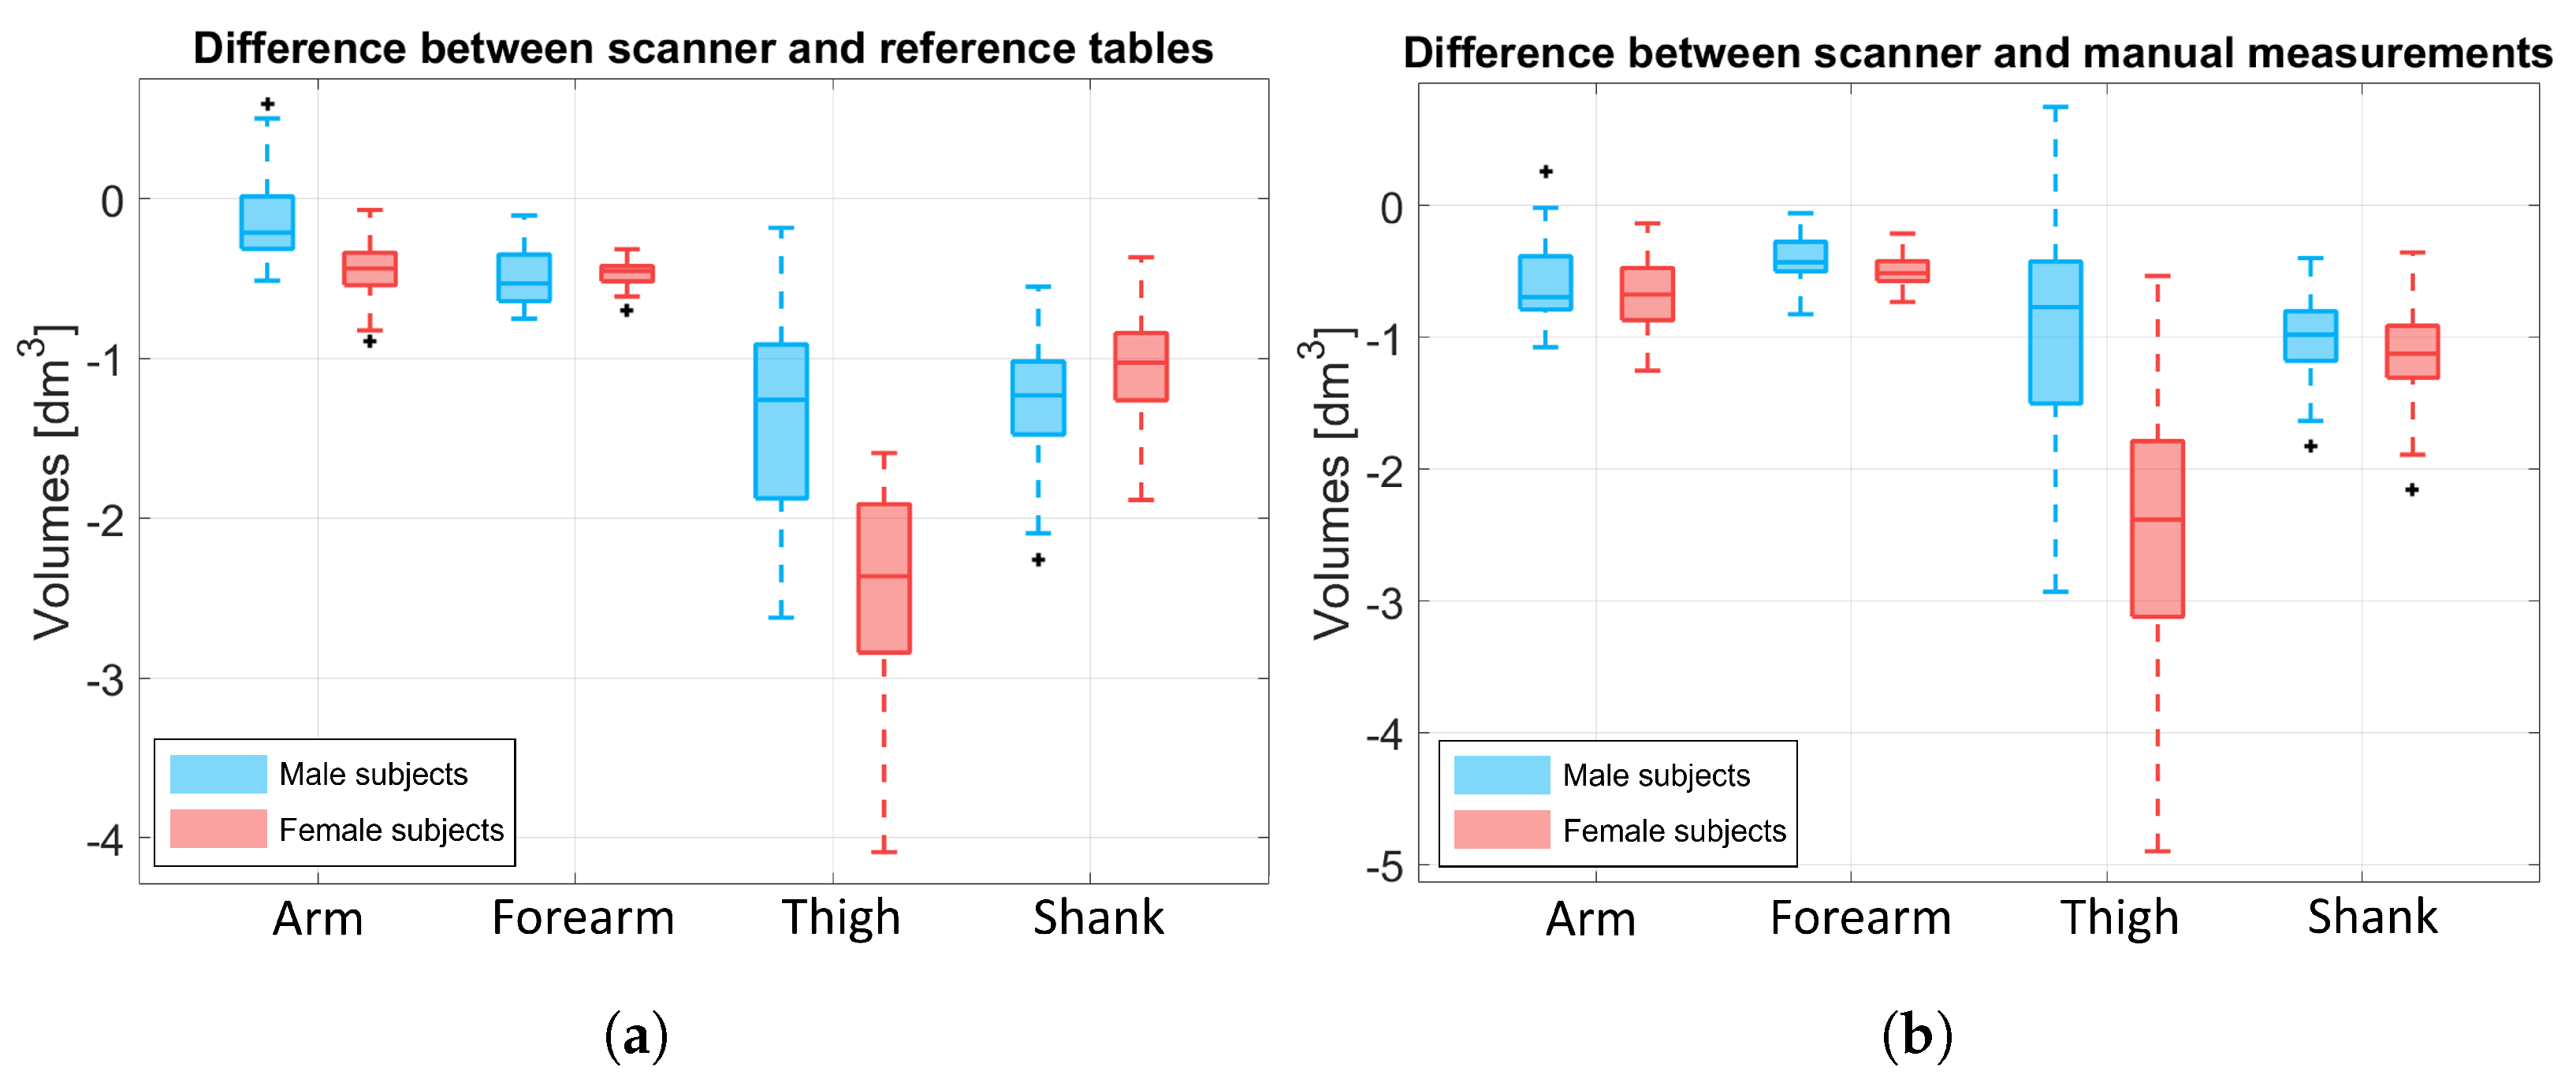
3.2. Output Volume
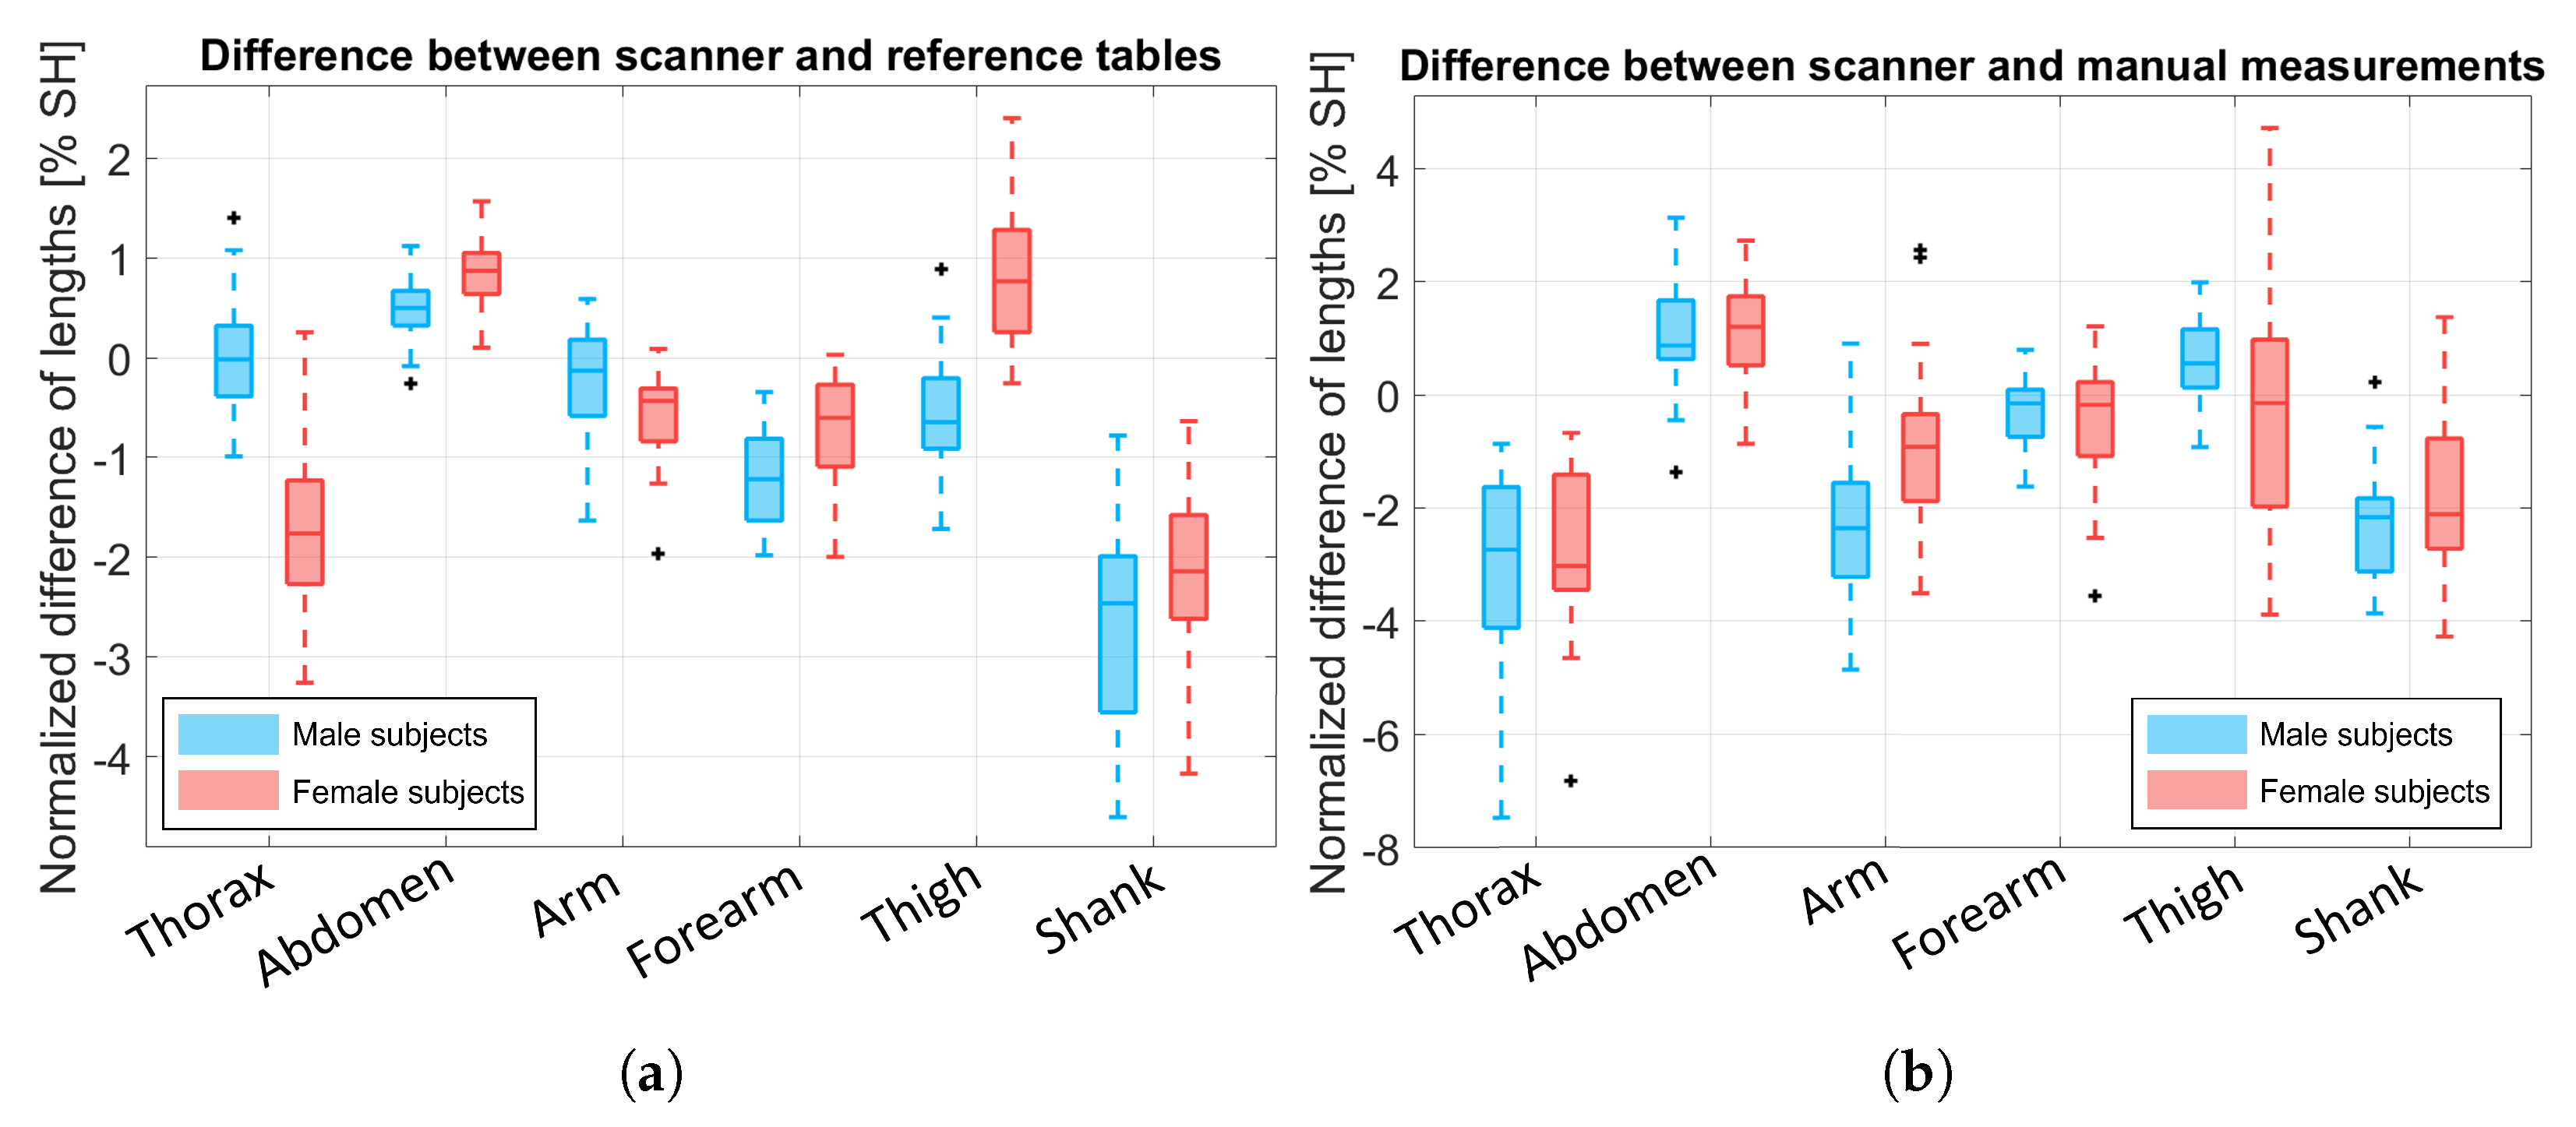
3.3. Comparison of the Body Segment Lengths
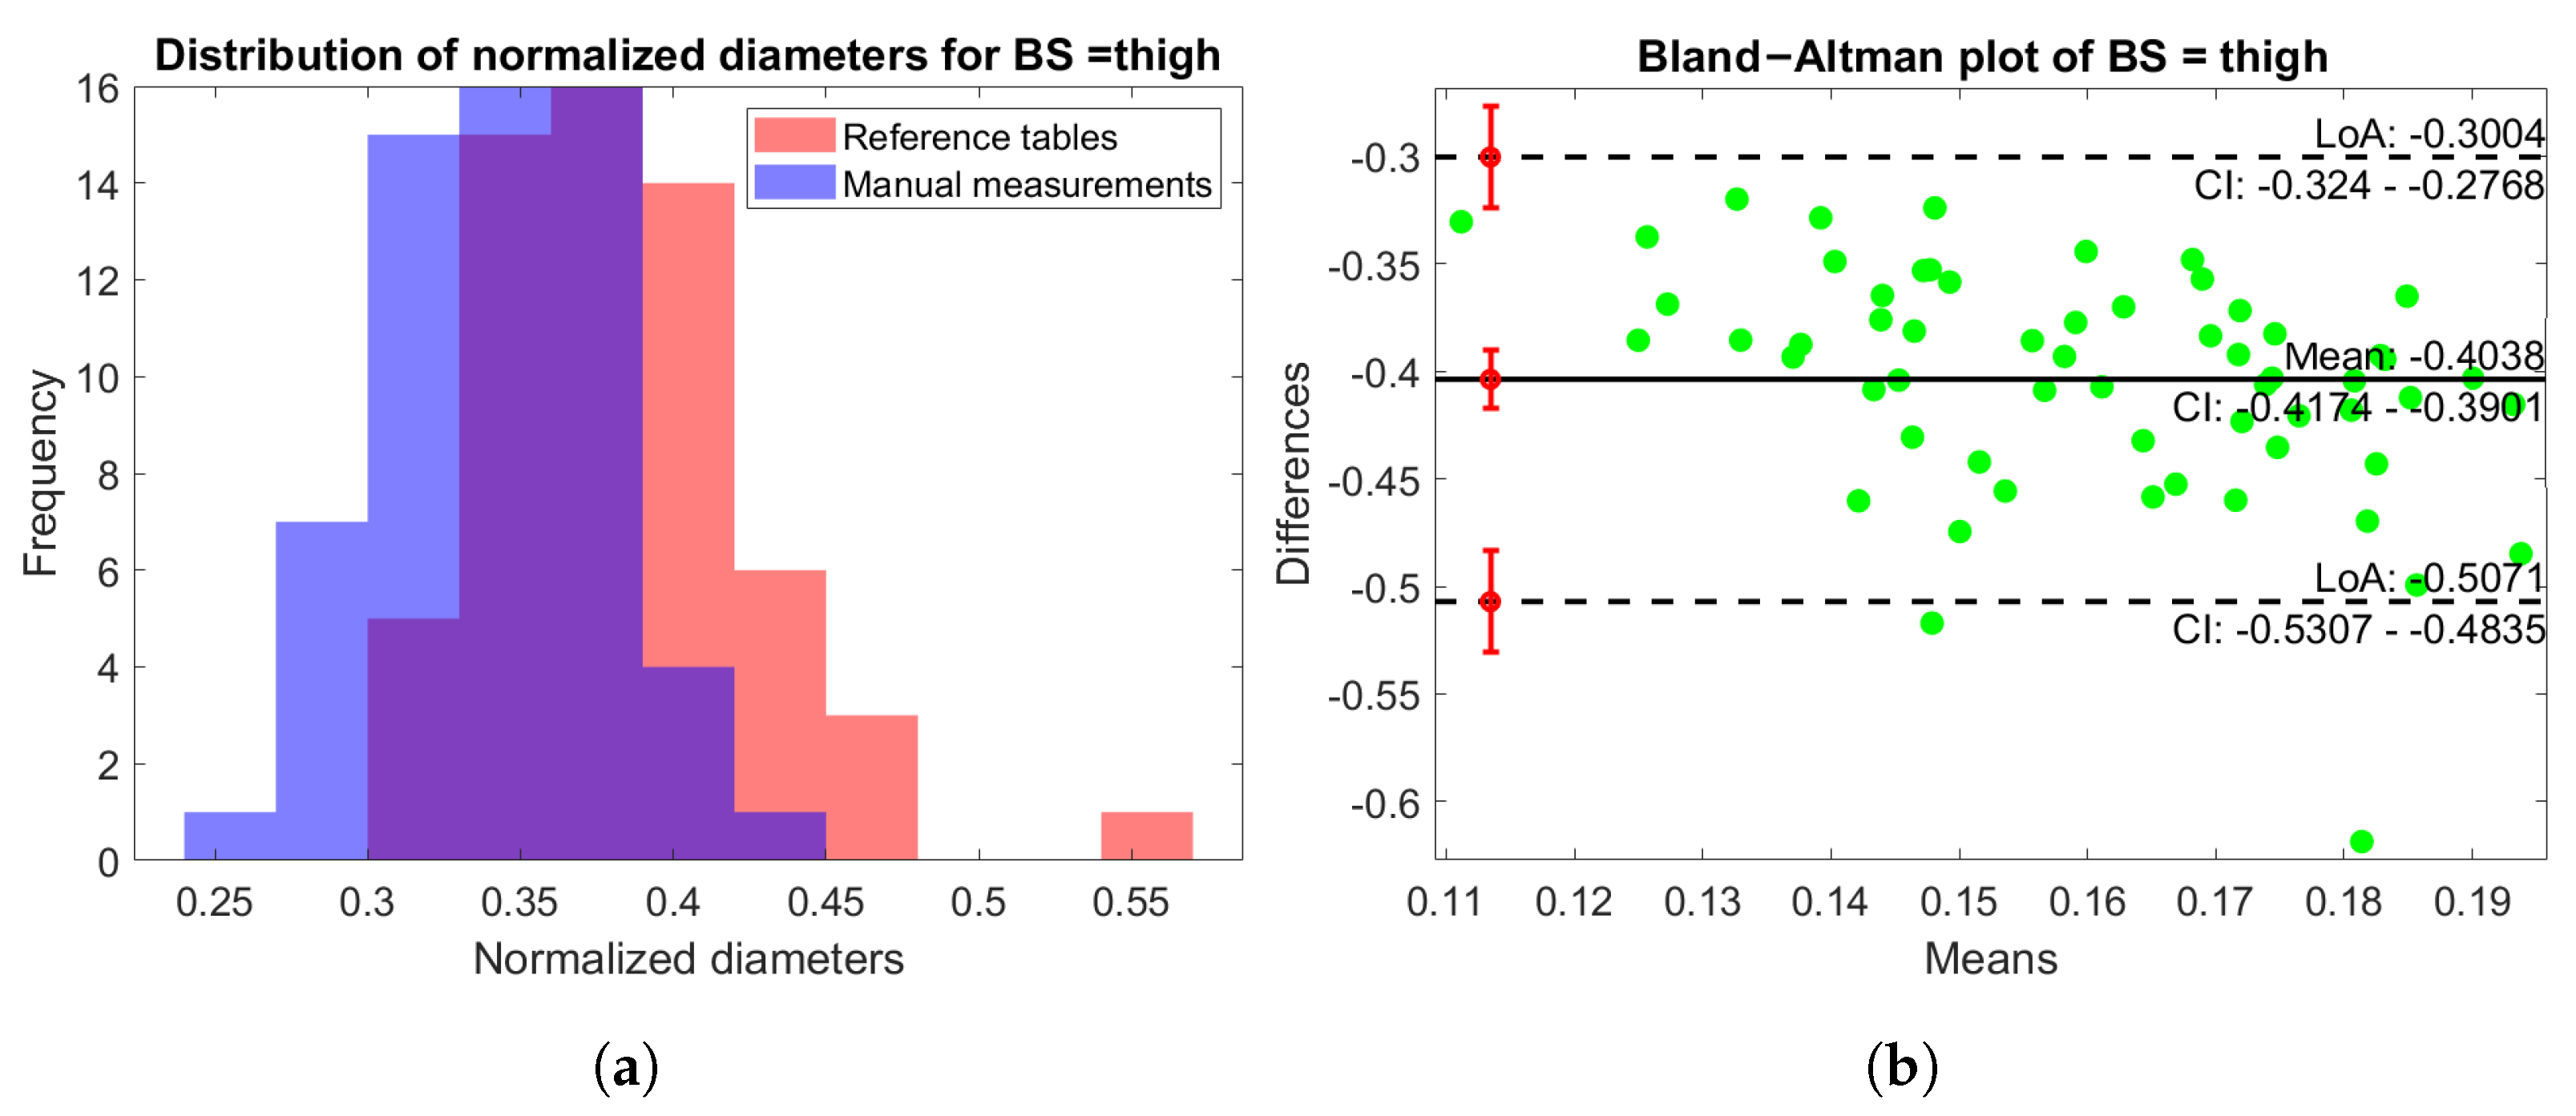
3.4. Analysis of the Equivalent Diameters
4. Conclusions
Author Contributions
Funding
Institutional Review Board Statement
Informed Consent Statement
Data Availability Statement
Conflicts of Interest
References
- Thelen, D.; Anderson, F. Using computed muscle control to generate forward dynamic simulations of human walking from experimental data. J. Biomech. 2006, 39, 1107–1115. [Google Scholar] [CrossRef]
- Rao, G.; Amarantini, D.; Berton, E.; Favier, D. Influence of body segments’ parameters estimation models on inverse dynamics solutions during gait. J. Biomech. 2006, 39, 1531–1536. [Google Scholar] [CrossRef]
- Dávila, P.; Carrera, E.; Jara, O.; Bassantes, H. Design of a Low Cost 3D Scanner for Taking Anthropometric Measurements. In Proceedings of the AHFE 2019: Advances in Usability and user Experience, Washington, DC, USA, 24–28 July 2019; pp. 971–978. [Google Scholar] [CrossRef]
- Clarkson, S.; Wheat, J.; Heller, B.; Choppin, S. Assessing the suitability of the Microsoft Kinect for calculating person specific body segment parameters. In Proceedings of the Computer Vision—ECCV 2014 Workshops, Zurich, Switzerland, 6–12 September 2014; pp. 372–385. [Google Scholar] [CrossRef]
- Cicirelli, G.; Impedovo, D.; Dentamaro, V.; Marani, R.; Pirlo, G.; D’Orazio, T.R. Human Gait Analysis in Neurodegenerative Diseases: A Review. IEEE J. Biomed. Health Inform. 2022, 26, 229–242. [Google Scholar] [CrossRef]
- Pfitzner, C.; May, S.; Nüchter, A. Body weight estimation for dose-finding and health monitoring of lying, standing and walking patients based on RGB-D data. Sensors 2018, 18, 1311. [Google Scholar] [CrossRef]
- Bartol, K.; Bojanić, D.; Petković, T.; Pribanic, T. A Review of Body Measurement Using 3D Scanning. IEEE Access 2021, 9, 67281–67301. [Google Scholar] [CrossRef]
- Kudzia, P.; Jackson, E.; Dumas, G. Estimating body segment parameters from three-dimensional human body scans. PLoS ONE 2022, 17, e0262296. [Google Scholar] [CrossRef]
- Damavandi, M.; Farahpour, N.; Allard, P. Determination of body segment masses and centers of mass using a force plate method in individuals of different morphology. Med. Eng. Phys. 2009, 31, 1187–1194. [Google Scholar] [CrossRef]
- Sukul, D.K.; Den Hoed, P.; Johannes, E.; Van Dolder, R.; Benda, E. Direct and indirect methods for the quantification of leg volume: Comparison between water displacement volumetry, the disk model method and the frustum sign model method, using the correlation coefficient and the limits of agreement. J. Biomed. Eng. 1993, 15, 477–480. [Google Scholar] [CrossRef] [PubMed]
- Pheasant, S.; Haslegrave, C.M. Bodyspace: Anthropometry, Ergonomics and the Design of Work; CRC Press: Boca Raton, FL, USA, 2006. [Google Scholar] [CrossRef]
- Dumas, R.; Chèze, L.; Verriest, J.P. Adjustments to McConville et al. and Young et al. body segment inertial parameters. J. Biomech. 2007, 40, 543–553. [Google Scholar] [CrossRef]
- Winter, D.A. Anthropometry. In Biomechanics and Motor Control of Human Movement; John Wiley & Sons, Ltd.: Hoboken, NJ, USA, 2009; Chapter 4; pp. 82–106. [Google Scholar] [CrossRef]
- De Leva, P. Adjustments to Zatsiorsky-Seluyanov’s segment inertia parameters. J. Biomech. 1996, 29, 1223–1230. [Google Scholar] [CrossRef]
- Brolin, E. Anthropometric Diversity and Consideration of Human Capabilities: Methods for Virtual Product and Production Development. Ph.D. Thesis, Chalmers University of Technology, Göteborg, Sweden, 2016. [Google Scholar]
- Durkin, J.L.; Dowling, J.J. Analysis of body segment parameter differences between four human populations and the estimation errors of four popular mathematical models. J. Biomech. Eng. 2003, 125, 515–522. [Google Scholar] [CrossRef]
- Eriks-Hoogland, I.; Hilfiker, R.; Baumberger, M.; Balk, S.; Stucki, G.; Perret, C. Clinical assessment of obesity in persons with spinal cord injury: Validity of waist circumference, body mass index, and anthropometric index. J. Spinal Cord Med. 2011, 34, 416–422. [Google Scholar] [CrossRef] [PubMed]
- Tan, C.W.; Coutts, F.; Bulley, C. Measurement of lower limb volume: Agreement between the vertically oriented perometer and a tape measure method. Physiotherapy 2013, 99, 247–251. [Google Scholar] [CrossRef]
- Zaina, F.; Atanasio, S.; Negrini, S. Clinical evaluation of scoliosis during growth: Description and reliability. Stud. Health Technol. Inform. 2008, 135, 125–138. [Google Scholar] [PubMed]
- Škorvánková, D.; Riečický, A.; Madaras, M. Automatic Estimation of Anthropometric Human Body Measurements. arXiv 2021, arXiv:2112.11992. [Google Scholar]
- Sonar, V.G.; Jan, M.T.; Wells, M.; Pandya, A.; Engstrom, G.; Shih, R.; Furht, B. Estimating Body Volume and Height Using 3D Data. arXiv 2024, arXiv:2410.02800. [Google Scholar]
- Hu, P.; Dai, X.; Zhao, R.; Wang, H.; Ma, Y.; Munteanu, A. Point2PartVolume: Human Body Volume Estimation From a Single Depth Image. IEEE Trans. Instrum. Meas. 2023, 72, 1–12. [Google Scholar] [CrossRef]
- Crenna, F.; Rossi, G.B.; Berardengo, M. A Global Approach to Assessing Uncertainty in Biomechanical Inverse Dynamic Analysis: Mathematical Model and Experimental Validation. IEEE Trans. Instrum. Meas. 2021, 70, 1–9. [Google Scholar] [CrossRef]
- Eurobench Consortium. EUROBENCH Human Model. 2020. Available online: https://neuralrehabilitation.org/projects/EUROBENCH/ (accessed on 1 July 2022).
- Nuzzi, C.; Ghidelli, M.; Luchetti, A.; Zanetti, M.; Crenna, F.; Lancini, M. Body measurement estimations using 3D scanner for individuals with severe motor impairments. In Proceedings of the 2023 IEEE International Symposium on Medical Measurements and Applications (MeMeA), Jeju, Republic of Korea, 14–16 June 2023; pp. 1–6. [Google Scholar] [CrossRef]
- Pasinetti, S.; Nuzzi, C.; Luchetti, A.; Zanetti, M.; Lancini, M.; De Cecco, M. Experimental Procedure for the Metrological Characterization of Time-of-Flight Cameras for Human Body 3D Measurements. Sensors 2023, 23, 538. [Google Scholar] [CrossRef]
- Bazarevsky, V.; Grishchenko, I.; Raveendran, K.; Zhu, T.; Zhang, F.; Grundmann, M. BlazePose: On-device Real-time Body Pose tracking. arXiv 2020, arXiv:2006.10204. [Google Scholar]
- Yuthong, A.; Duangsoithong, R.; Booranawong, A.; Chetpattananondh, K. Monitoring of Volume of Air in Inhalation from Triflo Using Video Processing. IEEE Trans. Instrum. Meas. 2020, 69, 4334–4347. [Google Scholar] [CrossRef]
- Keenan, E.; Karmakar, C.; Brownfoot, F.C.; Palaniswami, M. Personalized Anatomic Modeling for Noninvasive Fetal ECG: Methodology and Applications. IEEE Trans. Instrum. Meas. 2021, 70, 1–12. [Google Scholar] [CrossRef]
- Xu, W.; Wang, Y.; Huang, W.; Duan, Y. An Efficient Nonlinear Mass-Spring Model for Anatomical Virtual Reality. IEEE Trans. Instrum. Meas. 2022, 71, 1–10. [Google Scholar] [CrossRef]
- Sanchez, B.; Aroul, A.L.P.; Bartolome, E.; Soundarapandian, K.; Bragós, R. Propagation of measurement errors through body composition equations for body impedance analysis. IEEE Trans. Instrum. Meas. 2014, 63, 1535–1544. [Google Scholar] [CrossRef]
- Ghidelli, M.; Nuzzi, C.; Crenna, F.; Lancini, M. Validation of Estimators for Weight-Bearing and Shoulder Joint Loads Using Instrumented Crutches. Sensors 2023, 23, 6213. [Google Scholar] [CrossRef]
- Pasinetti, S.; Nuzzi, C.; Covre, N.; Luchetti, A.; Maule, L.; Serpelloni, M.; Lancini, M. Validation of Marker-Less System for the Assessment of Upper Joints Reaction Forces in Exoskeleton Users. Sensors 2020, 20, 3899. [Google Scholar] [CrossRef]
- Sylvester, A.D.; Lautzenheiser, S.G.; Kramer, P.A. A review of musculoskeletal modelling of human locomotion. Interface Focus 2021, 11, 20200060. [Google Scholar] [CrossRef]
- Gray, D.S.; Crider, J.B.; Kelley, C.; Dickinson, L.C. Accuracy of recumbent height measurement. JPEN J. Parenter. Enter. Nutr. 1985, 9, 712–715. [Google Scholar] [CrossRef]
- Brodt, S.; Schulze, M.; Jacob, B.; Wassilew, G.; Nowack, D.; Rohe, S.; Matziolis, G. Validity of leg length measurement in the supine and standing position compared with pelvic survey X-ray after total hip arthroplasty. Arch. Orthop. Trauma Surg. 2024, 144, 433–438. [Google Scholar] [CrossRef]
- Jones, M.L.H.; Ebert, S.M.; Hu, J.; Park, B.K.; Reed, M.P. Quantifying body shape differences between supine and standing postures for adults with high body mass index. In Proceedings of the 4th International Digital Human Modeling Conference, Montreal, QC, Canada, 15–17 June 2016. [Google Scholar]
- D’Alvia, L.; Scalona, E.; Palermo, E.; Del Prete, Z.; Pittella, E.; Pisa, S.; Piuzzi, E. Tetrapolar Low-Cost Systems for Thoracic Impedance Plethysmography. In Proceedings of the 2018 IEEE International Symposium on Medical Measurements and Applications (MeMeA), Rome, Italy, 11–13 June 2018. [Google Scholar] [CrossRef]
- Zhang, Z. Microsoft Kinect Sensor and Its Effect. IEEE MultiMedia 2012, 19, 4–10. [Google Scholar] [CrossRef]
- Kulkarni, S.; Deshmukh, S.; Fernandes, F.; Patil, A.; Jabade, V. PoseAnalyser: A Survey on Human Pose Estimation. SN Comput. Sci. 2023, 4, 136. [Google Scholar] [CrossRef]
- Kunkel, M.E.; Herkommer, A.; Reinehr, M.; Böckers, T.M.; Wilke, H.J. Morphometric analysis of the relationships between intervertebral disc and vertebral body heights: An anatomical and radiographic study of the human thoracic spine. J. Anat. 2011, 219, 375–387. [Google Scholar] [CrossRef]
- Goshtasby, A.A. Image Registration: Principles, Tools and Methods; Springer: London, UK, 2012. [Google Scholar] [CrossRef]
- etiennedub. Pyk4a. 2020. Available online: https://github.com/etiennedub/pyk4a (accessed on 1 July 2022).
- Covre, N.; Luchetti, A.; Lancini, M.; Pasinetti, S.; Bertolazzi, E.; De Cecco, M. Monte Carlo-based 3D surface point cloud volume estimation by exploding local cubes faces. Acta IMEKO 2022, 11, 1–9. [Google Scholar] [CrossRef]
- Edelsbrunner, H. Alpha Shapes—A Survey. Tessellations in the Sciences: Virtues, Techniques and Applications of Geometric Tilings. 2011. Available online: https://research-explorer.ista.ac.at/download/3311/11408/2010_AlphaShapes.pdf (accessed on 10 February 2025).
- Li, Y.; Jiang, L.; Li, X.; Feng, W. Non-contact clothing anthropometry based on two-dimensional image contour detection and feature point recognition. Ind. Textila 2023, 74, 67–73. [Google Scholar] [CrossRef]
- Callegari, E.; Agnolucci, J.; Angiola, F.; Fais, P.; Giorgetti, A.; Giraudo, C.; Viel, G.; Cecchetto, G. The Precision, Inter-Rater Reliability, and Accuracy of a Handheld Scanner Equipped with a Light Detection and Ranging Sensor in Measuring Parts of the Body—A Preliminary Validation Study. Sensors 2024, 24, 500. [Google Scholar] [CrossRef]
- Ding, Z.; Tsang, C.K.; Nolte, D.; Kedgley, A.E.; Bull, A.M.J. Improving musculoskeletal model scaling using an anatomical atlas: The importance of gender and anthropometric similarity to quantify joint reaction forces. IEEE Trans. Biomed. Eng. 2019, 66, 3444–3456. [Google Scholar] [CrossRef]


| Body Segment | Length Measurements | Width Measurements | Circumferences |
|---|---|---|---|
| Head | Length taken from to the head tip. This measure was taken from the back of the body. | // | Circumference taken 1 cm higher than the ears. |
| Arm, forearm, leg, shank | Segment’s length, , taken in between the proximal and distal joints. | // | Circumferences taken in correspondence with the proximal and distal joints and . |
| Trunk | Length of the trunk, , taken from to . This measure was taken from the back of the body. | Distance between the shoulders, , taken in correspondence with the shoulder joints. | Circumference of the chest, , taken in correspondence of the nipples. |
| Width of the sternum taken considering the sternum’s sides, . | Circumference of the sternum, . | ||
| Abdomen | Length of the abdomen, , taken from to . This measure was taken from the back of the body. | Width in correspondence with , , and taken by considering the sides of the body. | Circumference of the abdomen, , taken in correspondence with . |
| Pelvis | // | Distance between the two asi, , taken in correspondence with the asis’ joints. | Circumference of the hips taken in correspondence with the asis, . |
| Width of the hips taken considering the sides of the body, corresponding to the asis position. | |||
| Width of the trochanters, , taken from the frontal position of the trochanter to the back. This is considered a “depth” measure. | |||
| Vertical distance from the asi to the trochanter, . | |||
| Hand | Length of the right hand, , taken from the medium finger tip to the wrist joint. | // | // |
| Width of the right hand, , taken considering when the fingers were close together, from the thumb joint to the other side. | |||
| Foot | Length of the right foot, , taken from the heel to the toes. | // | Circumference of the ankle, . |
| Width of the right foot, , taken from the big toe joint to the other side (maximum width). | |||
| Height of the heel taken from the ankle to the ground, . |
| Females | Males | |||
|---|---|---|---|---|
| Mean | Std | Mean | Std | |
| Age [years] | 28.5 | 6.5 | 26.6 | 4.1 |
| Mass [kg] | 61.1 | 7.4 | 74.1 | 10.7 |
| Height [cm] | 166.3 | 7.2 | 176.4 | 6.5 |
| BMI [kg/m2] | 22.1 | 2.8 | 23.7 | 2.5 |
Disclaimer/Publisher’s Note: The statements, opinions and data contained in all publications are solely those of the individual author(s) and contributor(s) and not of MDPI and/or the editor(s). MDPI and/or the editor(s) disclaim responsibility for any injury to people or property resulting from any ideas, methods, instructions or products referred to in the content. |
© 2025 by the authors. Licensee MDPI, Basel, Switzerland. This article is an open access article distributed under the terms and conditions of the Creative Commons Attribution (CC BY) license (https://creativecommons.org/licenses/by/4.0/).
Share and Cite
Nuzzi, C.; Ghidelli, M.; Luchetti, A.; Zanetti, M.; Crenna, F.; Lancini, M. Measurement of Human Body Segment Properties Using Low-Cost RGB-D Cameras. Sensors 2025, 25, 1515. https://doi.org/10.3390/s25051515
Nuzzi C, Ghidelli M, Luchetti A, Zanetti M, Crenna F, Lancini M. Measurement of Human Body Segment Properties Using Low-Cost RGB-D Cameras. Sensors. 2025; 25(5):1515. https://doi.org/10.3390/s25051515
Chicago/Turabian StyleNuzzi, Cristina, Marco Ghidelli, Alessandro Luchetti, Matteo Zanetti, Francesco Crenna, and Matteo Lancini. 2025. "Measurement of Human Body Segment Properties Using Low-Cost RGB-D Cameras" Sensors 25, no. 5: 1515. https://doi.org/10.3390/s25051515
APA StyleNuzzi, C., Ghidelli, M., Luchetti, A., Zanetti, M., Crenna, F., & Lancini, M. (2025). Measurement of Human Body Segment Properties Using Low-Cost RGB-D Cameras. Sensors, 25(5), 1515. https://doi.org/10.3390/s25051515