

Application of Chitosan@Fe3O4 Nanoparticle-Modified Screen-Printed Graphene-Based Electrode for Simultaneous Analysis of Nitrite and Ascorbic Acid in Hydroponics and Fruit Juice


Abstract
1. Introduction
2. Materials and Methods
2.1. Apparatus
2.2. Synthesis of Magnetite Nanoparticles and Coated Chitosan on Magnetite Nanoparticles
2.3. Preparation of CTS@Fe3O4 Nanoparticles Modified Screen-Printed Graphene-Based Electrode (CTS@Fe3O4/SPGNE)
2.4. Square-Wave Voltametric Method
2.5. Sample Preparation
3. Results and Discussion
3.1. Characterization
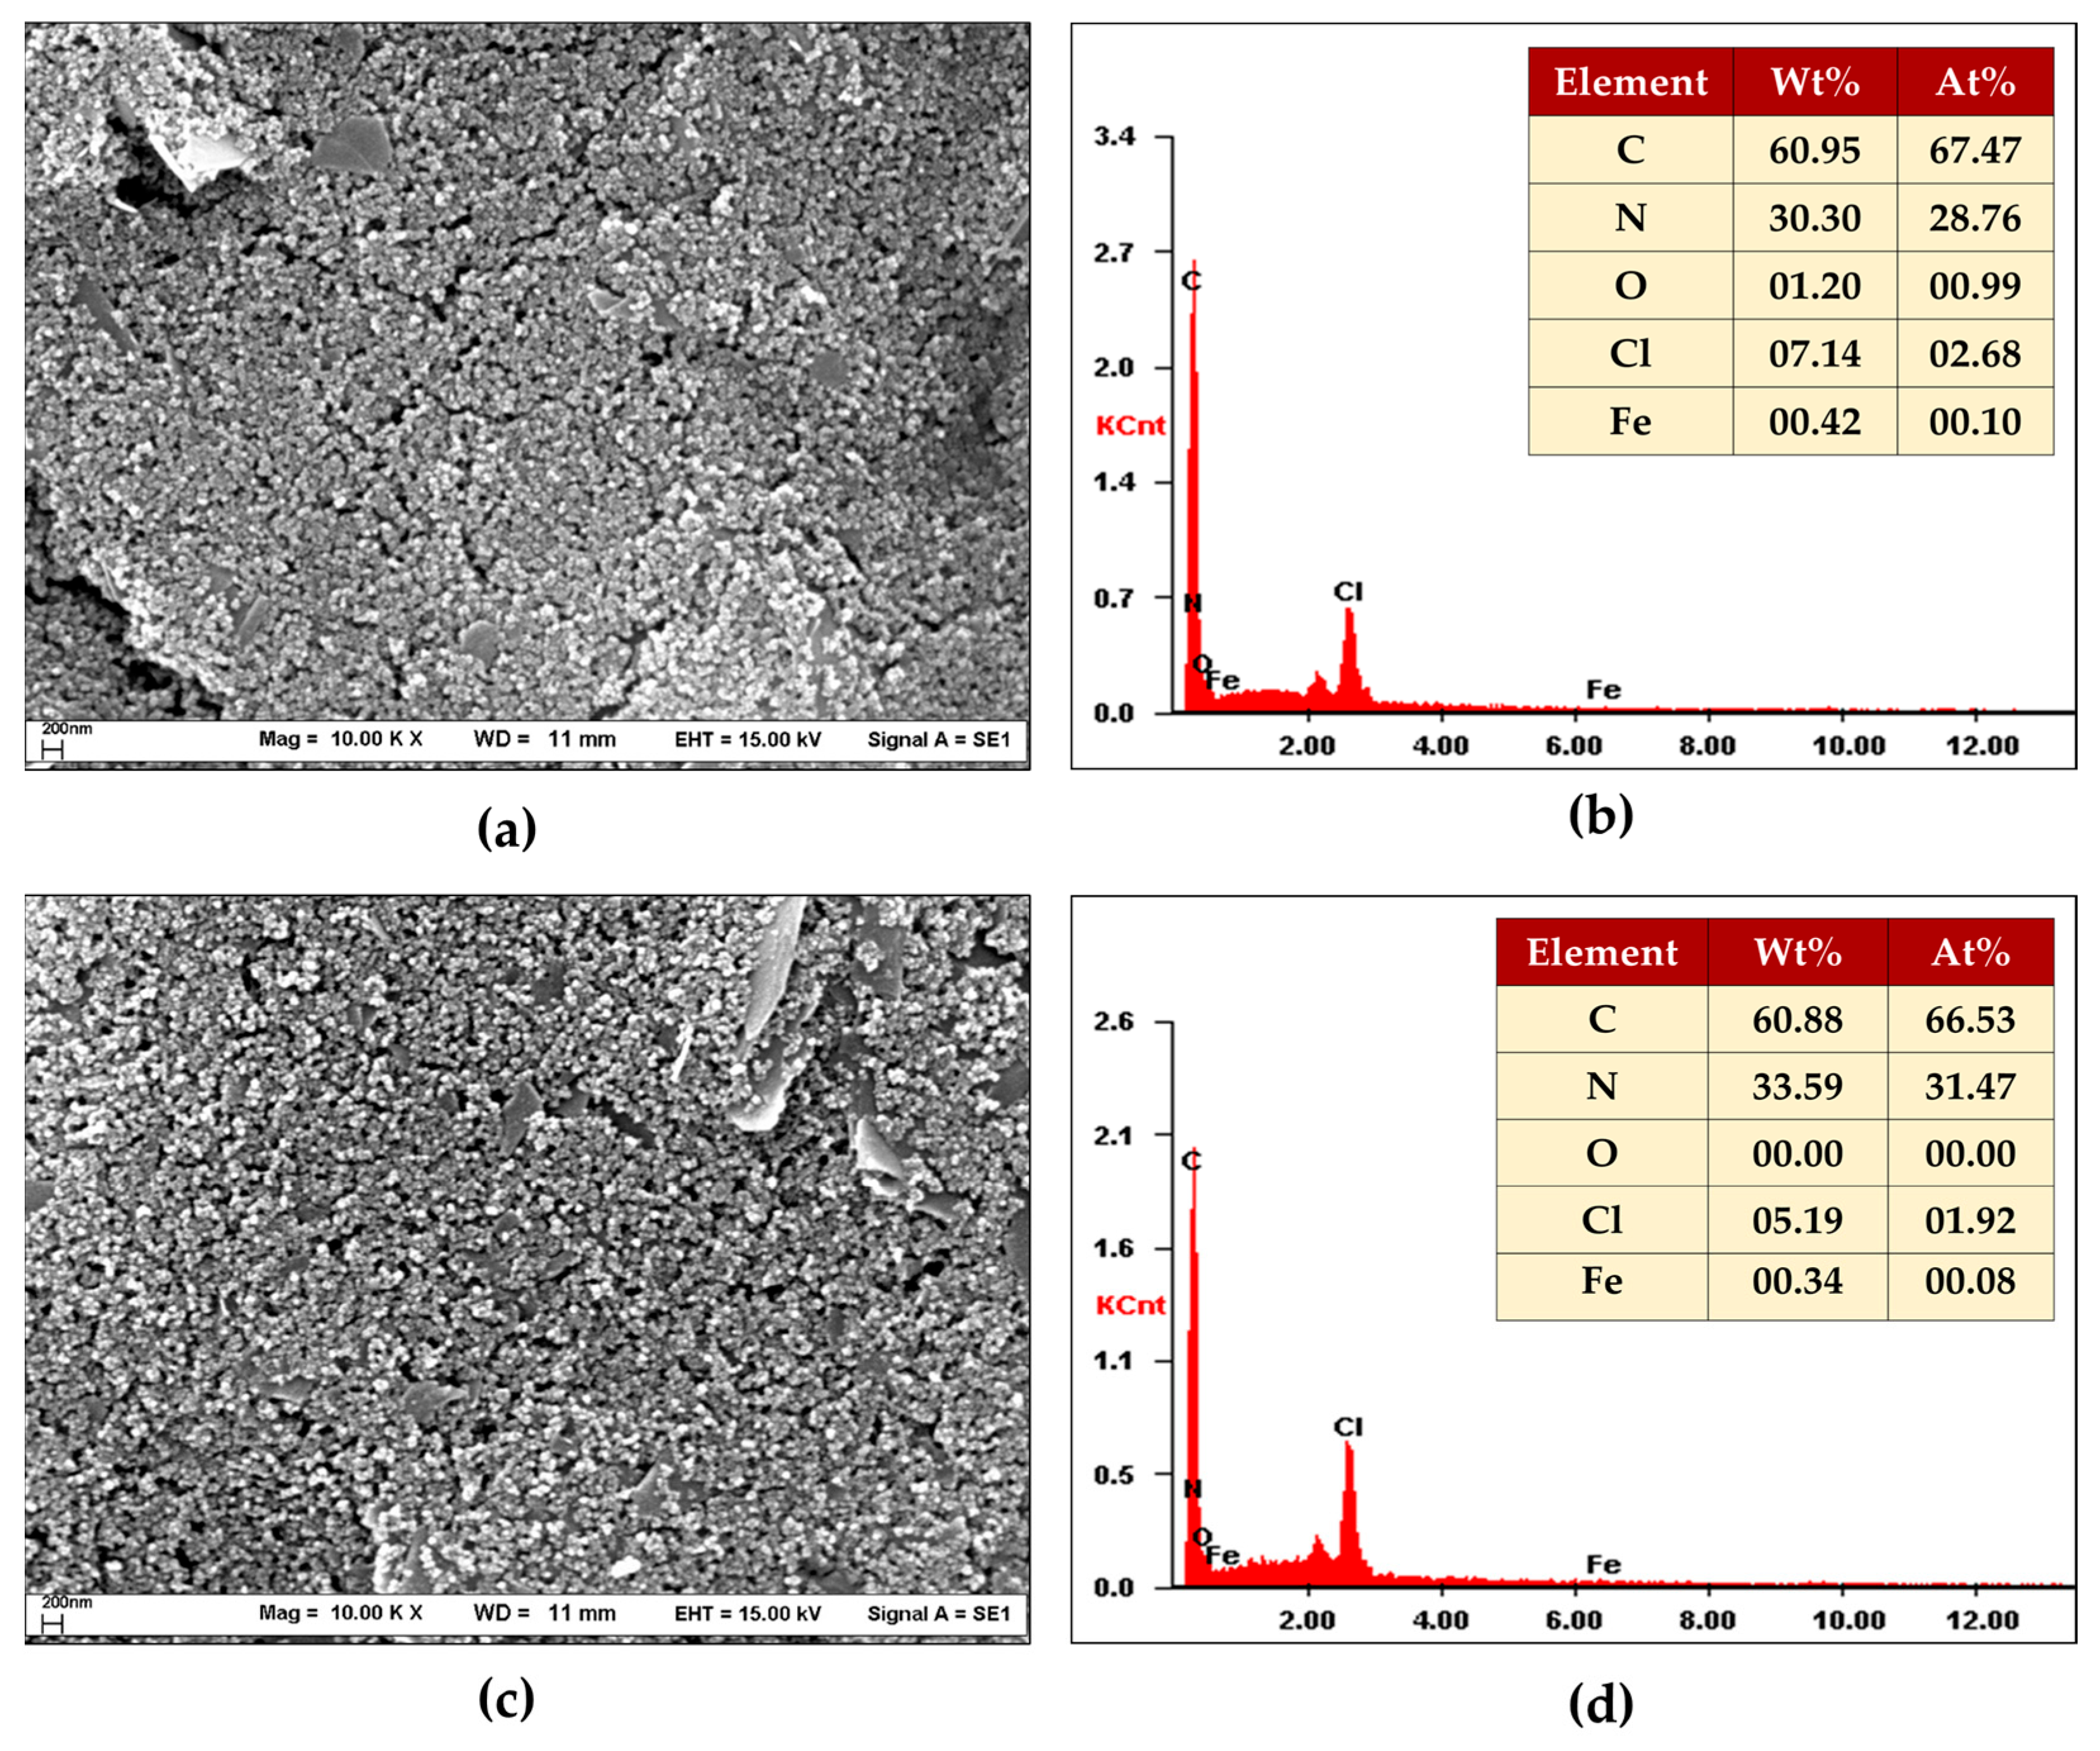
3.1.1. SEM/EDX
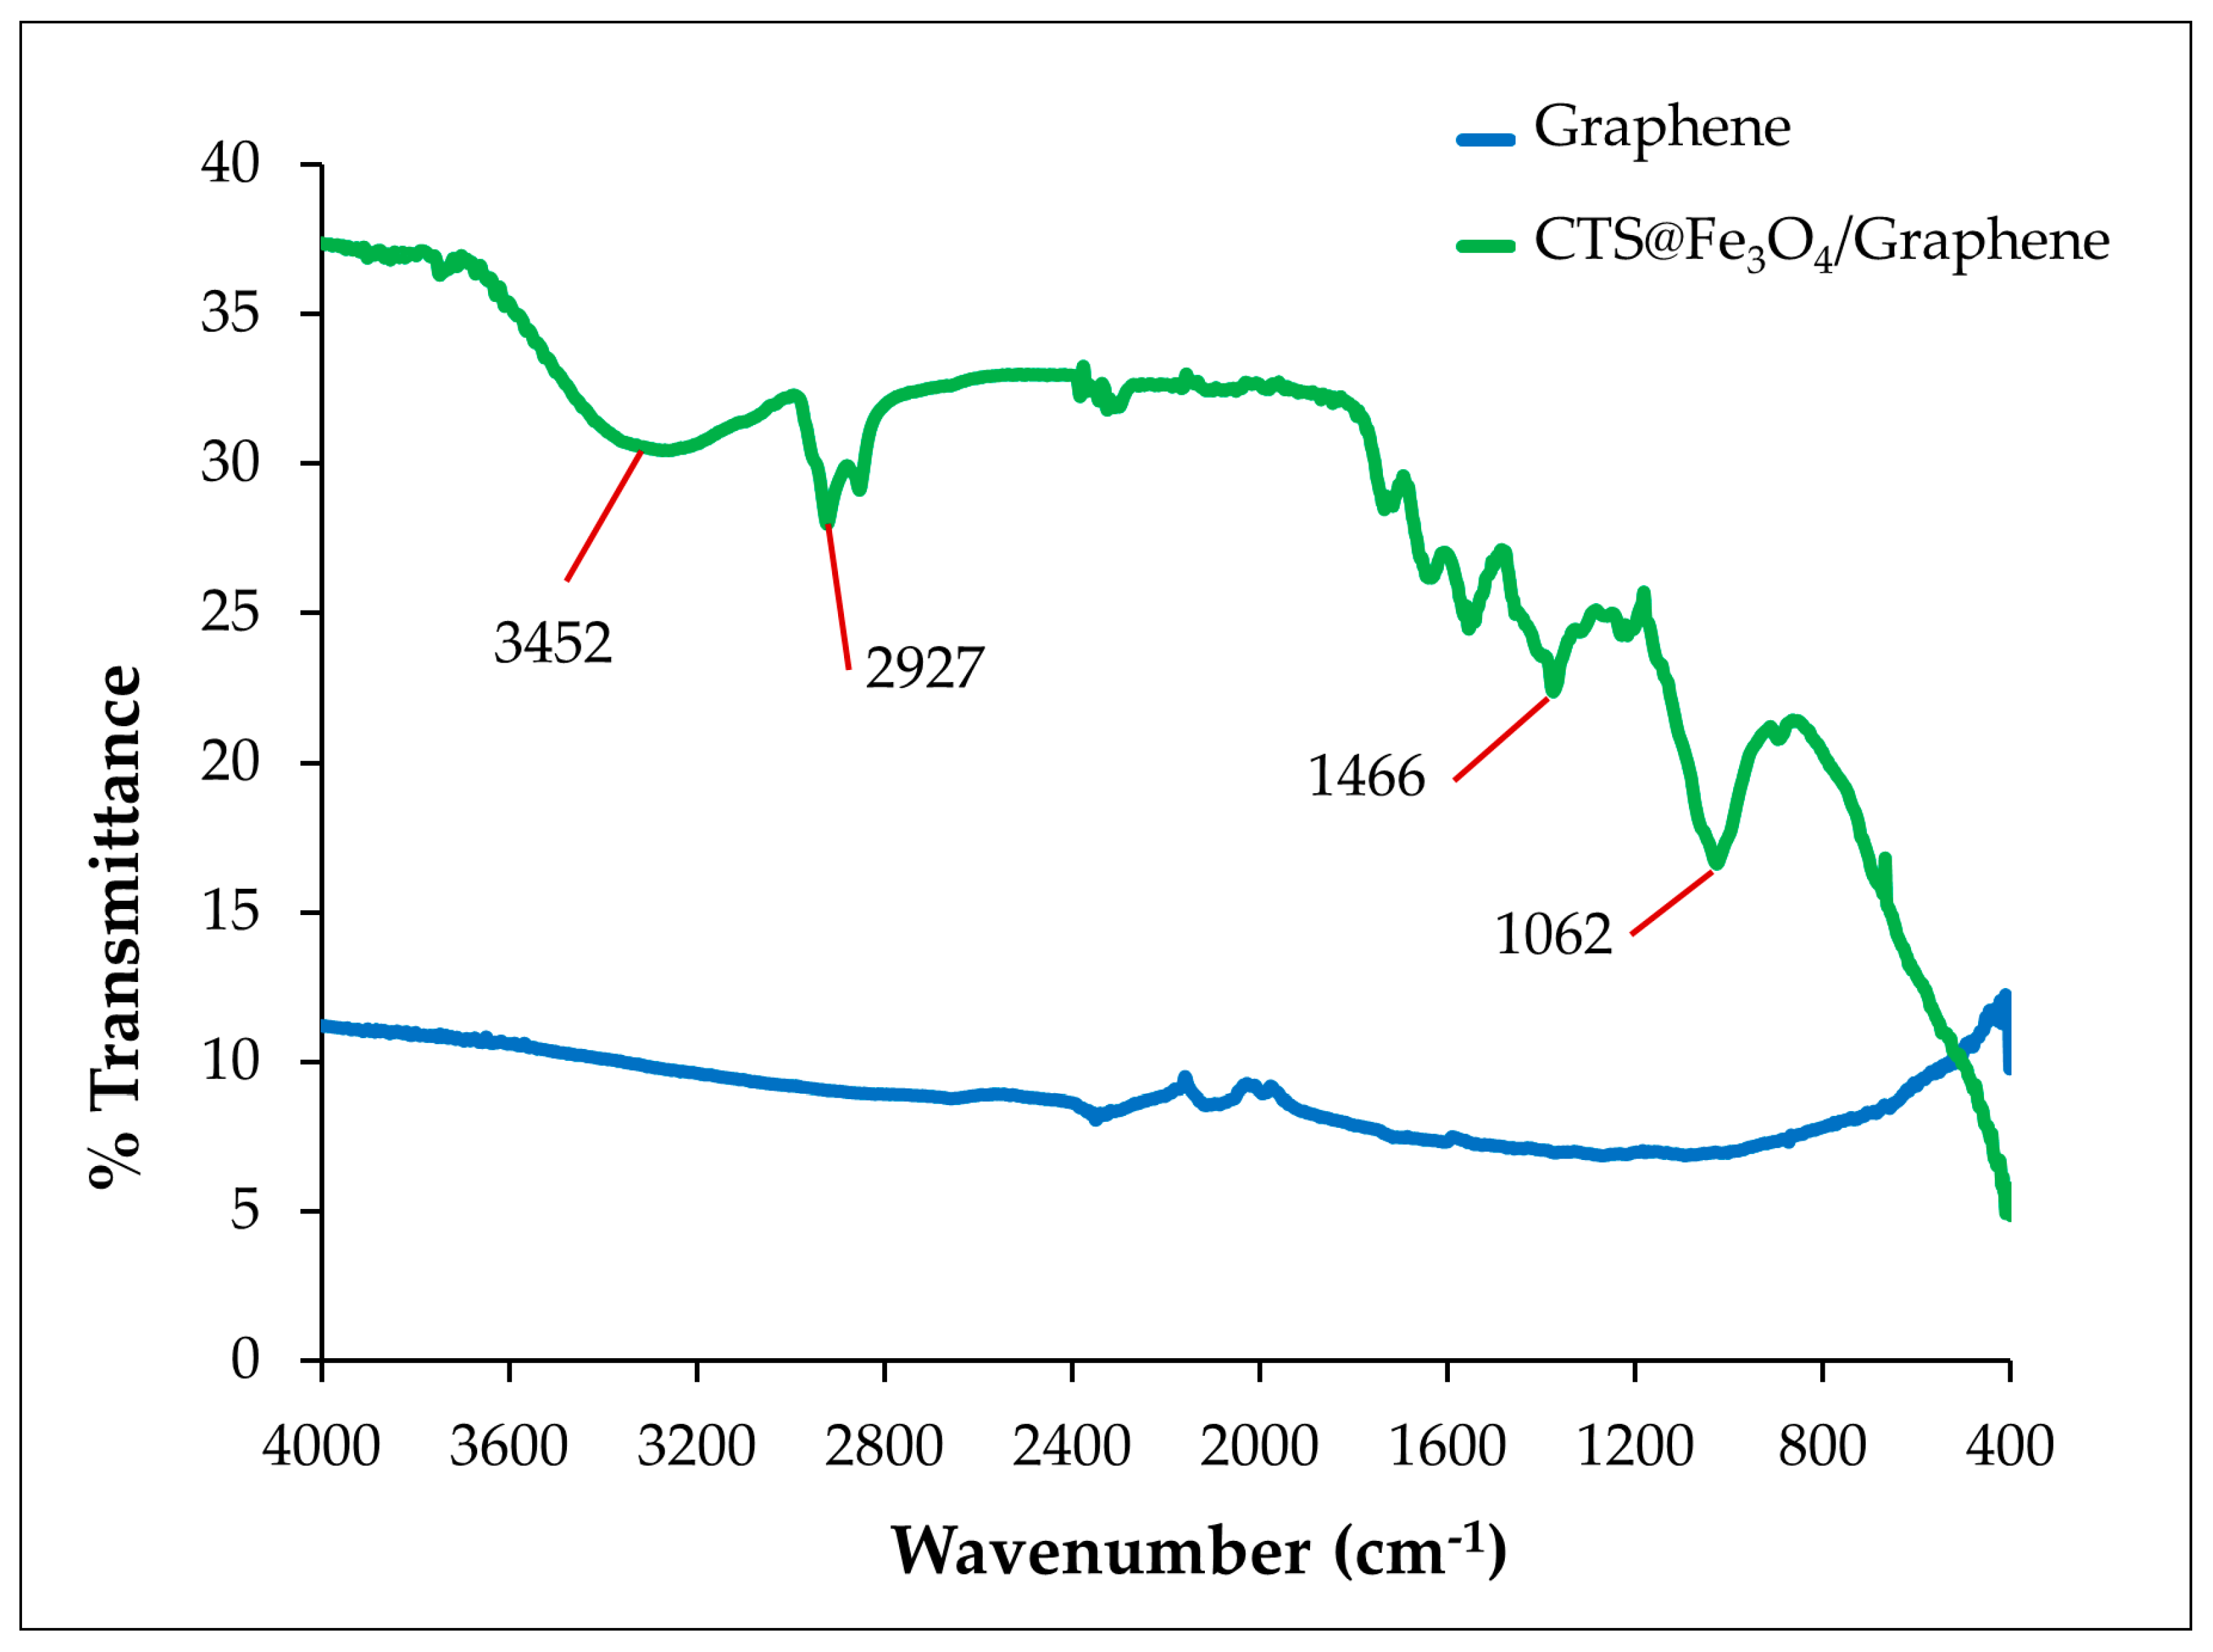
3.1.2. FT-IR
3.1.3. Electrochemical Impedance Spectroscopy (EIS)
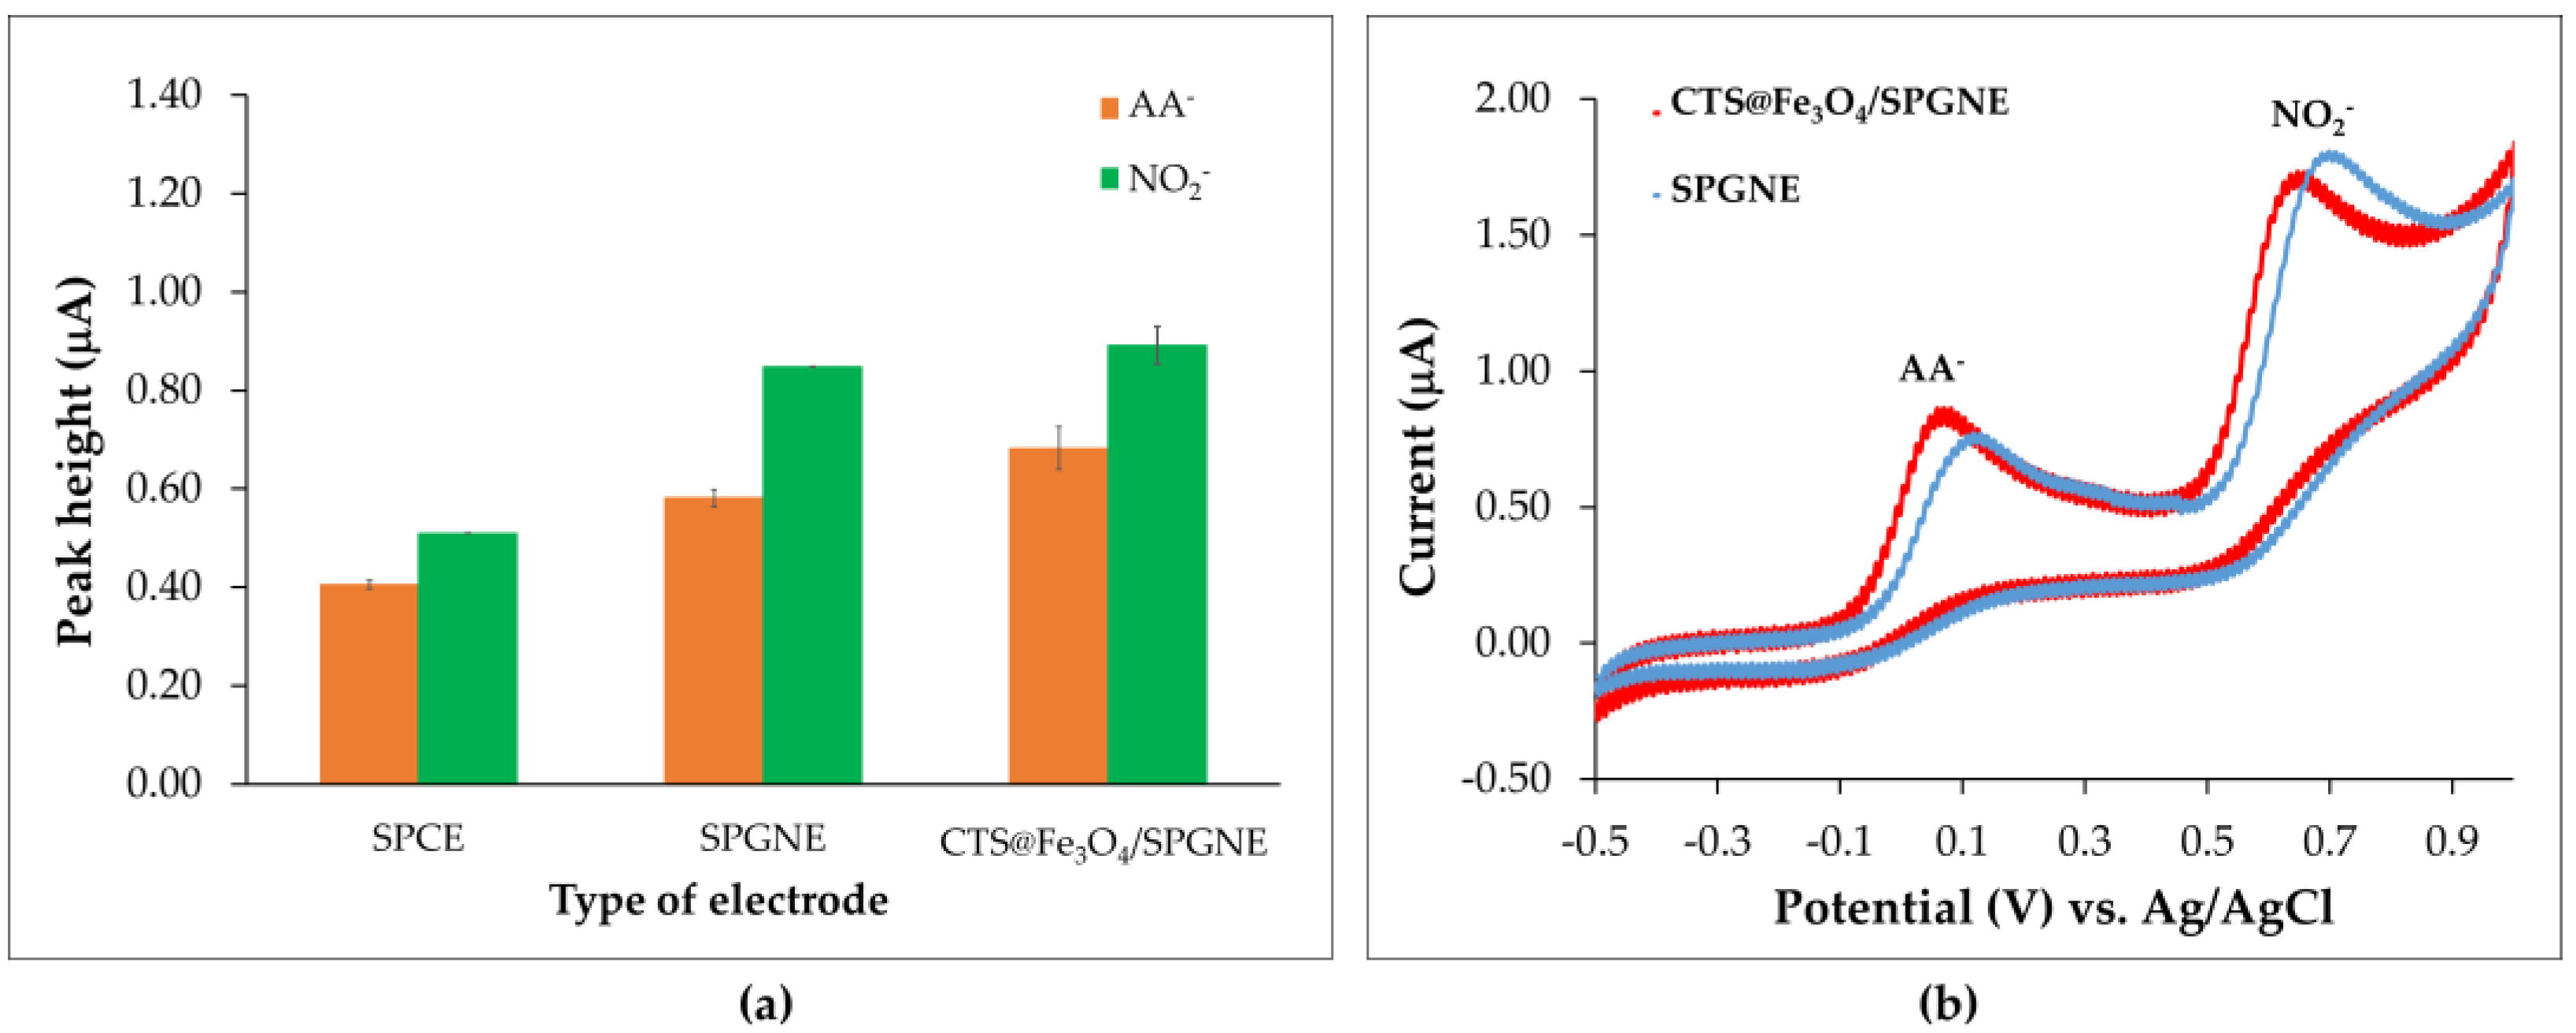
3.2. Preliminary Investigations for Nitrite (NO2−) and Ascorbic Acid (AA−) Analysis
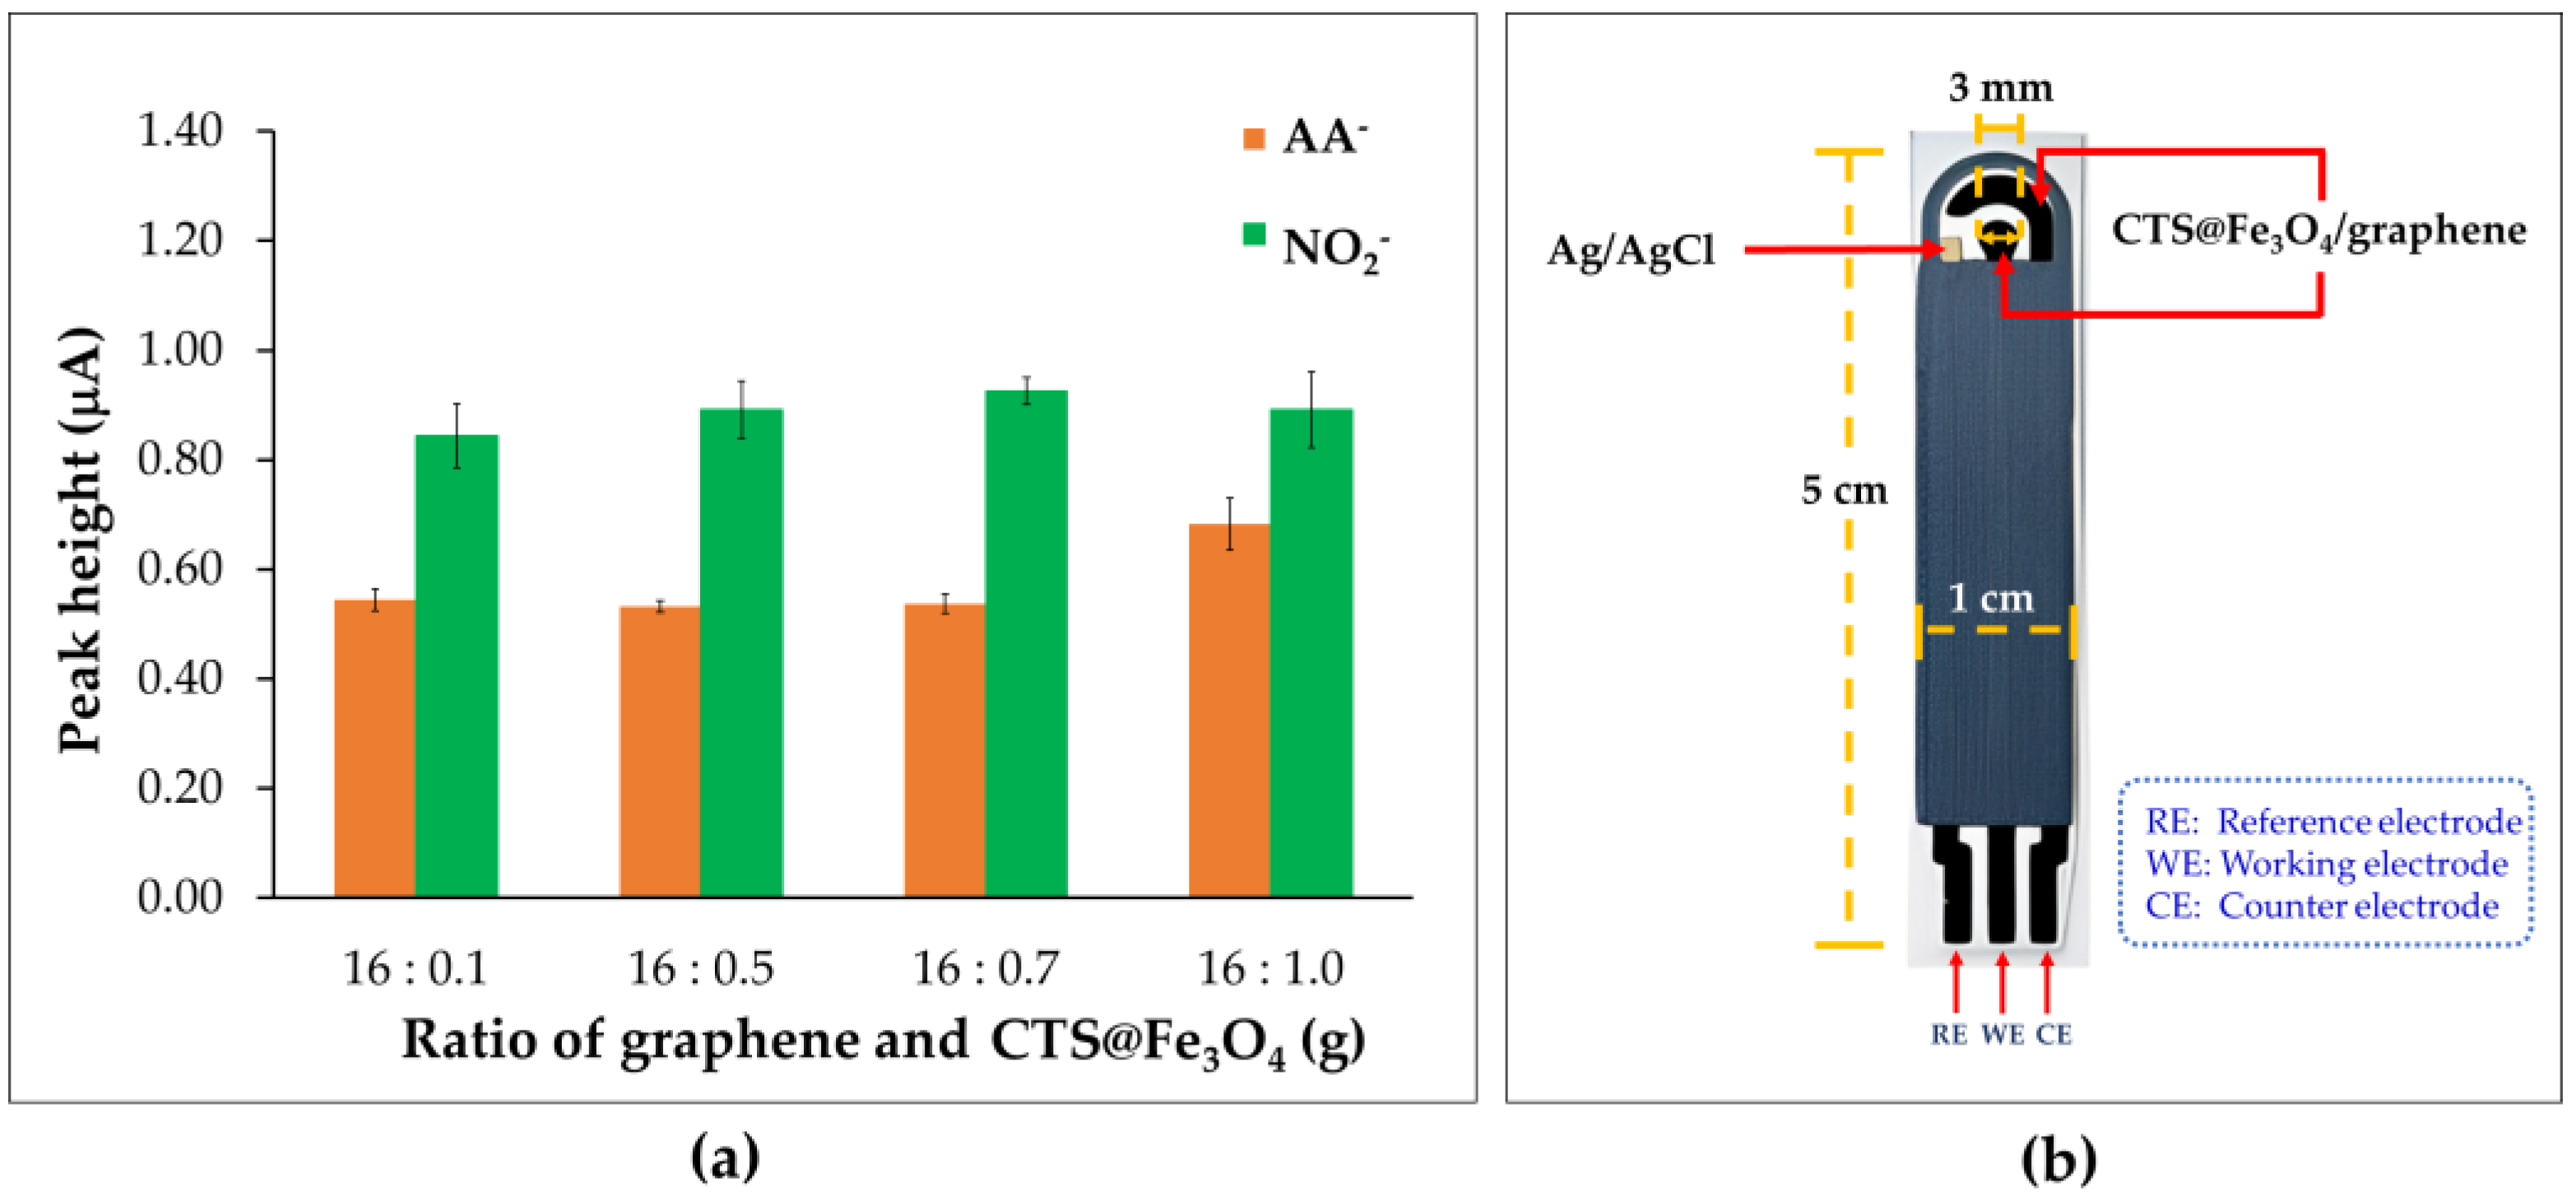
3.3. Ratio of Graphene and Chitosan-Coated Magnetite Nanoparticles (CTS@Fe3O4)
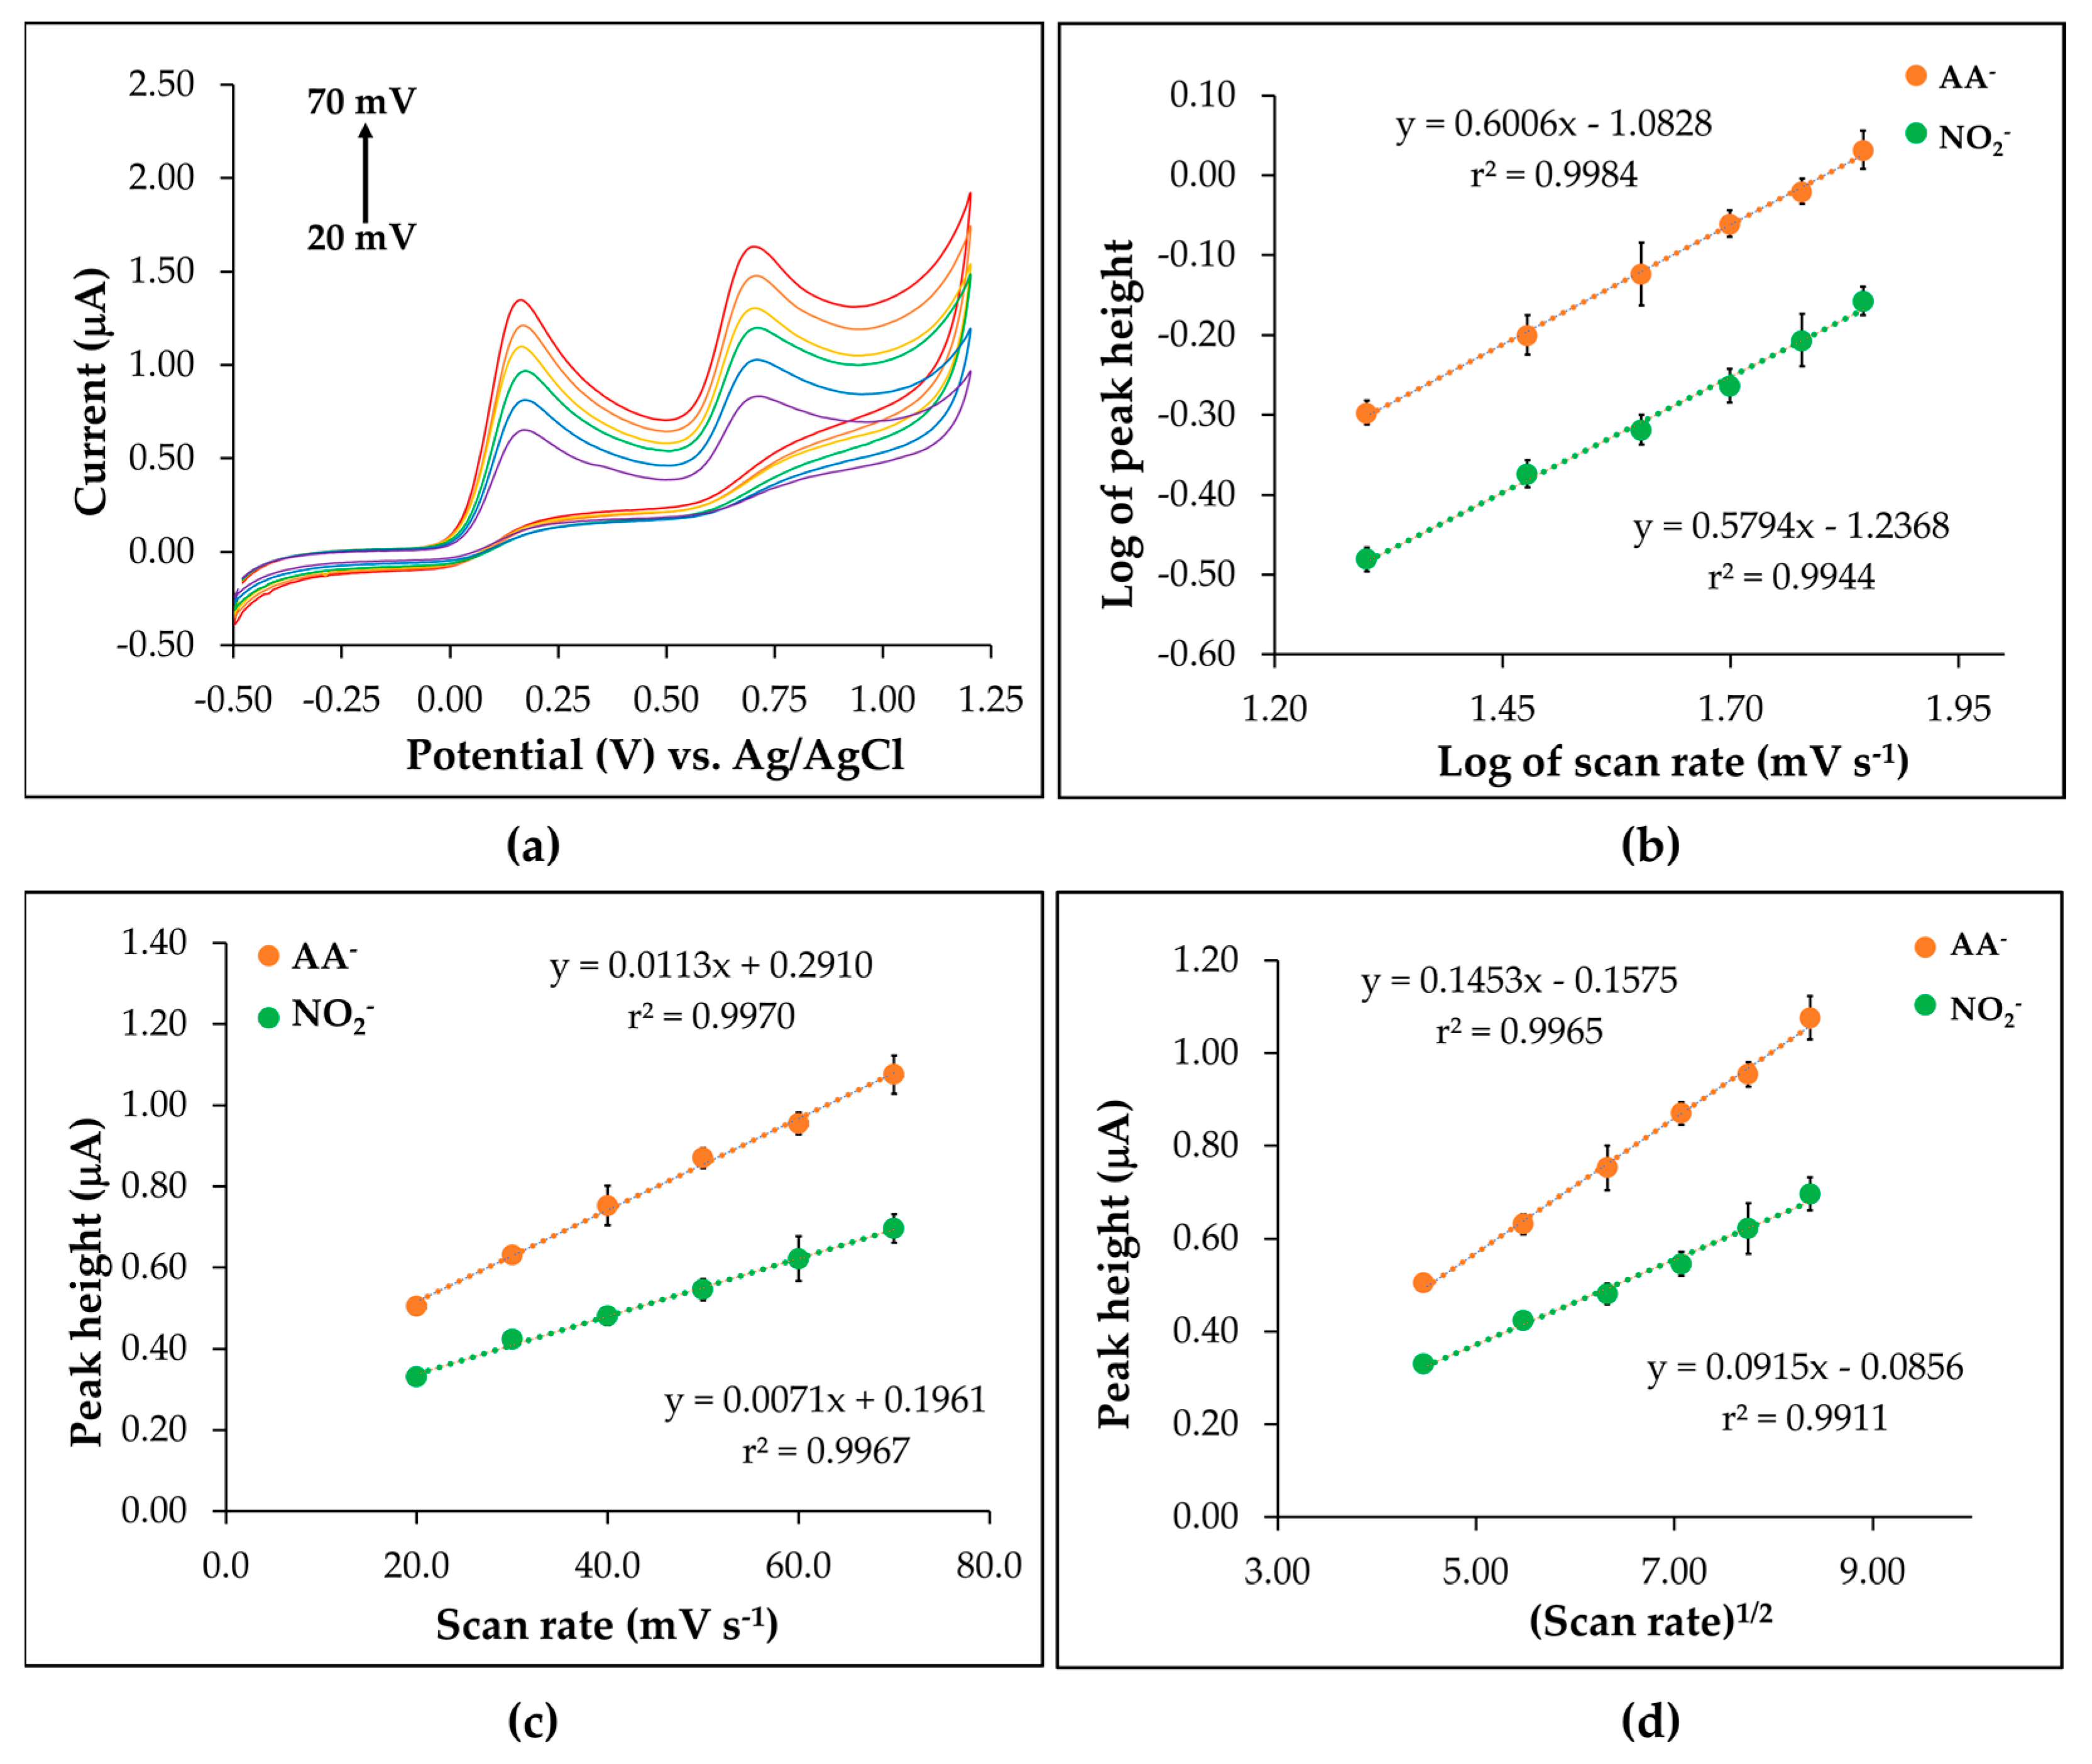
3.4. Behavior Study of the CTS@Fe3O4/SPGNE
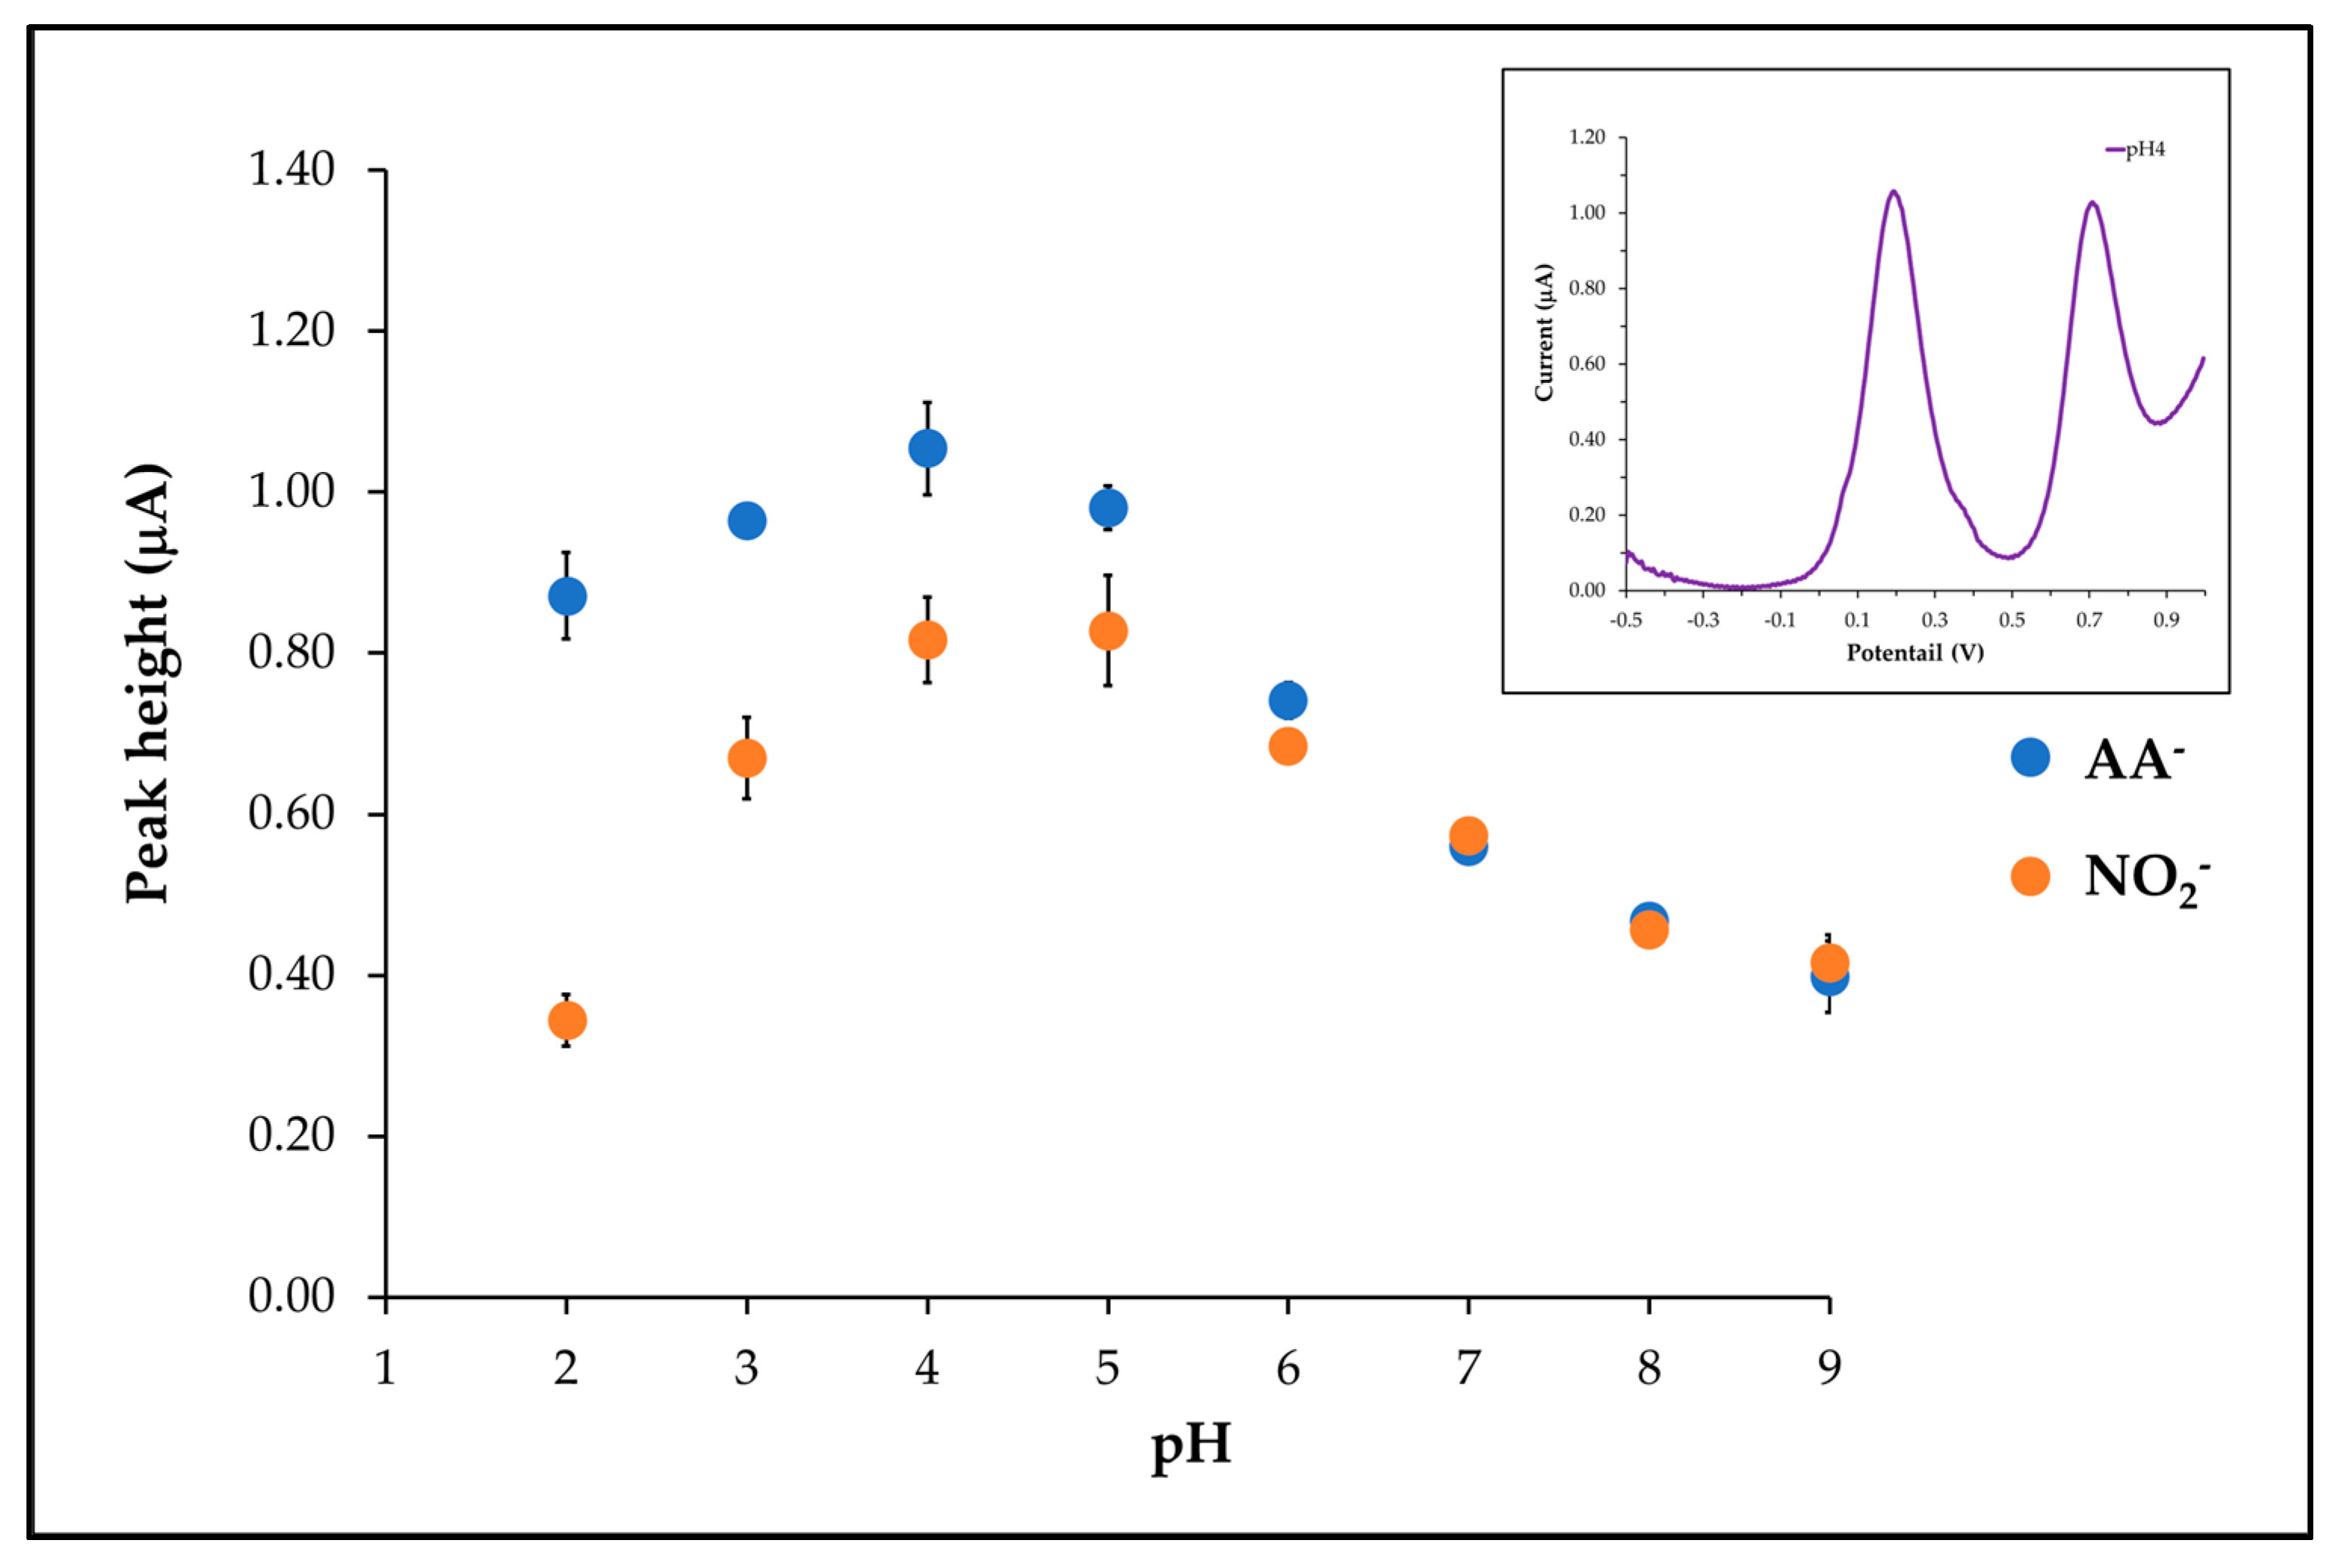
3.5. pH Effect
3.6. Analytical Performance
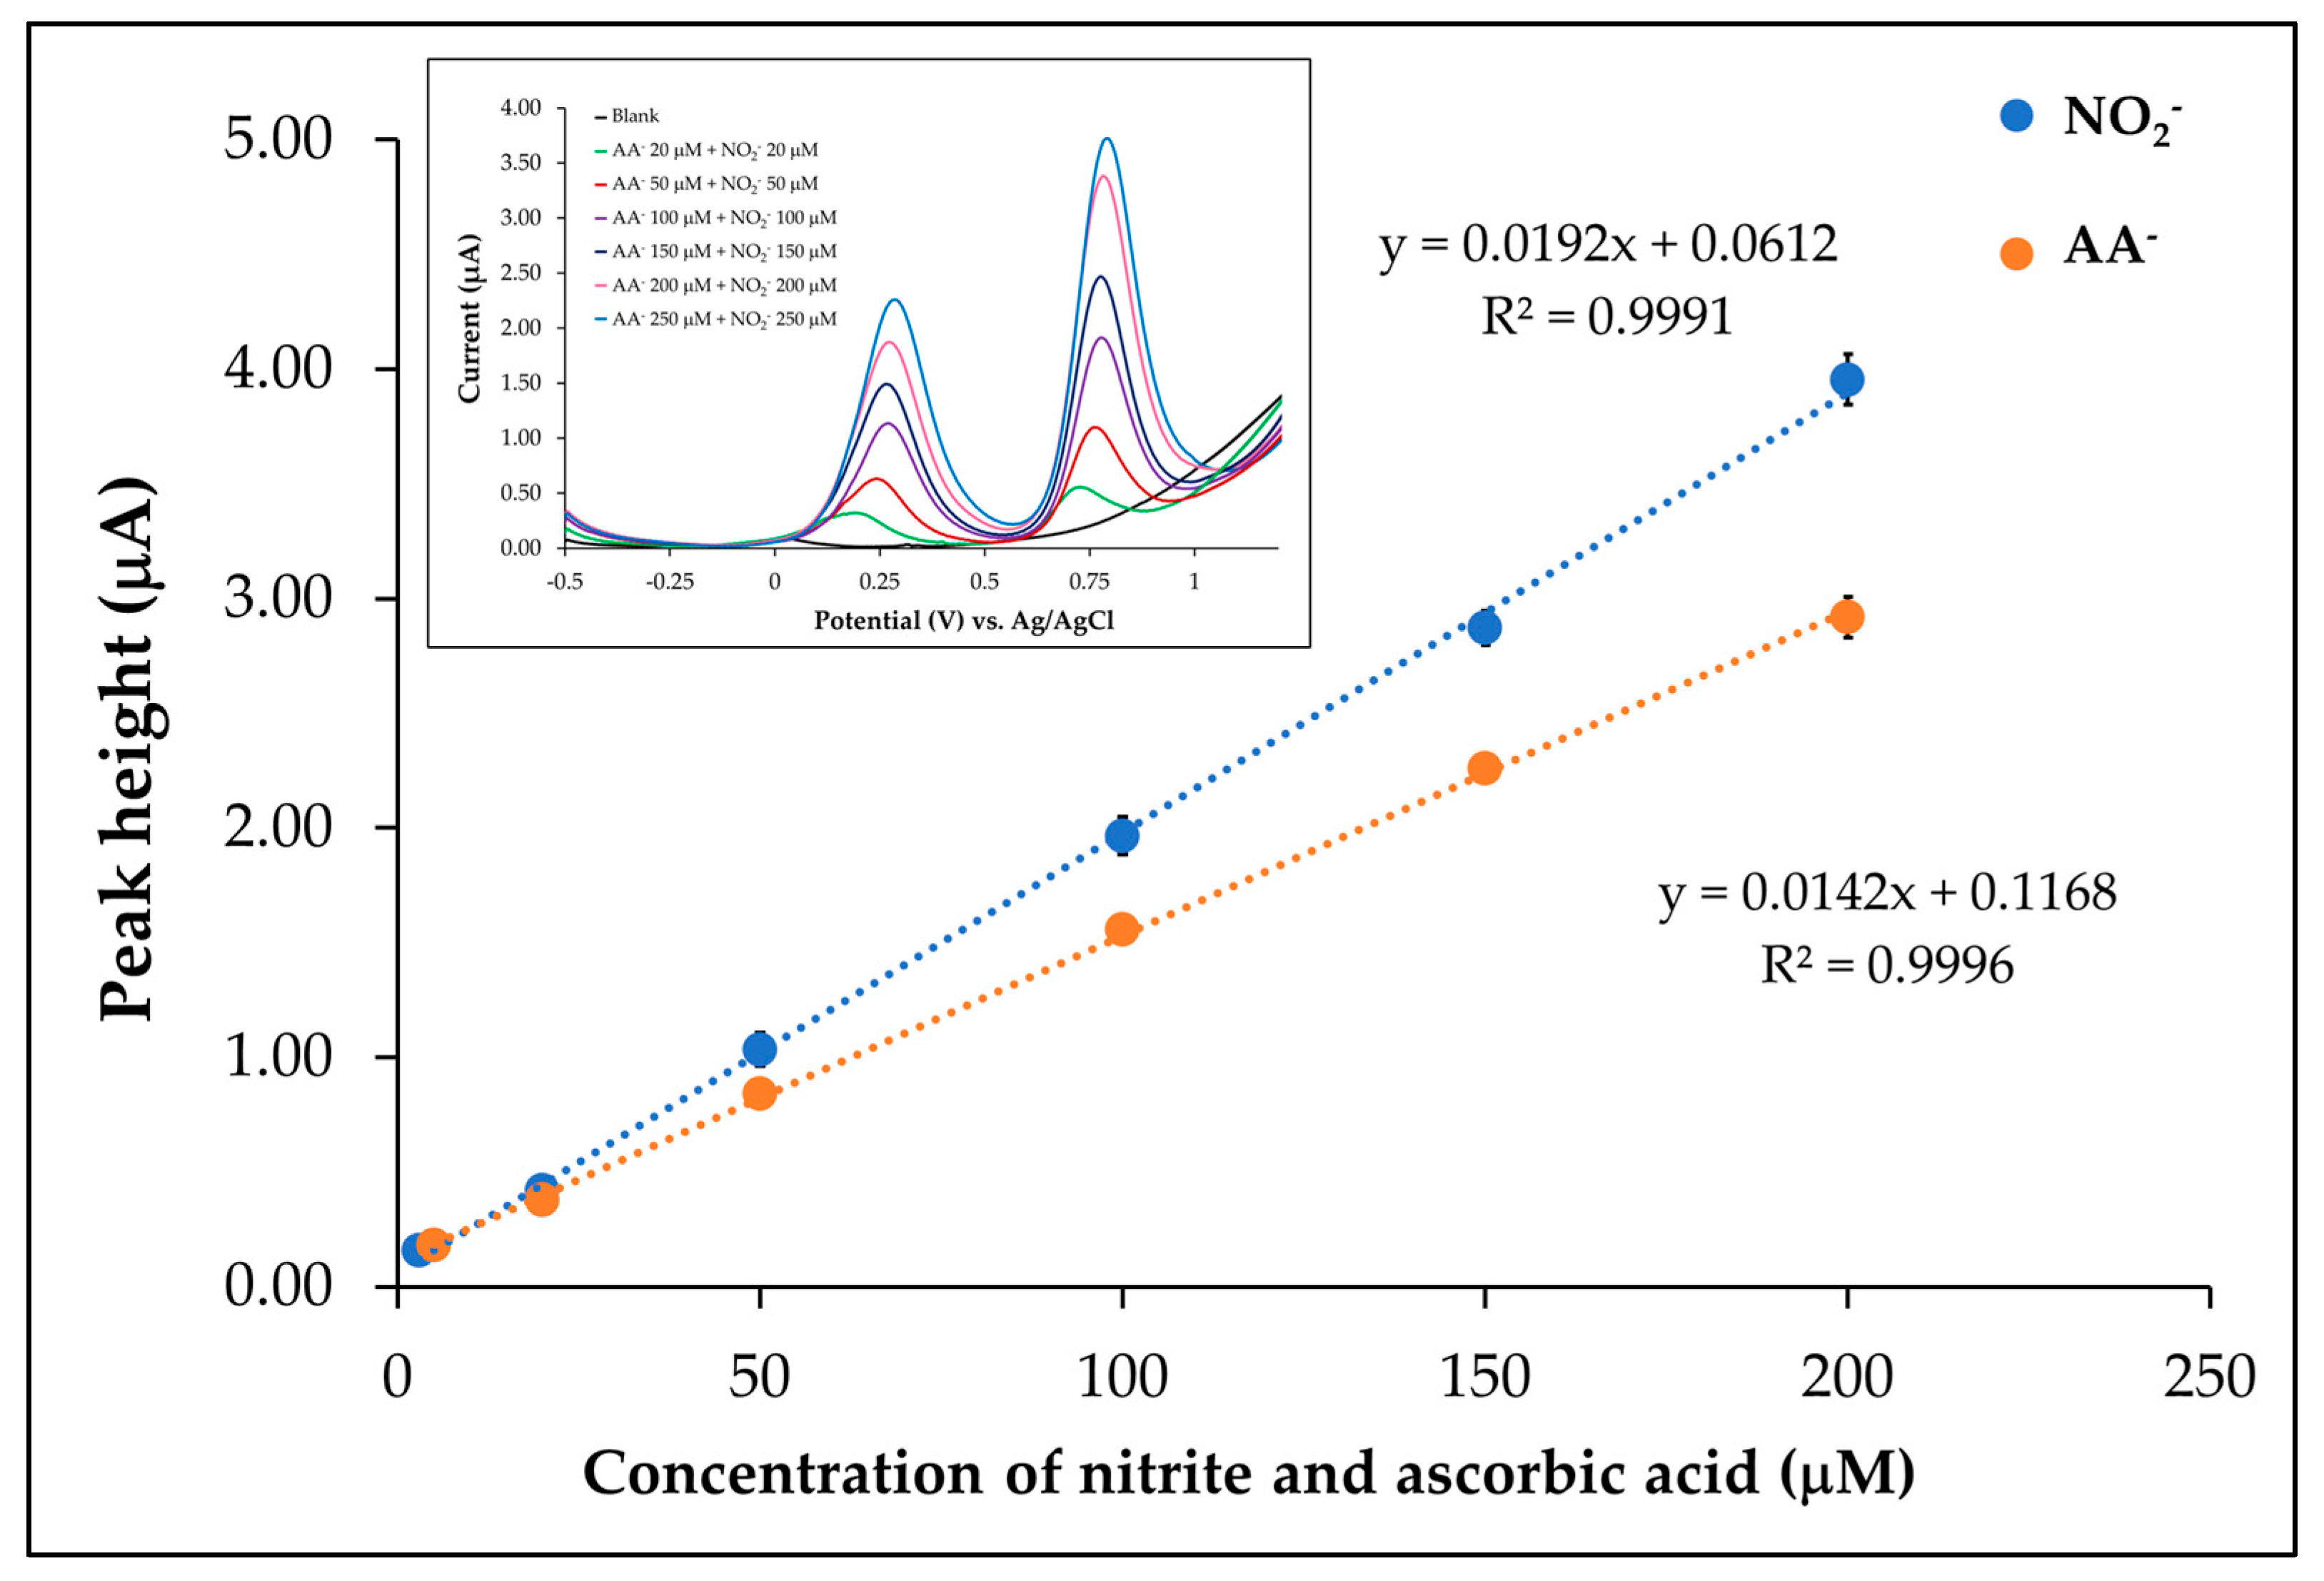
3.6.1. Linear Range
3.6.2. Limit of Detection (LOD) and Limit of Quantitation (LOQ)
3.6.3. Repeatability and Reproducibility
3.6.4. %Recovery
3.6.5. Selectivity
3.7. Application for Food Products
3.8. Comparison with Previous Research Work
4. Conclusions
5. Patents
Supplementary Materials
Author Contributions
Funding
Institutional Review Board Statement
Informed Consent Statement
Data Availability Statement
Acknowledgments
Conflicts of Interest
References
- Knight, J.; Madduma-Liyanage, K.; Mobley, J.A.; Assimos, D.G.; Holmes, R.P. Ascorbic acid intake and oxalate synthesis. Urolithiasis 2016, 44, 289–297. [Google Scholar] [CrossRef] [PubMed]
- Bureau of Nutrition, Department of Health, Ministry of Public Health. Dietary Reference Intake Tables for This 2020, 1st ed.; A.V. Progressive Limited Partnership: Bangkok, Thailand, 2022. [Google Scholar]
- Duan, W.; Ren, J.; Li, Y.; Liu, T.; Song, X.; Chen, Z.; Huang, Z.; Hou, X.; Li, Y. Conservation and Expression Patterns Divergence of Ascorbic Acid d-mannose/l-galactose Pathway Genes in Brassica rapa. Front. Plant Sci. 2016, 7, 778. [Google Scholar] [CrossRef] [PubMed]
- El-Malla, S.F.; Elattar, R.H.; Kamal, A.H.; Mansour, F.R. A highly sensitive switch-on spectrofluorometric method for determination of ascorbic acid using a selective eco-friendly approach. Spectrochim. Acta A Mol. Biomol. Spectrosc. 2022, 270, 120802. [Google Scholar] [CrossRef] [PubMed]
- Hemila, H. Vitamin C and Infections. Nutrients 2017, 9, 339. [Google Scholar] [CrossRef]
- Zayed, O.; Hewedy, O.A.; Abdelmoteleb, A.; Ali, M.; Youssef, M.S.; Roumia, A.F.; Seymour, D.; Yuan, Z.C. Nitrogen Journey in Plants: From Uptake to Metabolism, Stress Response, and Microbe Interaction. Biomolecules 2023, 13, 1443. [Google Scholar] [CrossRef]
- Huang, G.; Zhang, J.; Zhao, D. Cobalt Monoxide Nanoparticles Modified Glassy Carbon Electrodes as a Sensor for Determination of Nitrite. Adv. Mater. Res. 2015, 1120–1121, 291–298. [Google Scholar] [CrossRef]
- Jinming, H.; Samuel, P.; Mackenzie, W. A Simple Electrochemical Method for Nitrate Determination in Leafy Vegetables. J. Hum. Nutr. 2019, 3, 67–71. [Google Scholar] [CrossRef]
- Oliveira, R.T.S.; Garbellini, G.S.; Salazar-Banda, G.R.; Avaca, L.A. The Use of Ultrasound for the Analytical Determination of Nitrite on Diamond Electrodes by Square Wave Voltammetry. Anal. Lett. 2007, 40, 2673–2682. [Google Scholar] [CrossRef]
- Pang, D.; Ma, C.; Chen, D.; Shen, Y.; Zhu, W.; Gao, J.; Song, H.; Zhang, X.; Zhang, S. Silver nanoparticle-functionalized poly (3, 4-ethylenedioxythiophene): Polystyrene film on glass substrate for electrochemical determination of nitrite. Org. Electron. 2019, 75, 105374. [Google Scholar] [CrossRef]
- Zhang, K.; Li, S.; Liu, C.; Wang, Q.; Wang, Y.; Fan, J. A hydrophobic deep eutectic solvent-based vortex-assisted dispersive liquid-liquid microextraction combined with HPLC for the determination of nitrite in water and biological samples. J. Sep. Sci. 2019, 42, 574–581. [Google Scholar] [CrossRef]
- Ministry of Public Health. Notification No. 281, B.E. 2547, Regarding Food Additives; Ministry of Public Health: Bangkok, Thailand, 2004; Volume 121, pp. 1–4. [Google Scholar]
- Ajebe, E.G.; Bahiru, T.B. Spectrophotometric Determination of Nitrite and Nitrate in Some Selected Vegetables Cultivated in Adami Tulu Judo Kombolicha District Farms, Ethiopia. J. Anal. Bioanal. Tech. 2018, 9, 1000410. [Google Scholar] [CrossRef]
- Bazel, Y.; Riabukhina, T.; Tirpák, J. Spectrophotometric determination of ascorbic acid in foods with the use of vortex-assisted liquid-liquid microextraction. Microchem. J. 2018, 143, 160–165. [Google Scholar] [CrossRef]
- Thipwimonmas, Y.; Jaidam, J.; Samoson, K.; Khunseeraksa, V.; Phonchai, A.; Thiangchanya, A.; Chang, K.H.; Abdullah, A.F.L.; Limbut, W. A Simple and Rapid Spectrophotometric Method for Nitrite Detection in Small Sample Volumes. Chemosensors 2021, 9, 161. [Google Scholar] [CrossRef]
- Tatarczak-Michalewska, M.; Flieger, J.; Kawka, J.; Plazinski, W.; Flieger, W.; Blicharska, E.; Majerek, D. HPLC-DAD Determination of Nitrite and Nitrate in Human Saliva Utilizing a Phosphatidylcholine Column. Molecules 2019, 24, 1754. [Google Scholar] [CrossRef] [PubMed]
- Zappielo, C.; Nicácio, A.; Manin, L.; Maldaner, L.; Visentainer, J. Determination of L-Ascorbic Acid in Milk by Ultra-High-Performance Liquid Chromatography Coupled to Tandem Mass Spectrometry Analysis. J. Braz. Chem. Soc. 2019, 30, 1130–1137. [Google Scholar] [CrossRef]
- Ping, J.; Wu, J.; Wang, Y.; Ying, Y. Simultaneous determination of ascorbic acid, dopamine and uric acid using high-performance screen-printed graphene electrode. Biosens. Bioelectron. 2012, 34, 70–76. [Google Scholar] [CrossRef]
- Su, C.H.; Sun, C.L.; Liao, Y.C. Printed Combinatorial Sensors for Simultaneous Detection of Ascorbic Acid, Uric Acid, Dopamine, and Nitrite. ACS Omega 2017, 2, 4245–4252. [Google Scholar] [CrossRef]
- Sun, L.; Li, H.; Li, M.; Li, C.; Li, P.; Yang, B. Simultaneous determination of ascorbic acid, dopamine, uric acid, tryptophan, and nitrite on a novel carbon electrode. J. Electroanal. Chem. 2016, 783, 167–175. [Google Scholar] [CrossRef]
- Sanchayanukun, P.; Muncharoen, S. Elimination of Cr (VI) in Laboratory Wastewater Using Chitosan Coated Magnetite Nanoparticles (chitosan@ Fe3O4). EnvironmentAsia 2019, 12, 32–48. [Google Scholar] [CrossRef]
- Sanchayanukun, P.; Muncharoen, S. Chitosan coated magnetite nanoparticle as a working electrode for determination of Cr(VI) using square wave adsorptive cathodic stripping voltammetry. Talanta 2020, 217, 121027. [Google Scholar] [CrossRef]
- Pitakrut, S.; Sanchayanukun, P.; Muncharoen, S. Determination of salicylic acid content in pharmaceuticals using chitosan@Fe3O4/CPE electrode detected by SWV technique. ADMET DMPK 2023, 11, 175–184. [Google Scholar] [CrossRef] [PubMed]
- Karuwan, C.; Wisitsoraat, A.; Phokharatkul, D.; Sriprachuabwong, C.; Lomas, T.; Nacapricha, D.; Tuantranont, A. A disposable screen printed graphene–carbon paste electrode and its application in electrochemical sensing. RSC Adv. 2013, 3, 25792–25799. [Google Scholar] [CrossRef]
- Pisoschi, A.M.; Pop, A.; Negulescu, G.P.; Pisoschi, A. Determination of ascorbic acid content of some fruit juices and wine by voltammetry performed at pt and carbon paste electrodes. Molecules 2011, 16, 1349–1365. [Google Scholar] [CrossRef]
- ISO 6635:1984(en); Fruits, Vegetables and Derived Products—Determination of Nitrite and Nitrate Content—Molecular Absorption Spectrometric Method. International Organization for Standardization: Geneva, Switzerland, 1984.
- Stachniuk, A.; Szmagara, A.; Stefaniak, E.A. Spectrophotometric Assessment of the Differences Between Total Nitrate/Nitrite Contents in Peel and Flesh of Cucumbers. Food Anal. Methods 2018, 11, 2969–2977. [Google Scholar] [CrossRef]
- Kwon, W.; Jeong, E. Detoxification Properties of Guanidinylated Chitosan Against Chemical Warfare Agents and Its Application to Military Protective Clothing. Polymers 2020, 12, 1461. [Google Scholar] [CrossRef]
- Li, B.; Shan, C.L.; Zhou, Q.; Fang, Y.; Wang, Y.L.; Xu, F.; Han, L.R.; Ibrahim, M.; Guo, L.B.; Xie, G.L.; et al. Synthesis, characterization, and antibacterial activity of cross-linked chitosan-glutaraldehyde. Mar. Drugs 2013, 11, 1534–1552. [Google Scholar] [CrossRef]
- Marroquin, J.B.; Rhee, K.Y.; Park, S.J. Chitosan nanocomposite films: Enhanced electrical conductivity, thermal stability, and mechanical properties. Carbohydr. Polym. 2013, 92, 1783–1791. [Google Scholar] [CrossRef]
- Abedi, A.; Hasanzadeh, M.; Tayebi, L. Conductive nanofibrous Chitosan/PEDOT:PSS tissue engineering scaffolds. Mater. Chem. Phys. 2019, 237, 121882. [Google Scholar] [CrossRef]
- Mo, R.; Wang, X.; Yuan, Q.; Yan, X.; Su, T.; Feng, Y.; Lv, L.; Zhou, C.; Hong, P.; Sun, S.; et al. Electrochemical Determination of Nitrite by Au Nanoparticle/Graphene-Chitosan Modified Electrode. Sensors 2018, 18, 1986. [Google Scholar] [CrossRef]
- Garcia-Miranda Ferrari, A.; Foster, C.W.; Kelly, P.J.; Brownson, D.A.C.; Banks, C.E. Determination of the Electrochemical Area of Screen-Printed Electrochemical Sensing Platforms. Biosensors 2018, 8, 53. [Google Scholar] [CrossRef]
- Asangil, D.; Hudai Tasdemir, I.; Kilic, E. Adsorptive stripping voltammetric methods for determination of aripiprazole. J. Pharm. Anal. 2012, 2, 193–199. [Google Scholar] [CrossRef] [PubMed]
- Horwitz, W. AOAC Guidelines for Single Laboratory Validation of Chemical Methods for Dietary Supplements and Botanicals; AOAC International: Gaithersburg, MD, USA, 2020; pp. 12–19. [Google Scholar]
- Pardakhty, A.; Ahmadzadeh, S.; Avazpour, S.; Gupta, V.K. Highly sensitive and efficient voltammetric determination of ascorbic acid in food and pharmaceutical samples from aqueous solutions based on nanostructure carbon paste electrode as a sensor. J. Mol. Liq. 2016, 216, 387–391. [Google Scholar] [CrossRef]
- Ma, X.; Gao, F.; Liu, G.; Xie, Y.; Tu, X.; Li, Y.; Dai, R.; Qu, F.; Wang, W.; Lu, L. Sensitive determination of nitrite by using an electrode modified with hierarchical three-dimensional tungsten disulfide and reduced graphene oxide aerogel. Mikrochim. Acta 2019, 186, 291. [Google Scholar] [CrossRef] [PubMed]
- Rajab, N.; Ibrahim, H.; Hassan, R.Y.A.; Youssef, A.F.A. Selective determination of nitrite in water and food samples using zirconium oxide (ZrO2)@MWCNTs modified screen printed electrode. RSC Adv. 2023, 13, 21259–21270. [Google Scholar] [CrossRef]
- El Anzi, L.; García, M.S.; Laborda, E.; Ruiz, A.; Ortuño, J.Á. Low-Cost Electrochemical Determination of L-Ascorbic Acid Using Screen-Printed Electrodes and Development of an Electronic Tongue for Juice Analysis. Chemosensors 2024, 12, 237. [Google Scholar] [CrossRef]
- Blažević, J.; Stanković Ex Šter, A.; Šafranko, S.; Jokic, S.; Velić, D.; Medvidović-Kosanović, M. Electrochemical Detection of Vitamin C in Real Samples. Food Health Dis. Sci.-Prof. J. Nutr. Diet. 2020, 9, 1–8. [Google Scholar]
- Guo, X.; Fan, Y. Determination of nitrite in food specimens using electrochemical sensor based on polyneutral red modified reduced graphene oxide paste electrode. Int. J. Electrochem. Sci. 2023, 18, 100290. [Google Scholar] [CrossRef]
- Zhao, X.; Zhou, G.; Qin, S.; Zhang, J.; Wang, G.; Gao, J.; Suo, H.; Zhao, C. In Situ Preparation of Metallic Copper Nanosheets/Carbon Paper Sensitive Electrodes for Low-Potential Electrochemical Detection of Nitrite. Sensors 2024, 24, 4247. [Google Scholar] [CrossRef]
- Parkook, F.; Shahvandi, S.K.; Ghaedi, M.; Javadian, H.; Parkook, A. Determination of ascorbic acid in biological samples using an electrochemical sensor modified with Au-Cu2O/MWCNTs nanocomposite. Diam. Relat. Mater. 2024, 144, 110954. [Google Scholar] [CrossRef]
- Feng, X.Z.; Ferranco, A.; Su, X.; Chen, Z.; Jiang, Z.; Han, G.C. A Facile Electrochemical Sensor Labeled by Ferrocenoyl Cysteine Conjugate for the Detection of Nitrite in Pickle Juice. Sensors 2019, 19, 268. [Google Scholar] [CrossRef]
- Bartolome, J.P.; Fragoso, A. Electrochemical detection of nitrite and ascorbic acid at glassy carbon electrodes modified with carbon nano-onions bearing electroactive moieties. Inorganica Chim. Acta 2017, 468, 223–231. [Google Scholar] [CrossRef]
- Muncharoen, S.; Pitakrut, S.; Sanchayanukun, P.; Karuwan, C. Method for Preparing Magnetite Nanoparticles Coated with Chitosan for Use as a Component in the Fabrication of Screen-Printed Modified Graphene Electrodes Patent Application Number 2303003313, 13 November 2023.
- Pak, J.S.; Jang, P.H.; Pak, K.M.; Yang, W.C. Electrochemical Detection of Nitrite on PANI-TiO(2)/Pt Nanocomposite-Modified Carbon Paste Electrodes Using TOPSIS and Taguchi Methods. ACS Omega 2024, 9, 30583–30593. [Google Scholar] [CrossRef] [PubMed]
- Faisal, M.; Alam, M.M.; Ahmed, J.; Asiri, A.M.; Algethami, J.S.; Altholami, R.H.; Harraz, F.A.; Rahman, M.M. Efficient nitrite determination by electrochemical approach in liquid phase with ultrasonically prepared gold-nanoparticle-conjugated conducting polymer nanocomposites. Front. Chem. 2024, 12, 1358353. [Google Scholar] [CrossRef] [PubMed]
- Amare, M. Electrochemical Determination of Ascorbic Acid in Pharmaceutical Tablets using Carbon Paste Electrode. Org. Med. Chem. Int. J. 2019, 8, 555749. [Google Scholar] [CrossRef]


| Parameter | Results | |
|---|---|---|
| AA− | NO2− | |
| Linear range (µM) | 5.00–200.00 | 3.00–200.00 |
| Linear equation (µM) | y = 0.0142x + 0.1168 | y = 0.0192x + 0.0612 |
| Limit of detection: LOD (µM) | 3.39 | 2.84 |
| Limit of quantitation: LOQ (µM) | 11.30 | 9.47 |
| Repeatability (n = 5) | 4.80 | 5.45 |
| Reproducibility (n = 10) | 4.73 | 4.00 |
| Sample | % Recovery (n = 3) | |
|---|---|---|
| AA− | NO2− | |
| Strawberry juice | 104.41–112.98 | 94.14–98.71 |
| Guava juice | 93.92–114.92 | 80.19–93.39 |
| Green oak | 103.83–107.37 | 90.89–101.33 |
| Basil | 86.22–104.85 | 82.16–89.43 |
| Synthetic samples | 107.37–114.77 | 96.97–114.05 |
| Firilice | 97.38–106.23 | 87.51–98.22 |
| Bok choy | 95.55–110.29 | 90.75–100.03 |
| Cos | 92.25–101.90 | 83.53–87.60 |
| Red oak | 83.28–86.13 | 88.12–99.64 |
| Butterhead lettuce | 92.83–106.17 | 95.59–106.36 |
| Red coral | 93.62–105.24 | 98.44–102.25 |
| Hydroponic nutrient | 88.57–96.82 | 89.74–96.18 |
| Interference | Concentration Ratio | %Tolerance (n = 3) | |||
|---|---|---|---|---|---|
| AA− | NO2− | IF a | AA− | NO2− | |
| Glucose | 1 | 1 | 500 | 2.73 | 4.91 |
| Zinc | 1 | 1 | 50 | 4.73 | 2.59 |
| Urea | 1 | 1 | 50 | 1.67 | 1.31 |
| Nitrate | 1 | 1 | 50 | 1.86 | 0.15 |
| Citric acid | 1 | 1 | 20 | 4.78 | 1.86 |
| Carbonate | 1 | 1 | 5 | 0.24 | 2.07 |
| Interference | Concentration (mg kg−1) | |||
|---|---|---|---|---|
| Standard Method a | Development Method b | |||
| AA− | NO2− | AA− | NO2− | |
| Strawberry juice | 258.90 ± 0.03 | N.D. | 246.57±0.10 | N.D. |
| Guava juice | 1213.47 ± 0.11 | N.D. | 1211.70 ± 0.53 | N.D. |
| Green oak | 13,210.00 ± 0.08 | 10.70 ± 0.02 | 13,441.48 ± 0.17 | 15.10 ± 0.00 |
| Basil | 13,737.36 ± 0.14 | 9.80 ± 0.01 | 13,693.33 ± 0.08 | 11.48 ± 0.00 |
| Synthetic samples | 435.00 ± 0.20 | 124.70 ± 0.00 | 436.80 ± 0.09 | 124.20 ± 0.02 |
| Firilice | 1667.72 ± 78.83 | 10.12 ± 7.50 | 1593.55 ± 221.39 | 9.20 ± 0.11 |
| Bokchoy | 755.81 ± 16.61 | 165.55 ± 4.56 | 733.42 ± 2.58 | 173.09 ± 0.48 |
| Cos | 2231.66 ± 11.69 | 43.23 ± 1.26 | 2212.30 ± 15.57 | 38.69 ± 1.17 |
| Red oak | 2627.24 ± 7.68 | 292.79 ± 4.09 | 2638.04 ± 3.45 | 276.26 ± 3.83 |
| Butterhead lettuce | 2335.36 ± 11.03 | 169.64 ± 1.00 | 2324.47 ± 8.69 | 164.88 ± 2.73 |
| Red coral | 1396.29 ± 12.74 | 171.79 ± 5.15 | 1400.62 ± 7.25 | 160.92 ± 3.81 |
| Hydroponic nutrient | 679.97 ± 6.23 | 38.55 ± 3.40 | 712.61 ± 4.84 | 56.69 ± 0.57 |
| Electrode | Technique | Analyte | Sample | Linearity Range (μM) | LOD (µM) | Ref. |
|---|---|---|---|---|---|---|
| ZrO2@MWCNTs SPE | CA | NO2− | real food and water | 5.0–100 | 0.94 | [38] |
| Glassy carbon electrode (GCE) | CV b | AA− | fruit juices and food supplement | 2.5 × 10³–1 × 10⁶ | [40] | |
| Au nanoparticle/graphene–chitosan-modified electrode | CA a | NO2− | 0.9–18.9 | 0.30 | [32] | |
| Carbon SPE | CA a | AA− | fruit juice | 20–1000 | 0.70 | [39] |
| a nanocomposite of polyneutral red and reduced graphene oxide paste electrode (pNR/rGO-PE) | CA a | NO2− | food | 0–14,000 | 0.017 | [41] |
| Metallic copper Nanosheets/carbon paper electrode (Cu/CP) | CA a | NO2− | drinking water | 10–1000 | 0.079 | [42] |
| Au-Cu2O/MWCNTs nanocomposite | DPV c | AA− | biological samples | 1–200 | 0.30 | [43] |
| Fc(CO-Glu-Cys-Gly-OH) on screen-printed electrodes (Fc-ECG/SPE). | DPV c | NO2− | pickle juice | 1.0–50 | 0.30 | [44] |
| GCE/CNO/oAP | CA a | NO2− and AA− | orange juice | 0–50 (NO2−) and 0–50 (AA−) | 0.82 (NO2−) and 0.34 (AA−) | [45] |
| GCE/CNO/thionine | CA a | NO2− and AA− | orange juice | 0–50 (NO2−) and 0–50 (AA−) | 1.89 (NO2−) and 0.66 (AA−) | [45] |
| CTS@Fe3O4/SPGNE | SWV d | NO2− and AA− | fruit juice and hydroponic vegetable | 3–200 (NO2−) and 5–200 (AA−) | 2.84 (NO2−) and 3.39 (AA−) | This work |
Disclaimer/Publisher’s Note: The statements, opinions and data contained in all publications are solely those of the individual author(s) and contributor(s) and not of MDPI and/or the editor(s). MDPI and/or the editor(s) disclaim responsibility for any injury to people or property resulting from any ideas, methods, instructions or products referred to in the content. |
© 2025 by the authors. Licensee MDPI, Basel, Switzerland. This article is an open access article distributed under the terms and conditions of the Creative Commons Attribution (CC BY) license (https://creativecommons.org/licenses/by/4.0/).
Share and Cite
Pitakrut, S.; Sanchayanukun, P.; Karuwan, C.; Muncharoen, S. Application of Chitosan@Fe3O4 Nanoparticle-Modified Screen-Printed Graphene-Based Electrode for Simultaneous Analysis of Nitrite and Ascorbic Acid in Hydroponics and Fruit Juice. Sensors 2025, 25, 1431. https://doi.org/10.3390/s25051431
Pitakrut S, Sanchayanukun P, Karuwan C, Muncharoen S. Application of Chitosan@Fe3O4 Nanoparticle-Modified Screen-Printed Graphene-Based Electrode for Simultaneous Analysis of Nitrite and Ascorbic Acid in Hydroponics and Fruit Juice. Sensors. 2025; 25(5):1431. https://doi.org/10.3390/s25051431
Chicago/Turabian StylePitakrut, Sudarut, Phetlada Sanchayanukun, Chanpen Karuwan, and Sasithorn Muncharoen. 2025. "Application of Chitosan@Fe3O4 Nanoparticle-Modified Screen-Printed Graphene-Based Electrode for Simultaneous Analysis of Nitrite and Ascorbic Acid in Hydroponics and Fruit Juice" Sensors 25, no. 5: 1431. https://doi.org/10.3390/s25051431
APA StylePitakrut, S., Sanchayanukun, P., Karuwan, C., & Muncharoen, S. (2025). Application of Chitosan@Fe3O4 Nanoparticle-Modified Screen-Printed Graphene-Based Electrode for Simultaneous Analysis of Nitrite and Ascorbic Acid in Hydroponics and Fruit Juice. Sensors, 25(5), 1431. https://doi.org/10.3390/s25051431