
Enhanced N-Butanol Sensing Performance of Cr-Doped CeO2 Nanomaterials


Abstract
1. Introduction
2. Materials and Methods
2.1. Materials
2.2. Samples Preparation
2.3. Characterization
2.4. Gas Sensor Fabrication and Test
3. Results and Discussion
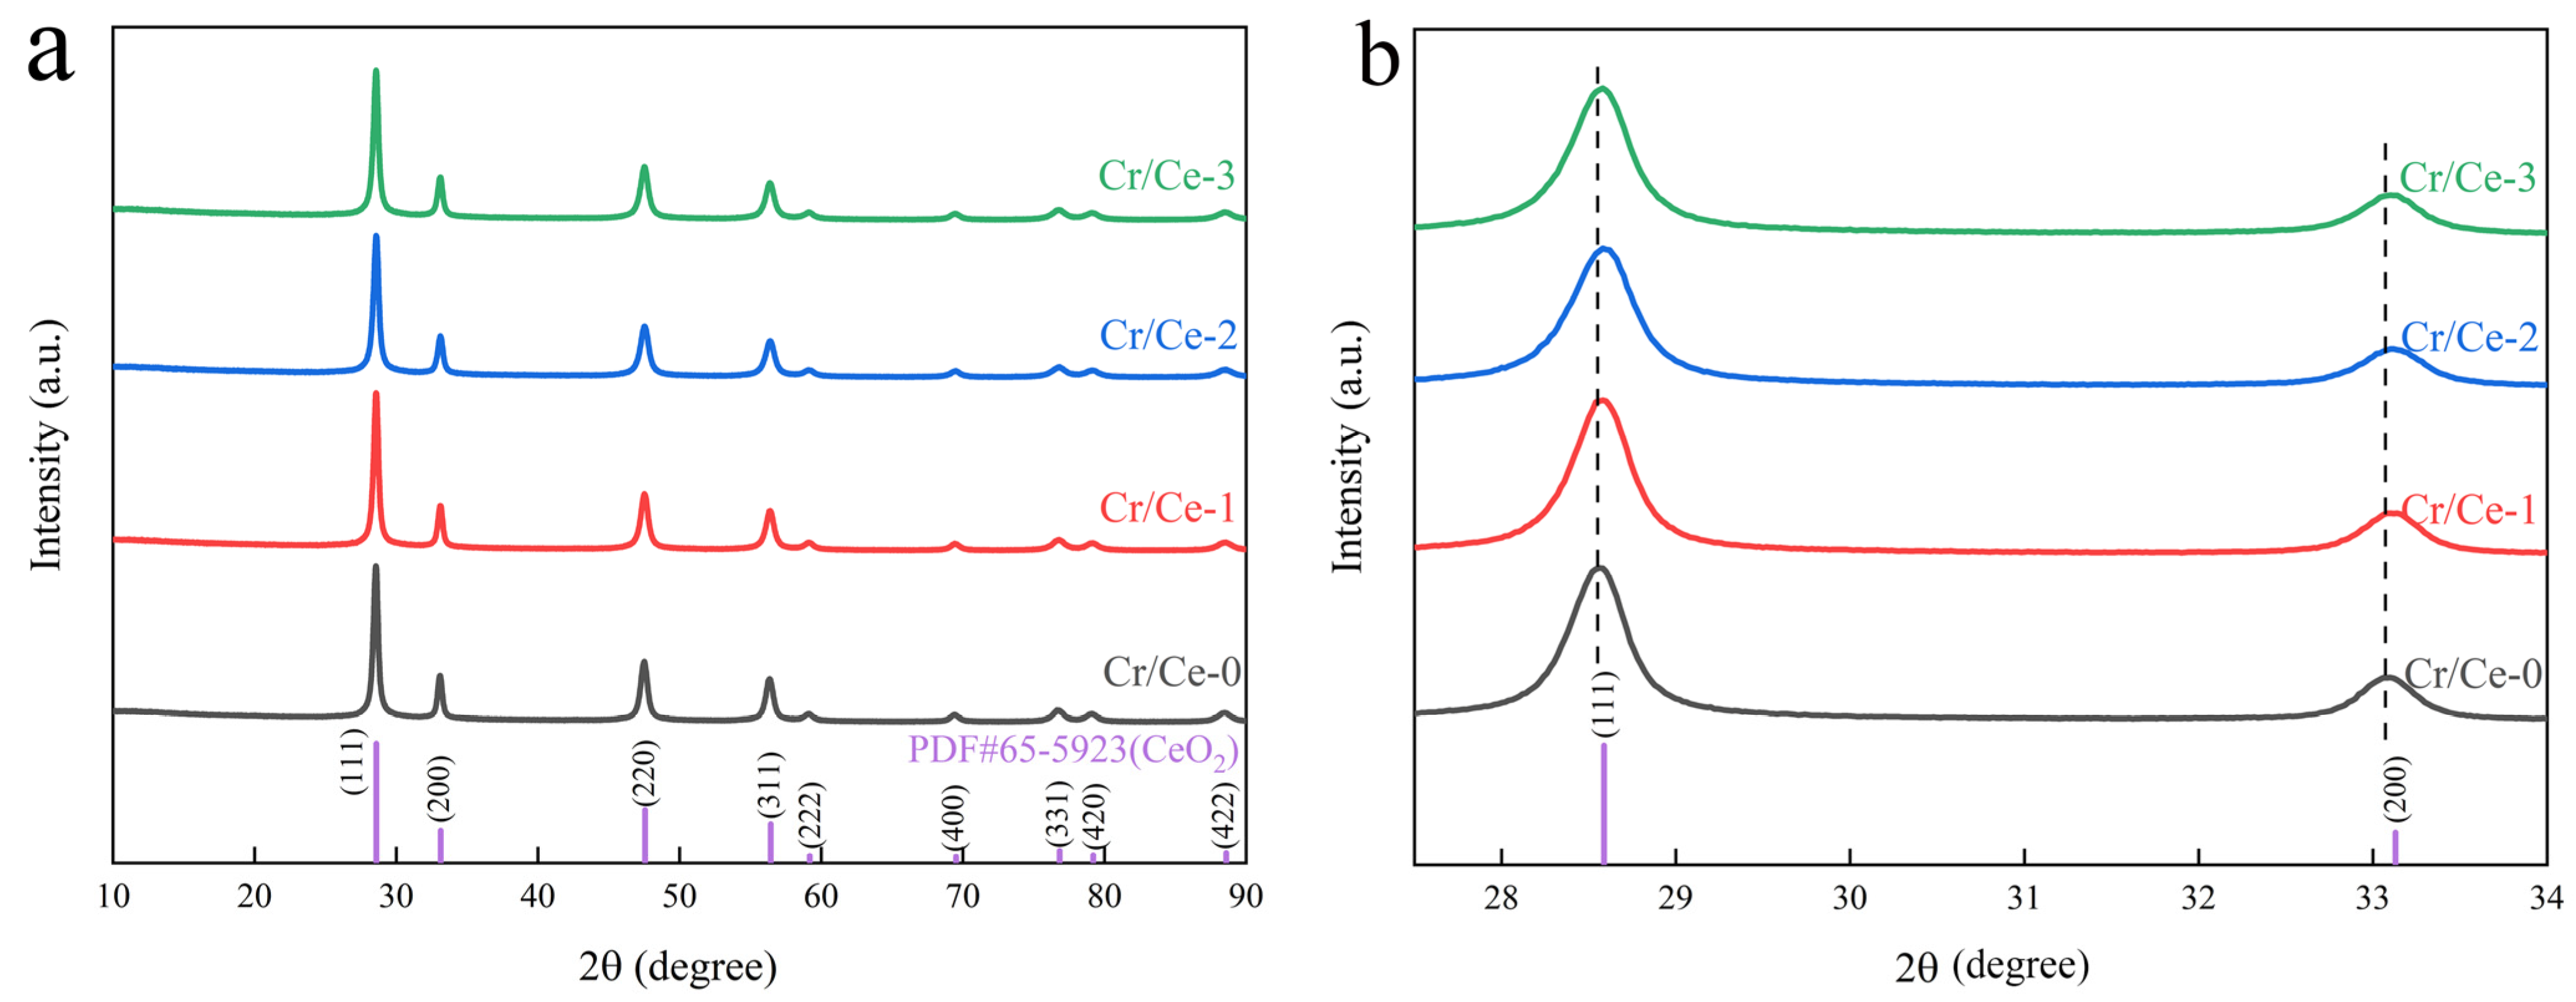
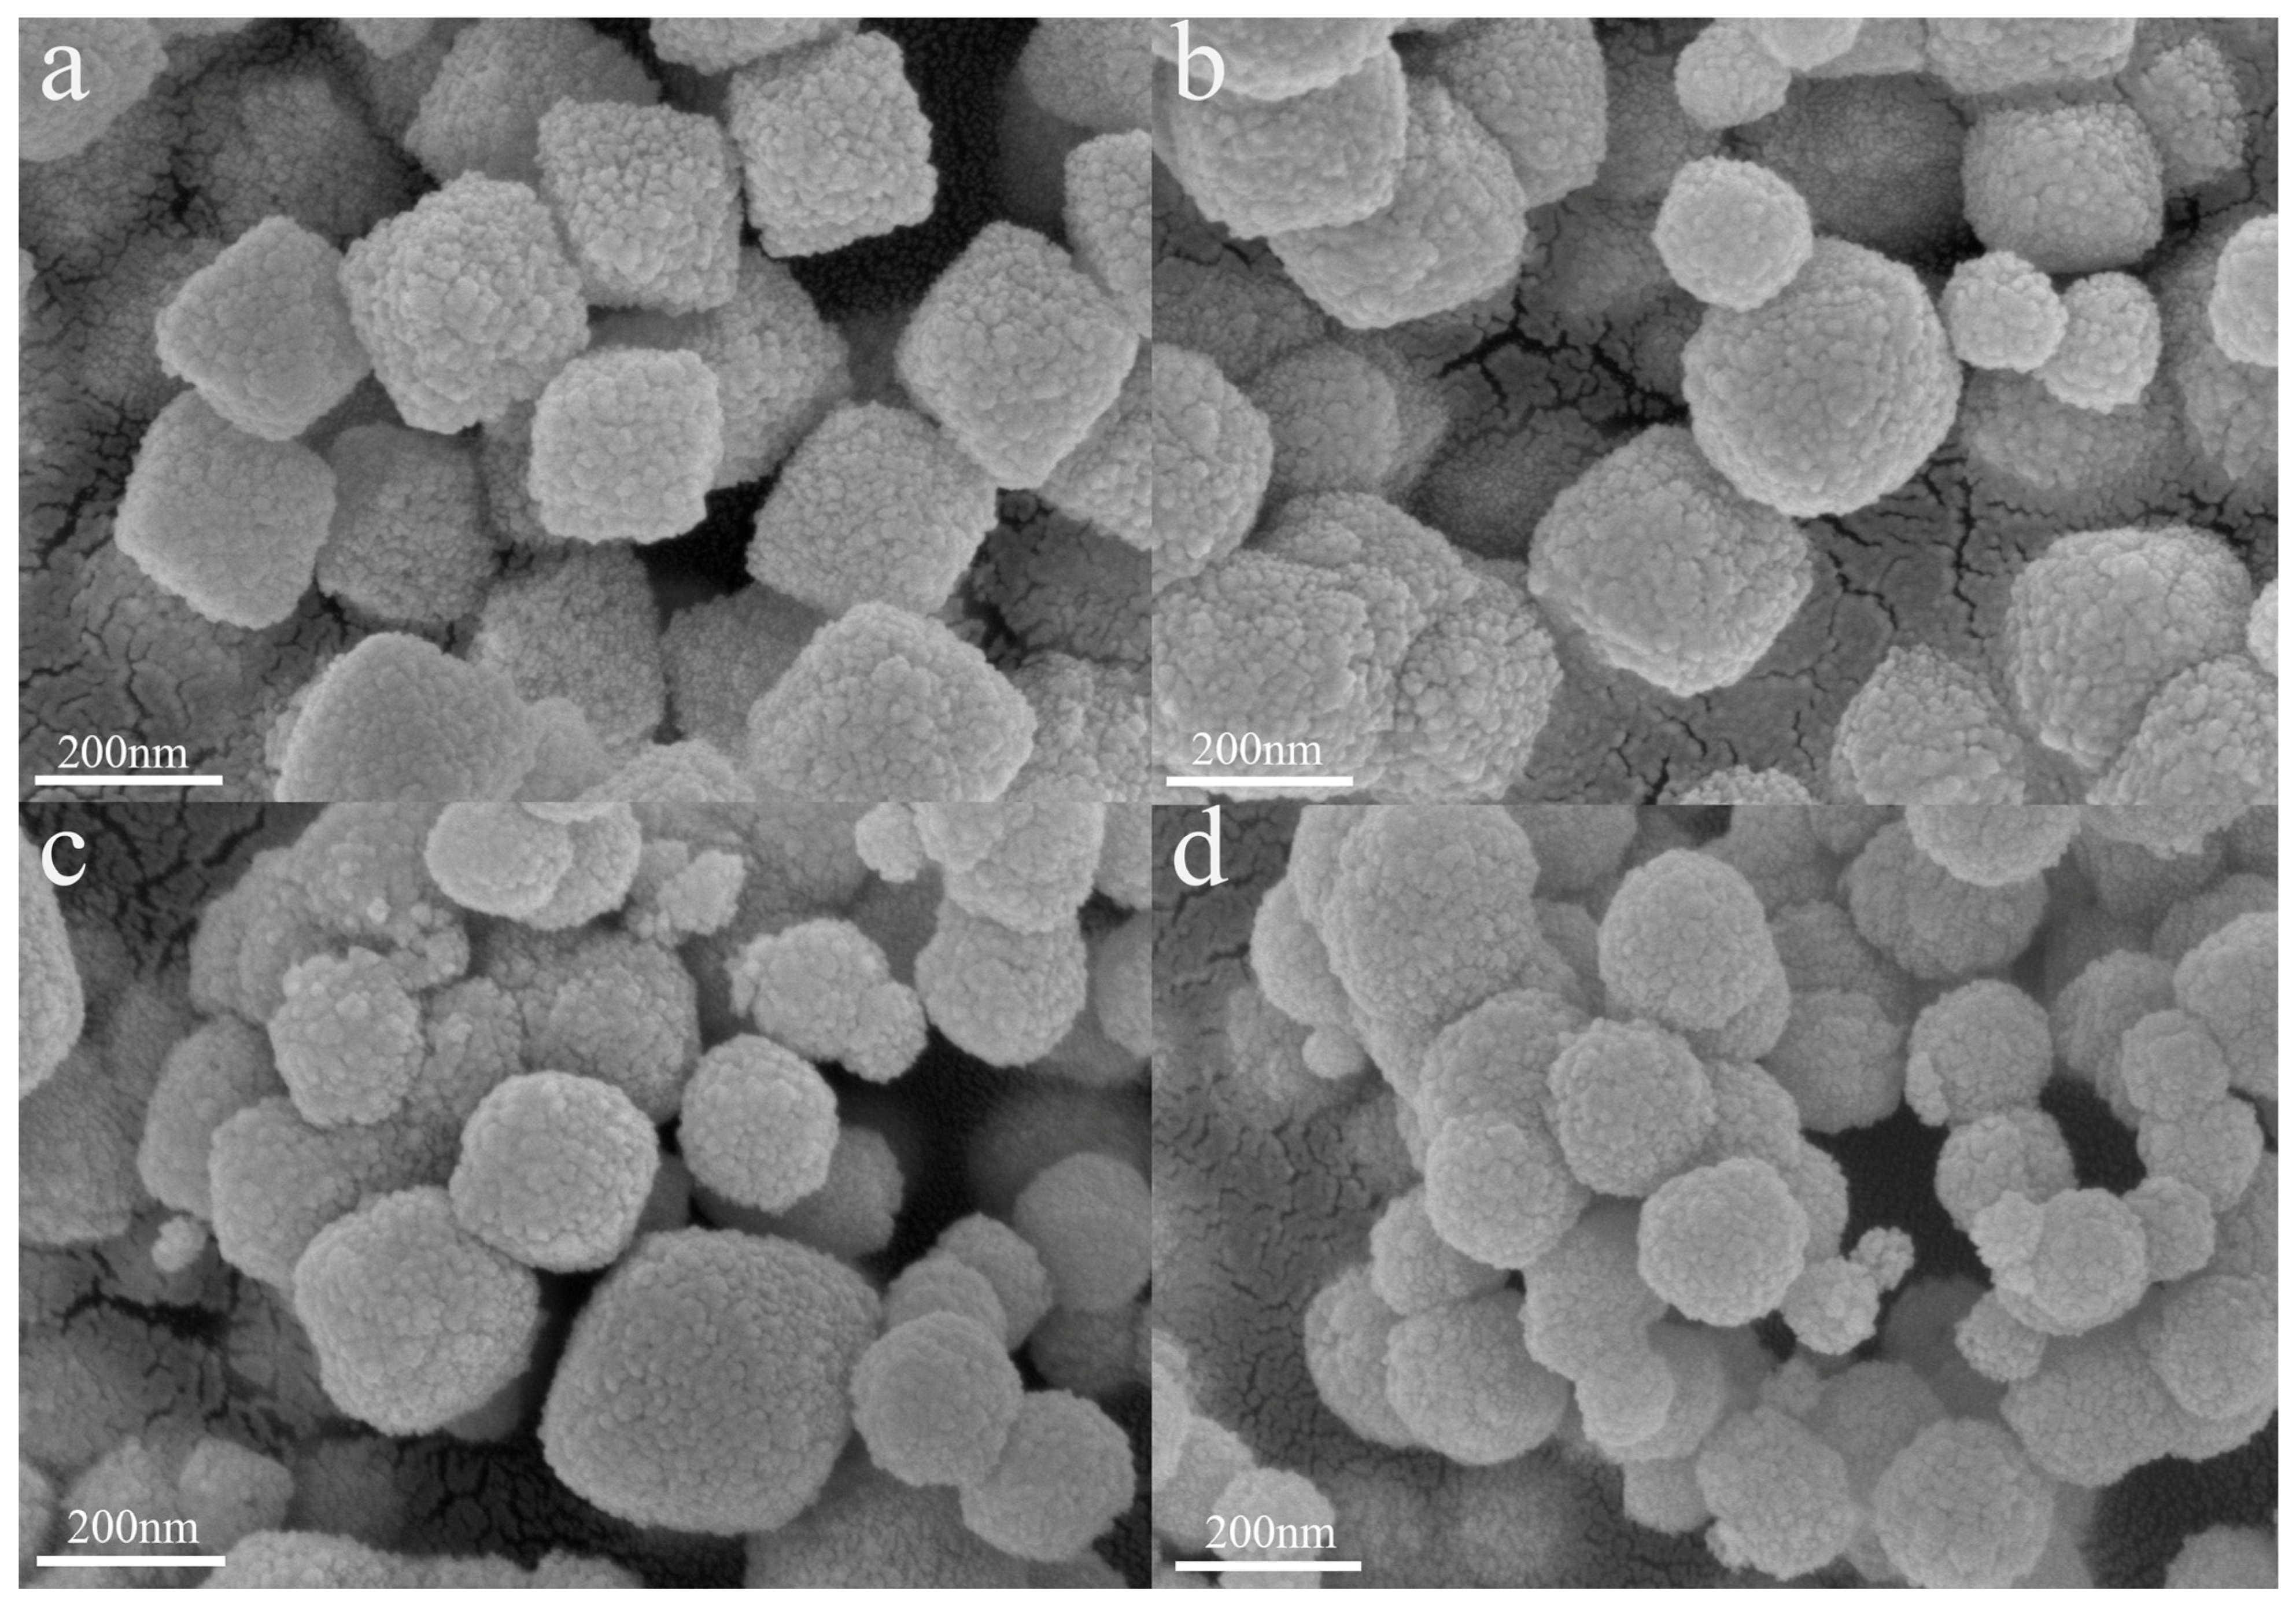
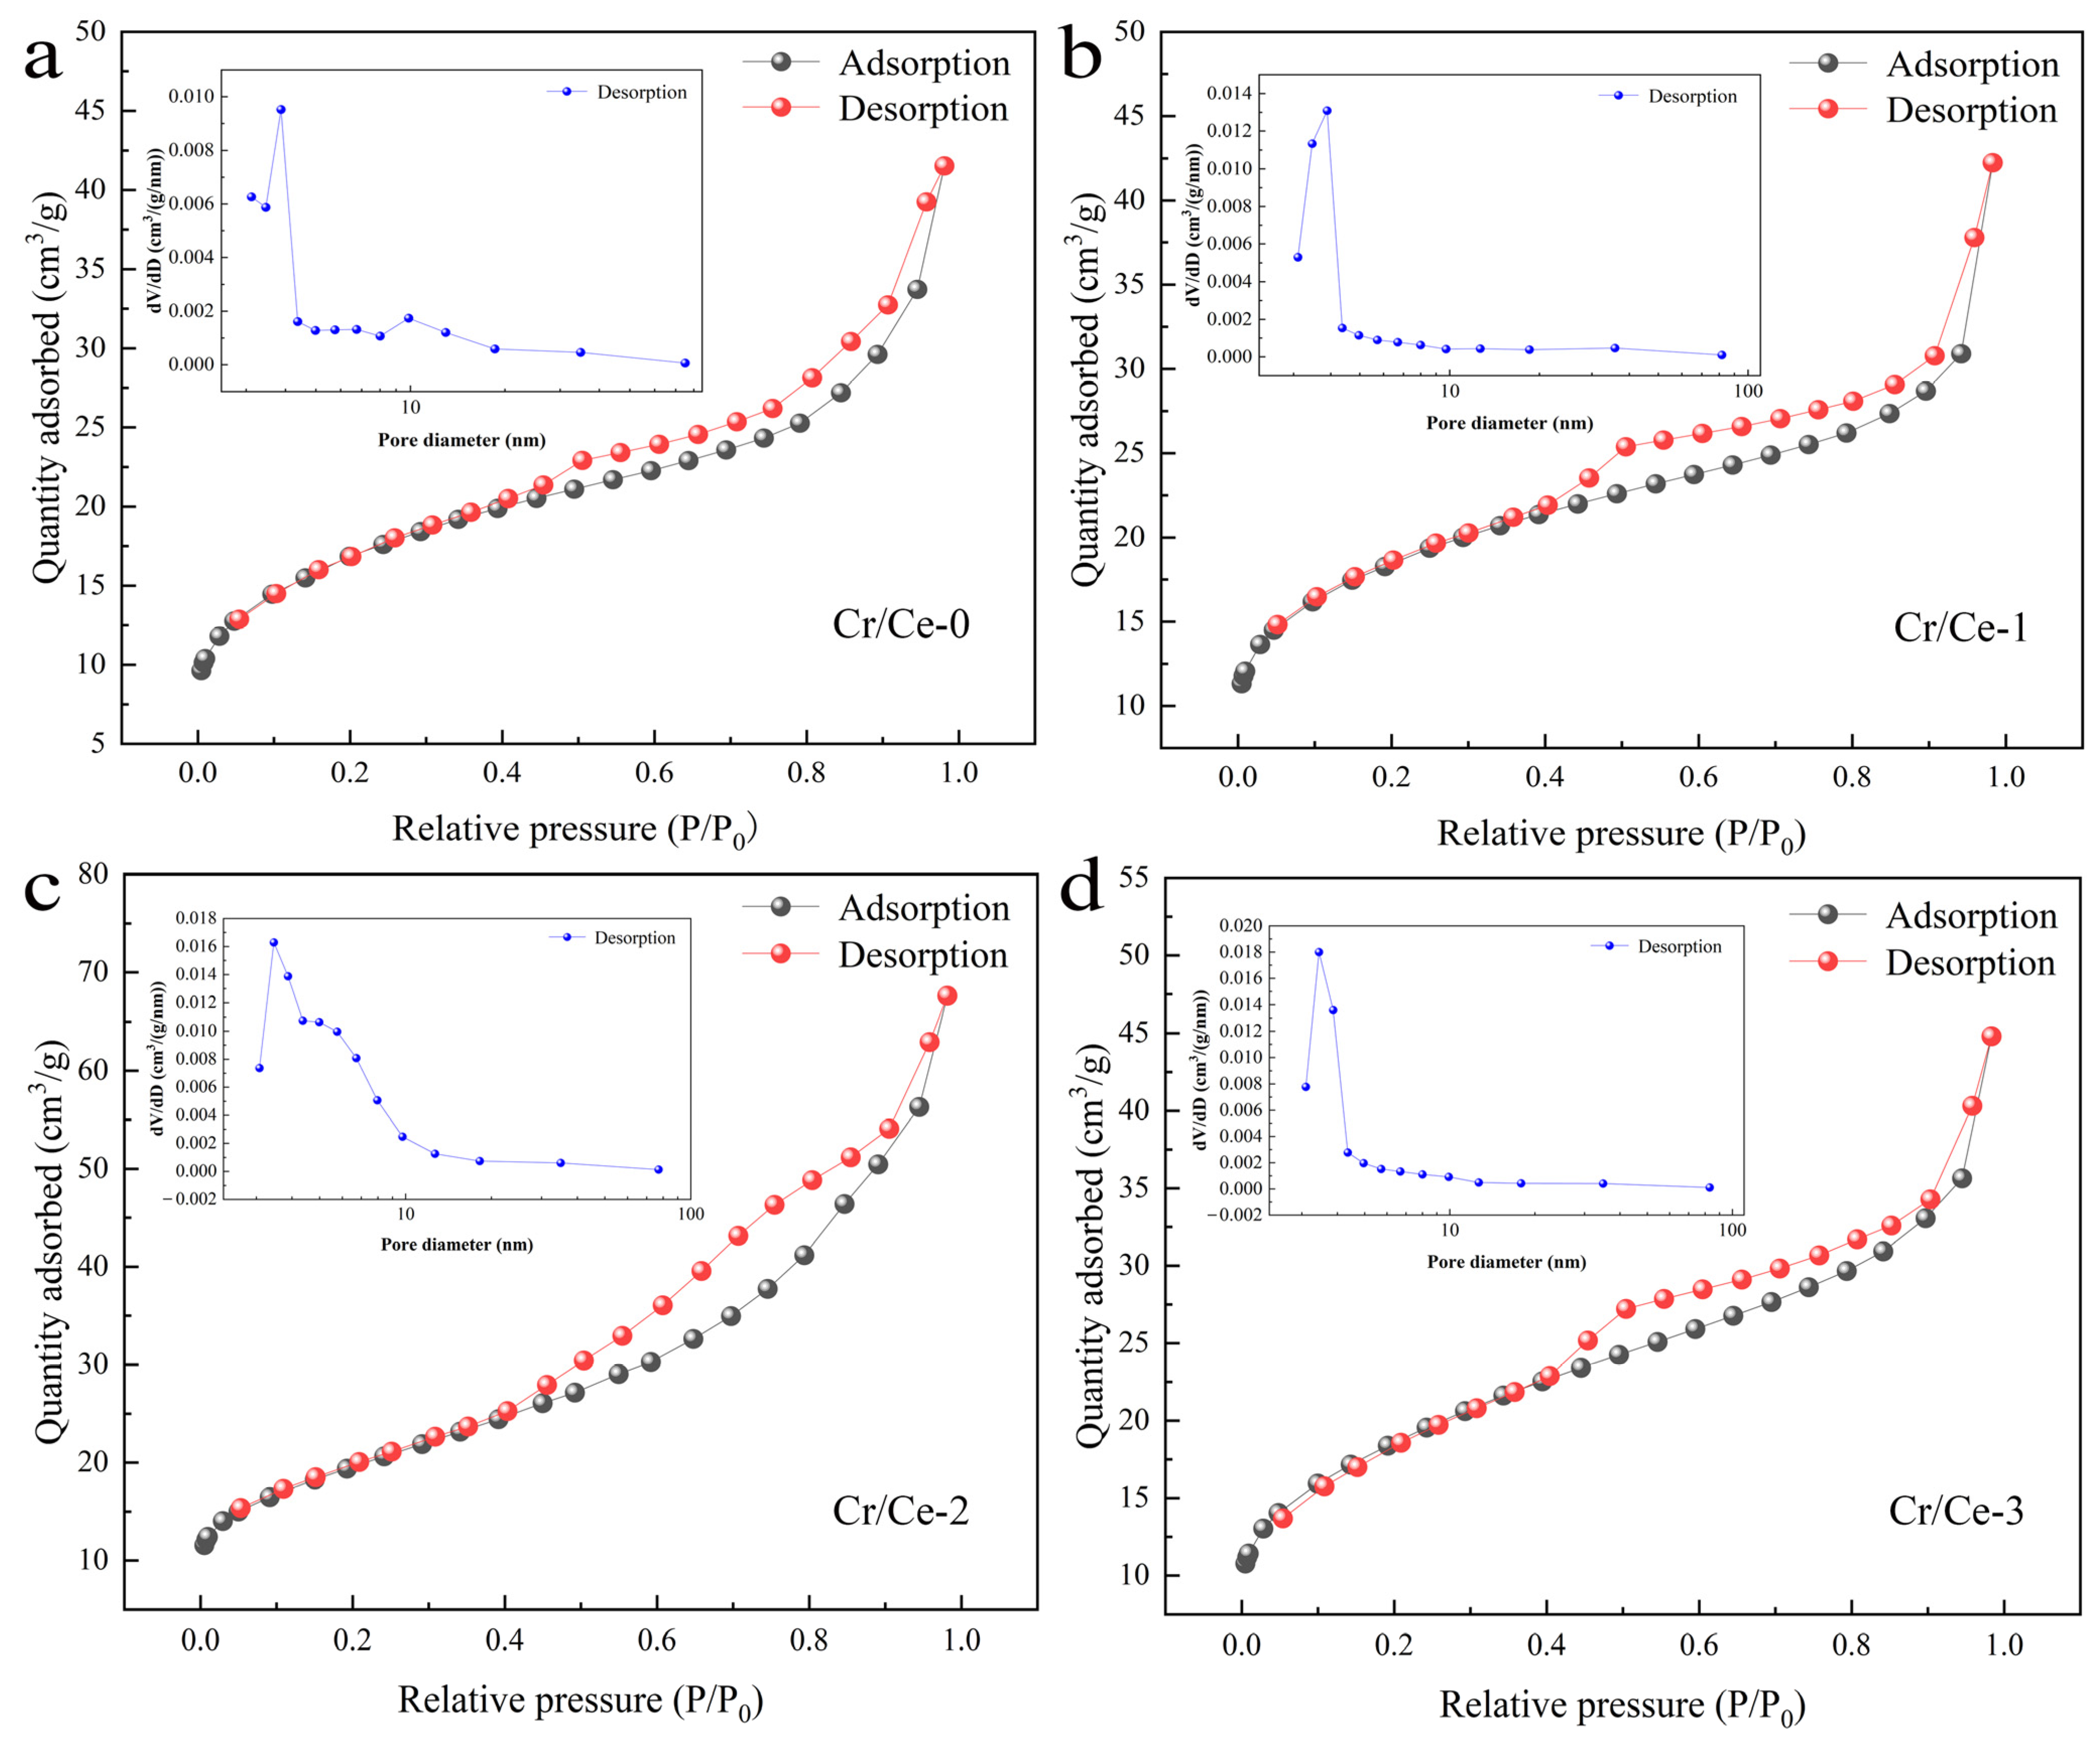
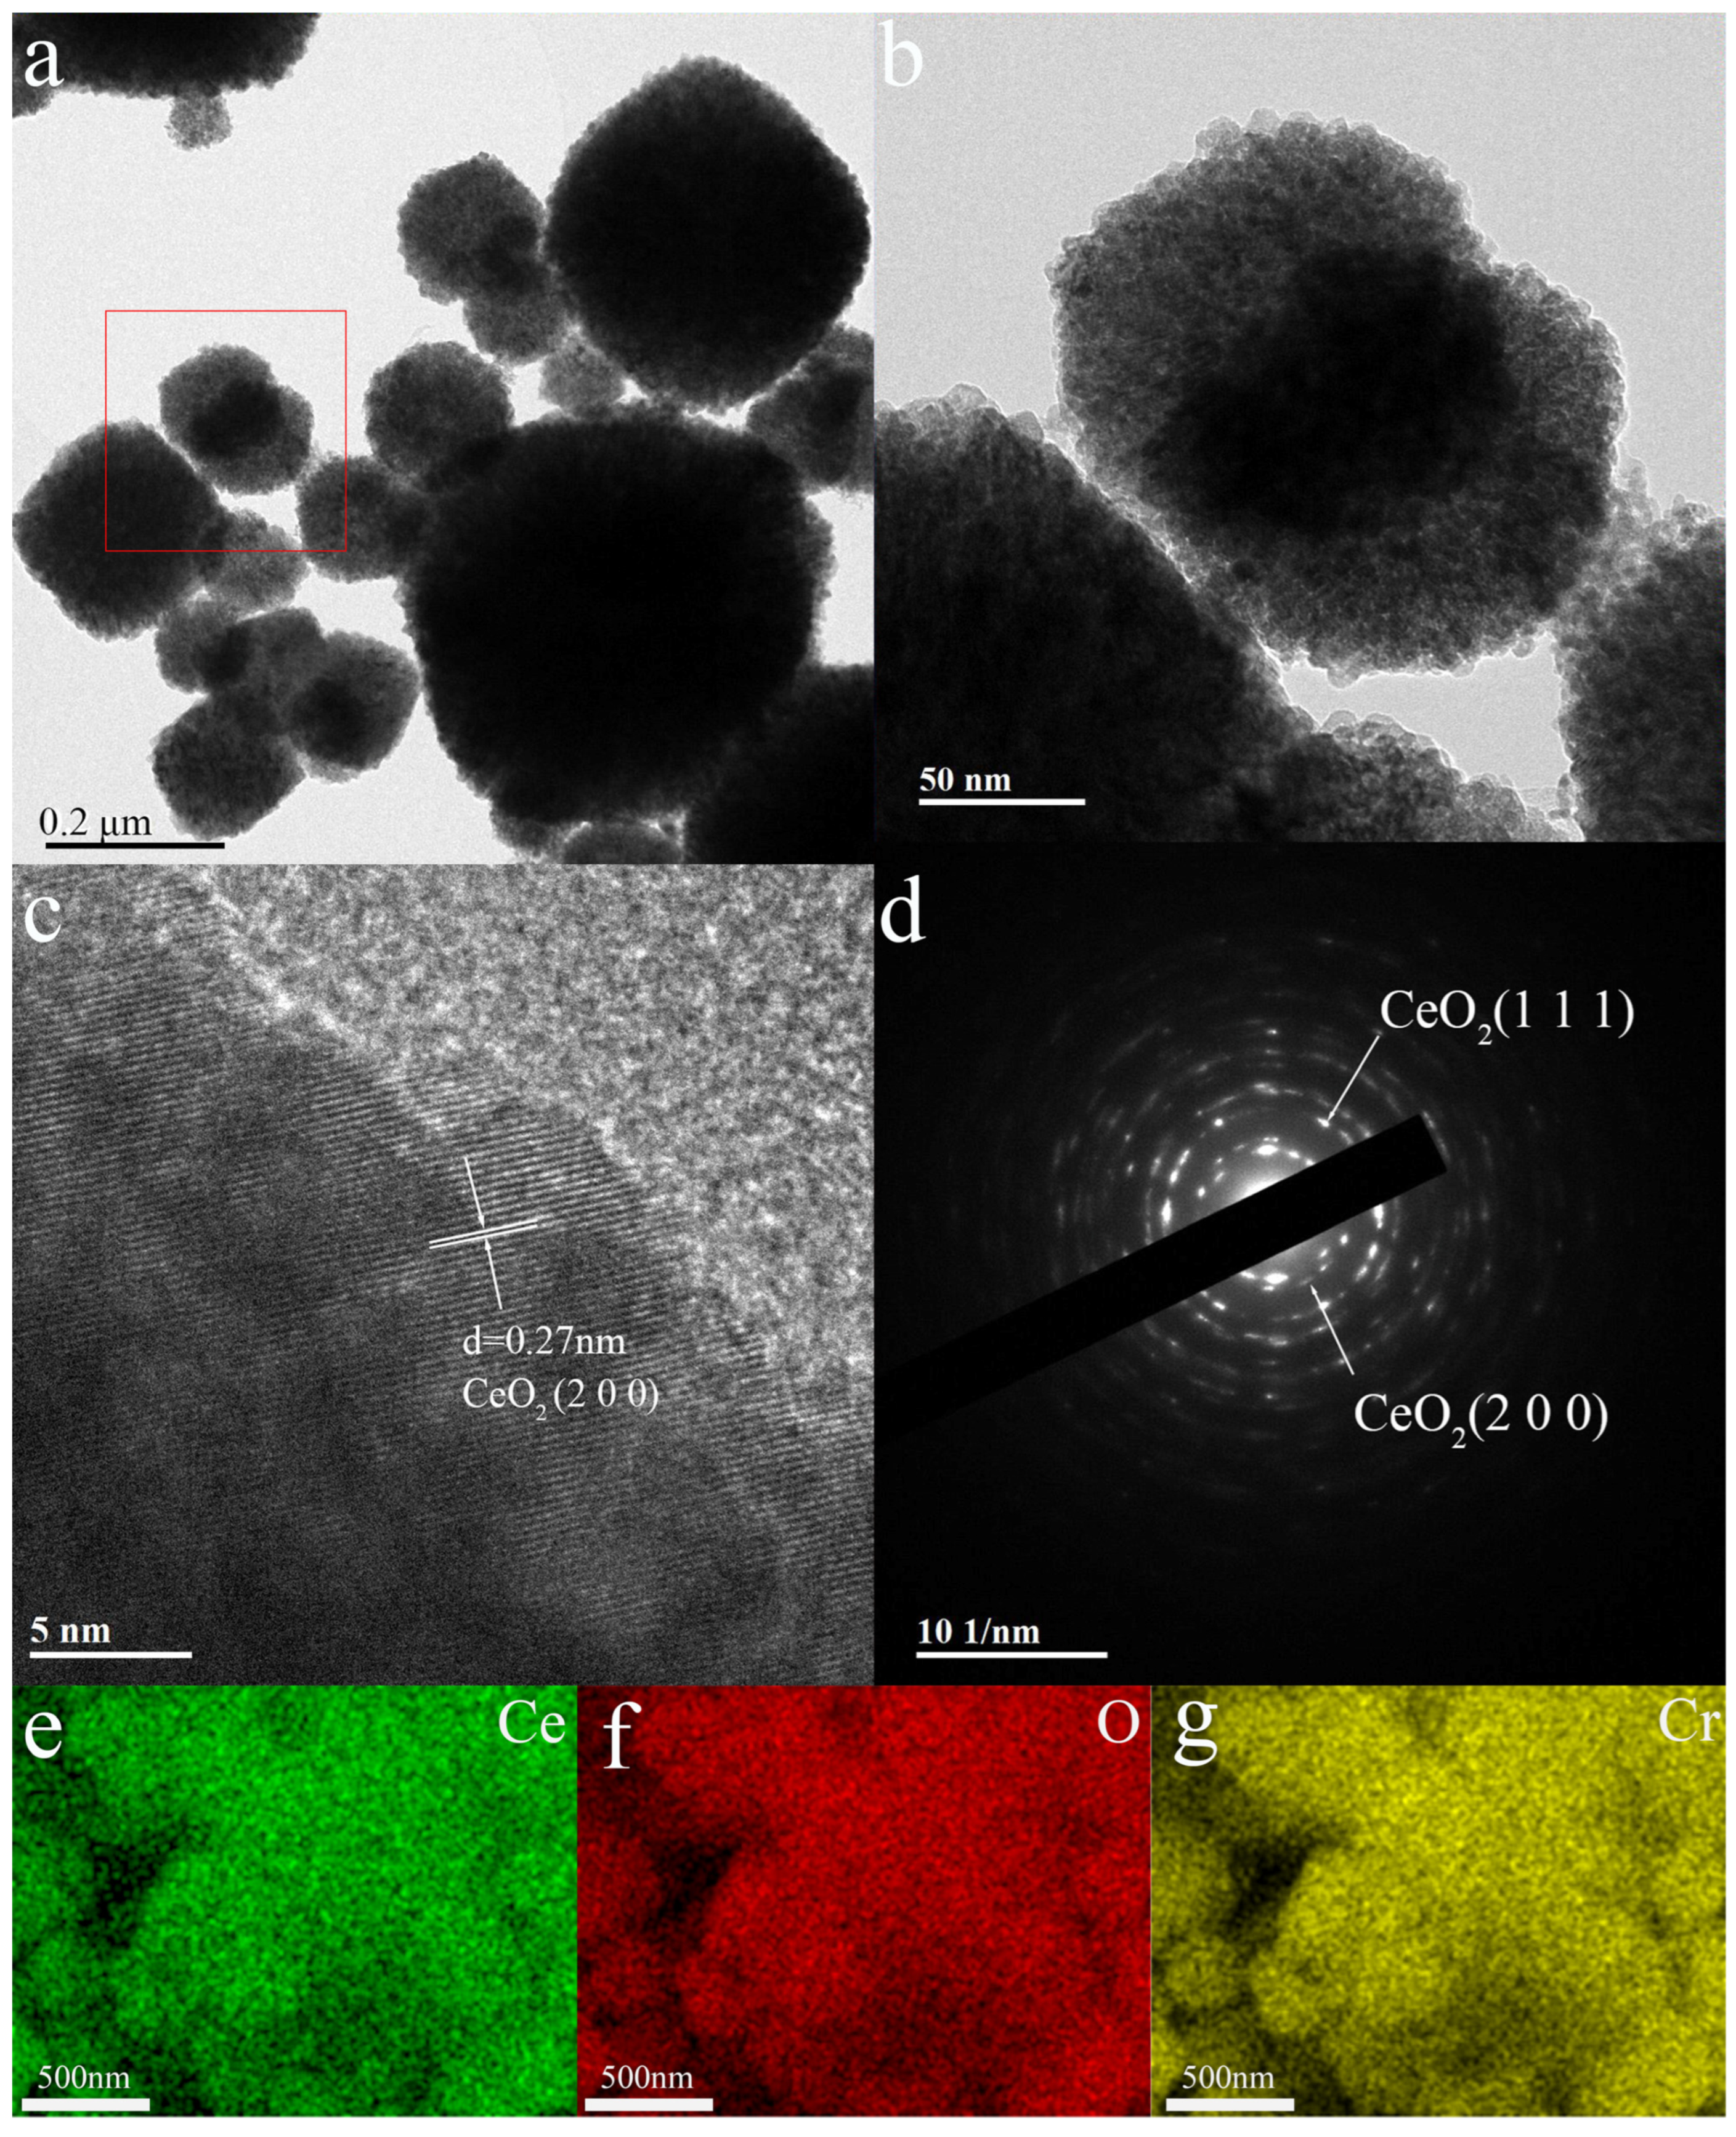
3.1. Material Structure and Morphology
3.2. Gas Sensing Performances
4. Conclusions
Author Contributions
Funding
Institutional Review Board Statement
Informed Consent Statement
Data Availability Statement
Conflicts of Interest
References
- Jiang, L.; Cui, Q.; Zhang, R. Highly Sensitive and Selective n-Butanol Sensor Based on NiO Nanosheet/Bulk ZnSnO3 pn Heterojunction. IEEE Sens. J. 2023, 23, 13640–13647. [Google Scholar] [CrossRef]
- Ji, H.; Zeng, W.; Li, Y. Gas sensing mechanisms of metal oxide semiconductors: A focus review. Nanoscale 2019, 11, 22664–22684. [Google Scholar] [CrossRef] [PubMed]
- Li, X.; Li, Z.; Chen, Y.; Zhao, K.; Jiang, Y.; Di, Y.; Liu, Y.; Zhou, C. High-sensitivity CO electrochemical gas sensor based on a superconductive C-loaded CuO-CeO2 nanocomposite sensing material. Mater. Sci. Eng. B 2021, 271, 115272. [Google Scholar] [CrossRef]
- Li, P.; Chen, X.; Li, Y.; Schwank, J.W. A review on oxygen storage capacity of CeO2-based materials: Influence factors, measurement techniques, and applications in reactions related to catalytic automotive emissions control. Catal. Today 2019, 327, 90. [Google Scholar] [CrossRef]
- An, H.; Liu, L.; Song, N.; Zhu, H.; Tang, Y. Rational design and synthesis of cerium dioxide-based nanocomposites. Nano Res. 2023, 16, 3622. [Google Scholar] [CrossRef]
- Ema, T.; Choi, P.G.; Takami, S.; Masuda, Y. Facet-controlled Synthesis of CeO2 nanoparticles for high-performance CeO2 nanoparticle/SnO2 nanosheet hybrid gas sensors. ACS Appl. Mater. Interfaces 2022, 14, 56998. [Google Scholar] [CrossRef]
- Jin, C.; Kim, S.; Kim, D.E.; Mirzaei, A.; Roh, J.W.; Choi, S.W.; Choi, M.S. Gadolinium-doped CeO2 gas sensor for H2S sensing. J. Metals Mater. 2023, 61, 414. [Google Scholar] [CrossRef]
- Yin, F.; Li, Y.; Yue, W.; Gao, S.; Zhang, C.; Chen, Z. Sn3O4/rGO heterostructure as a material for formaldehyde gas sensor with a wide detecting range and low operating temperature. Sens. Actuators B Chem. 2020, 312, 127954. [Google Scholar] [CrossRef]
- Li, P.; Wang, B.; Wang, Y. Ultrafast CO sensor based on flame-annealed porous CeO2 nanosheets for environmental application. J. Inorg. Mater. 2021, 36, 1223. [Google Scholar] [CrossRef]
- Lai, T.; Chen, G.; Hsiao, Y. Micro-electromechanical system gas sensors based on CeO2 nanoparticles. Sens. Mater. 2023, 35, 1141. [Google Scholar]
- Degler, D.; Weimar, U.; Barsan, N. Current understanding of the fundamental mechanisms of doped and loaded semiconducting metal-oxide-based gas sensing materials. ACS Sens. 2019, 4, 2228–2249. [Google Scholar] [CrossRef] [PubMed]
- Cabot, A.; Arbiol, J.; Morante, J.R.; Weimar, U.; Barsan, N.; Göpel, W. Analysis of the noble metal catalytic additives introduced by impregnation of as obtained SnO2 sol–gel nanocrystals for gas sensors. Sens. Actuators B Chem. 2000, 70, 87–100. [Google Scholar] [CrossRef]
- Ahmad, N.; Umar, A.; Kumar, R.; Alam, M. Microwave-assisted synthesis of ZnO doped CeO2 nanoparticles as potential scaffold for highly sensitive nitroaniline chemical sensor. Ceram. Int. 2016, 42, 11562. [Google Scholar] [CrossRef]
- Aboud, A.A.; Al-Kelesh, H.; Rouby, W.E.; Farghali, A.A.; Hamdedein, A.; Khedr, M.H. CO2 responses based on pure and doped CeO2 nano-pellets. J. Mater. Res. Technol. 2018, 7, 14. [Google Scholar] [CrossRef]
- Zakaria, S.A.; Samadi, S.; Cordshooli, G.A. Synthesis and characterization of zirconium (IV) and vanadium (III) doped CeO2/TiO2 core/shell nanostructures as a gas sensor. Sens. Actuators A Chem. 2021, 318, 112226. [Google Scholar] [CrossRef]
- Li, P.P.; Cao, C.Y.; Shen, Q.K.; Bai, B.; Jin, H.Q.; Yu, J.; Chen, W.M.; Song, W.G. Cr-doped NiO nanoparticles as selective and stable gas sensor for ppb-level detection of benzyl mercaptan. Sens. Actuators B Chem. 2021, 339, 129886. [Google Scholar] [CrossRef]
- Hemalatha, E.; Gopalakrishnan, N. Effect of Cr on ZrO2 nanostructures for gas sensing investigation. Bull. Mater. Sci. 2021, 44, 292. [Google Scholar] [CrossRef]
- Li, Y.; Zhang, B.; Li, J.; Duan, Z.; Yang, Y.; Yuan, Z.; Jiang, Y.; Tai, H. Pd-decorated ZnO hexagonal microdiscs for NH3 sensor. Chemosensors 2024, 12, 43. [Google Scholar] [CrossRef]
- Zhu, Y.; Seong, G.; Noguchi, T.; Yoko, A.; Tomai, T.; Takami, S.; Adschiri, T. Highly Cr-substituted CeO2 nanoparticles synthesized using a non-equilibrium supercritical hydrothermal process: High oxygen storage capacity materials designed for a low-temperature bitumen upgrading process. ACS Appl. Energy Mater. 2020, 3, 4305–4319. [Google Scholar] [CrossRef]
- Phokha, S.; Prabhakaran, D.; Boothroyd, A.; Pinitsoontorn, S.; Maensiri, S. Ferromagnetic induced in Cr-doped CeO2 particles. Microelectron. Eng. 2014, 126, 93–98. [Google Scholar] [CrossRef]
- Guo, J.; Ma, S.; Ma, N.; Liu, J.; Wei, J.; Xu, C.; Fan, G.; Ni, P. Hydrothermal synthesis of NdFeO3 nanoparticles and their high gas-sensitive properties. Ceram. Int. 2024, 50, 43654–43664. [Google Scholar] [CrossRef]
- Dong, Z.; Hu, Q.; Liu, H.; Wu, Y.; Ma, Z.; Fan, Y.; Li, R.; Xu, J.; Wang, X. 3D flower-like Ni doped CeO2 based gas sensor for H2S detection and its sensitive mechanism. Sens. Actuators B Chem. 2022, 357, 131227. [Google Scholar] [CrossRef]
- Oosthuizen, D.N.; Motaung, D.E.; Swart, H.C. Gas sensors based on CeO2 nanoparticles prepared by chemical precipitation method and their temperature-dependent selectivity towards H2S and NO2 gases. Appl. Surf. Sci. 2020, 505, 144356. [Google Scholar] [CrossRef]
- Schubert, D.; Dargusch, R.; Raitano, J.; Chan, S.W. Cerium and yttrium oxide nanoparticles are neuroprotective. Biochem. Biophys. Res. Commun. 2006, 342, 86. [Google Scholar] [CrossRef] [PubMed]
- Wang, Y.; Liu, B.; Xiao, S.; Wang, X.; Sun, L.; Li, H.; Xie, W.; Li, Q.; Zhang, Q.; Wang, T. Low-Temperature H2S Detection with Hierarchical Cr-Doped WO3 Microspheres. ACS Appl. Mater. Interfaces 2016, 8, 9674–9683. [Google Scholar] [CrossRef] [PubMed]
- Cai, W.; Bu, Y.; Zhao, Y.; Chen, M.; Yu, Y.; Zhong, Q. A simple seed-mediated growth method for the synthesis of highly morphology controlled CrOx/Ce0.2Zr0.8O2 catalysts and their enhanced NO oxidation. Chem. Eng. J. 2017, 317, 376–385. [Google Scholar] [CrossRef]
- Cai, W.; Zhao, Y.; Chen, M.; Jiang, X.; Wang, H.; Ou, M.; Wan, S.; Zhong, Q. The formation of 3D spherical Cr-Ce mixed oxides with roughness surface and their enhanced low-temperature NO oxidation. Chem. Eng. J. 2018, 333, 414–422. [Google Scholar] [CrossRef]
- Jeong, H.M.; Jeong, S.Y.; Kim, J.H.; Kim, B.Y.; Kim, J.S.; Hady, A.F.; Wazzan, A.A.; Turaif, H.A.; Jang, H.W.; Lee, J.H. Gas selectivity control in Co3O4 sensor via concurrent tuning of gas reforming and gas filtering using nanoscale hetero-overlayer of catalytic oxides. ACS Appl. Mater. Interfaces 2017, 9, 41397–41404. [Google Scholar] [CrossRef]
- Yang, J.; Han, W.; Ma, J.; Wang, C.; Shimanoe, K.; Zhang, S.; Sun, Y.; Cheng, P.; Wang, Y.; Zhang, H.; et al. Sn doping effect on NiO hollow nanofibers based gas sensors about the humidity dependence for triethylamine detection. Sens. Actuators B Chem. 2021, 340, 129971. [Google Scholar] [CrossRef]
- Mishra, R.K.; Murali, G.; Kim, T.H.; Kim, J.H.; Lim, Y.J.; Kim, B.S.; Sahay, P.P.; Leel, S.H. Nanocube In2O3@RGO heterostructure based gas sensor for acetone and formaldehyde detection. RSC Adv. 2017, 7, 38714–38724. [Google Scholar] [CrossRef]
- Meng, F.; Liao, Z.; Xing, C.; Yuan, Z.; Zhang, R.; Zhu, H.; Li, J. Preparation of SnO2/SiO2 nanocomposites by sol-gel method for enhancing the gas sensing performance to triethylamine. J. Alloys Compds. 2022, 893, 162189. [Google Scholar] [CrossRef]
- Liao, Z.; Yuan, Z.; Meng, F. A highly selective and fast-responding triethylamine sensor based on Mo-SnO2 nanomaterials. Sens. Actuators B Chem. 2022, 4, 100106. [Google Scholar] [CrossRef]
- Zhang, J.; Chen, Y.; Li, L.; Chen, X.; An, W.; Qian, X.; Tao, Y. LaMnO3/Co3O4 nanocomposite for enhanced triethylamine sensing properties. J. Rare Earths 2024, 42, 733–742. [Google Scholar] [CrossRef]
- Jawaher, K.R.; Indirajith, R.; Krishnan, S.; Robert, R.; Pasha, S.; Deshmukh, K.; Das, S.J. Hydrothermal synthesis of CeO2-SnO2 nanocomposites with highly enhanced gas sensing performance towards n-butanol. J. Sci. Adv. Mater. Devices 2018, 3, 139. [Google Scholar] [CrossRef]
- Ling, W.; Lu, W.; Wang, J.; Niu, G.; Zhu, D. Hydrothermal synthesis and characterization of Ag2O/CeO2 modified 3D flower-like ZnO as the N-butanol-sensing. Mater. Sci. Semicond. Process. 2021, 133, 105937. [Google Scholar] [CrossRef]
- Wang, T.; Liu, T.; Li, W.; Hao, X.; Lu, Q.; Yu, H.; Liang, X.; Liu, F.; Liu, F.; Wang, C.; et al. Triethylamine sensing with a mixed potential sensor based on Ce0.8Gd0.2O1.95 solid electrolyte and La1-xSrxMnO3 (x = 0.1, 0.2, 0.3) sensing electrodes. Sens. Actuators B Chem. 2021, 327, 128830. [Google Scholar] [CrossRef]
- Yao, X.; He, Y.; Fu, S.; Yang, X.; Cui, S.; Cheng, L.; Pan, Y.; Jiao, Z. Bimetallic MOF-derived CeO2/Co3O4 microflowers with synergy of oxygen vacancy and p-n heterojunction for high-performance n-butanol sensors. Mater. Today 2022, 33, 104445. [Google Scholar] [CrossRef]
- Zhang, Q.; Ma, Q.; Wang, X.; Wang, Y.; Zhao, D. Surface double oxygen defect engineering in button-shaped porous CeO2/WO2.9 heterostructures for excellent n-butanol detection at room temperature. Appl. Surf. Sci. 2023, 616, 156536. [Google Scholar] [CrossRef]
- Kumar, D.K.; Bharathi, P.; Govind, A.; Archana, J.; Navaneethan, M.; Harish, S. Detection of NO2 at ppm-level using Al-doped CeO2 based gas sensor with high sensitivity and selectivity at room temperature. J. Environ. Chem. Eng. 2024, 12, 112253. [Google Scholar] [CrossRef]
- Chen, Y.; Xiao, G.; Wang, T.; Zhang, F.; Ma, Y.; Gao, P.; Zhu, C.; Zhang, E.; Xu, Z.; Li, Q. Synthesis and enhanced gas sensing properties of crystalline CeO2/TiO2 core/shell nanorods. Sens. Actuators B Chem. 2011, 156, 867. [Google Scholar] [CrossRef]
- Wang, B.; Jin, H.; Zheng, Z.; Zhou, Y.; Gao, C. Low-temperature and highly sensitive C2H2 sensor based on Au decorated ZnO/In2O3 belt-tooth shape nano-heterostructures. Sens. Actuators B Chem. 2017, 244, 344. [Google Scholar] [CrossRef]
- Manikandan, V.; Kadian, A.; Singh, A.; Annapoorni, S. Ultrasensitive HCHO sensor based on Cr-doped cerium oxide nanoparticles with full recoverability and decisive anti-humidity ability. Surf. Interfaces 2024, 44, 103598. [Google Scholar] [CrossRef]
- Yu, S.; Jia, X.; Yang, J.; Wang, S.; Li, Y.; Song, H. Highly sensitive and low detection limit of ethanol gas sensor based on CeO2 nanodot-decorated ZnSnO3 hollow microspheres. Ceram. Int. 2022, 48, 14865. [Google Scholar] [CrossRef]
- Duan, X.; Jiang, Y.; Liu, B.; Duan, Z.; Zhang, Y.; Yuan, Z.; Tai, H. Enhancing the carbon dioxide sensing performance of LaFeO3 by Co doping. Sens. Actuators B Chem. 2024, 402, 135136. [Google Scholar] [CrossRef]
- Zhang, Y.; Jiang, Y.; Yuan, Z.; Liu, B.; Zhao, Q.; Huang, Q.; Li, Z.; Zeng, W.; Duan, Z.; Tai, H. Synergistic effect of electron scattering and space charge transfer enabled unprecedented room temperature NO2 sensing response of SnO2. Small 2023, 19, 2303631. [Google Scholar] [CrossRef] [PubMed]


| Material | OV |
|---|---|
| Cr/Ce-0 | 11.38% |
| Cr/Ce-1 | 17.59% |
| Cr/Ce-2 | 30.17% |
| Cr/Ce-3 | 12.66% |
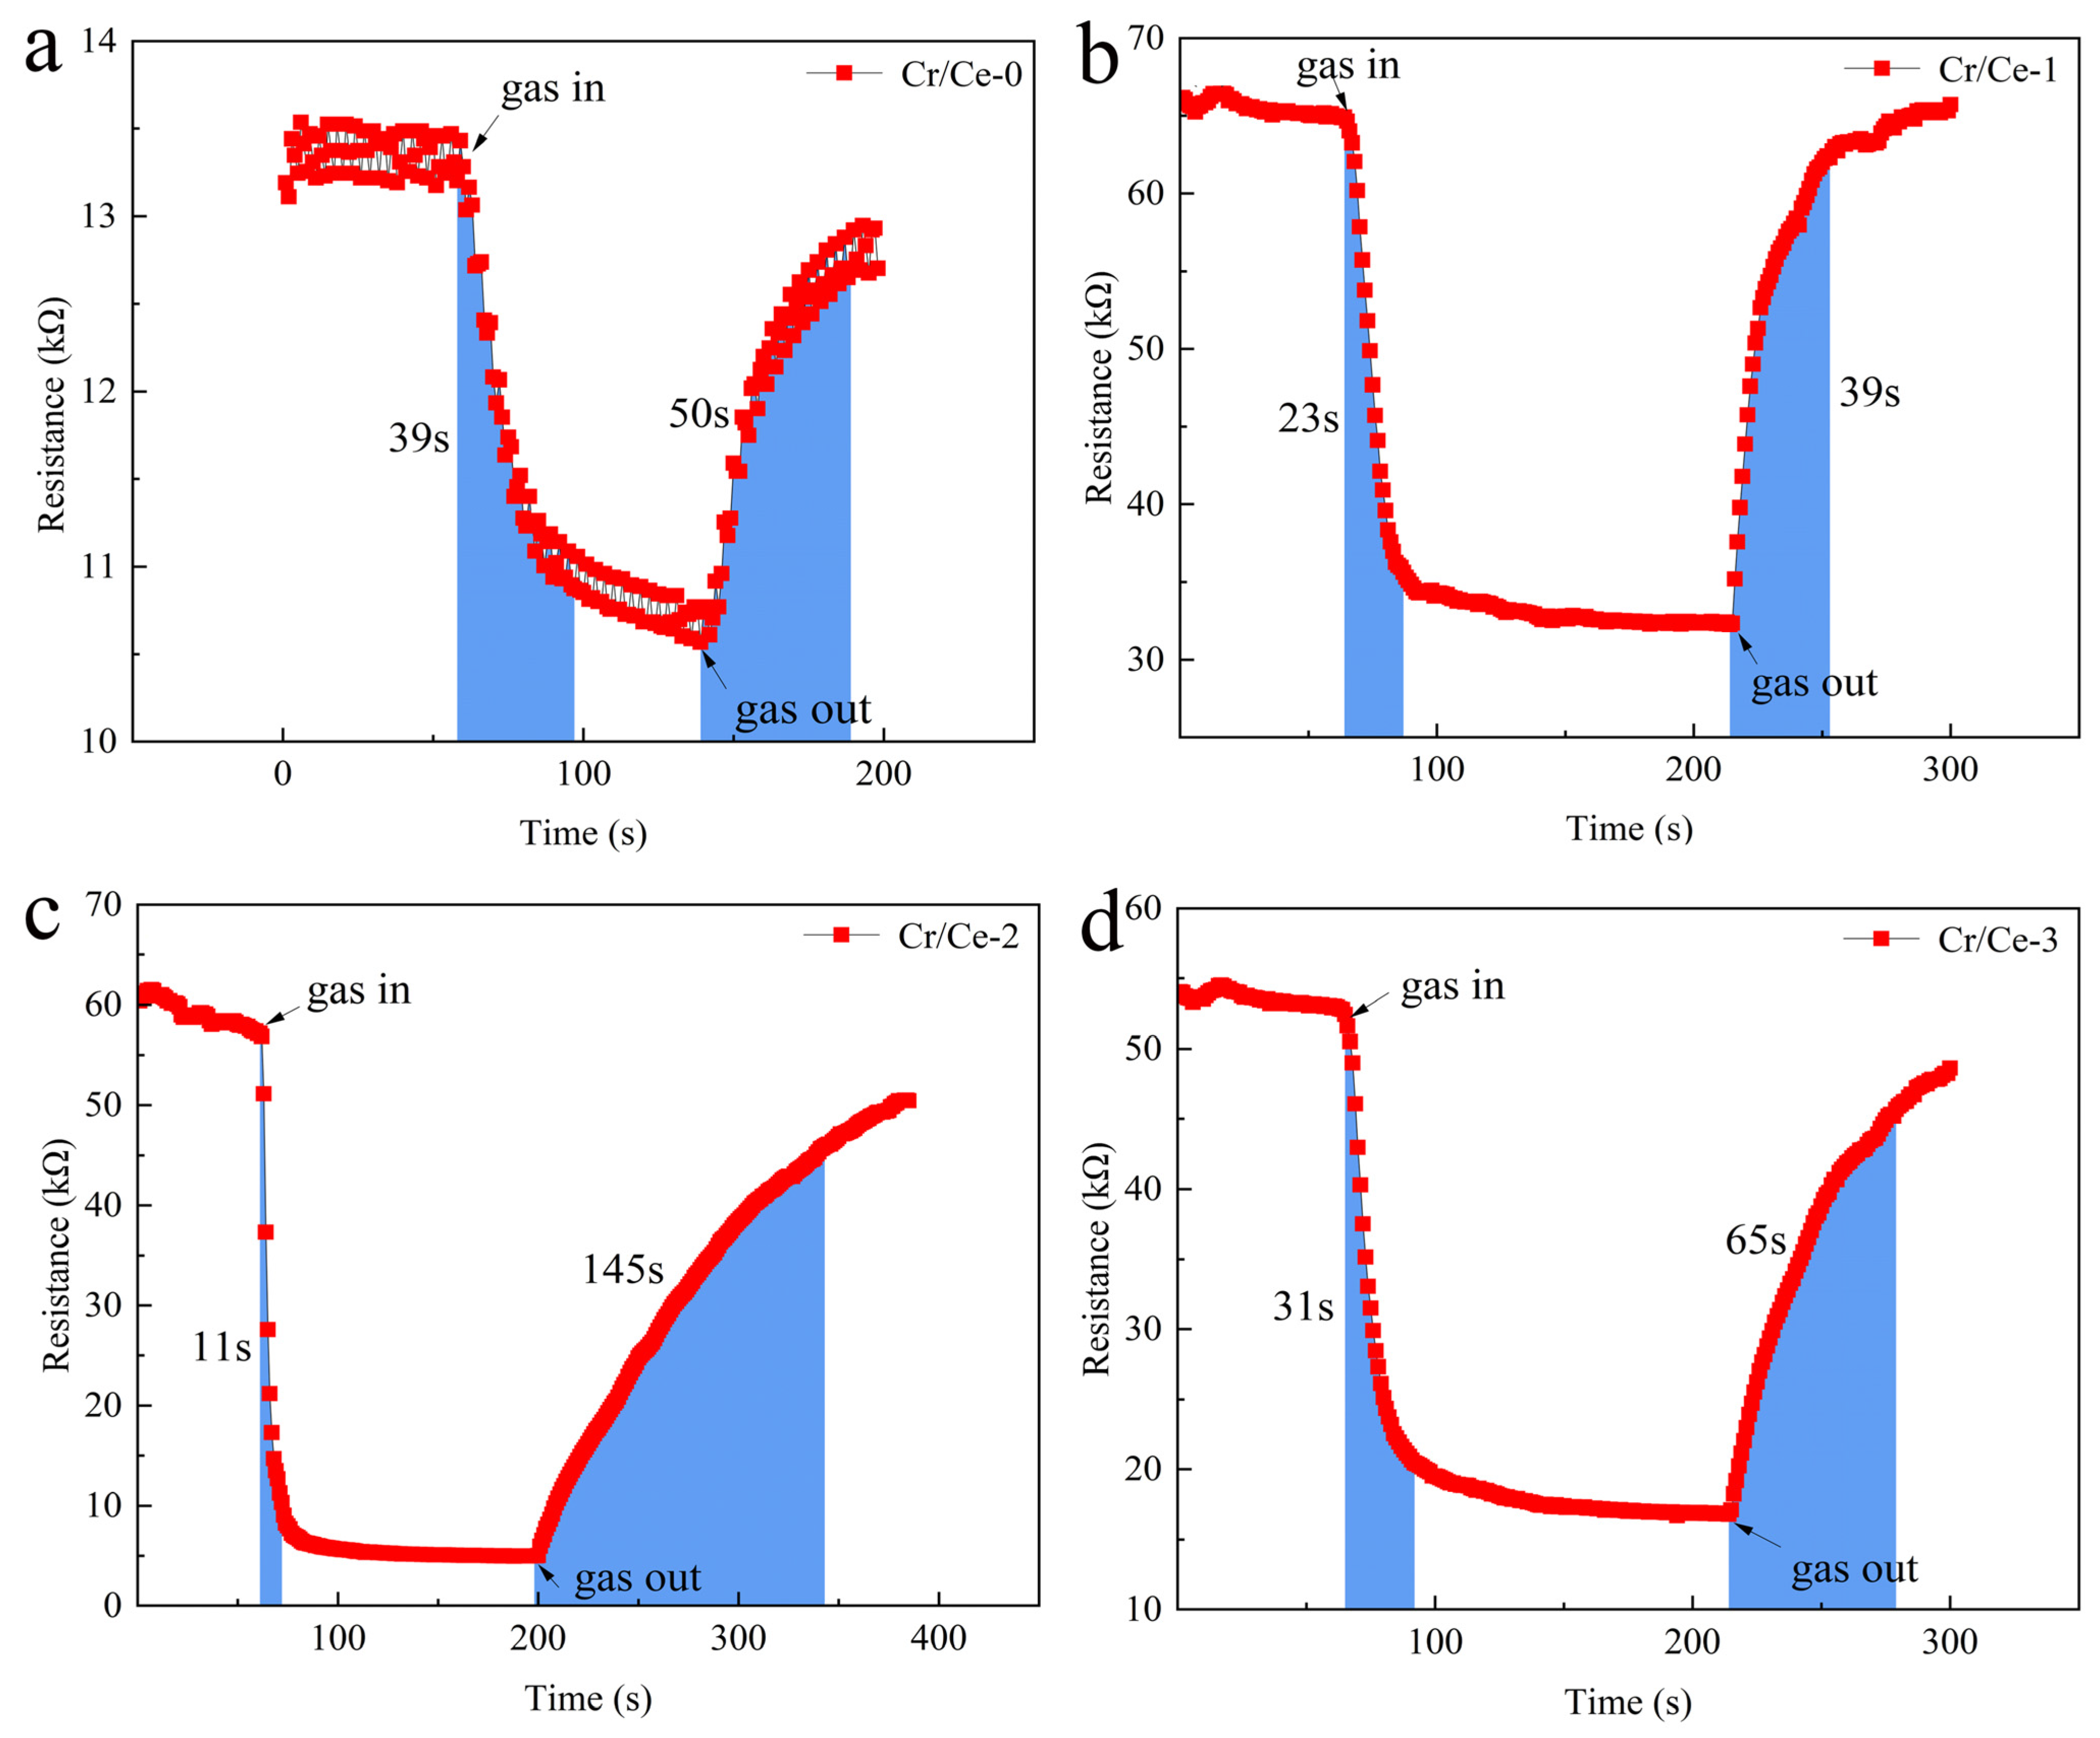
| Material | Response Time (s) | Recovery Times (s) |
|---|---|---|
| Cr/Ce-0 | 39 | 50 |
| Cr/Ce-1 | 23 | 39 |
| Cr/Ce-2 | 11 | 145 |
| Cr/Ce-3 | 31 | 65 |
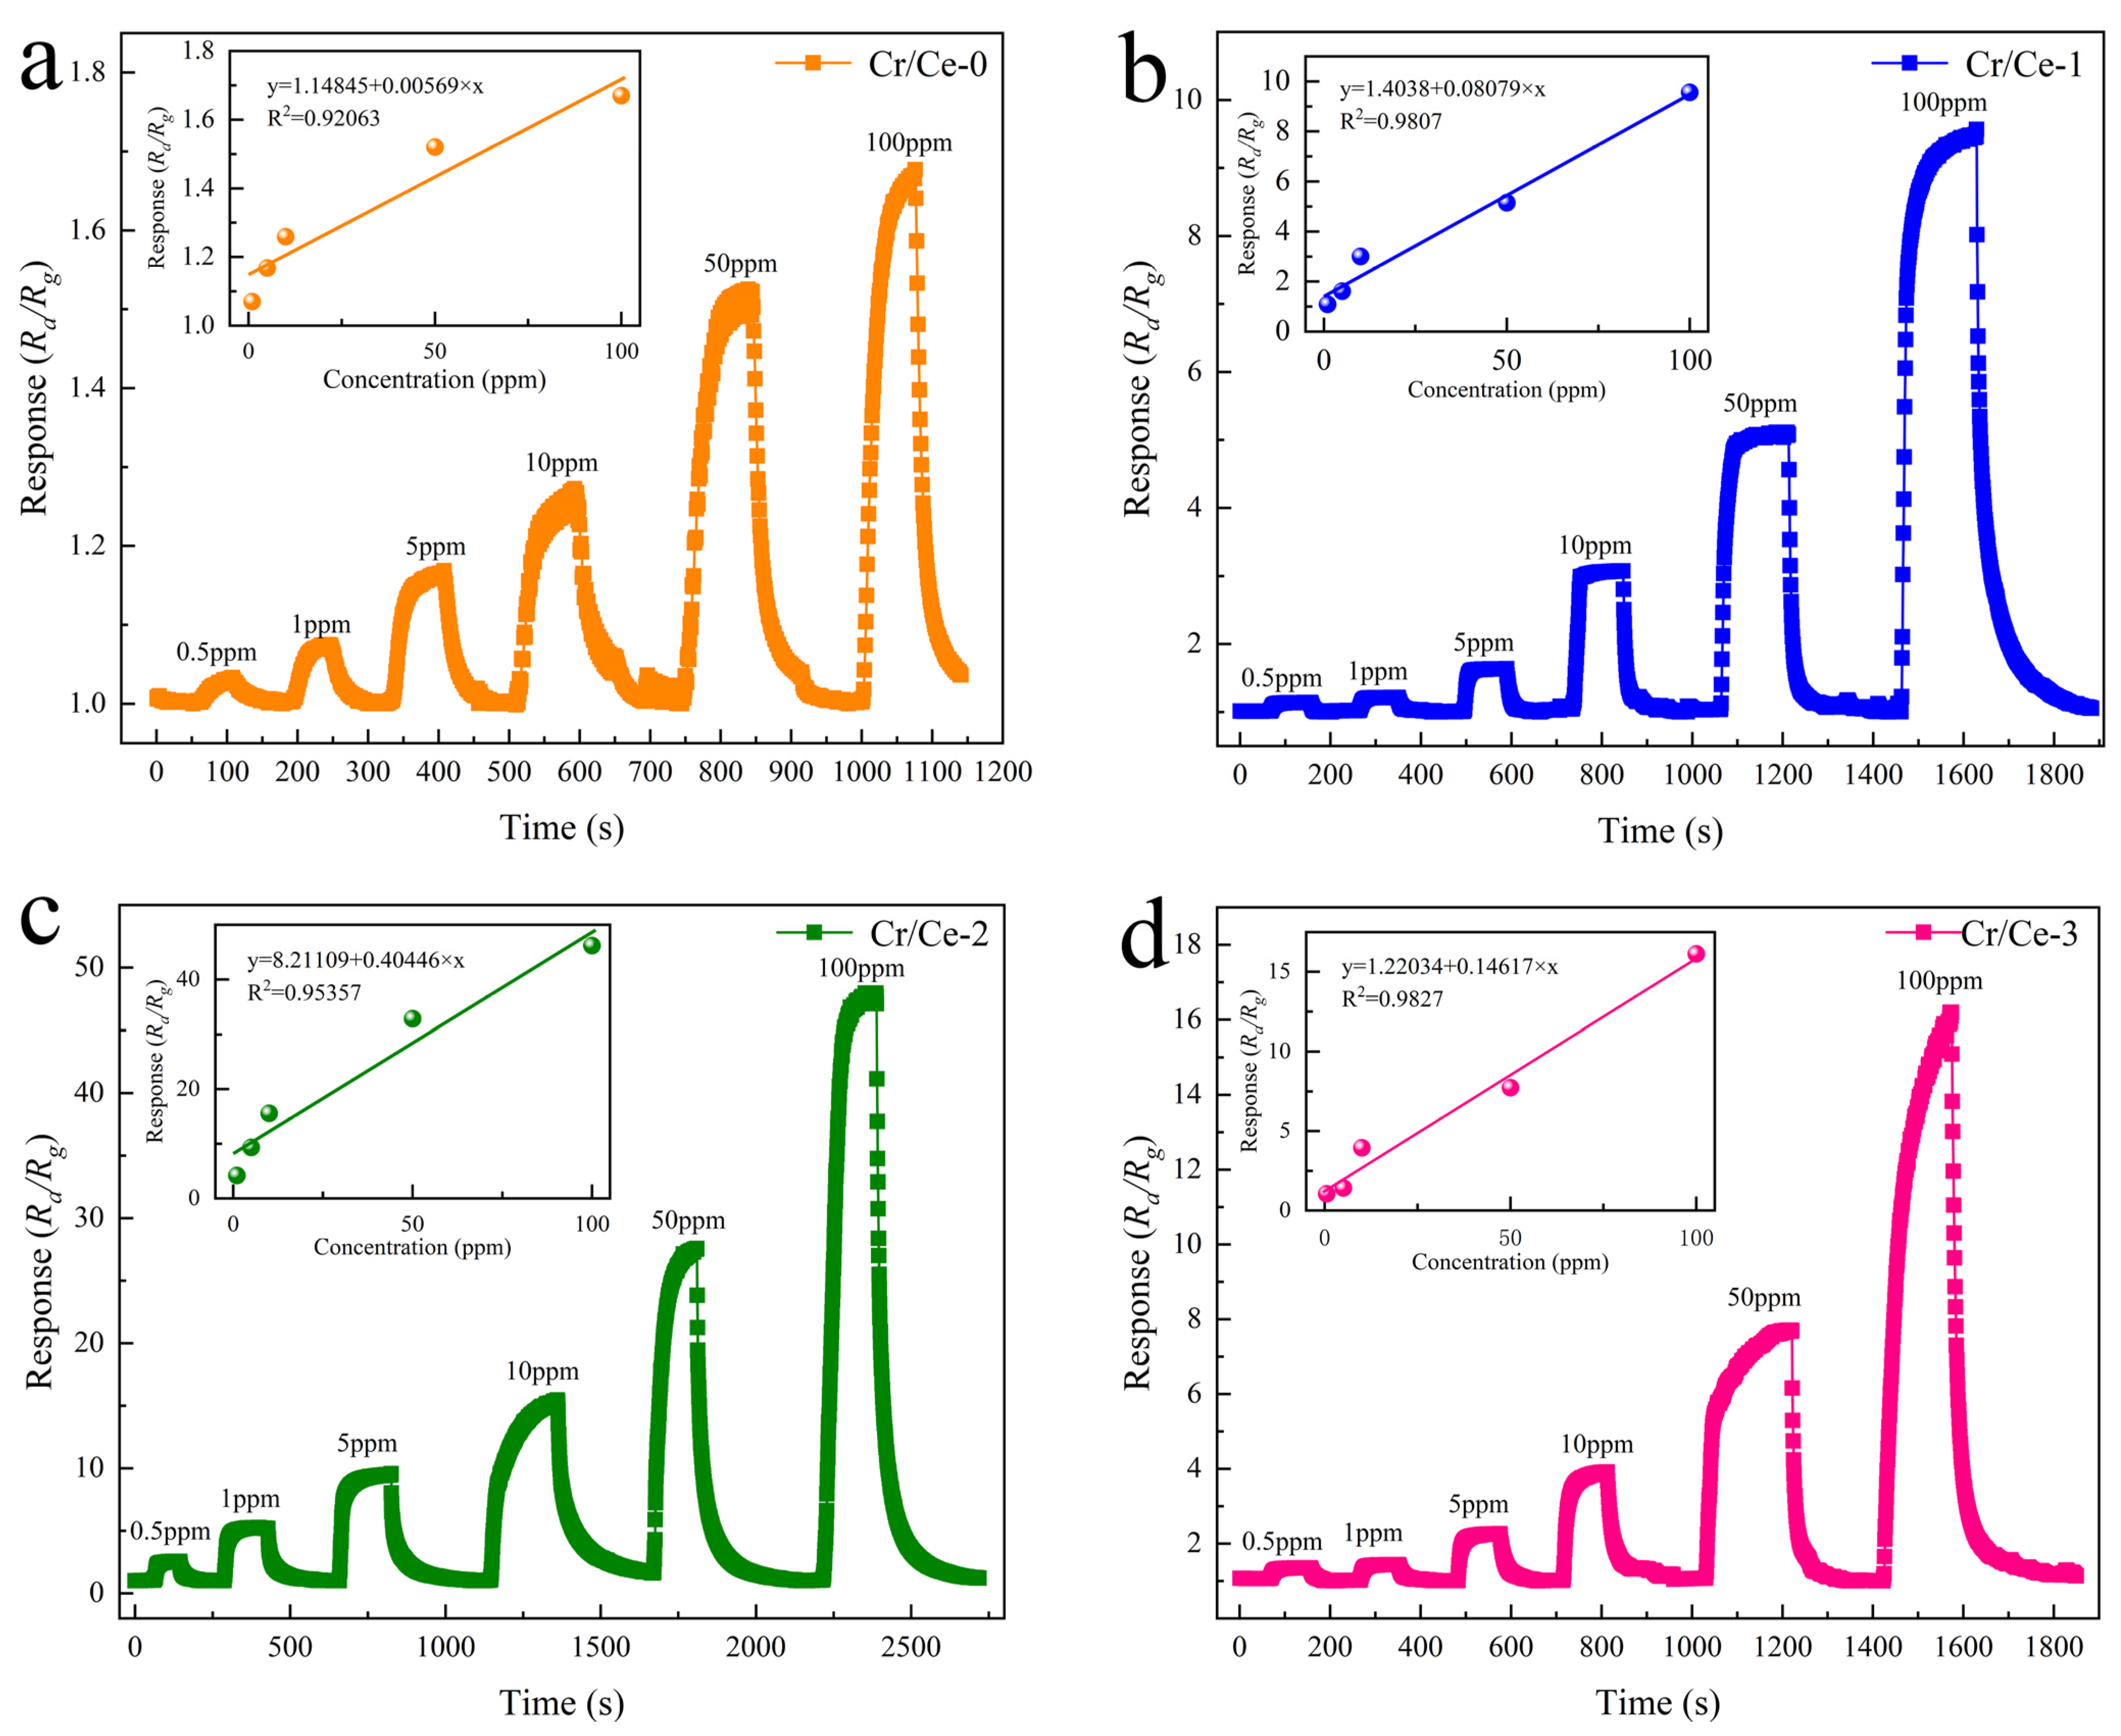
| Materials | Working Temperature (°C) | Concentration (ppm) | Response (Ra/Rg) | Response/ Recovery (s) | Refs. |
|---|---|---|---|---|---|
| CeO2-SnO2 | 110 | 10 | 10.2 | -/- | [34] |
| Ag2O/CeO2 modified ZnO | 160 | 10 | 28.9 | -/- | [35] |
| Gd-CeO2 | 580 | 200 | 59.2 | -/- | [36] |
| CeO2/Co3O4 | 190 | 10 | 6.54 | 23/7 | [37] |
| CeO2/WO3 | RT | 10 | 7.56 | -/- | [38] |
| Al-CeO2 | RT | 25 | 2.47 | 64/52 | [39] |
| CeO2/TiO2 | 300 | 300 | 5.44 | 20/20 | [40] |
| Cr/Ce-2 | 170 | 10 | 15.6 | 11/145 | This work |
Disclaimer/Publisher’s Note: The statements, opinions and data contained in all publications are solely those of the individual author(s) and contributor(s) and not of MDPI and/or the editor(s). MDPI and/or the editor(s) disclaim responsibility for any injury to people or property resulting from any ideas, methods, instructions or products referred to in the content. |
© 2025 by the authors. Licensee MDPI, Basel, Switzerland. This article is an open access article distributed under the terms and conditions of the Creative Commons Attribution (CC BY) license (https://creativecommons.org/licenses/by/4.0/).
Share and Cite
Chen, Y.; Xu, H.; Ren, J.; Zhang, G.; Jia, Y. Enhanced N-Butanol Sensing Performance of Cr-Doped CeO2 Nanomaterials. Sensors 2025, 25, 1208. https://doi.org/10.3390/s25041208
Chen Y, Xu H, Ren J, Zhang G, Jia Y. Enhanced N-Butanol Sensing Performance of Cr-Doped CeO2 Nanomaterials. Sensors. 2025; 25(4):1208. https://doi.org/10.3390/s25041208
Chicago/Turabian StyleChen, Yanping, Haoyang Xu, Jing Ren, Guangfeng Zhang, and Yonghui Jia. 2025. "Enhanced N-Butanol Sensing Performance of Cr-Doped CeO2 Nanomaterials" Sensors 25, no. 4: 1208. https://doi.org/10.3390/s25041208
APA StyleChen, Y., Xu, H., Ren, J., Zhang, G., & Jia, Y. (2025). Enhanced N-Butanol Sensing Performance of Cr-Doped CeO2 Nanomaterials. Sensors, 25(4), 1208. https://doi.org/10.3390/s25041208