
Electromagnetic Properties of Natural Plant Leaves for Eco-Friendly and Biodegradable Substrates for Wireless IoT Devices


Abstract
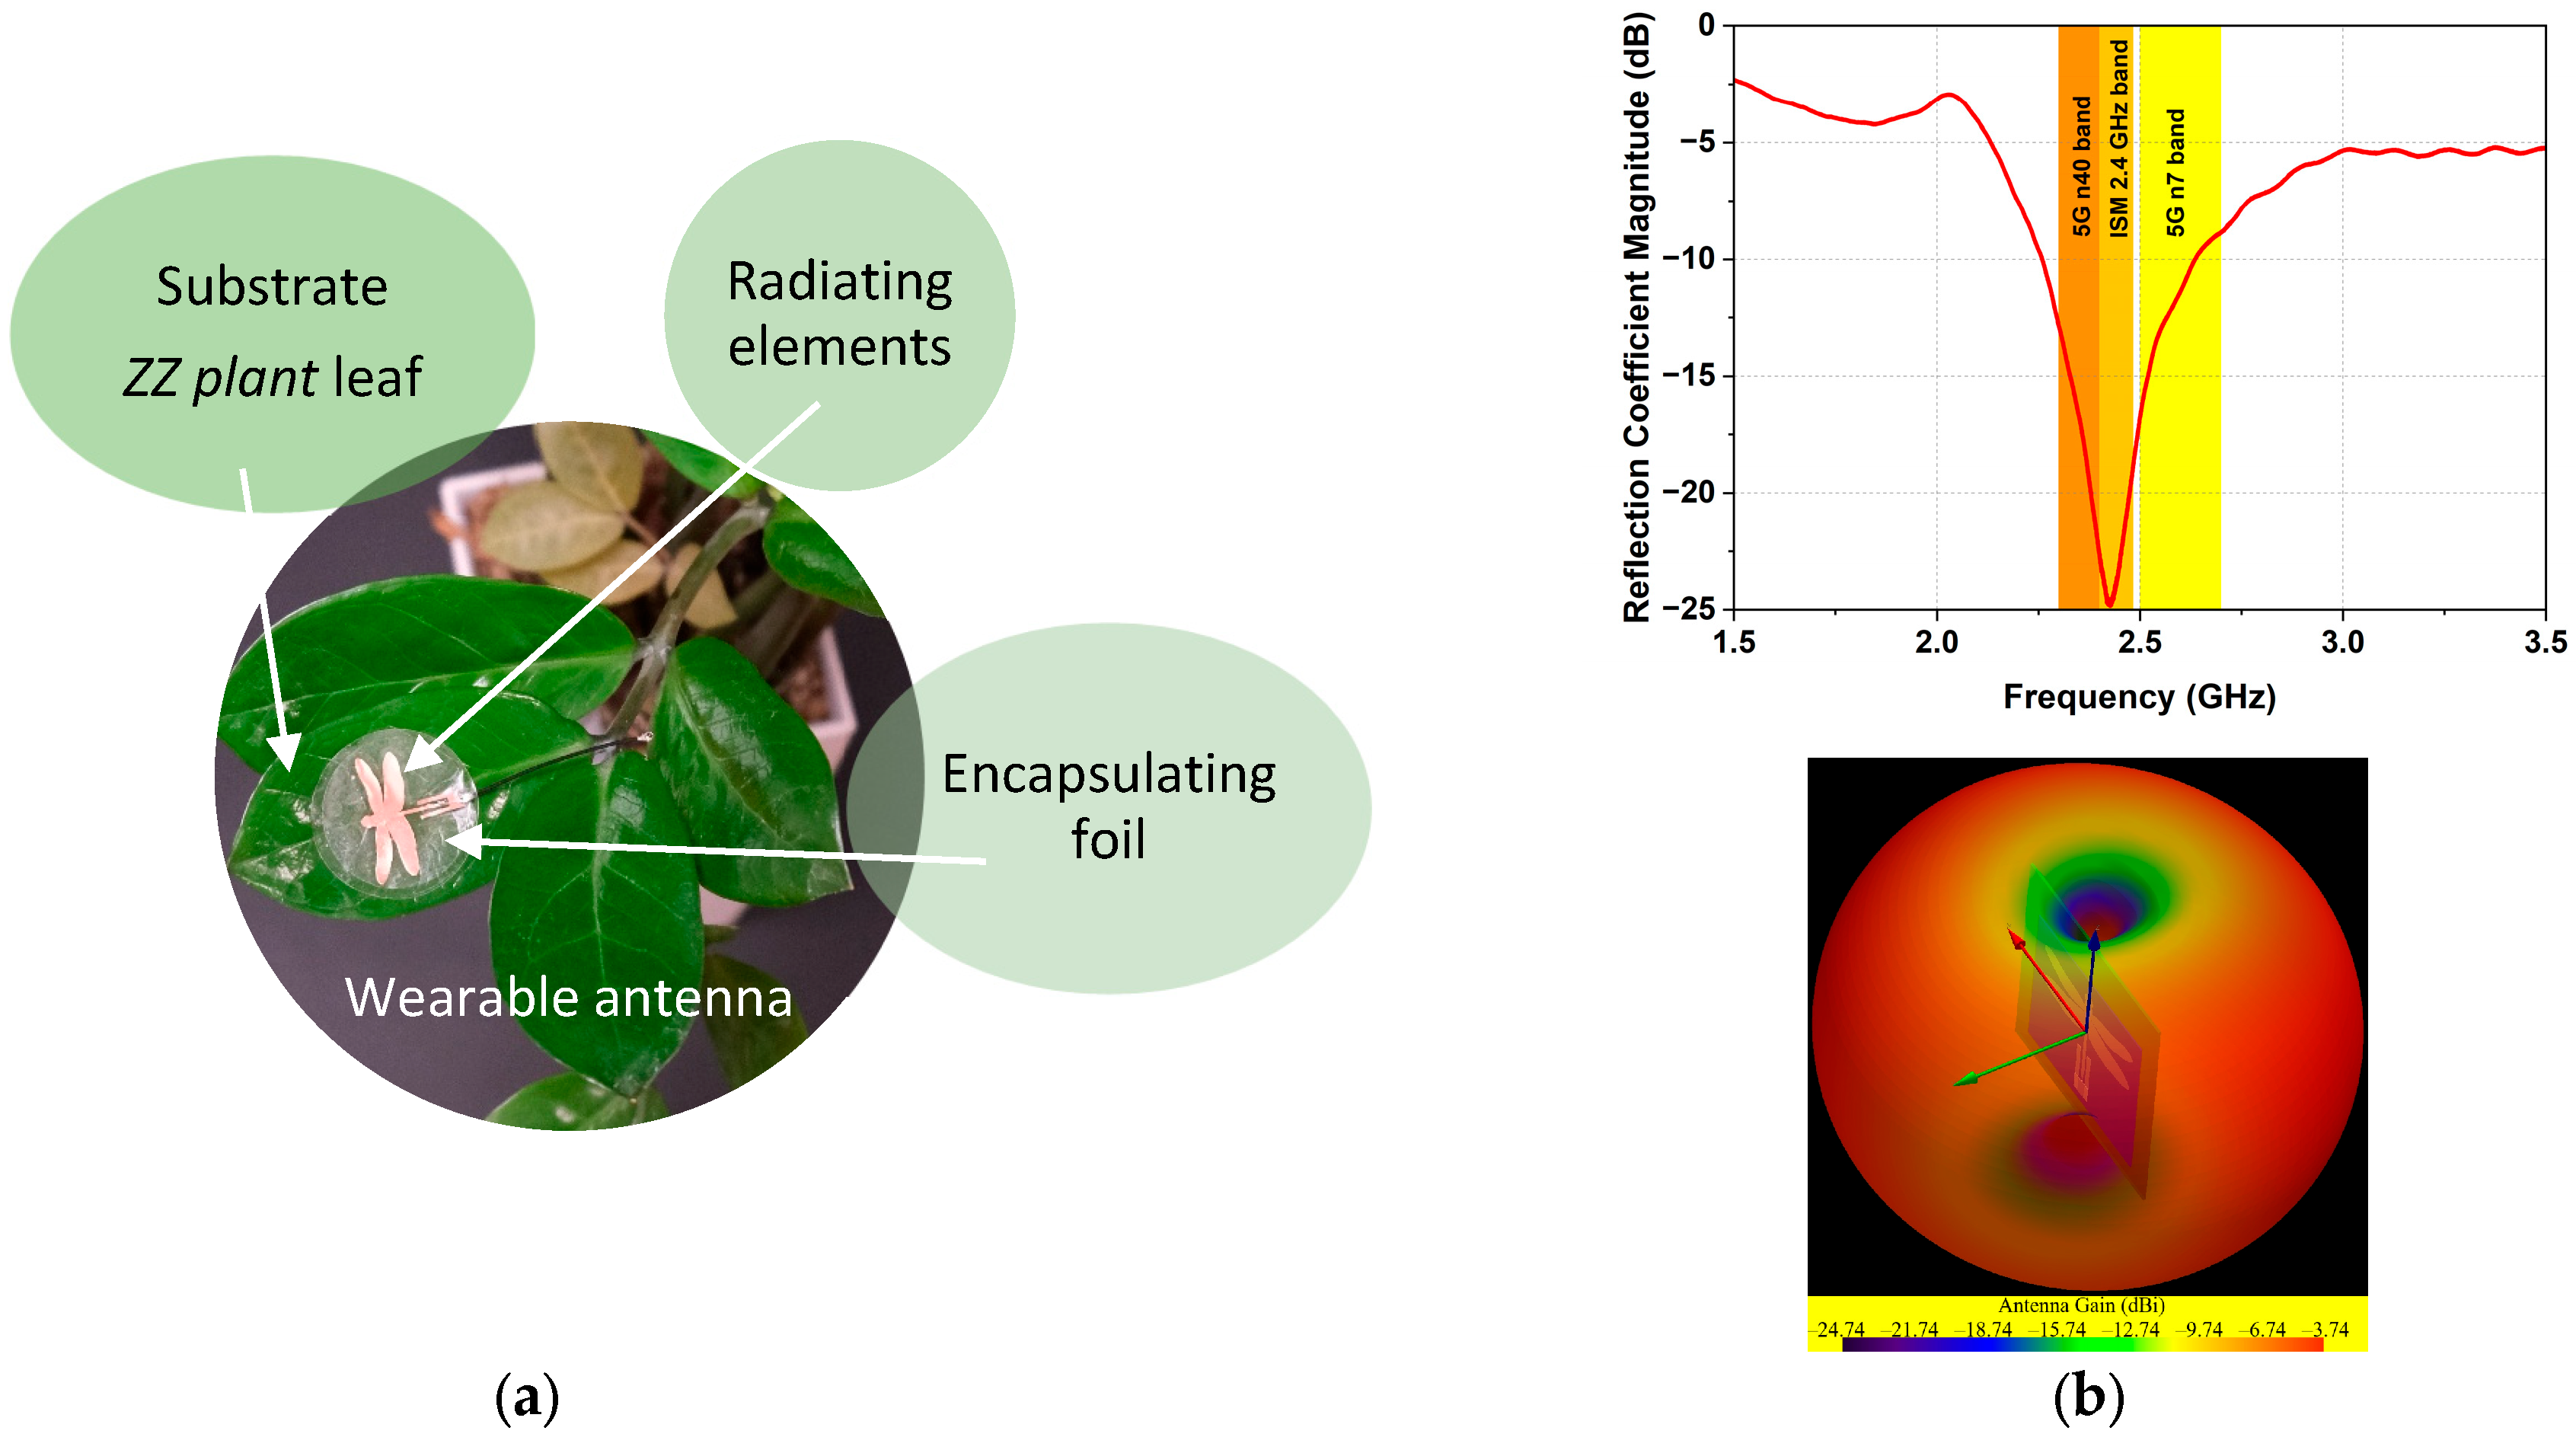
1. Introduction
2. Materials and Methods
2.1. Materials
2.1.1. Plant Material and Sampling Sites
2.1.2. Sample Preparation
2.2. Methods and Experimental Setup
2.2.1. Cavity Perturbation Method
2.2.2. Experimental Setup
3. Results and Discussion
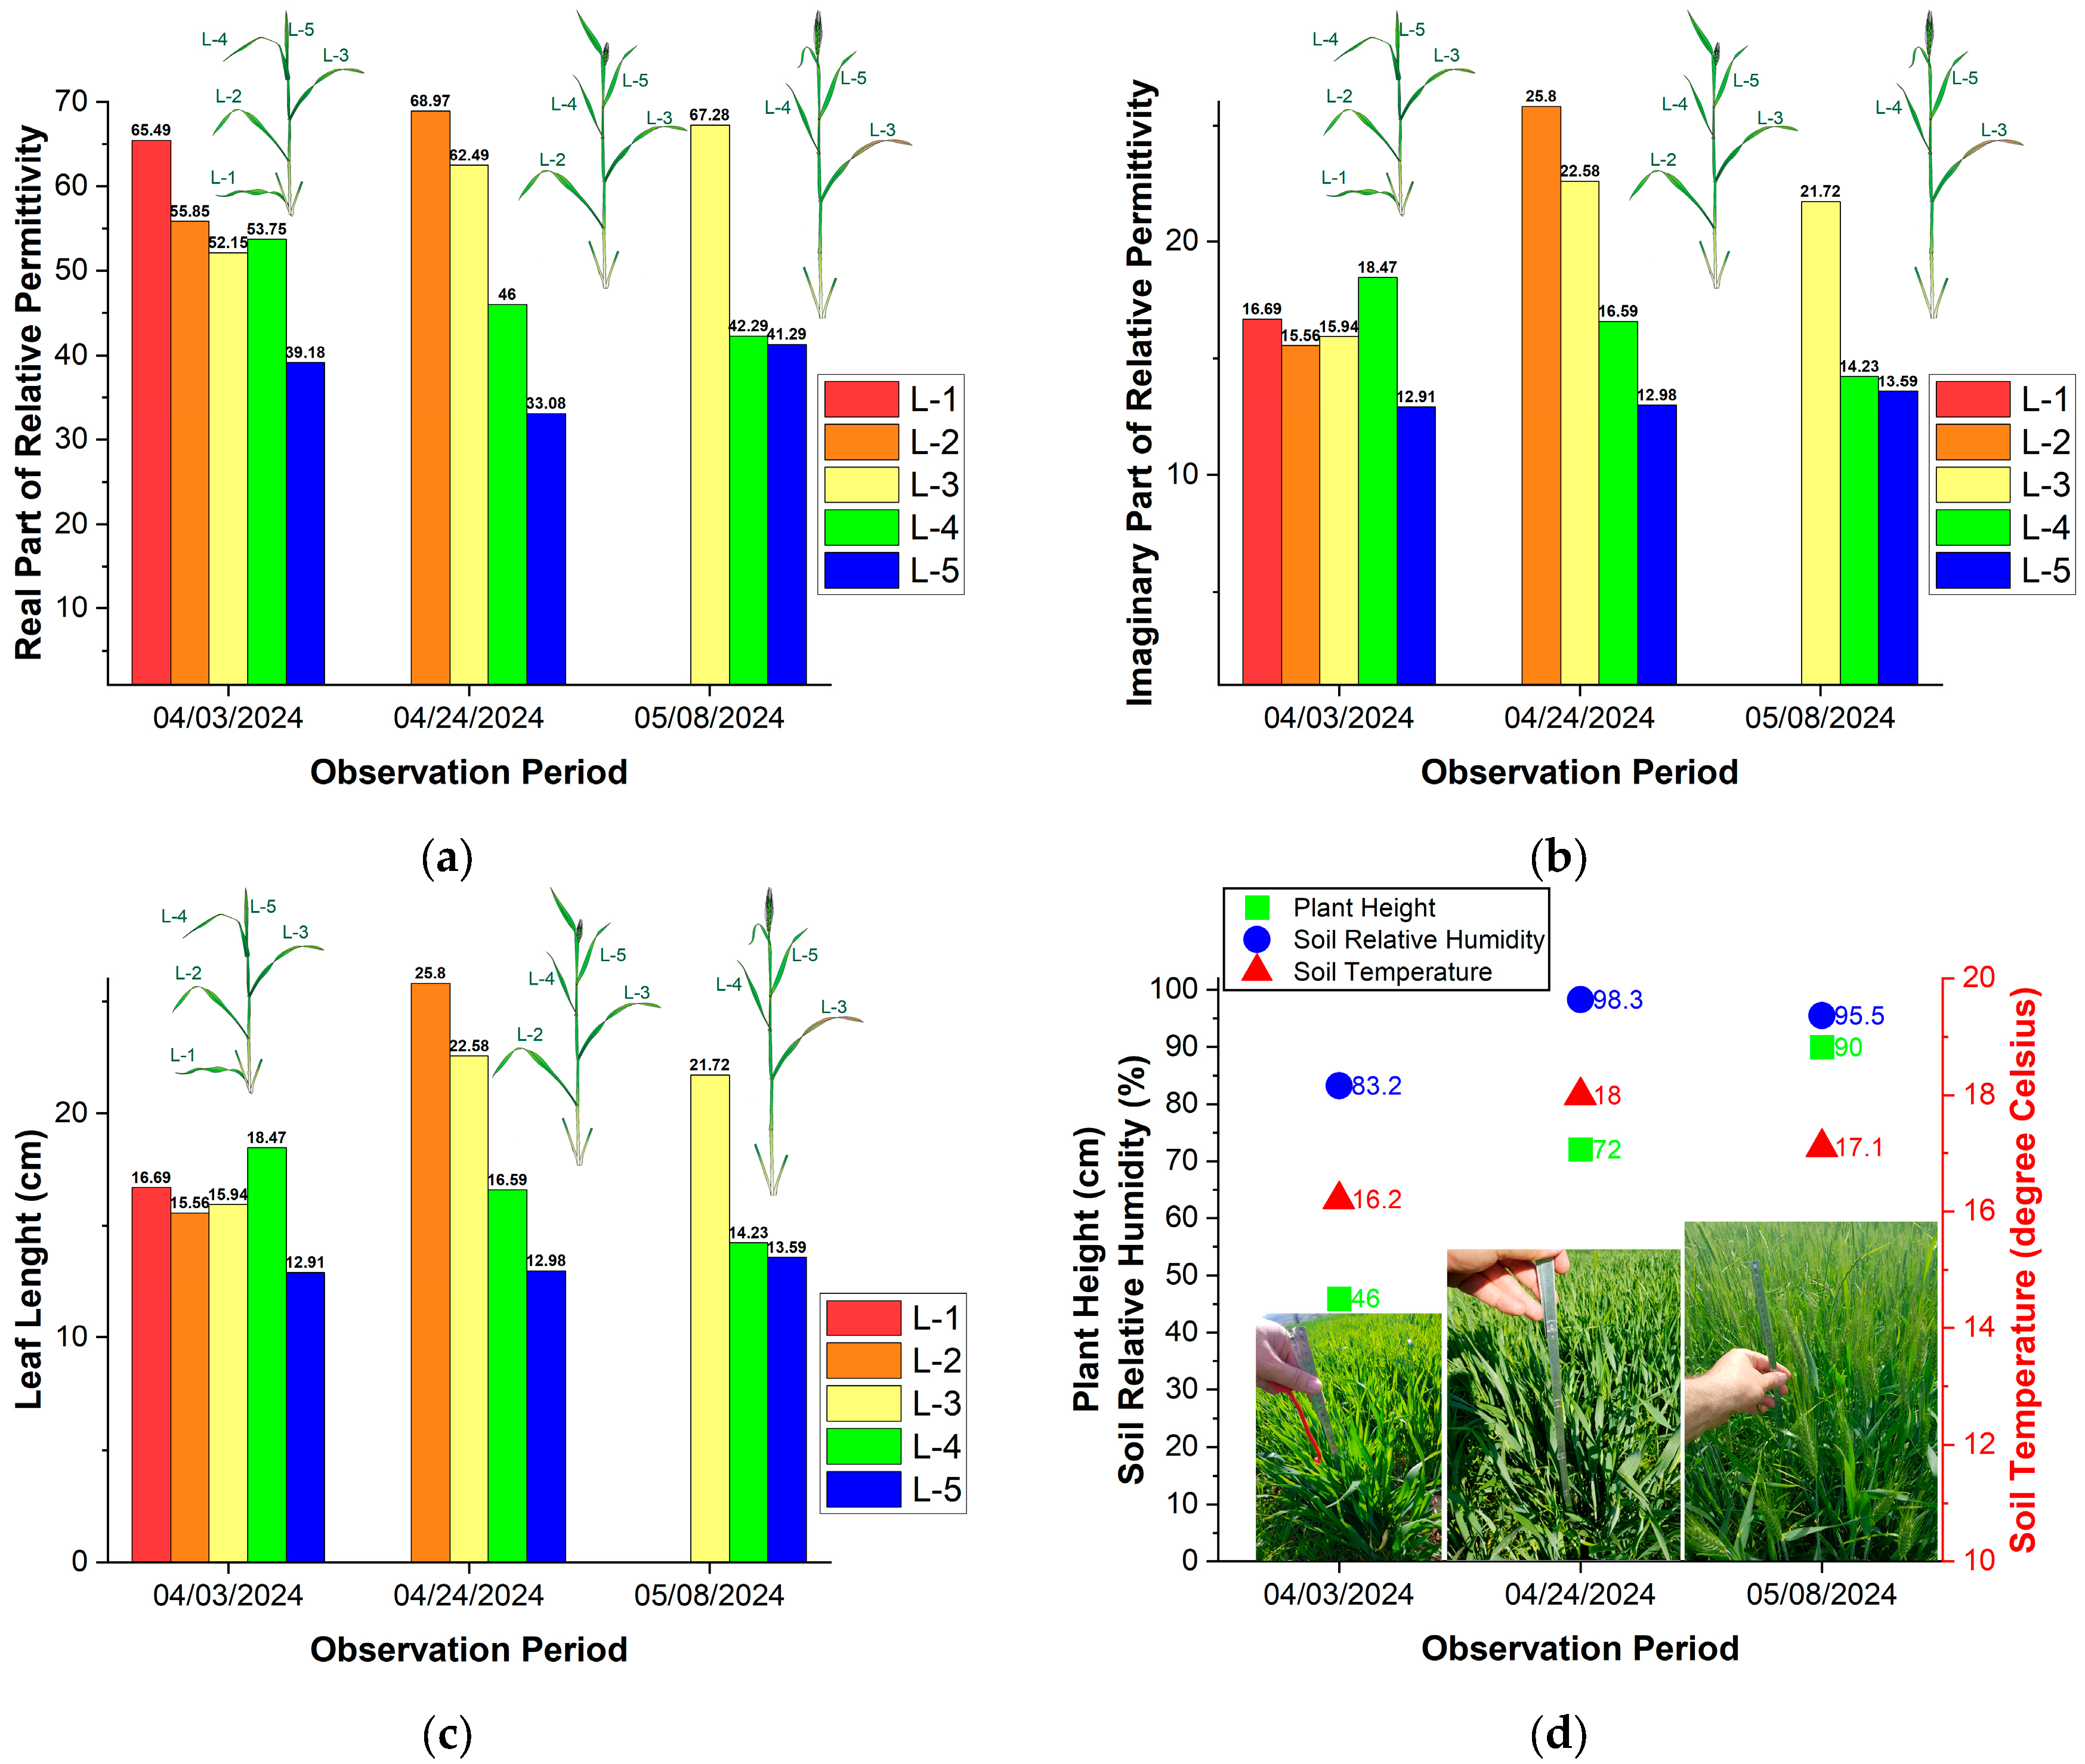
3.1. Electromagnetic Parameters of Winter Wheat Leaves
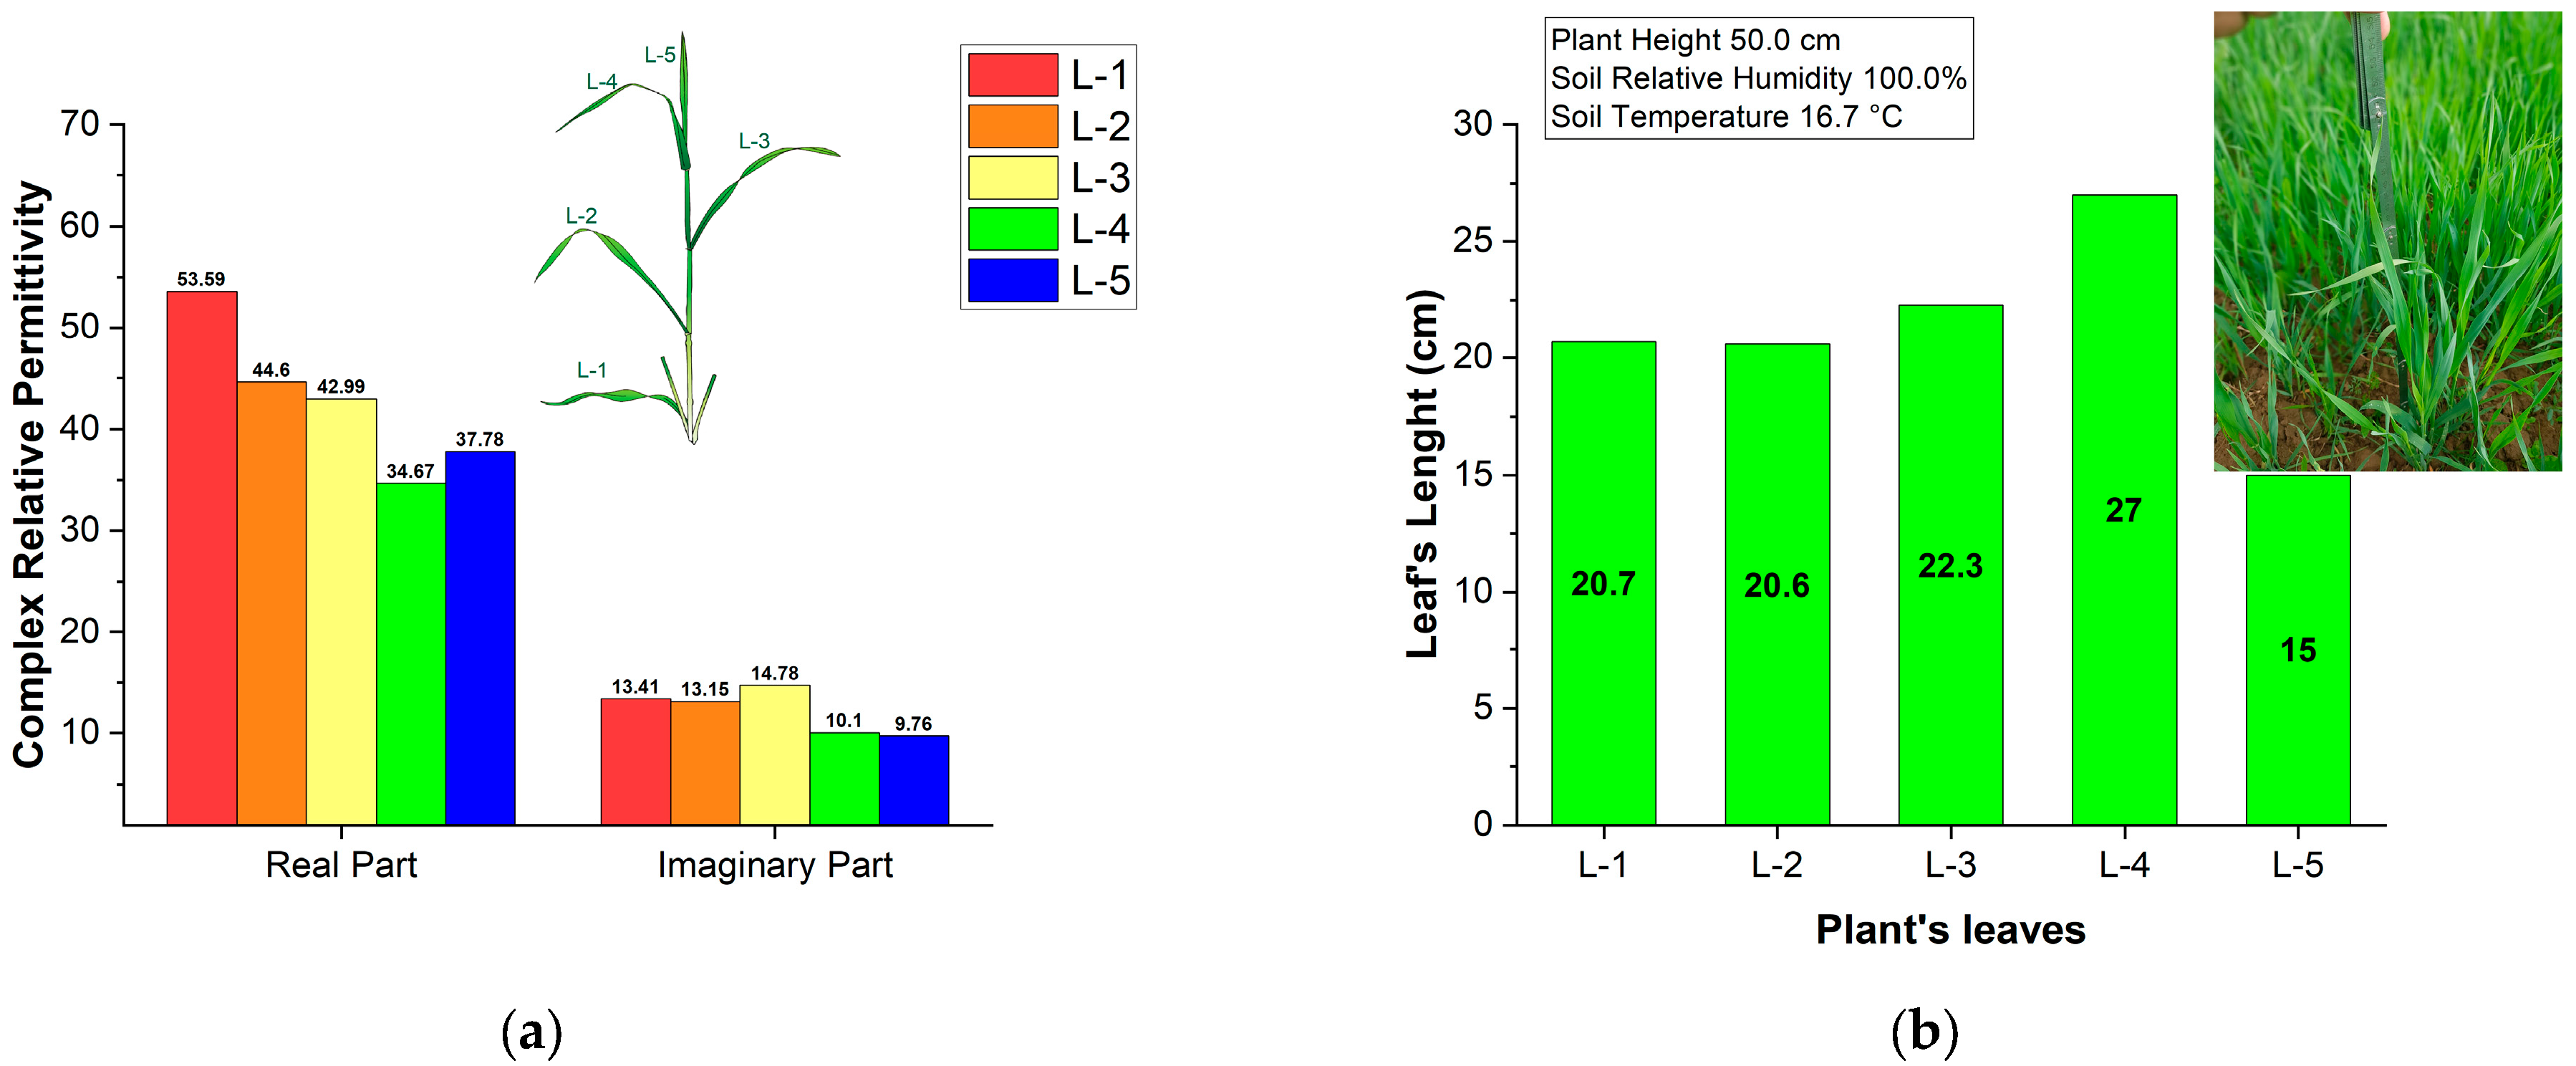
3.2. Electromagnetic Parameters of Corn
3.3. Electromagnetic Parameters of Sunflower
4. Future Work
5. Conclusions
Author Contributions
Funding
Institutional Review Board Statement
Informed Consent Statement
Data Availability Statement
Conflicts of Interest
References
- Atanasov, N.T.; Atanasov, B.N.; Atanasova, G.L. Flexible wearable antenna for IoT-based plant health monitoring. Electronics 2024, 13, 2956. [Google Scholar] [CrossRef]
- GSMA. IoT for Development: Use Cases Delivering Impact. Available online: https://www.gsma.com/solutions-and-impact/connectivity-for-good/mobile-for-development/gsma_resources/iot-for-development-use-cases-delivering-impact/ (accessed on 1 March 2023).
- Jaliyagoda, N.; Lokuge, S.; Gunathilake, P.M.P.C.; Amaratunga, K.S.P.; Weerakkody, W.A.P.; Bandaranayake, P.C.G. Bandaranayake AU. Internet of things (IoT) for smart agriculture: Assembling and assessment of a low-cost IoT system for polytunnels. PLoS ONE 2023, 18, e0278440. [Google Scholar] [CrossRef]
- IoT Analytics. State of IoT 2024: Number of Connected IoT Devices Growing 13% to 18.8 Billion Globally. Available online: https://iot-analytics.com/number-connected-iot-devices/ (accessed on 3 September 2024).
- Irimia-Vladu, M.; Głowacki, E.D.; Voss, G.; Bauer, S.; Sariciftci, N.Z. Green and biodegradable electronics. Mater. Today 2012, 15, 340–346. [Google Scholar] [CrossRef]
- Bolognesi, M.; Prosa, M.; Seri, M. Biocompatible and Biodegradable Organic Electronic Materials. In Electronic and Optical Materials, Sustainable Strategies in Organic Electronics; Marrocchi, A., Ed.; Woodhead Publishing: Cambridge, UK, 2022; pp. 297–338. ISBN 9780128231470. [Google Scholar] [CrossRef]
- Li, W.; Liu, Q.; Zhang, Y.; Li, C.; He, Z.; Choy, W.C.H.; Low, P.J.; Sonar, P.; Kyaw, A.K.K. Biodegradable Materials and Green Processing for Green Electronics. Adv. Mater. 2020, 32, 2001591. [Google Scholar] [CrossRef]
- Kasuga, T.; Mizui, A.; Koga, H.; Nogi, M. Wirelessly Powered Sensing Fertilizer for Precision and Sustainable Agriculture. Adv. Sustain. Syst. 2024, 8, 2300314. [Google Scholar] [CrossRef]
- Atanasov, N.; Atanasov, B.; Hristov, N.; Atanasova, G. Characterization of the electromagnetic properties of flower leaves for 2.45 GHz ISM band biodegradable electronics applications. In Proceedings of the 30th International Scientific Conference the Knowledge-Based Organization, Sibiu, Romania, 13–15 June 2024. [Google Scholar]
- Piro, B.; Tran, H.V.; Thu, V.T. Sensors Made of Natural Renewable Materials: Efficiency, Recyclability or Biodegradability—The Green Electronics. Sensors 2020, 20, 5898. [Google Scholar] [CrossRef]
- Yan, B.; Zhang, F.; Wang, M.; Zhang, Y.; Fu, S. Flexible wearable sensors for crop monitoring: A review. Front. Plant Sci. 2024, 15, 1406074. [Google Scholar] [CrossRef]
- Lee, G.; Wei, Q.; Zhu, Y. Emerging Wearable Sensors for Plant Health Monitoring. Adv. Funct. Mater. 2021, 31, 2106475. [Google Scholar] [CrossRef]
- Jung, Y.H.; Chang, T.; Zhang, H.; Yao, C.; Zheng, Q.; Yang, V.W.; Mi, H.; Kim, M.; Cho, S.J.; Park, D.W.; et al. High-performance green flexible electronics based on biodegradable cellulose nanofibril paper. Nat. Commun. 2015, 6, 7170. [Google Scholar] [CrossRef]
- Wan, Y.; Qiu, Z.; Huang, J.; Yang, J.; Wang, Q.; Lu, P.; Yang, J.; Zhang, J.; Huang, S.; Wu, Z.; et al. Natural Plant Materials as Dielectric Layer for Highly Sensitive Flexible Electronic Skin. Small 2018, 14, 1801657. [Google Scholar] [CrossRef]
- Atanasov, B.N.; Atanasov, N.T.; Atanasova, G.L. Reliable and Resilient Wireless Communications in IoT-Based Smart Agriculture: A Case Study of Radio Wave Propagation in a Corn Field. Telecom 2024, 5, 1161–1178. [Google Scholar] [CrossRef]
- Trabelsi, S.; Nelson, S. A Century of Grain and Seed Moisture Sensing through Electrical Properties. Am. Soc. Agric. Biol. Eng. 2011, 1110850. [Google Scholar] [CrossRef]
- Nelson, S.O. Dielectric properties of agricultural products-measurements and applications. IEEE Trans. Electr. Insul. 1991, 26, 845–869. [Google Scholar] [CrossRef]
- van Emmerik, T.; Steele-Dunne, S.; Judge, J.; van de Giesen, N. A comparison between leaf dielectric properties of stressed and unstressed tomato plants. In Proceedings of the 2015 IEEE International Geoscience and Remote Sensing Symposium (IGARSS), Milan, Italy, 13–18 July 2015; pp. 275–278. [Google Scholar] [CrossRef]
- Shrestha, B.L.; Wood, H.C.; Sokhansanj, S. Modeling of Vegetation Permittivity at Microwave Frequencies. IEEE Trans. Geosci. Remote Sens. 2007, 45, 342–348. [Google Scholar] [CrossRef]
- Shrestha, B.L.; Wood, H.C.; Sokhansanj, S. Microwave Dielectric Properties of Alfalfa Leaves from 0.3 to 18 GHz. IEEE Trans. Instrum. Meas. 2011, 60, 2926–2933. [Google Scholar] [CrossRef]
- IEEE 802.11; Wireless LANs. IEEE: Piscataway, NJ, USA, 2020. Available online: https://ieeexplore.ieee.org/browse/standards/get-program/page/series?id=68 (accessed on 10 February 2025).
- IEEE 802.15.1; IEEE Standard for Information Technology—Local and Metropolitan Area Networks—Specific Requirements—Part 15.1a: Wireless Medium Access Control (MAC) and Physical Layer (PHY) Specifications for Wireless Personal Area Networks (WPAN). IEEE: Piscataway, NJ, USA, 2005. Available online: https://standards.ieee.org/ieee/802.15.1/3513 (accessed on 10 February 2025).
- IEEE 802.15.4; IEEE Standard for Low-Rate Wireless Networks. IEEE: Piscataway, NJ, USA, 2020. Available online: https://standards.ieee.org/ieee/802.15.4/7029/ (accessed on 10 February 2025).
- Baker-Jarvis, J.; Janezic, M.D.; Degroot, D.C. High-Frequency Dielectric Measurements. IEEE Instrum. Meas. Mag. 2010, 13, 24–31. [Google Scholar] [CrossRef]
- Li, H.; Zhao, C.; Huang, W.; Yang, G. Non-Uniform Vertical Nitrogen distribution within plant canopy and its estimation by remote sensing: A review. Field Crops Res. 2013, 142, 75–84. [Google Scholar] [CrossRef]
- Kong, W.; Huang, W.; Ma, L.; Tang, L.; Li, C.; Zhou, X.; Casa, R. Estimating Vertical Distribution of Leaf Water Content within Wheat Canopies after Head Emergence. Remote Sens. 2021, 13, 4125. [Google Scholar] [CrossRef]
- He, J.; Zhang, X.; Guo, W.; Pan, Y.; Yao, X.; Cheng, T.; Zhu, Y.; Cao, W.; Tian, Y. Estimation of Vertical Leaf Nitrogen Distribution Within a Rice Canopy Based on Hyperspectral Data. Front. Plant Sci. 2020, 13, 1802. [Google Scholar] [CrossRef]
- Chauhan, P.D.; Gadani, D.H.; Rana, V.A. Effect of moisture content variation on dielectric properties of various plant leaves at microwave frequencies. Sci. Rep. 2024, 14, 13204. [Google Scholar] [CrossRef]
- Li, Z.; Zeng, J.; Chen, Q.; Bi, H.Y. The measurement and model construction of complex permittivity of vegetation. Sci. China Earth Sci. 2014, 57, 729–740. [Google Scholar] [CrossRef]
- Tomasi, T.C.; Reis, L.C.; Taira, T.L.; Soares, J.S.; Tomiozzo, R.; Uhlmann, L.O.; Streck, N.A.; Sorgato, J.C. Plant Density and Location: Optimization of Growth and Quality of Cut Sunflower in Tropical and Subtropical Environments. Plants 2024, 13, 2810. [Google Scholar] [CrossRef] [PubMed]
- El-Saadony, M.T.; Saad, A.M.; Mohammed, D.M.; Fahmy, M.A.; Elesawi, I.E.; Ahmed, A.E.; Algopishi, U.B.; Elrys, A.S.; Desoky, E.M.; Mosa, W.F.A.; et al. Drought-tolerant plant growth-promoting rhizobacteria alleviate drought stress and enhance soil health for sustainable agriculture: A comprehensive review. Plant Stress 2024, 14, 100632. [Google Scholar] [CrossRef]


Disclaimer/Publisher’s Note: The statements, opinions and data contained in all publications are solely those of the individual author(s) and contributor(s) and not of MDPI and/or the editor(s). MDPI and/or the editor(s) disclaim responsibility for any injury to people or property resulting from any ideas, methods, instructions or products referred to in the content. |
© 2025 by the authors. Licensee MDPI, Basel, Switzerland. This article is an open access article distributed under the terms and conditions of the Creative Commons Attribution (CC BY) license (https://creativecommons.org/licenses/by/4.0/).
Share and Cite
Atanasov, N.T.; Atanasov, B.N.; Atanasova, G.L. Electromagnetic Properties of Natural Plant Leaves for Eco-Friendly and Biodegradable Substrates for Wireless IoT Devices. Sensors 2025, 25, 1118. https://doi.org/10.3390/s25041118
Atanasov NT, Atanasov BN, Atanasova GL. Electromagnetic Properties of Natural Plant Leaves for Eco-Friendly and Biodegradable Substrates for Wireless IoT Devices. Sensors. 2025; 25(4):1118. https://doi.org/10.3390/s25041118
Chicago/Turabian StyleAtanasov, Nikolay Todorov, Blagovest Nikolaev Atanasov, and Gabriela Lachezarova Atanasova. 2025. "Electromagnetic Properties of Natural Plant Leaves for Eco-Friendly and Biodegradable Substrates for Wireless IoT Devices" Sensors 25, no. 4: 1118. https://doi.org/10.3390/s25041118
APA StyleAtanasov, N. T., Atanasov, B. N., & Atanasova, G. L. (2025). Electromagnetic Properties of Natural Plant Leaves for Eco-Friendly and Biodegradable Substrates for Wireless IoT Devices. Sensors, 25(4), 1118. https://doi.org/10.3390/s25041118