
CFR-YOLO: A Novel Cow Face Detection Network Based on YOLOv7 Improvement


Abstract
1. Introduction
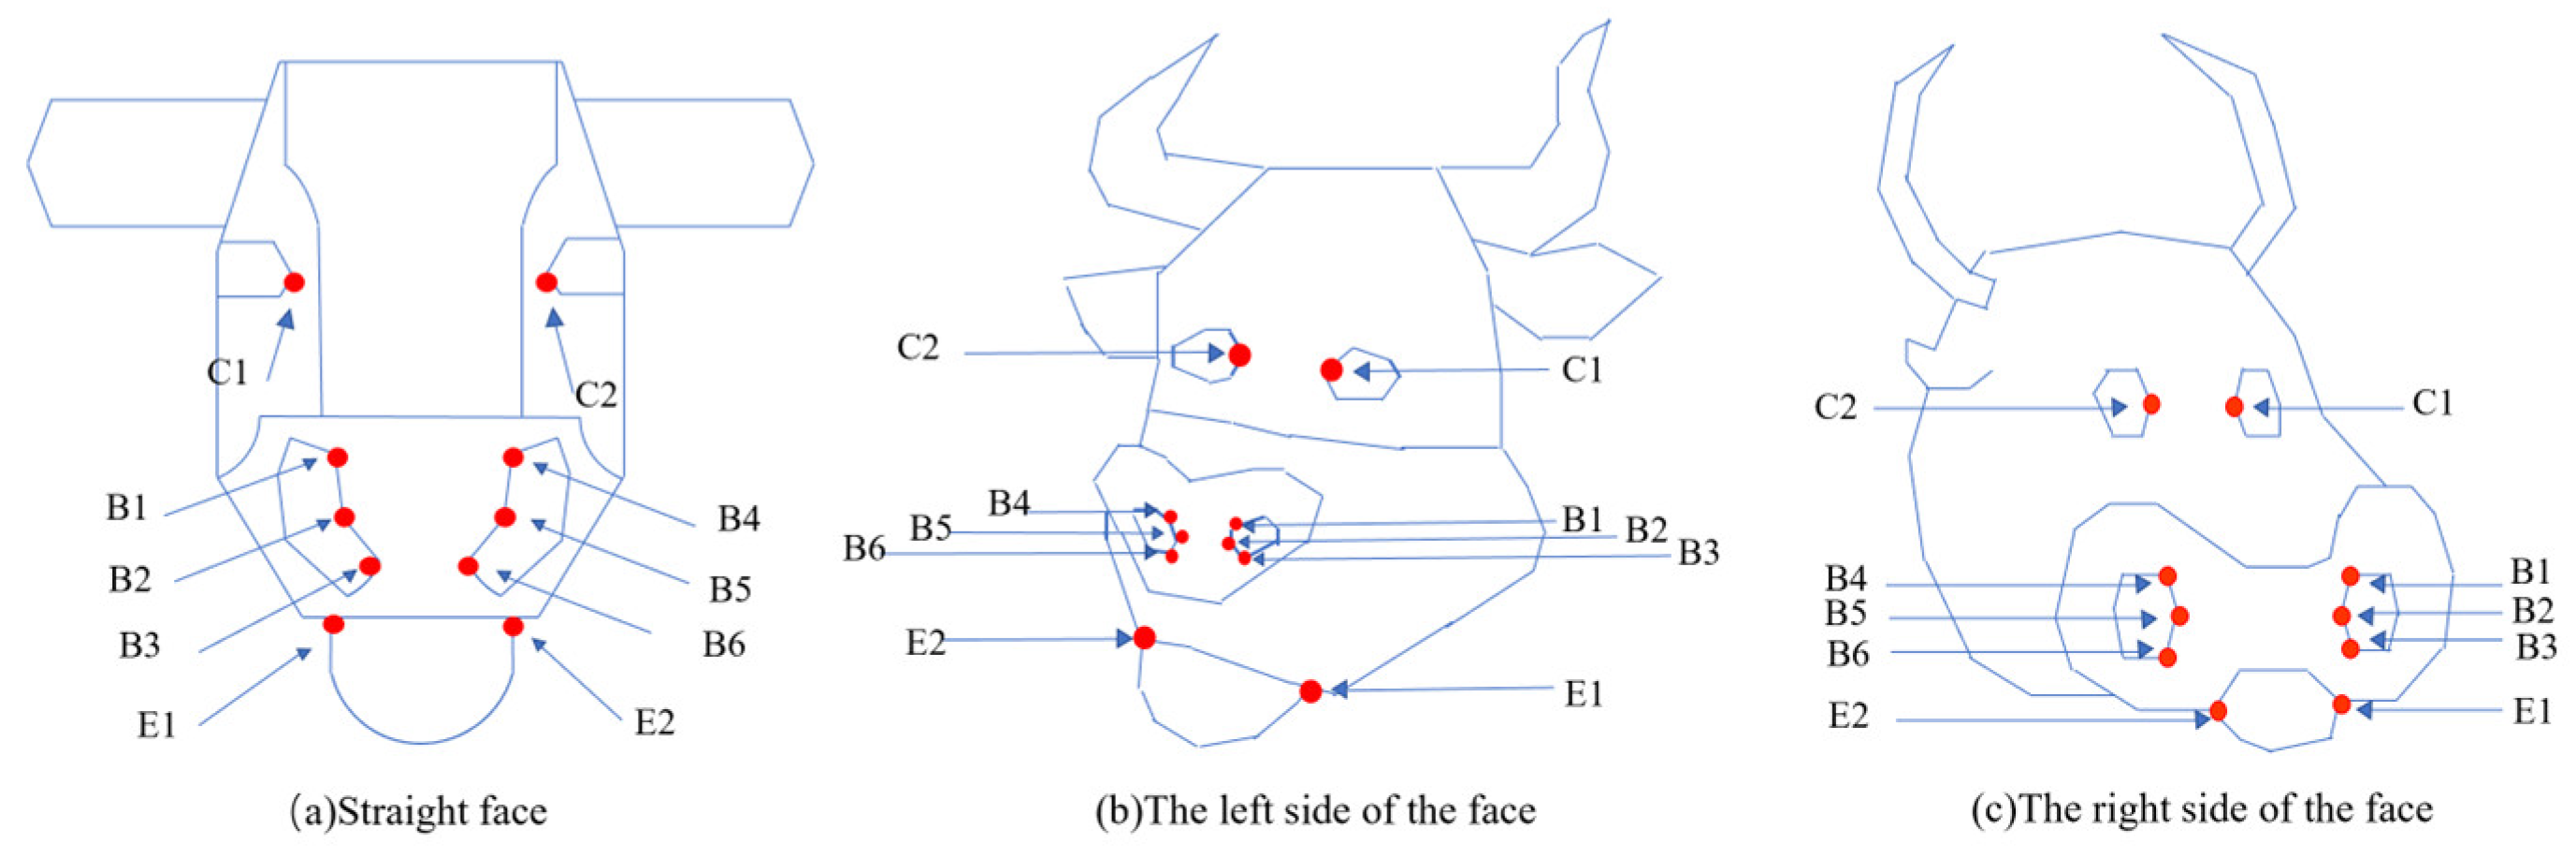
- Based on the features of the cow’s face (nose, mouth, and eye corners), a method of extracting the features of a cow’s face is constructed. Calculate the center of mass and frame for the nose, mouth, and eye corners of beef cattle.
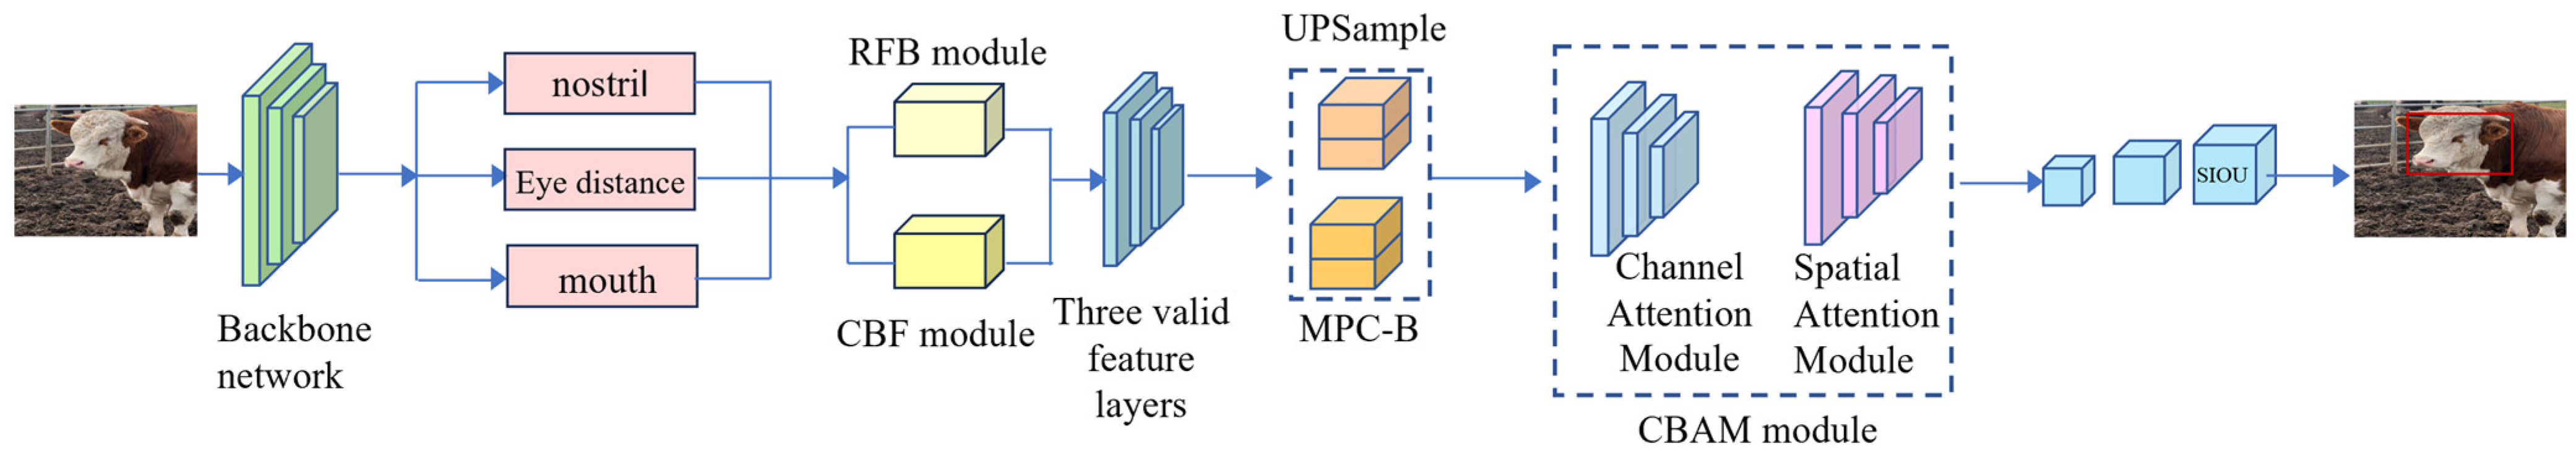
- An improved bovine face detection method based on YOLOv7 was designed. Specific optimizations include replacing CIoU loss functions with SIoU loss functions. FReLU activation function is used to replace SiLU activation function: the CBS module is changed to a CBF module. Introduce the RFB module into the backbone network. The convolutional block attention module (CBAM) is introduced in the head layer to optimize the CFR-YOLO model.
- The performance of the CFR-YOLO model is evaluated by experiments on self-built datasets. Compared with existing methods, such as YOLOv7, YOLOv5, YOLOv4, and SSD, the advantages of the proposed method in bovine face detection tasks are verified.
2. Status of Research
2.1. Status of Traditional Cow Face Detection Technology
- Ear-marking identification method: The main methods of identifying individual cattle by ear tags are barcode ear tags and metal ear tags. Barcode ear tags identify animals by placing a unique barcode on the surface of an ordinary plastic ear tag, which enables the querying of animal information and thus the traceability of the animal [11]. However, when using 2D barcodes for animal identification, the method is easily contaminated and damaged, and it has a low life span [12,13]. Metal ear tags are the primary method for individual identification on small-to-medium-sized farms and remain extensively used by ranchers. Ear tags are one of the most widely accepted methods of identifying individual cattle. This method is relatively convenient and cost-effective. Compared to techniques like hot-iron branding, ear tags are less invasive and cause minimal harm to cattle, but wearing ear tags for a long period of time can also result in the rotting of the cattle’s ears, and ear tags are highly susceptible to copying and counterfeiting, and they are easy to lose, which is unfavorable to the development of cattle insurance business.
- Radio-frequency identification (RFID) technology: As it is not only difficult but also inefficient to identify individual livestock by manual marking alone, have electronic marking based on the RFID principle has been utilized by Adrion and Cappai for the identification of individual livestock and monitoring of farming information in farming management [14,15]. RFID tags can record an animal’s age, sex, breed, and color, and the use of RFID technology in cattle farming management further improves the level of automation in the farming management process. Geng et al. [16] used radio-frequency technology for cow identification to manage the cattle in the farm. Xiong and Sun et al. [17] designed a milk yield measurement system based on RFID technology and image processing. This approach ensured system accuracy, enhanced stability, and lowered production costs.
2.2. Vision-Based Cow Face Detection Techniques
2.3. Cow Face Detection Technology Based on Deep Learning and Target Detection
2.4. Summary
3. Bovine Face Detection Method Based on YOLOv7
3.1. System Architecture of CFR-YOLO
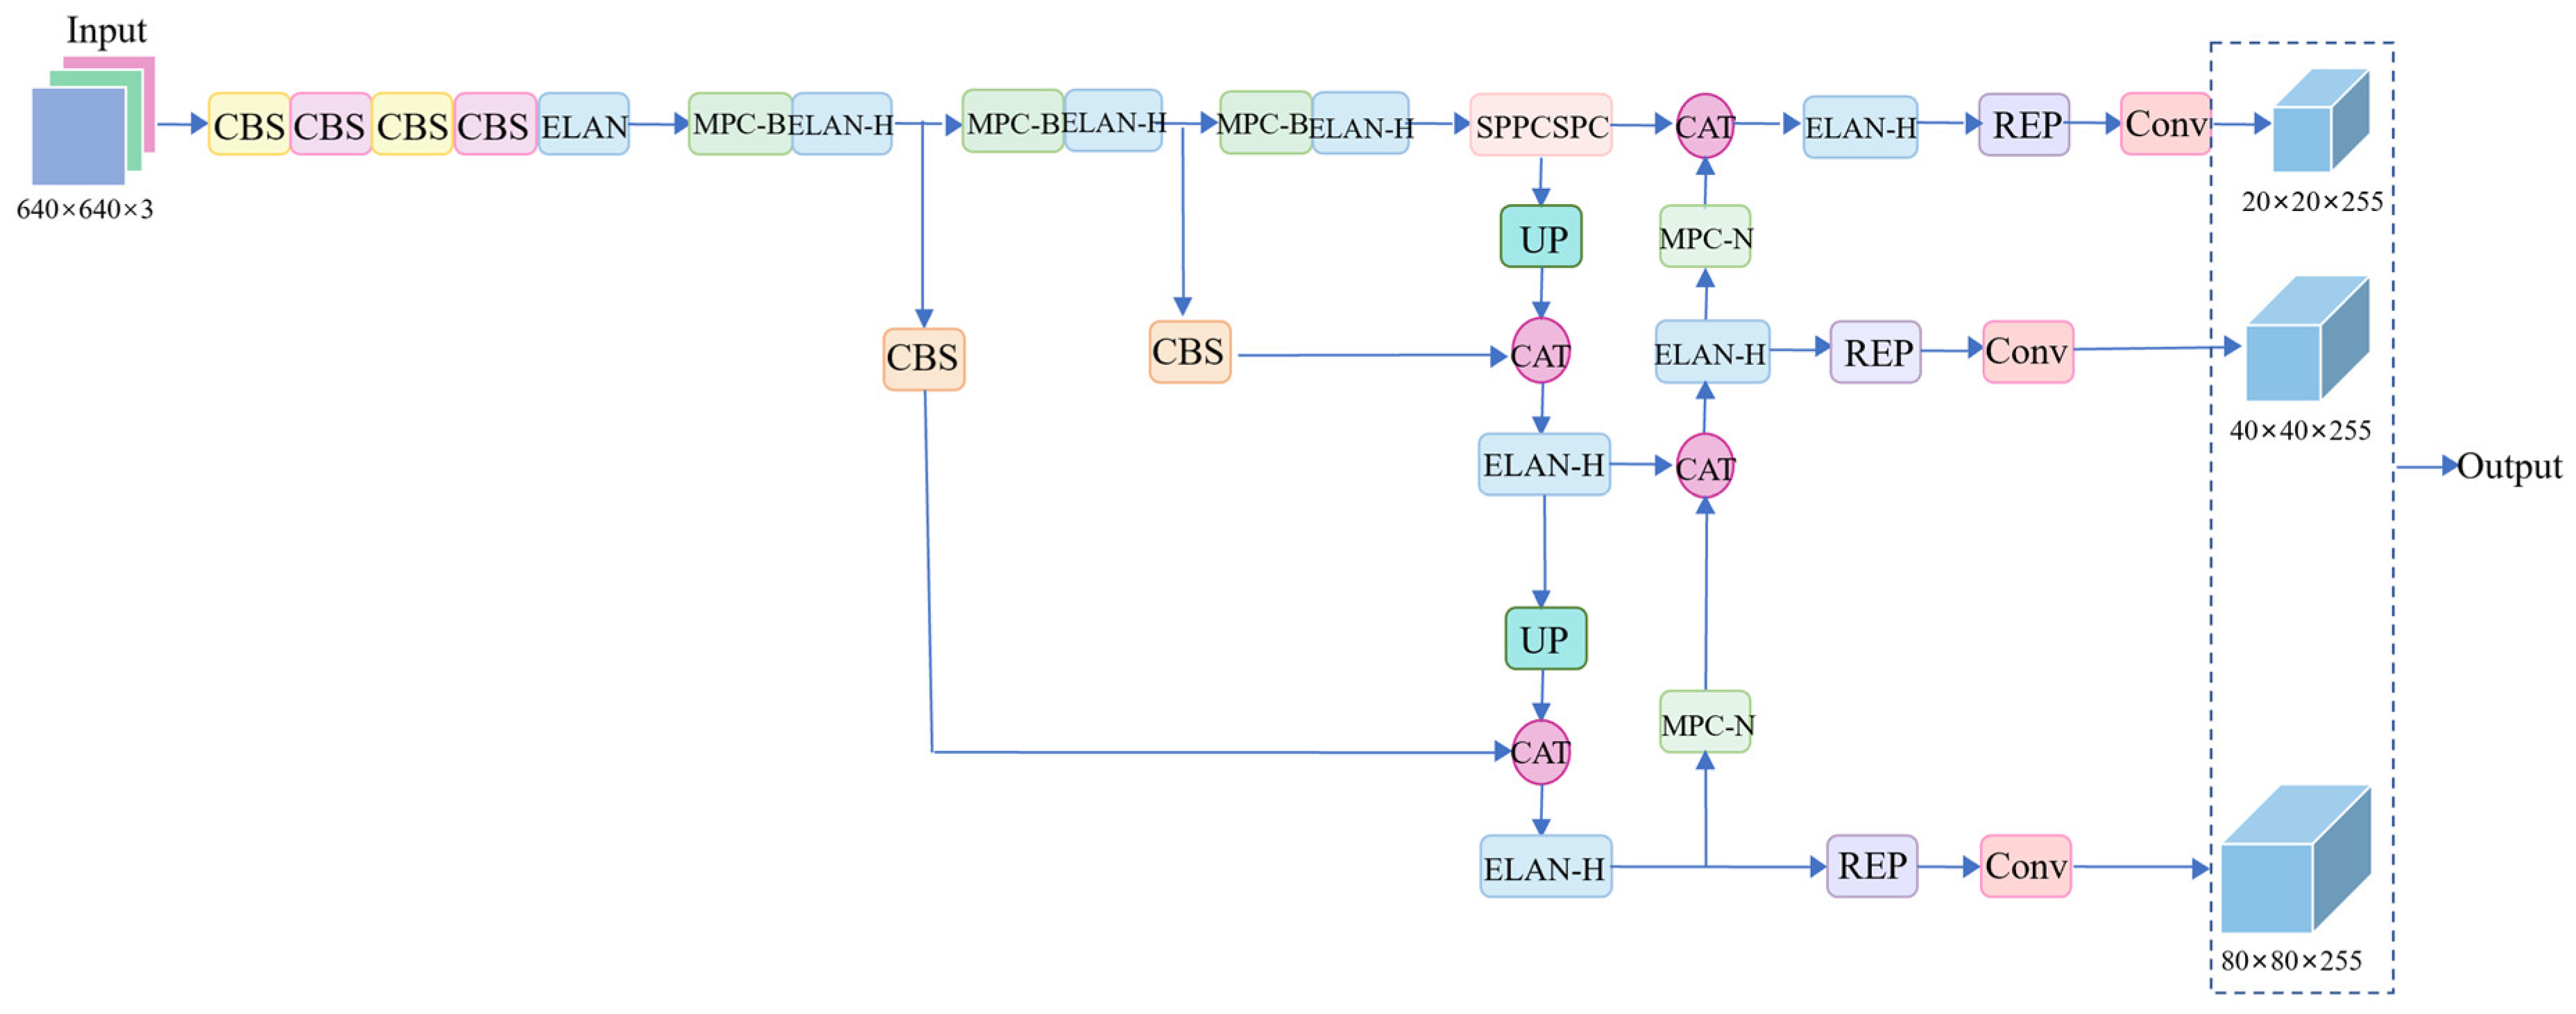
3.2. YOLOv7 Network
3.3. Improved YOLOv7
3.3.1. Hybrid Attention Mechanism CBAM
3.3.2. Introduction of FReLU Activation Function
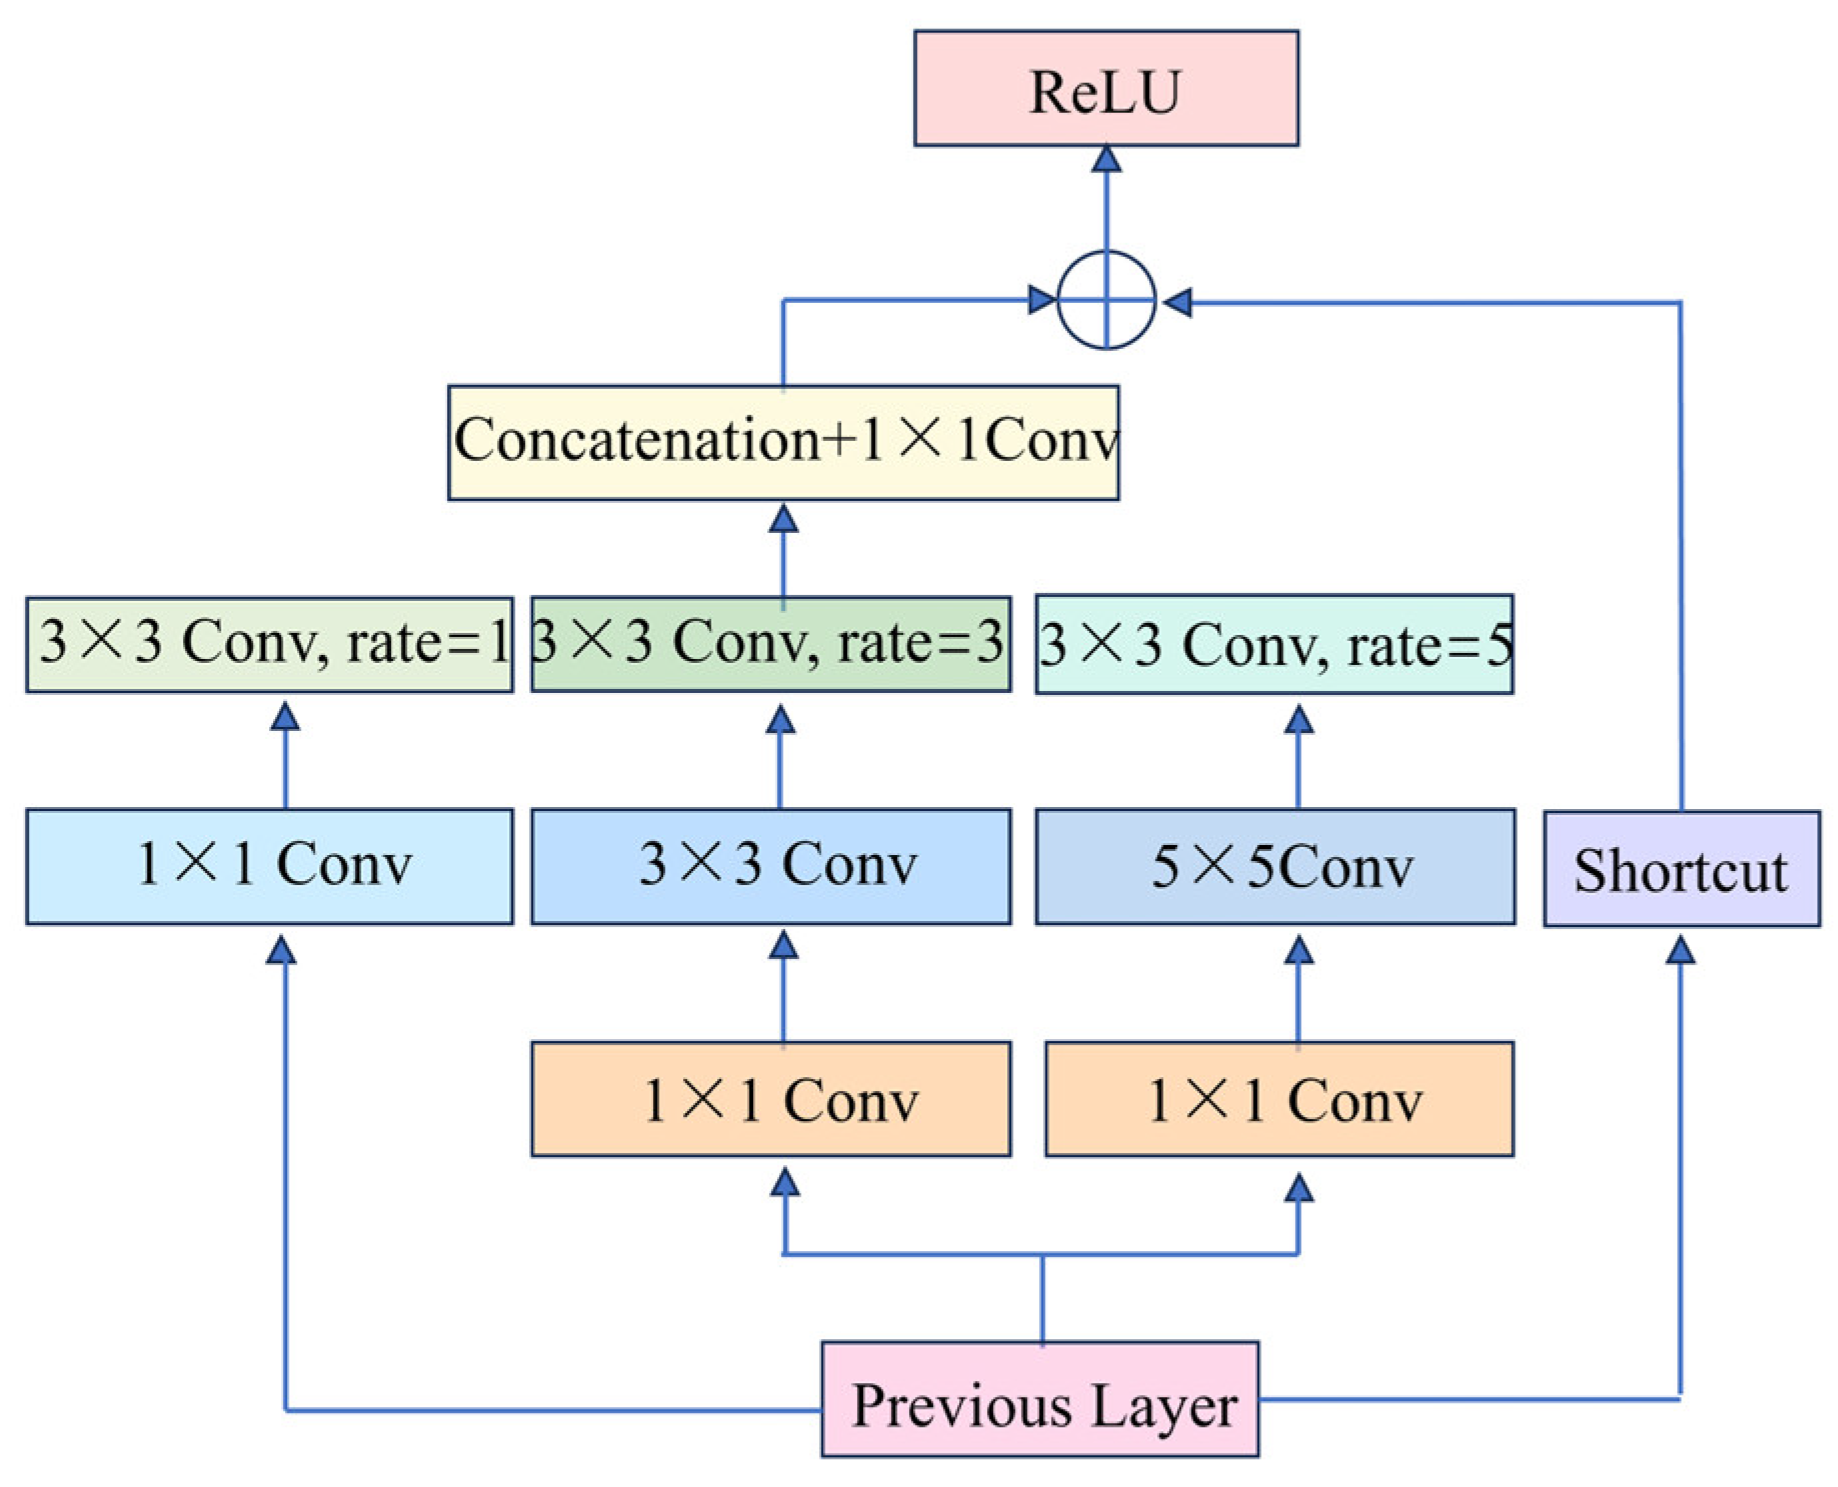
3.3.3. RFB Module
3.4. CFR_YOLO Method Design
- (1)
- Facial key-point feature extraction
- (2)
- Cow face detection
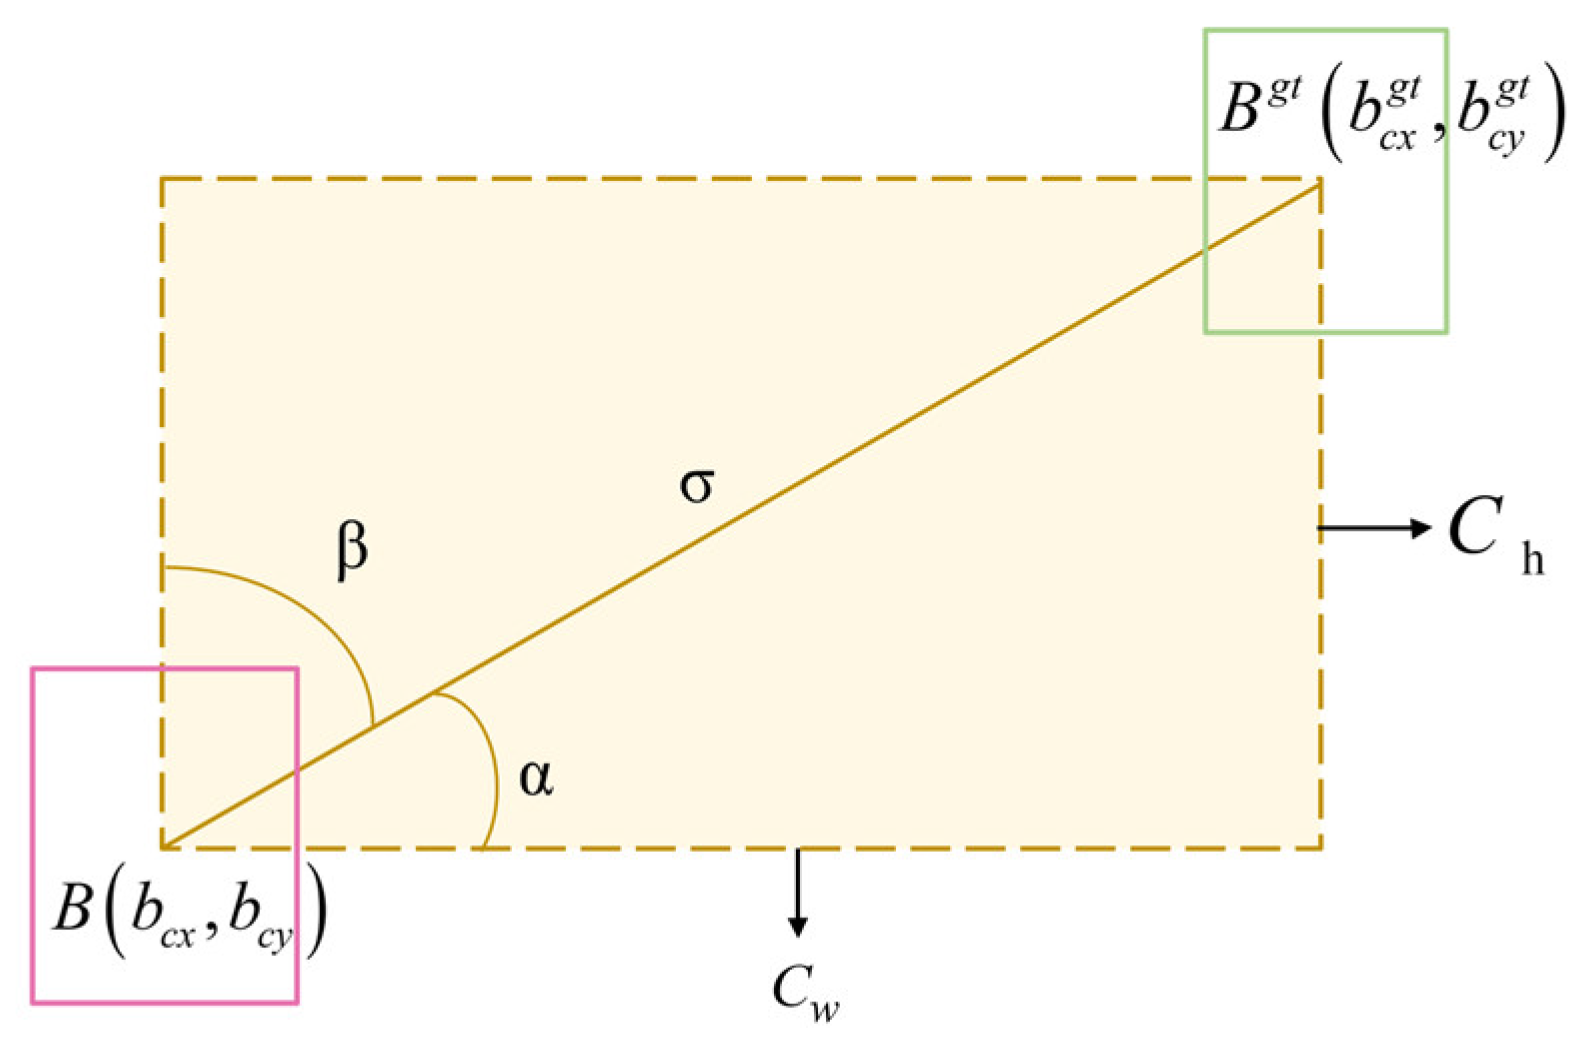
3.5. Loss Function Improvement
| Algorithm 1. CFR-YOLO Pseudo-Code | |
| 1: | INPUT:X//Original feature map |
| 2: | OUTPUT//z |
| 3: | Function CFR-YOLO () { |
| 4: | FOR (I = 1; I ≤ n; i++) |
| 5: | { |
| 6: | //Total number of pixel points in the feature image |
| 7: | IF () { |
| 8: | |
| 9: | |
| 10: | //Channel feature weights |
| 11: | //Spatial feature weights |
| 12: | //Extraction of feature information V |
| 13: | |
| 14: | |
| 15: | //Next frame position prediction |
| 16: | |
| 17: | //covariance matrix |
| 18: | //Calculate eye spacing, average eye size, nose size |
| 19: | //Calculate the total error |
| 20: | ELSE |
| 21: | continue |
| 22: | ENDIF |
| 23: | } |
| 24: | ENDFOR |
| 25: | } |
| 26: | } |
4. Methods and Materials
4.1. Data Acquisition
4.1.1. Dataset Normalization
4.1.2. Data Cleansing
4.2. Data Preprocessing
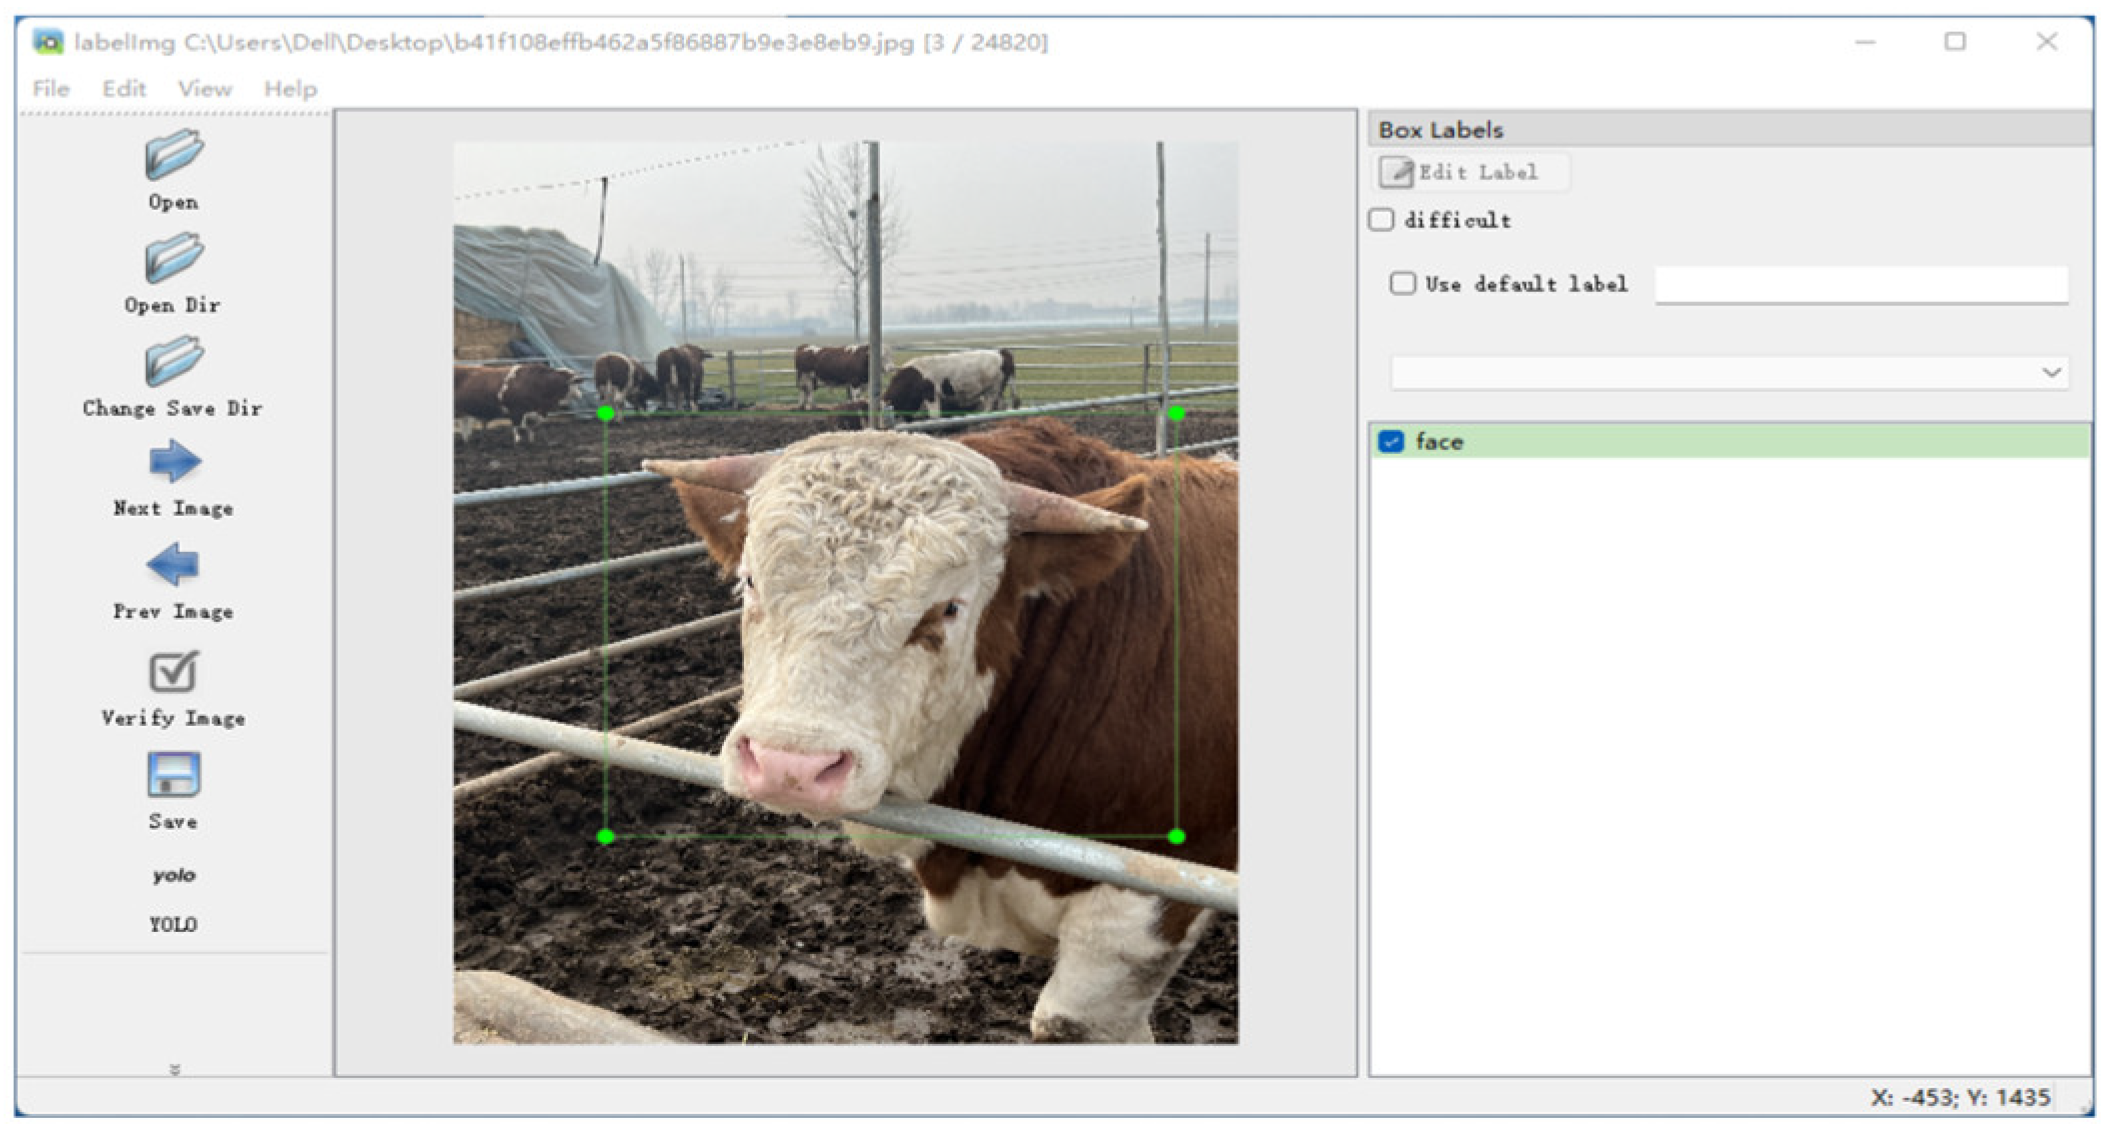
Data Labeling
4.3. Experimental Environment and Parameter Settings
5. Results and Discussion
5.1. Evaluation Indicators
5.2. CBC-YOLOv7 Ablation Experiments
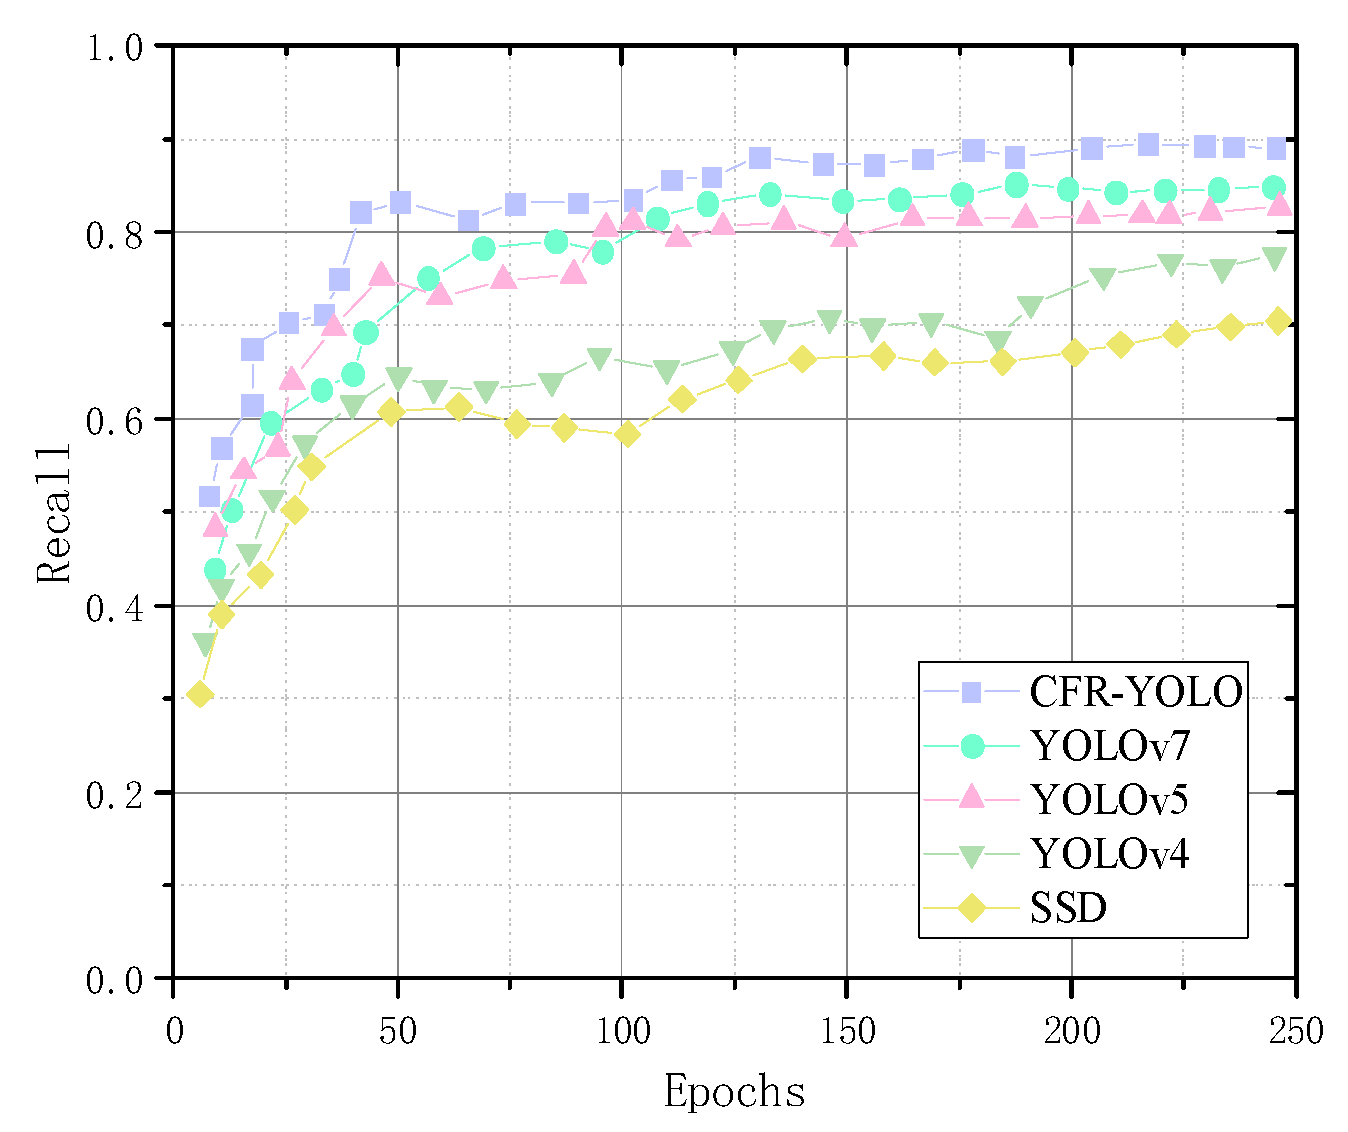
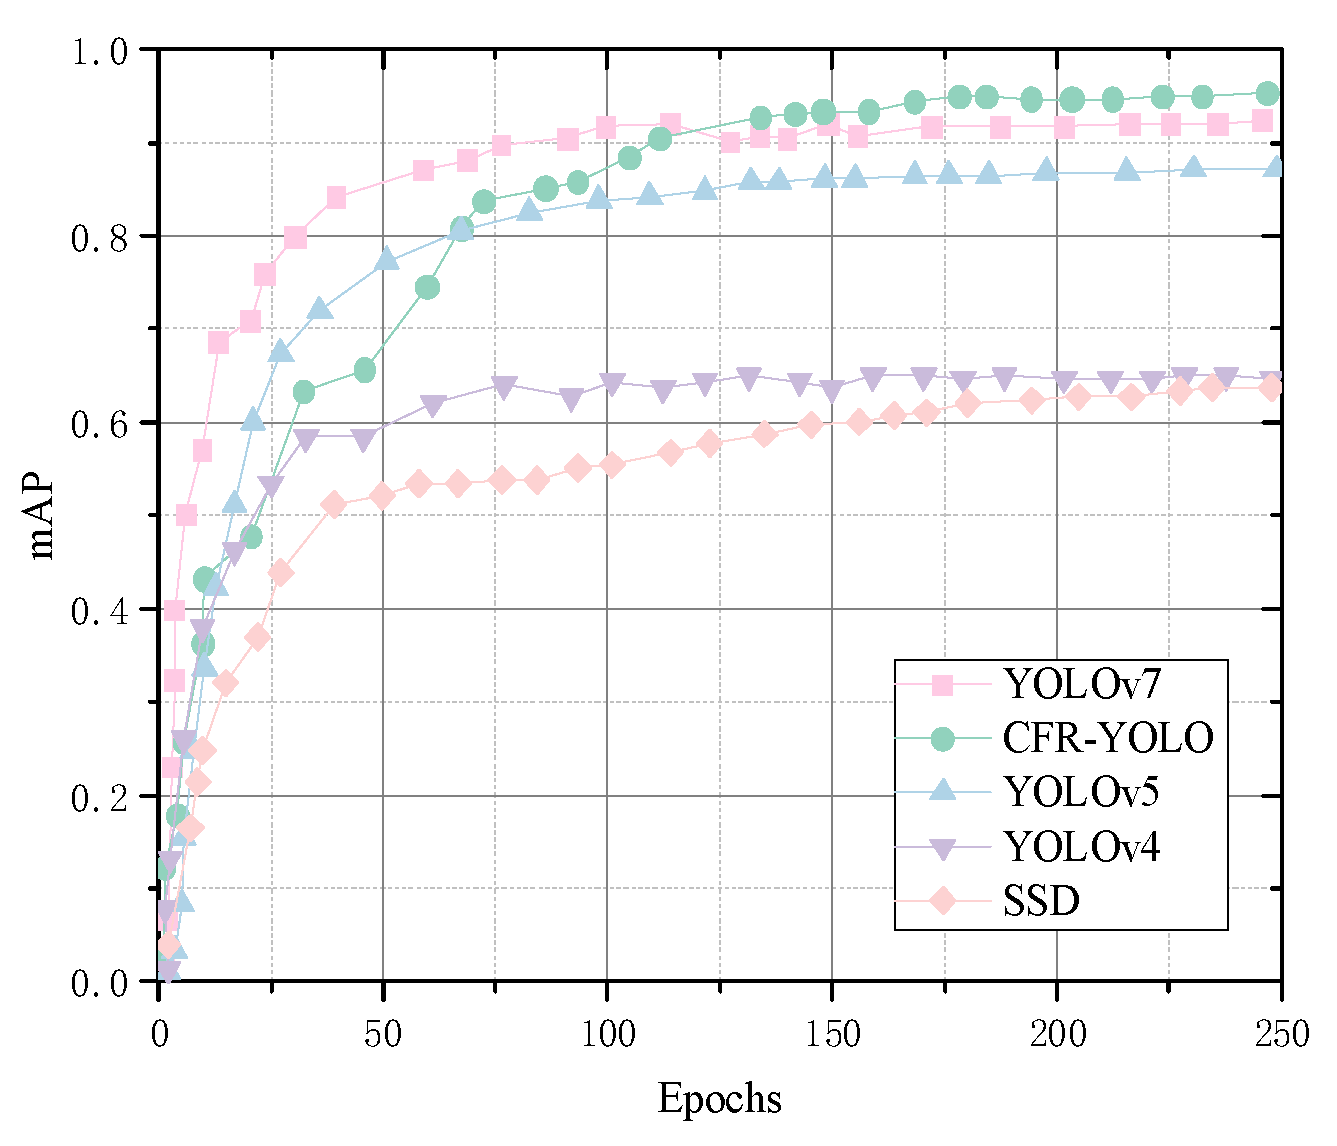
5.3. Comparative Experiments with Different Networks
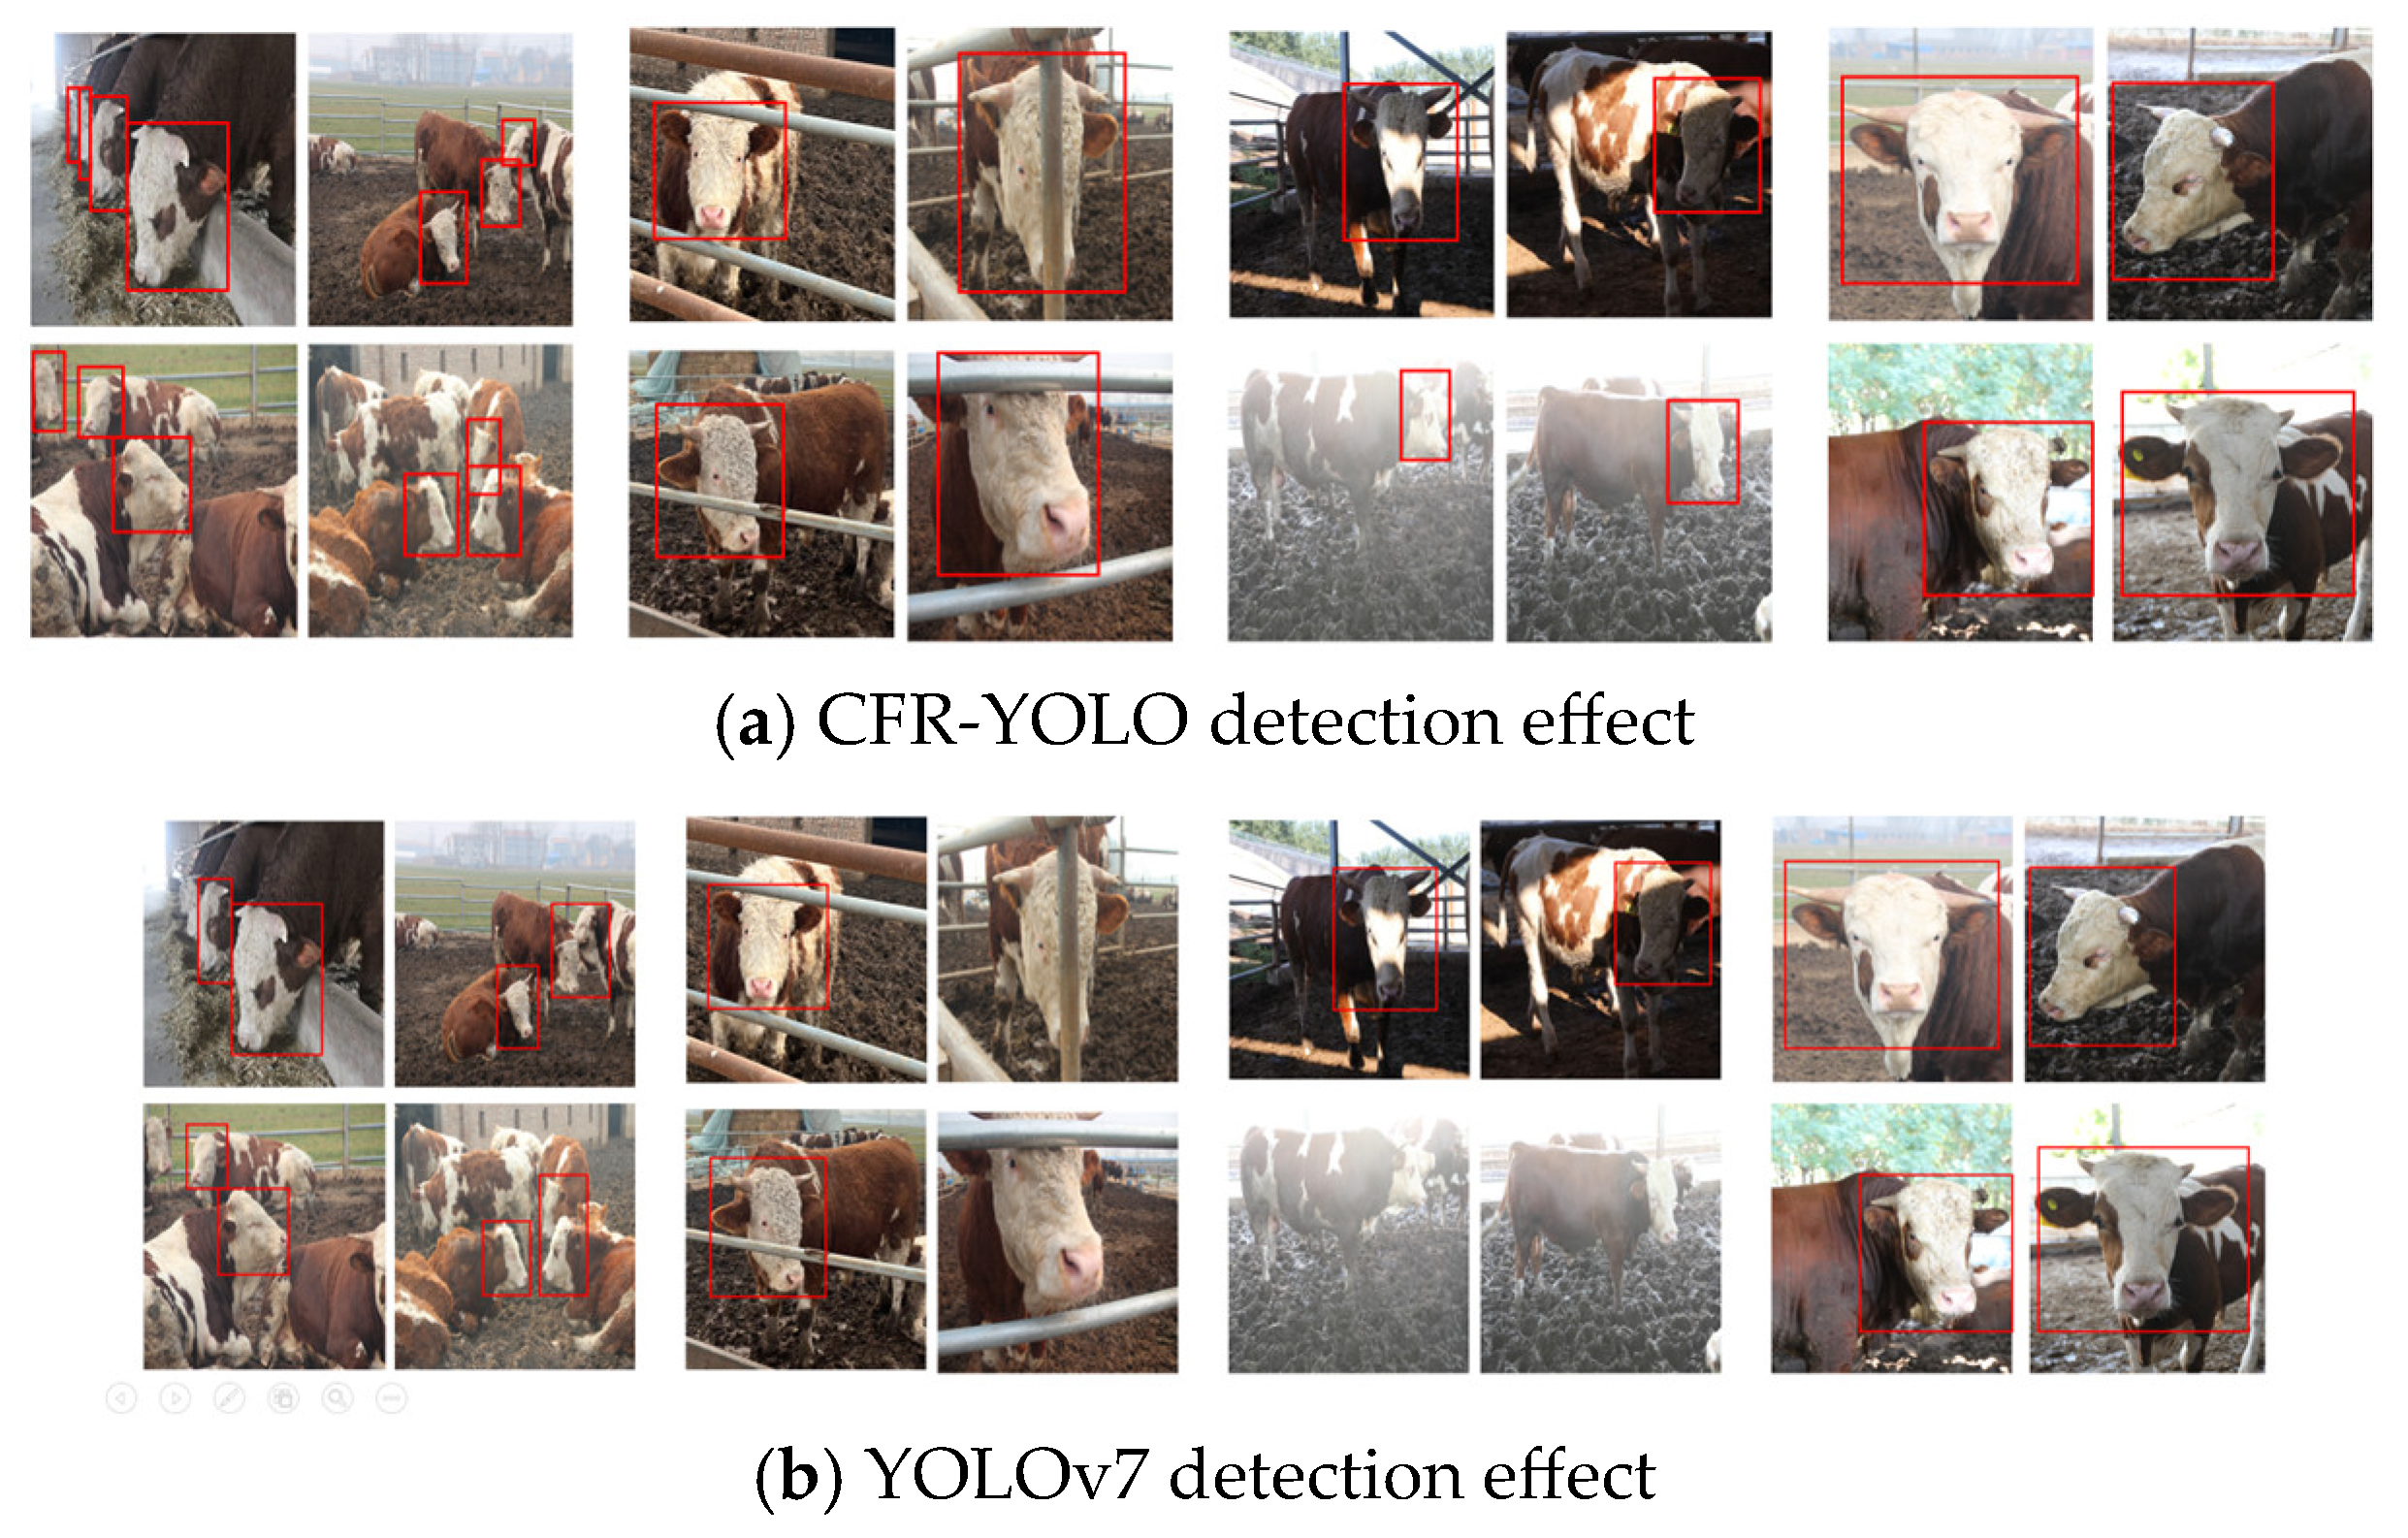
Comparison of Different Network Models in Complex Contexts
5.4. Evaluation of the Generalization Effect of CFR-YOLO
5.5. Experimental Analysis of the CFR-YOLO Method Applied to YOLOv8 andYOLOv9
6. Conclusions
Author Contributions
Funding
Institutional Review Board Statement
Informed Consent Statement
Data Availability Statement
Conflicts of Interest
References
- Noe, S.M.; Zin, T.T.; Tin, P. Comparing State-of-the-art deep learning algorithms for the automated detection and tracking of black cattle. Sensors 2023, 23, 532. [Google Scholar] [CrossRef] [PubMed]
- Bello, R.W.; Talib, A.Z.H.; Mohamed, A.S.A.B. Deep learning-based Architectures for detection of cow using cow nose image pattern. Gazi Univ. J. Sci. 2020, 33, 831–844. [Google Scholar] [CrossRef]
- Andrew, W.; Gao, J.; Mullan, S. Visual identification of individual Holstein-Friesian cattle via deep metric learning. Comput. Electron. Agric. 2021, 185, 106133. [Google Scholar] [CrossRef]
- Wang, H.Y.; Qin, J.P.; Hou, Q.Q. Cattle face detection method based on parameter transfer and deep learning. J. Phys. Conf. Ser. 2020, 1453, 012054. [Google Scholar] [CrossRef]
- Kaur, A.; Kumar, M.; Jindal, M.K. Shi-Tomasi corner detector for cattle identification from muzzle print image pattern. Ecol. Inform. 2022, 68, 101549. [Google Scholar] [CrossRef]
- Reuser, A.; Wenzel, K.; Felix, S.B. Simultaneous assessment of spontaneous cage activity and voluntary wheel running in group-housed mice. Sci. Rep. 2022, 12, 4444. [Google Scholar]
- Zhou, M.; Elmore, J.A.; Samiappan, S. Improving animal monitoring using small unmanned aircraft systems (Suas) and deep learning networks. Sensors 2021, 21, 5697. [Google Scholar] [CrossRef] [PubMed]
- Chen, X.L.; Yang, T.L.; Mai, K.Z. Holstein cattle face re-identification unifying global and part featuredeep network with attention mechanism. Animals 2022, 12, 1047. [Google Scholar] [CrossRef] [PubMed]
- Dac, H.H.; Viejo, C.G.; Lipovetzky, N. Livestock identification using deep learning for traceability. Sensors 2022, 22, 8256. [Google Scholar] [CrossRef] [PubMed]
- Gao, T.H.; Fan, D.J.; Wu, H.J. Research on the vision-based dairy cow ear tag detection method. Sensors 2024, 24, 2194. [Google Scholar] [CrossRef] [PubMed]
- Weng, Z.; Fan, L.; Zhang, Y. Facial Detection of Dairy Cattle Based on Improved Convolutional Neural Network. IEICE Trans. Inf. Syst. 2022, 105, 1234–1238. [Google Scholar] [CrossRef]
- Lazcano, C.A.A.; Espinosa, I.E.; Rios, J.A. Machine learning-based sensor data fusion for animal monitoring: Scoping review. Sensors 2023, 23, 5732. [Google Scholar] [CrossRef] [PubMed]
- Montalvan, S.; Arcos, P.; Sarzosa, P. Technologies and solutions for cattle tracking: A review of the state of the art. Sensors 2024, 24, 6486. [Google Scholar] [CrossRef] [PubMed]
- Adrion, F.; Kapun, A.; Holland, E.M. Novel approach to determine the influence of pig and cattle ears on the performance of passive UHF-RFID ear tags. Comput. Electron. Agric. 2017, 140, 168–179. [Google Scholar] [CrossRef]
- Cappai, M.G.; Rubiu, N.G.; Nieddu, G. Analysis of fieldwork activities during milk production recording in dairy ewes by means of individual ear tag (ET) alone or plus RFID based electronic identification (EID). Comput. Electron. Agric. 2017, 144, 324–328. [Google Scholar] [CrossRef]
- Geng, L.W.; Qian, D.P.; Zhao, C.H. Cow identification technologysystem1 based on radio frequency. TCSAE 2009, 25, 137–141. [Google Scholar]
- Xiong, S.H.; Sun, Z.H. Design of Milk Yield Monitoring System Based on RFID And Image Processing. Comput. Appl. Softw. 2018, 35, 267–272. [Google Scholar]
- Cai, C.; Song, X.X.; He, J.R. Algorithm and realization for cattle face contour extraction based on computer vision. Trans. CSAE 2017, 33, 171–177. [Google Scholar]
- Lv, F.; Zhang, C.M.; Lv, C.W. Image Detection of Individual Cow Basedon SIFT in Laβ Color Space; ISCIPT2018; Scitepress: Hangzhou, China, 2018. [Google Scholar]
- Gou, X.T.; Huang, W.; Liu, Q.F. A Cattle Face Detection Method Based on Improved NMS. Comput. Mod. 2019, 7, 1006–2475. [Google Scholar]
- Yang, Z.; Xiong, H.; Chen, X. Dairy cow tiny face detection based on convolutional neural networks. In Chinese Conference on Biometric Detection; Springer: Cham, Switzerland, 2019; pp. 216–222. [Google Scholar]
- Xia, M.; Cai, C. Cattle face detection using sparse representation classifier. ICIC Express Lett. Part B Appl. Int. J. Res. Surv. 2012, 3, 1499–1505. [Google Scholar]
- Cai, C.; Li, J. Cattle face detection using local binary pattern descriptor. In Proceedings of the Asia-Pacific Signal and Information Processing Association Annual Summit and Conference, Taiwan, China, 29 October–1 November 2013; pp. 1–4. [Google Scholar]
- Kim, H.T.; Choi, H.L.; Lee, D.W. Detection of individual Holstein cattle by imaging body patterns. Asian-Australas. J. Anim. Sci. 2005, 18, 1194–1198. [Google Scholar] [CrossRef]
- Chen, J.J.; Liu, C.X.; Gao, Y.F. Cow detection algorithm based on improved bag of feature model. J. Comput. Appl. 2016, 36, 2346–2351. [Google Scholar]
- Li, Z.; Lei, X.M. Cattle Face Detection Under Partial Occlusion. J. Intell. Fuzzy Syst. 2022, 43, 67–77. [Google Scholar] [CrossRef]
- Xu, X.S.; Wang, Y.F.; Hua, Z.X. Light-weight detection network for dairy cows based on the fusion of YOLOv5s and channel pruning algorithm. Trans. CSAE 2023, 39, 153–163. [Google Scholar]
- Yang, S.Q.; Liu, Y.Q.; Wang, Z. Improved YOLO V4 model for face detection of diary cow by fusing coordinate information. Trans. Chin. Soc. Agric. Eng. 2021, 37, 129–135. [Google Scholar]
- Wang, P.X.; Zhang, S.B.; Cheng, M. Coin surface defect detection algorithm based on deformable convolution and adaptive spatial feature fusion. J. Comput. Appl. 2022, 42, 638–645. [Google Scholar]
- Zhu, X.L.; Yu, S.; Wang, X. TPH-YOLOv5: Improved YOLOv5 Based on Transformer Prediction Head for Object Detection on Drone-captured Scenarios. arXiv 2018, arXiv:2108.11539. [Google Scholar]
- Li, N.; Ren, H.Y.; Ren, Z.H. Research of behavior monitoring method of fock hens based on deep learning. J. Hebei Agric. Univ. 2021, 44, 117–121. [Google Scholar]
- He, Y.T.; Li, B.; Zhang, F. Pig face detection based on improved YOLOv3. J. China Agric. Univ. 2021, 26, 53–62. [Google Scholar]
- Wei, B.; Billah, M.; Wang, M.L. Method of Goat Face Detection and Detection Based on Deep Learning. J. Domest. Anim. Ecol. 2022, 43, 47–50. [Google Scholar]
- Kim, H.T.; Ikeda, Y.; Hong, L.C. The Identification of Japanese Black Cattle by Their Faces. Asian Australas. J. Anim. Ences 2005, 18, 868–872. [Google Scholar] [CrossRef]
- Yao, L.Y.; Xiong, H.; Zhong, Y.J. Comparison of cow face detection algorithms based on deep network model. J. Jiangsu Univ. 2019, 40, 6. [Google Scholar]
- Gou, X.T.; Huang, W.; Liu, Q.F. Cattle face detection based on improved SSD model. Comput. Mod. 2020, 41, 1000–7024. [Google Scholar]
- Meng, D.; Shan, W.; Mu, D.C. Based on the improved YOLOv7-Pose network integrated body measurement counting algorithm. J. Huabei Norm. Univ. 2024, 45, 73–78. [Google Scholar]
- Qi, Y.S.; Jiao, J.; Bao, T.F. Cattle face detection algorithm in complex scenes using adaptive attention mechanism. Trans. Chin. Soc. Agric. Eng. 2023, 39, 173–183. [Google Scholar]

 Shared MLP represents a per-element addition operation;
  Global MaxPool represents the Sigmoid activation function operation;
  Globa AvgPool represents the by-element multiplication operation; H and W represent the height and width of the feature maps, respectively; and C is the number of channels.
Shared MLP represents a per-element addition operation; Global MaxPool represents the Sigmoid activation function operation; Globa AvgPool represents the by-element multiplication operation; H and W represent the height and width of the feature maps, respectively; and C is the number of channels.
Globa AvgPool represents the by-element multiplication operation; H and W represent the height and width of the feature maps, respectively; and C is the number of channels.
Shared MLP represents a per-element addition operation; Global MaxPool represents the Sigmoid activation function operation; Globa AvgPool represents the by-element multiplication operation; H and W represent the height and width of the feature maps, respectively; and C is the number of channels.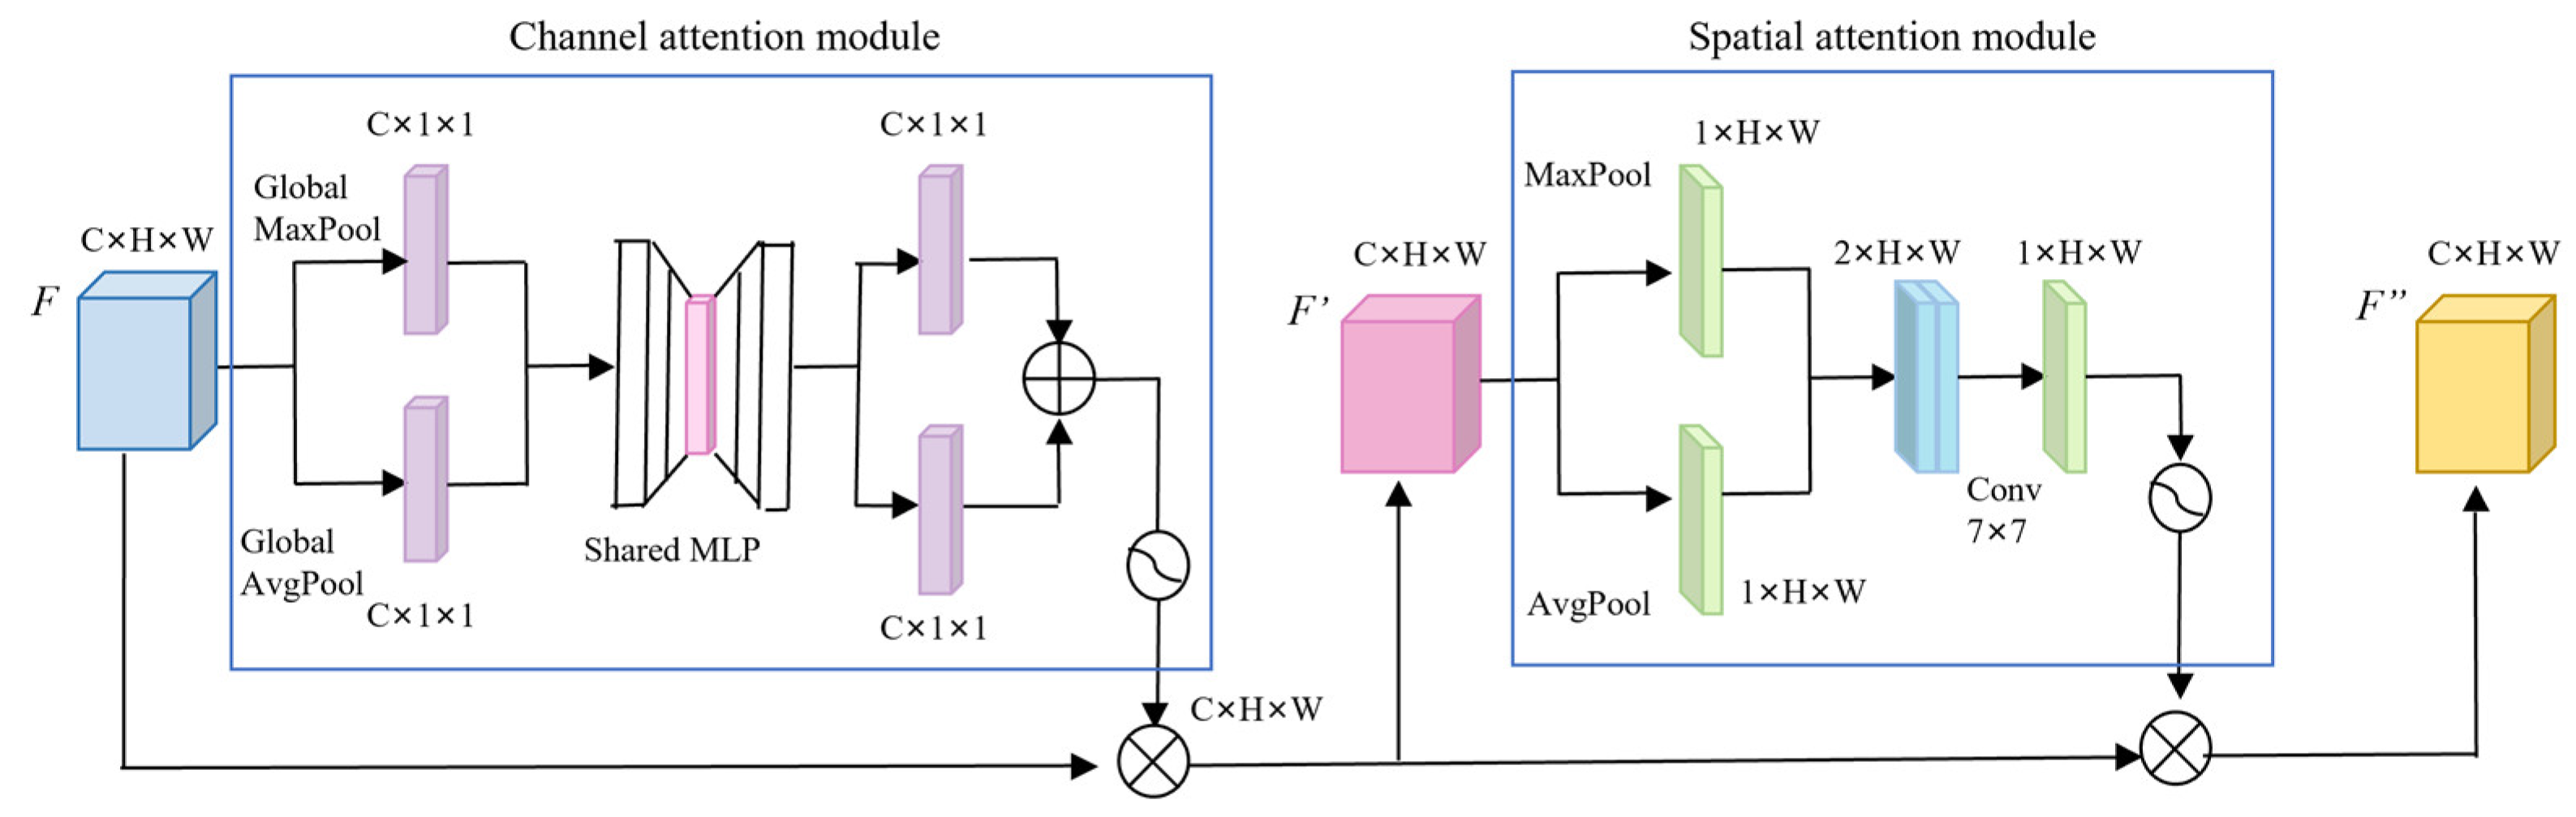


| Cow Face Detection Dataset | Before Data Enhancement | After Data Enhancement |
|---|---|---|
| Training set | 2081 | 6832 |
| Validation set | 594 | 1952 |
| Test set | 297 | 1455 |
| Parametric | Be on Duty |
|---|---|
| Pytorch | 1.2.0 |
| Batch size | 16 |
| Momentum | 0.935 |
| Initial learning rate | 0.001 |
| Learning rate decay factor | 0.2 |
| Epoch | 250 |
| Data enhancement approach | mosaic enhancement |
| Weight decay factor | 0.0005 |
| Quantity per input | 10 |
| Number of categories | 80 |
| Optimizer | Adam |
| Number of projected frames/pc | 3 |
| Learning rate decay step Batch Size | 20 1000 |
| Network | Parameters | Value |
|---|---|---|
| YOLOv7 | Conv layer | 15 |
| Max-pooling layer | 45 | |
| Learning rate | 0.01 | |
| Enter a size | 640 × 640 | |
| Weight_decay | 0.0005 | |
| YOLOv5 | Feature map Conv layer Max-pooling layer CRL kernel Feature dimension CBL kernel | 128 15 45 3×3 512 5 × 5 |
| YOLOv4 | Max-batches Decay Enter a size Activate the function Network structure | 20,000 0.0005 640 × 640 Mish CSPDarknet53 |
| SSD | Enter a size Conv layer Conv kernel Feature dimension | 512 × 512 30 3 × 3 300 |
| CFR-YOLO | Learning rate Regularization coefficient Batch size Activate the function | 0.01 0.0005 16 FReLU |
| Reticulation | Precision | Accuracy | Recall | Map% | F1% |
|---|---|---|---|---|---|
| YOLOv7 | 90.37 | 92.23 | 91.24 | 90.41 | 91.73 |
| YOLOv7 + RFB | 94.21 | 96.34 | 92.52 | 91.84 | 94.39 |
| YOLOv7 + CBAM | 95.25 | 96.62 | 93.64 | 93.25 | 95.10 |
| YOLOv7 + CBF | 92.53 | 94.28 | 92.03 | 90.78 | 93.14 |
| YOLOv7 + RFB + CBAM + CBF | 97.29 | 98.46 | 97.21 | 97.04 | 97.83 |
| Method | Accuracy % | Recall % | mAP | Loss |
|---|---|---|---|---|
| SSD | 85.54 | 83.13 | 81.02 | 0.41 |
| YOLOv4 | 88.67 | 86.54 | 85.28 | 0.35 |
| YOLOv5 | 90.38 | 89.57 | 87.31 | 0.29 |
| YOLOv7 | 92.23 | 91.24 | 90.14 | 0.25 |
| CFR-YOLO | 98.46 | 97.21 | 96.27 | 0.18 |
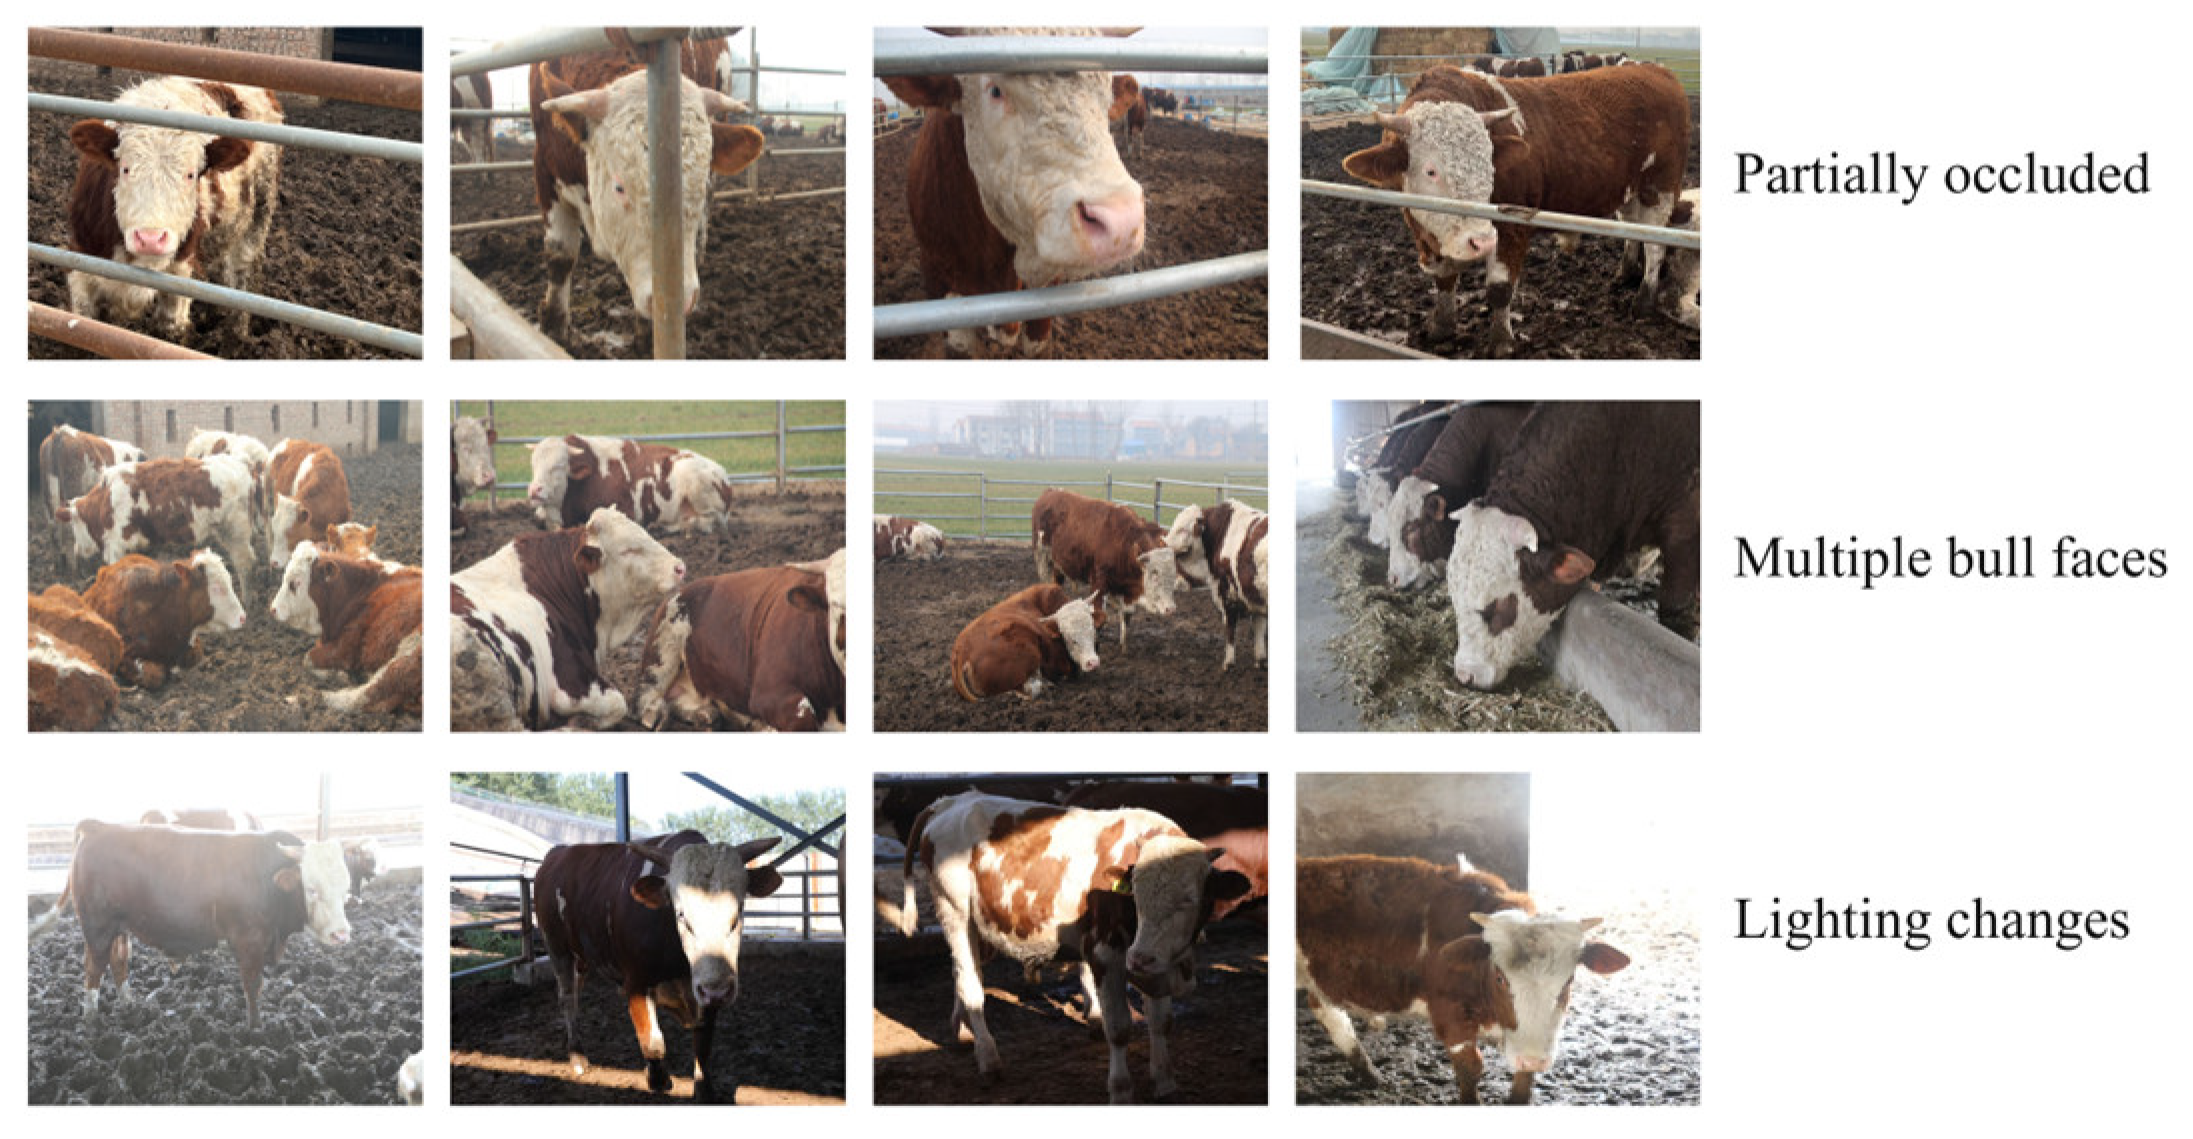
| Cow Face Detection Model | Single Cow Face (%) | Multiple Cow Faces (%) | Partial Shade (%) | Change in Light (%) |
|---|---|---|---|---|
| SSD | 82.02 | 78.12 | 74.52 | 80.34 |
| YOLOv4 | 86.28 | 82.23 | 78.64 | 83.83 |
| YOLOv5 | 88.31 | 84.51 | 81.09 | 86.13 |
| YOLOv7 | 91.14 | 88.64 | 84.22 | 89.67 |
| CFR-YOLO | 96.27 | 93.77 | 87.32 | 93.74 |
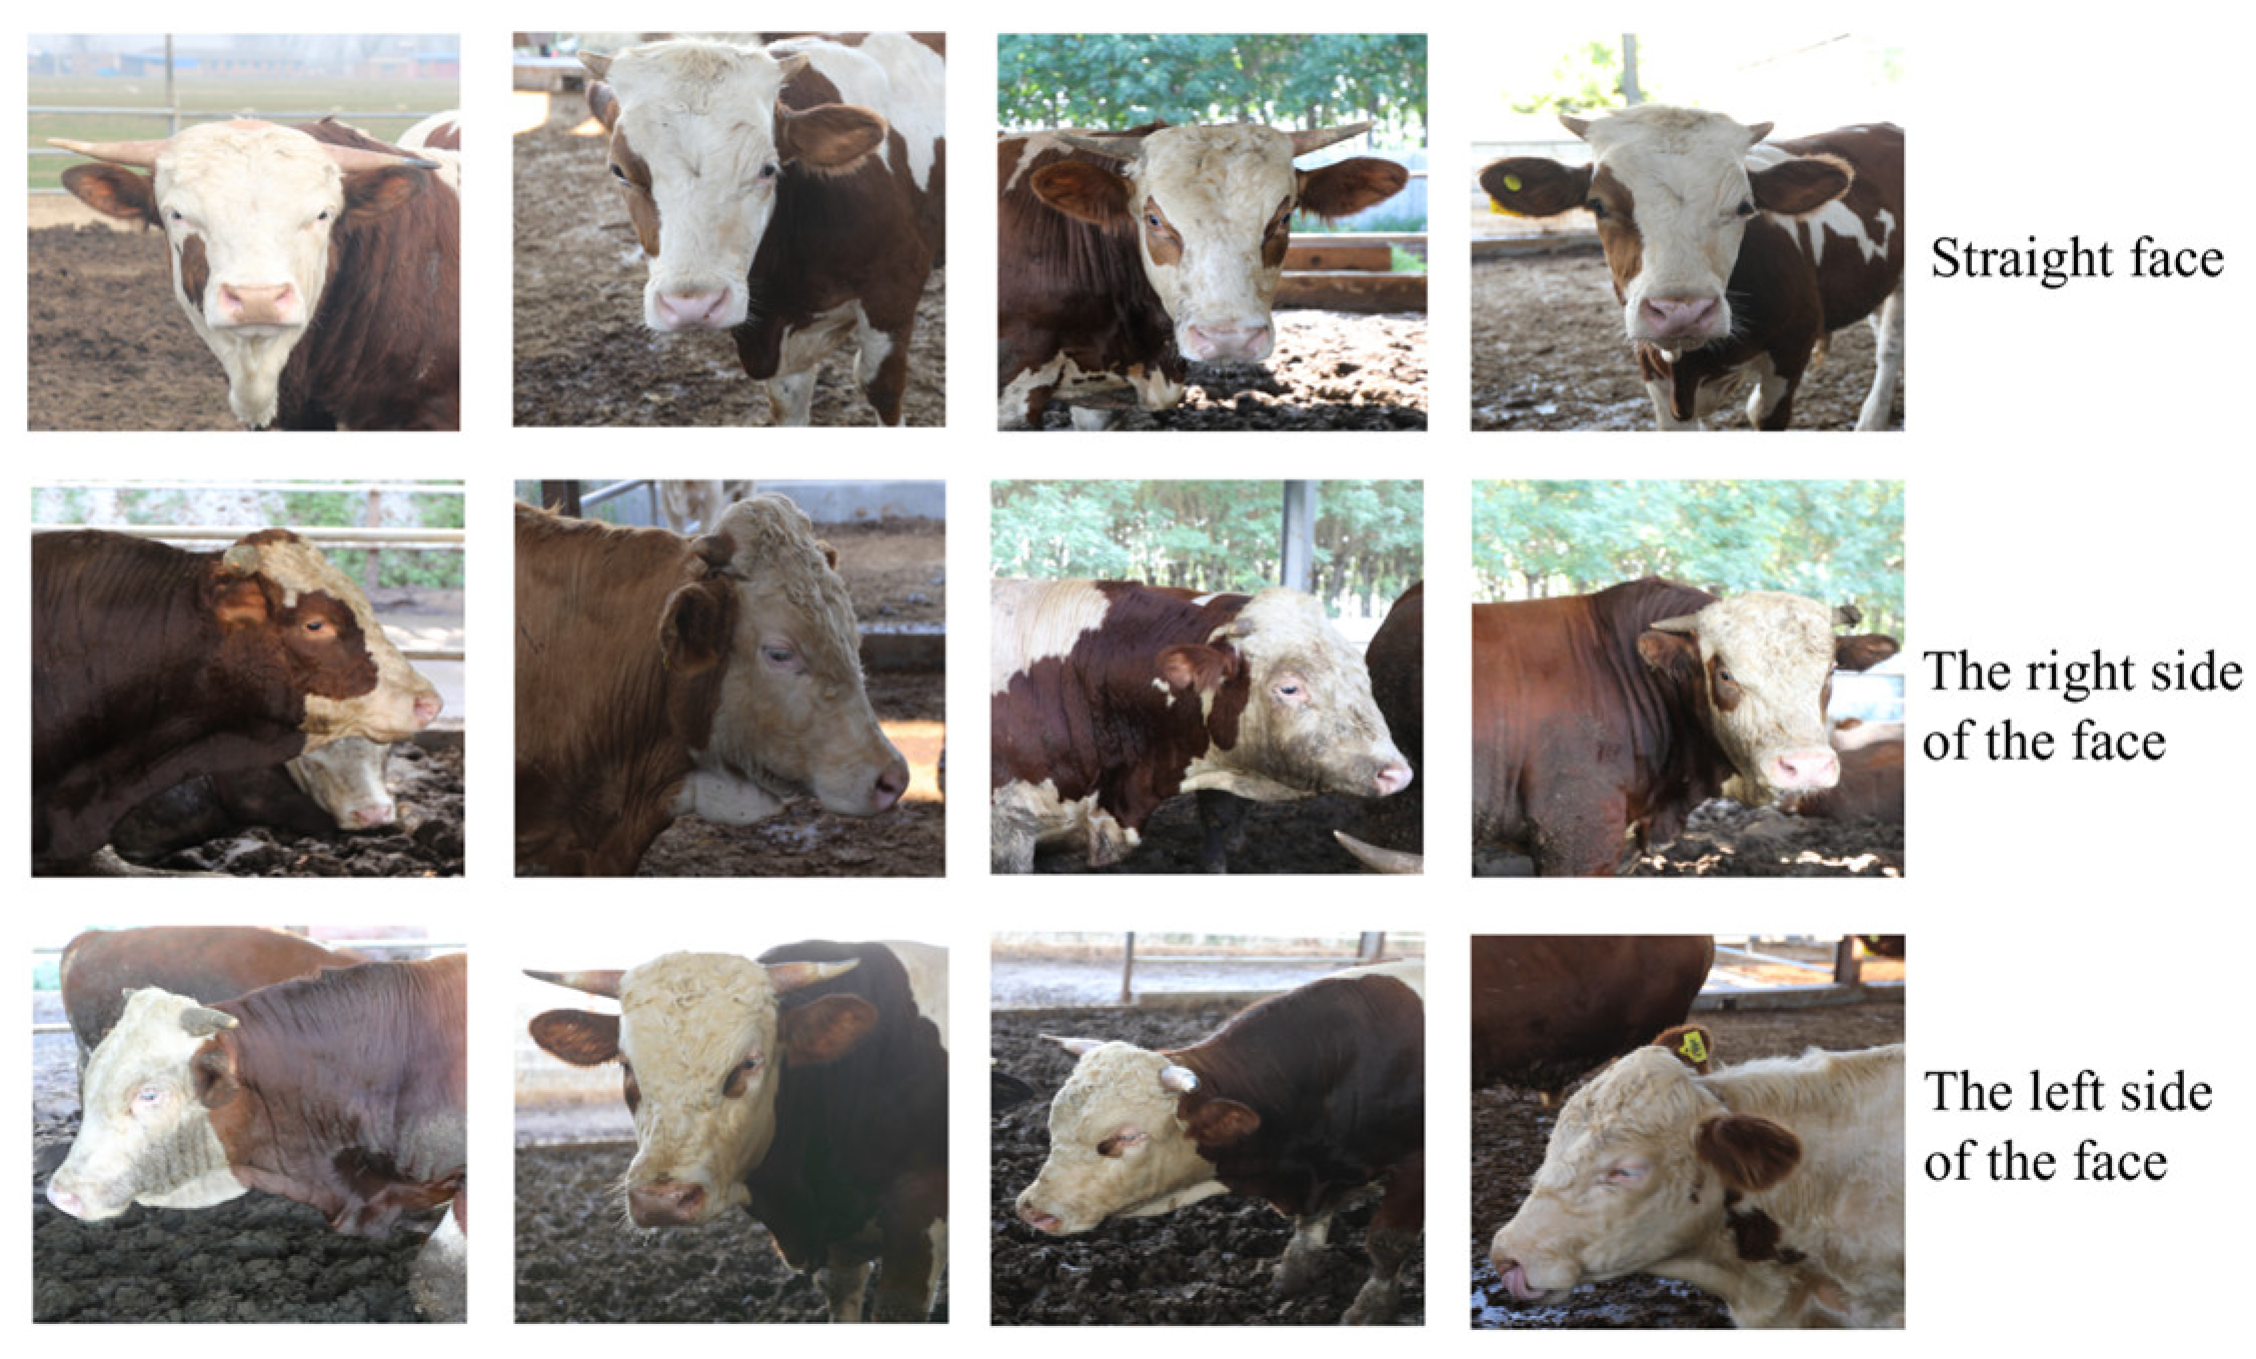
| Cow Face Detection Model | Front Face (%) | Side Face (%) | Partial Shade |
|---|---|---|---|
| SSD | 85.54 | 81.42 | 73.31 |
| YOLOv4 | 88.67 | 84.78 | 75.23 |
| YOLOv5 | 90.38 | 87.36 | 79.52 |
| YOLOv7 | 92.23 | 90.23 | 80.41 |
| CFR-YOLO | 98.46 | 97.53 | 84.06 |
Disclaimer/Publisher’s Note: The statements, opinions and data contained in all publications are solely those of the individual author(s) and contributor(s) and not of MDPI and/or the editor(s). MDPI and/or the editor(s) disclaim responsibility for any injury to people or property resulting from any ideas, methods, instructions or products referred to in the content. |
© 2025 by the authors. Licensee MDPI, Basel, Switzerland. This article is an open access article distributed under the terms and conditions of the Creative Commons Attribution (CC BY) license (https://creativecommons.org/licenses/by/4.0/).
Share and Cite
Gao, G.; Ma, Y.; Wang, J.; Li, Z.; Wang, Y.; Bai, H. CFR-YOLO: A Novel Cow Face Detection Network Based on YOLOv7 Improvement. Sensors 2025, 25, 1084. https://doi.org/10.3390/s25041084
Gao G, Ma Y, Wang J, Li Z, Wang Y, Bai H. CFR-YOLO: A Novel Cow Face Detection Network Based on YOLOv7 Improvement. Sensors. 2025; 25(4):1084. https://doi.org/10.3390/s25041084
Chicago/Turabian StyleGao, Guohong, Yuxin Ma, Jianping Wang, Zhiyu Li, Yan Wang, and Haofan Bai. 2025. "CFR-YOLO: A Novel Cow Face Detection Network Based on YOLOv7 Improvement" Sensors 25, no. 4: 1084. https://doi.org/10.3390/s25041084
APA StyleGao, G., Ma, Y., Wang, J., Li, Z., Wang, Y., & Bai, H. (2025). CFR-YOLO: A Novel Cow Face Detection Network Based on YOLOv7 Improvement. Sensors, 25(4), 1084. https://doi.org/10.3390/s25041084