
Frequency Diverse Array and Spotlight Synthetic Aperture Radar 2D Imaging Based on Multiple Repeated Subpulses


Abstract
1. Introduction
2. Preliminaries
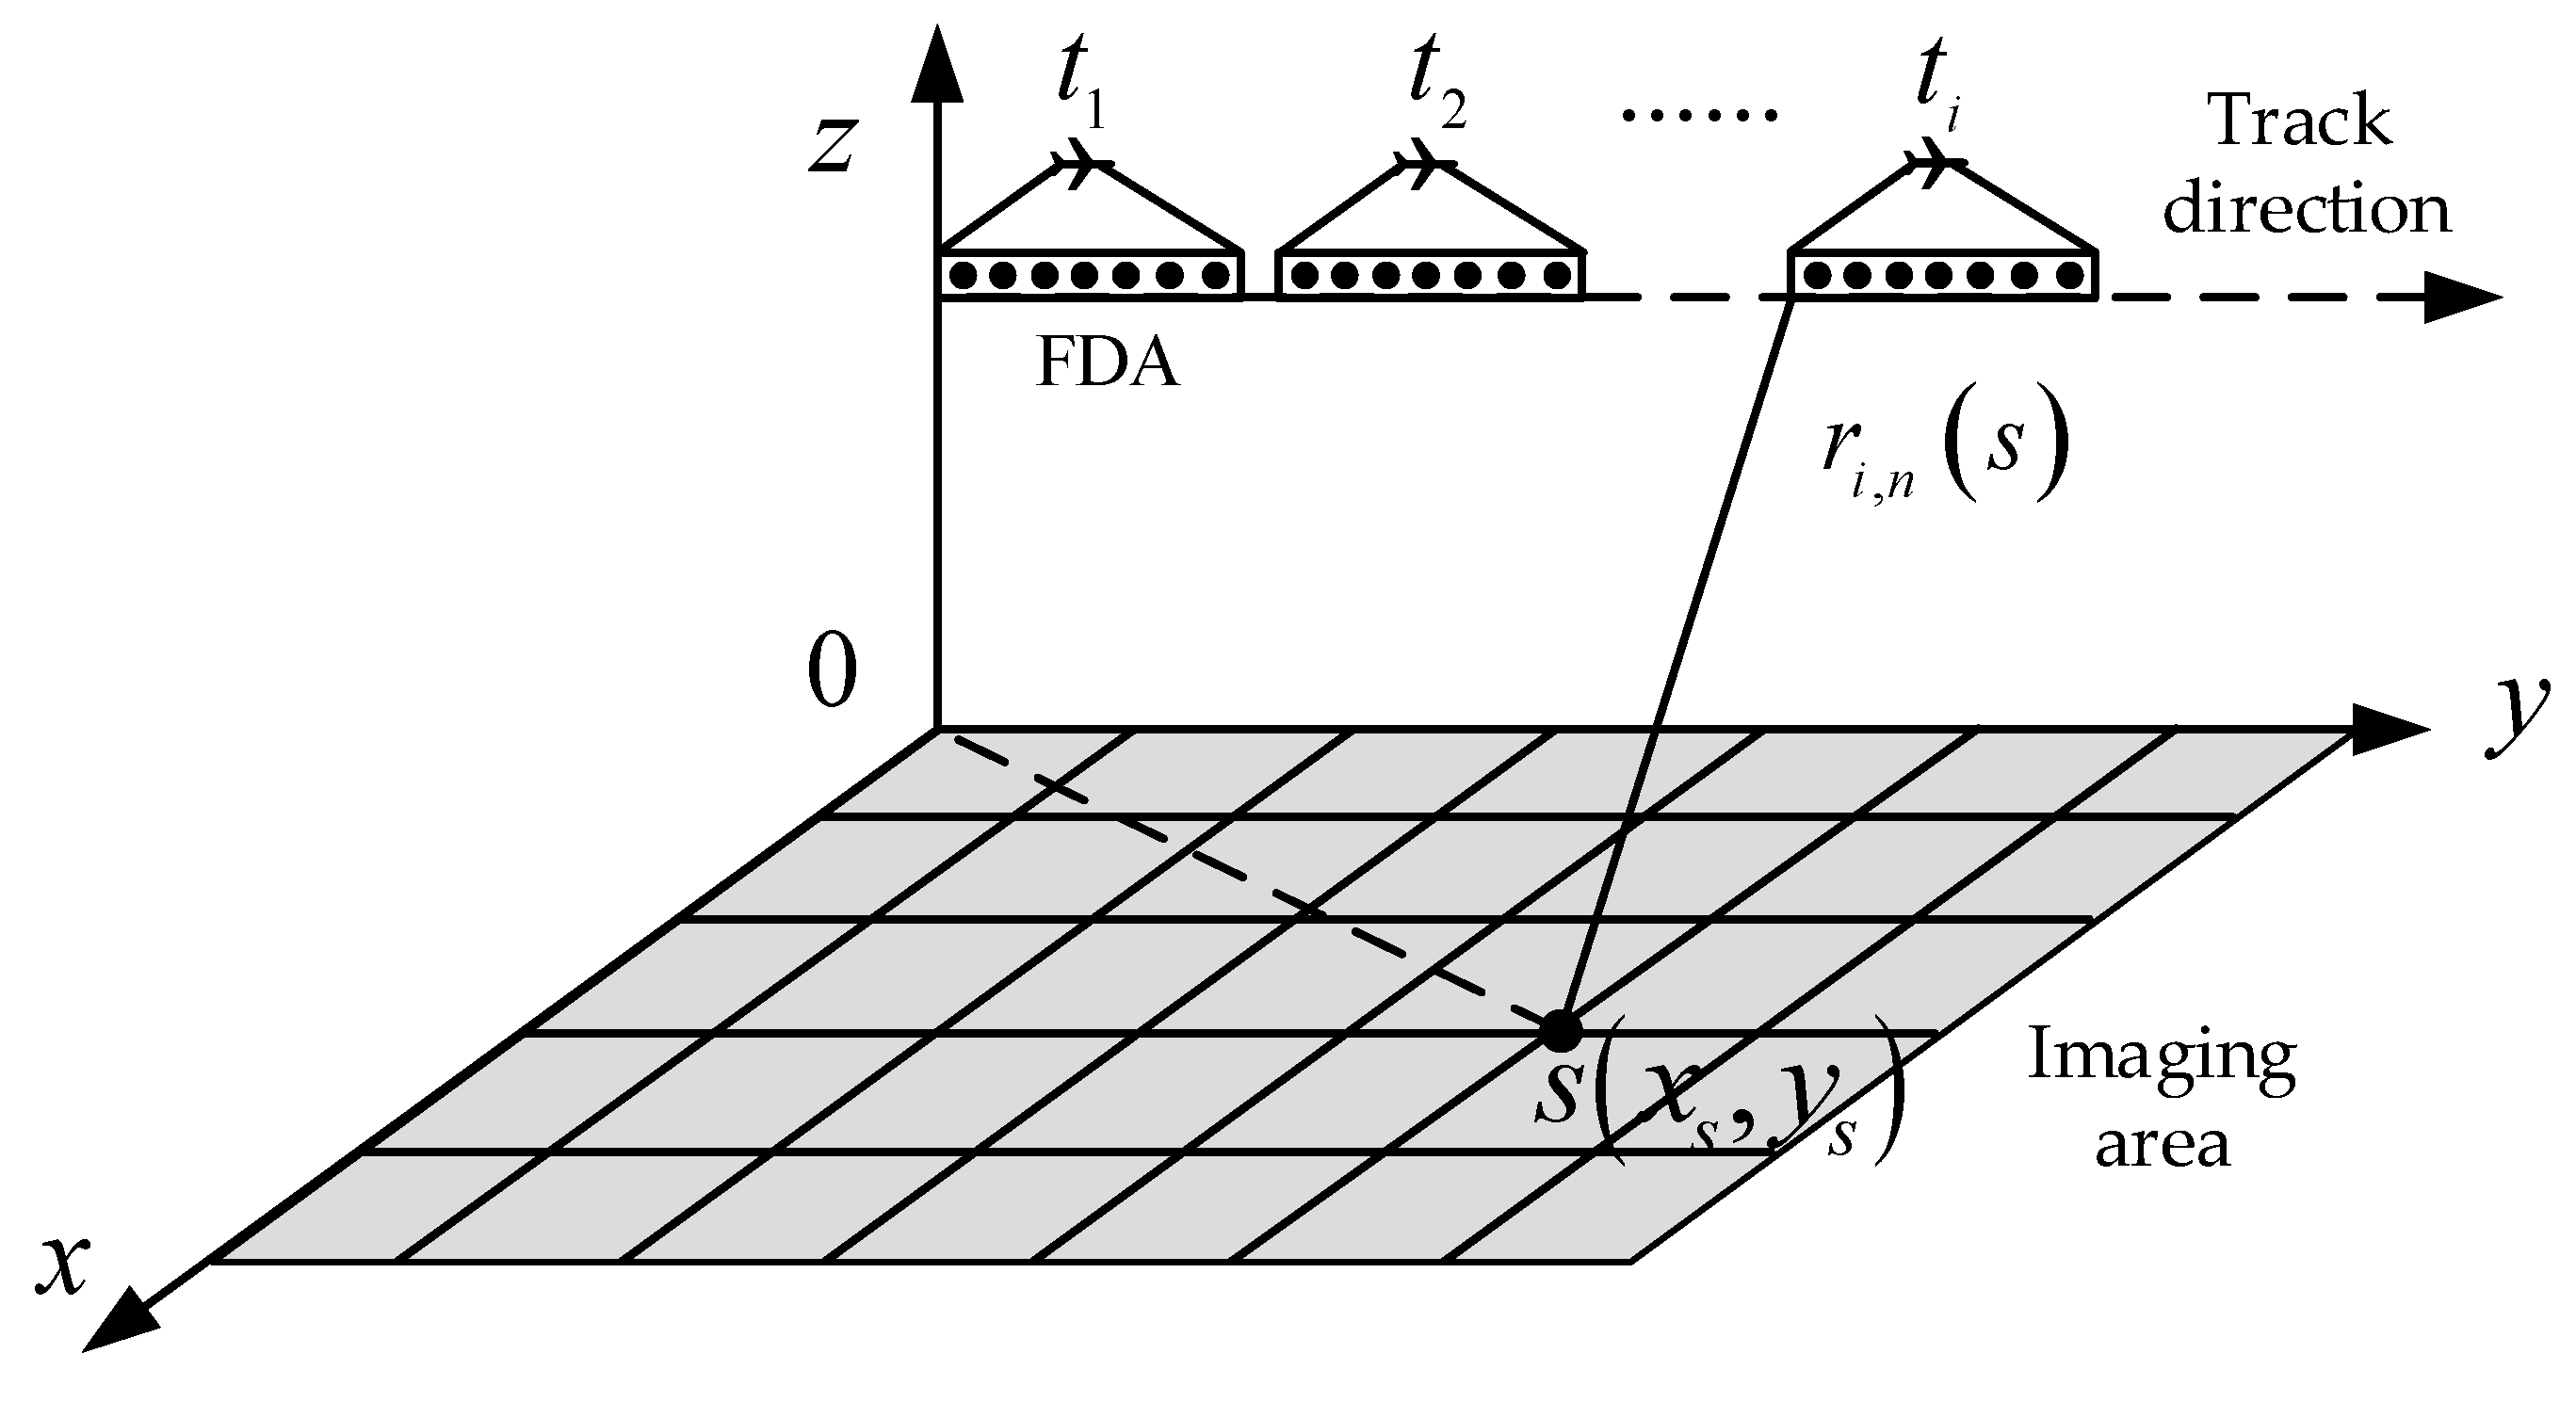
2.1. Imaging Model
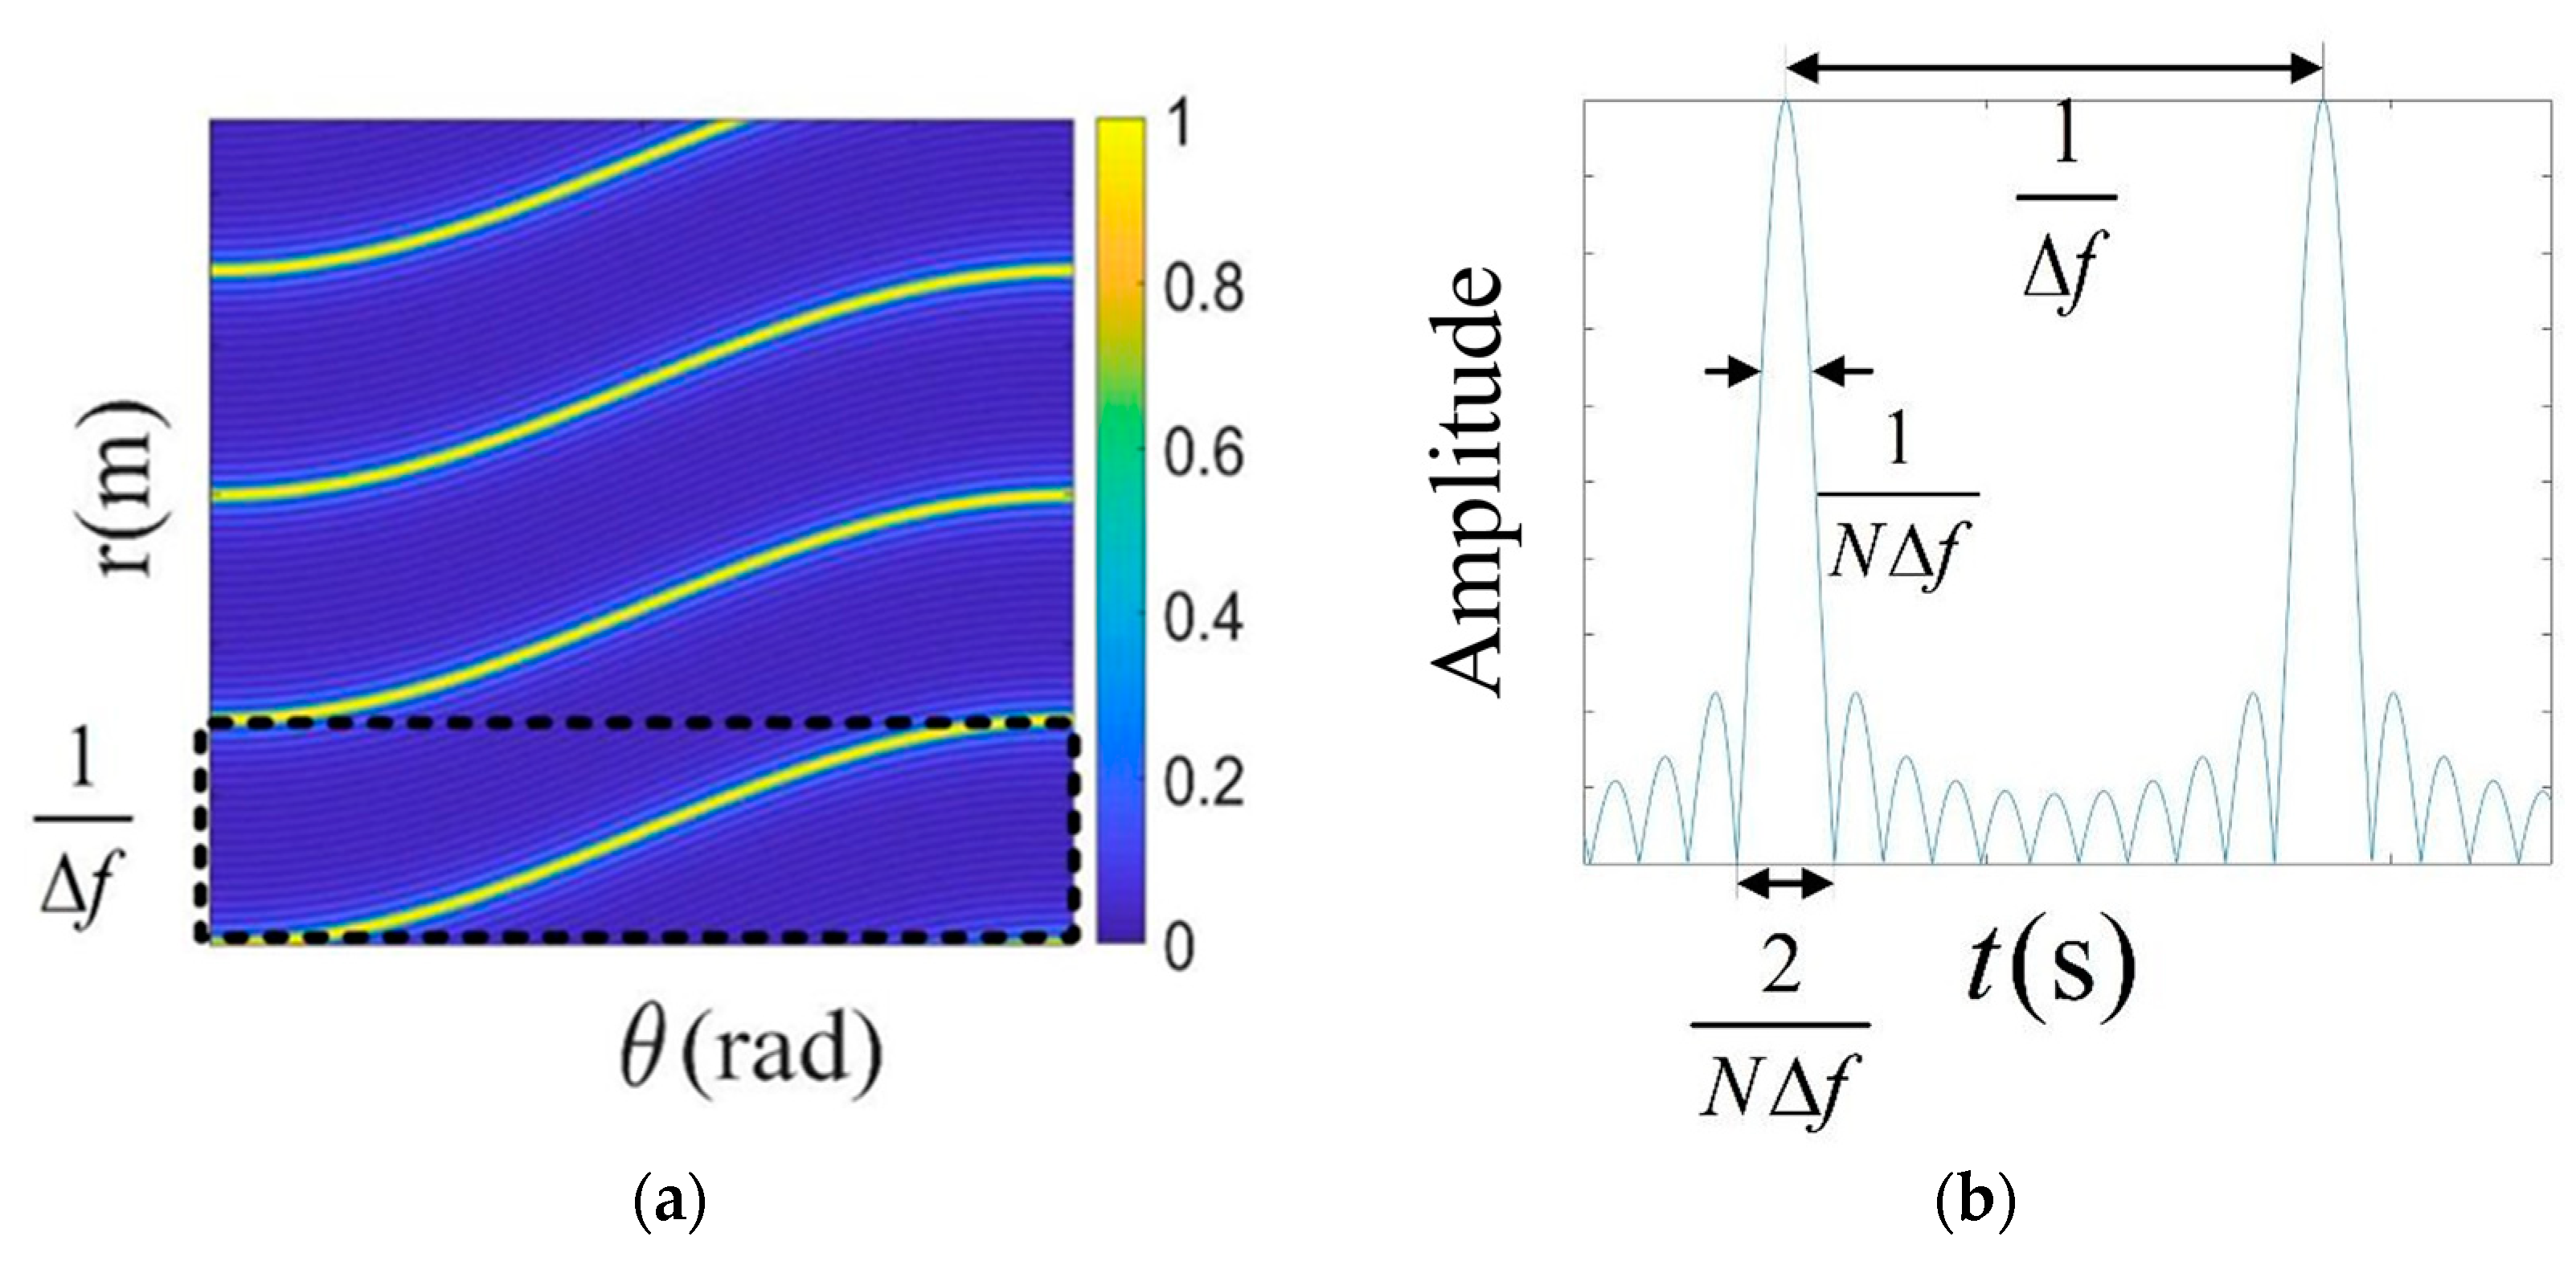
2.2. Imaging Resolution Analysis
3. MRS-FDA-SSAR 2D Imaging Method
3.1. BP Imaging Algorithm
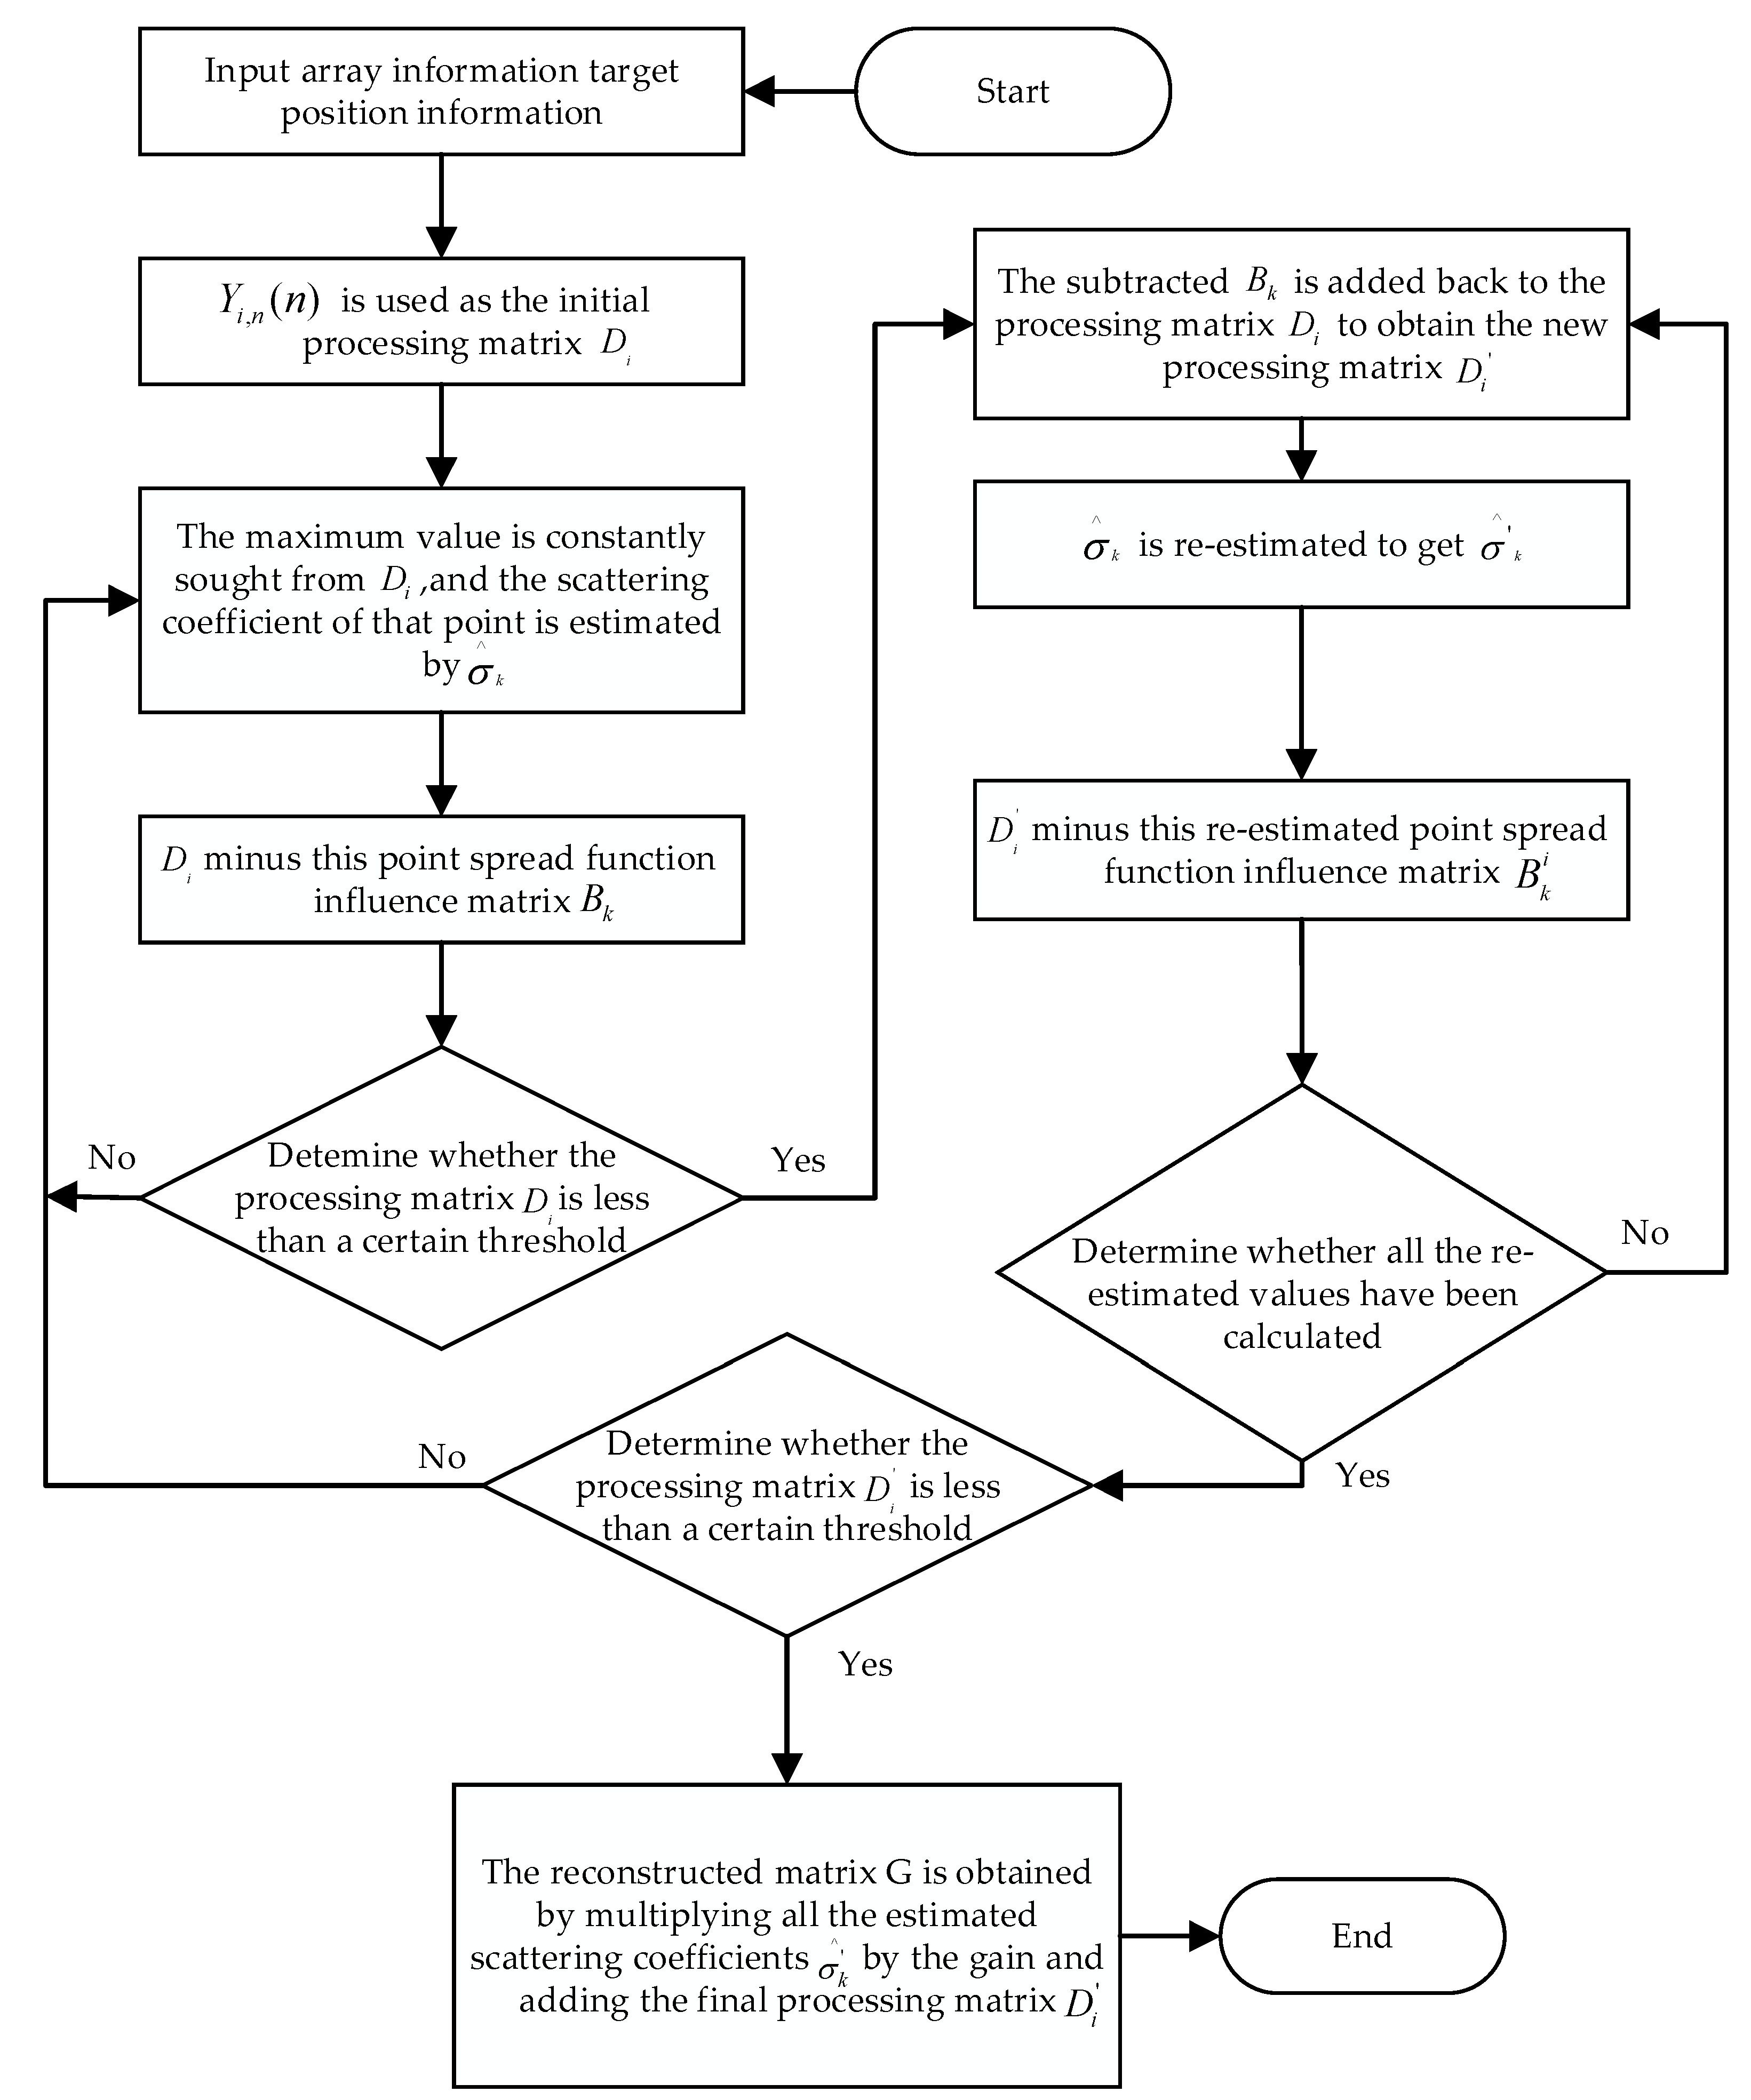
3.2. Deconvolution Imaging Algorithm
4. Simulation Experiment
- 1.
- Target-to-Background Ratio (TBR)
- 2.
- Image Entropy (ENT)
5. Conclusions
Author Contributions
Funding
Institutional Review Board Statement
Informed Consent Statement
Data Availability Statement
Conflicts of Interest
References
- Sun, G.-C.; Liu, Y.; Xiang, J.; Liu, W.; Xing, M.; Chen, J. Spaceborne Synthetic Aperture Radar Imaging Algorithms: An Overview. IEEE Geosci. Remote Sens. Mag. 2022, 10, 161–184. [Google Scholar] [CrossRef]
- Frazier, C.H.; O’Brien, W.D. Synthetic Aperture Techniques with a Virtual Source Element. IEEE Trans. Ultrason. Ferroelectr. Freq. Control 1998, 45, 196–207. [Google Scholar] [CrossRef]
- An, D.; Huang, X.; Jin, T.; Zhou, Z. Extended Two-Step Focusing Approach for Squinted Spotlight SAR Imaging. IEEE Trans. Geosci. Remote Sens. 2012, 50, 2889–2900. [Google Scholar] [CrossRef]
- Lanari, R.; Tesauro, M.; Sansosti, E.; Fornaro, G. Spotlight SAR Data Focusing Based on a Two-Step Processing Approach. IEEE Trans. Geosci. Remote Sens. 2001, 39, 1993–2004. [Google Scholar] [CrossRef]
- Zhou, F.; Yang, J.; Jia, L.; Yang, X.; Xing, M. Ultra-High Resolution Imaging Method for Distributed Small Satellite Spotlight MIMO-SAR Based on Sub-Aperture Image Fusion. Sensors 2021, 21, 1609. [Google Scholar] [CrossRef] [PubMed]
- Reigber, A.; Schreiber, E.; Trappschuh, K.; Pasch, S.; Mueller, G.; Kirchner, D.; Gesswein, D.; Schewe, S.; Nottensteiner, A.; Limbach, M.; et al. The High-Resolution Digital-Beamforming Airborne SAR System DBFSAR. Remote Sens. 2020, 12, 1710. [Google Scholar] [CrossRef]
- Krieger, G. MIMO-SAR: Opportunities and Pitfalls. IEEE Trans. Geosci. Remote Sens. 2014, 52, 2628–2645. [Google Scholar] [CrossRef]
- Wang, J.; Liang, X.-D.; Chen, L.-Y.; Li, Y.-L. First Demonstration of Airborne MIMO SAR System for Multimodal Operation. IEEE Trans. Geosci. Remote Sens. 2022, 60, 5204113. [Google Scholar] [CrossRef]
- Wen, Y.; Zhang, Z.; Chen, Z.; Qiu, J.; Ren, M.; Meng, X. A Novel Time-Domain Frequency Diverse Array HRWS Imaging Scheme for Spotlight SAR. Remote Sens. 2022, 14, 1085. [Google Scholar] [CrossRef]
- Zhou, Y.; Wang, W.; Chen, Z.; Zhao, Q.; Zhang, H.; Deng, Y.; Wang, R. High-Resolution and Wide-Swath SAR Imaging Mode Using Frequency Diverse Planar Array. IEEE Geosci. Remote Sens. Lett. 2021, 18, 321–325. [Google Scholar] [CrossRef]
- Deng, Y.; Yu, W.; Wang, P.; Xiao, D.; Wang, W.; Liu, K.; Zhang, H. The High-Resolution Synthetic Aperture Radar System and Signal Processing Techniques: Current Progress and Future Prospects. IEEE Geosci. Remote Sens. Mag. 2024, 12, 169–189. [Google Scholar] [CrossRef]
- Wang, H.; Liao, K.; Ouyang, S.; Wang, H.; Xie, N. Focused Tracking Beamforming of Frequency Diversity Array with Multiple Repeated Subpulses. J. Appl. Remote Sens. 2021, 15, 040502. [Google Scholar] [CrossRef]
- Liu, N.; Wu, X.; Dong, R.; Zhang, L. Intrapulse Continuous Azimuth Frequency Scanning-Based Spotlight SAR. IEEE Trans. Geosci. Remote Sens. 2022, 60, 5229713. [Google Scholar] [CrossRef]
- Korkmaz, F.; Antoniou, M. A New Concept of Contiguous-Swath SAR Imaging with High Resolution: Strip-Spot SAR. Sensors 2022, 22, 9153. [Google Scholar] [CrossRef] [PubMed]
- Dominguez, E.M.; Magnard, C.; Frioud, M.; Small, D.; Meier, E. Adaptive Pulse Compression for Range Focusing in SAR Imagery. IEEE Trans. Geosci. Remote Sens. 2017, 55, 2262–2275. [Google Scholar] [CrossRef]
- Antonik, P.; Wicks, M.C.; Griffiths, H.D.; Baker, C.J. Frequency Diverse Array Radars. In Proceedings of the 2006 IEEE Radar Conference, Verona, NY, USA, 24–27 April 2006; p. 3. [Google Scholar]
- Shao, Y.F.; Wang, R.; Deng, Y.K.; Liu, Y.; Chen, R.; Liu, G.; Loffeld, O. Fast Backprojection Algorithm for Bistatic SAR Imaging. IEEE Geosci. Remote Sens. Lett. 2013, 10, 1080–1084. [Google Scholar] [CrossRef]
- Liao, K.; Shen, J.; Ouyang, S.; Yu, Q. A Target Deblurring Method for Frequency Diverse Array Imaging. IEEE Antennas Wirel. Propag. Lett. 2022, 21, 1002–1006. [Google Scholar] [CrossRef]


| Parameter | Parameter Value |
|---|---|
| 10 GHz | |
| 3.33 MHz | |
| 1000 Hz | |
| Flight height, | 1000 m |
| Number of array elements, | 80 |
| Array element spacing, | 0.0006 m |
| Platform movement speed, | 70 m/s |
| Number of observations, | 30 |
| Effective aperture, | 168 m |
| Equivalent bandwidth, | 266.4 MHz |
| Imaging Algorithm | TBR/dB | ENT |
|---|---|---|
| BP 2D algorithm | 12.9946 | 6.3360 |
| Deconvolution 2D algorithm | 35.8598 | 2.6994 |
Disclaimer/Publisher’s Note: The statements, opinions and data contained in all publications are solely those of the individual author(s) and contributor(s) and not of MDPI and/or the editor(s). MDPI and/or the editor(s) disclaim responsibility for any injury to people or property resulting from any ideas, methods, instructions or products referred to in the content. |
© 2025 by the authors. Licensee MDPI, Basel, Switzerland. This article is an open access article distributed under the terms and conditions of the Creative Commons Attribution (CC BY) license (https://creativecommons.org/licenses/by/4.0/).
Share and Cite
Li, Q.; Liao, K.; Xie, N.; Chen, H. Frequency Diverse Array and Spotlight Synthetic Aperture Radar 2D Imaging Based on Multiple Repeated Subpulses. Sensors 2025, 25, 1075. https://doi.org/10.3390/s25041075
Li Q, Liao K, Xie N, Chen H. Frequency Diverse Array and Spotlight Synthetic Aperture Radar 2D Imaging Based on Multiple Repeated Subpulses. Sensors. 2025; 25(4):1075. https://doi.org/10.3390/s25041075
Chicago/Turabian StyleLi, Qinlin, Kefei Liao, Ningbo Xie, and Hanbo Chen. 2025. "Frequency Diverse Array and Spotlight Synthetic Aperture Radar 2D Imaging Based on Multiple Repeated Subpulses" Sensors 25, no. 4: 1075. https://doi.org/10.3390/s25041075
APA StyleLi, Q., Liao, K., Xie, N., & Chen, H. (2025). Frequency Diverse Array and Spotlight Synthetic Aperture Radar 2D Imaging Based on Multiple Repeated Subpulses. Sensors, 25(4), 1075. https://doi.org/10.3390/s25041075