
Enhanced Human Activity Recognition Using Wi-Fi Sensing: Leveraging Phase and Amplitude with Attention Mechanisms


Abstract
1. Introduction
- We propose an attention-based model that effectively utilizes both phase and amplitude components to improve HAR performance. While prior studies primarily focused on amplitude, our approach incorporates phase data, which provides complementary insights into human activity. By optimizing feature extraction for both amplitude and phase, our method significantly enhances recognition accuracy and robustness across a wide range of activities and environments.
- We introduce an attention-based feature fusion mechanism that integrates spatial and temporal features. This includes the implementation of multi-scale convolutional layers, enabling the network to efficiently capture both local and global patterns. In addition, a Gated Residual Network (GRN) is incorporated into our framework as part of the feature fusion process. GRNs can selectively retain or discard information, improving learning efficiency and reducing unnecessary complexity. This adaptation enhances classification accuracy and addresses the limitations of traditional networks. Our focus lies in how the GRN is specifically adapted and utilized in conjunction with attention mechanisms to maximize the utility of multi-scale features.
- Our model is rigorously evaluated using three datasets, including two publicly available datasets and a custom dataset collected for this study. The results demonstrate that our approach achieves superior accuracy and performance compared to existing state-of-the-art (SOTA) models.
2. Literature Review
2.1. Wi-Fi CSI Based on CNN and LSTM Approaches
2.2. Attention-Based Approaches
3. Materials and Methods
3.1. Channel State Information (CSI)
3.2. Datasets
3.2.1. StanWiFi
3.2.2. Multiple Environment (MultiEnv)
3.2.3. Our Research Team Dataset (MINE Lab Dataset)
3.3. Methods
3.3.1. Preprocessing: Kalman Filter
3.3.2. Preprocessing: Sliding Windows
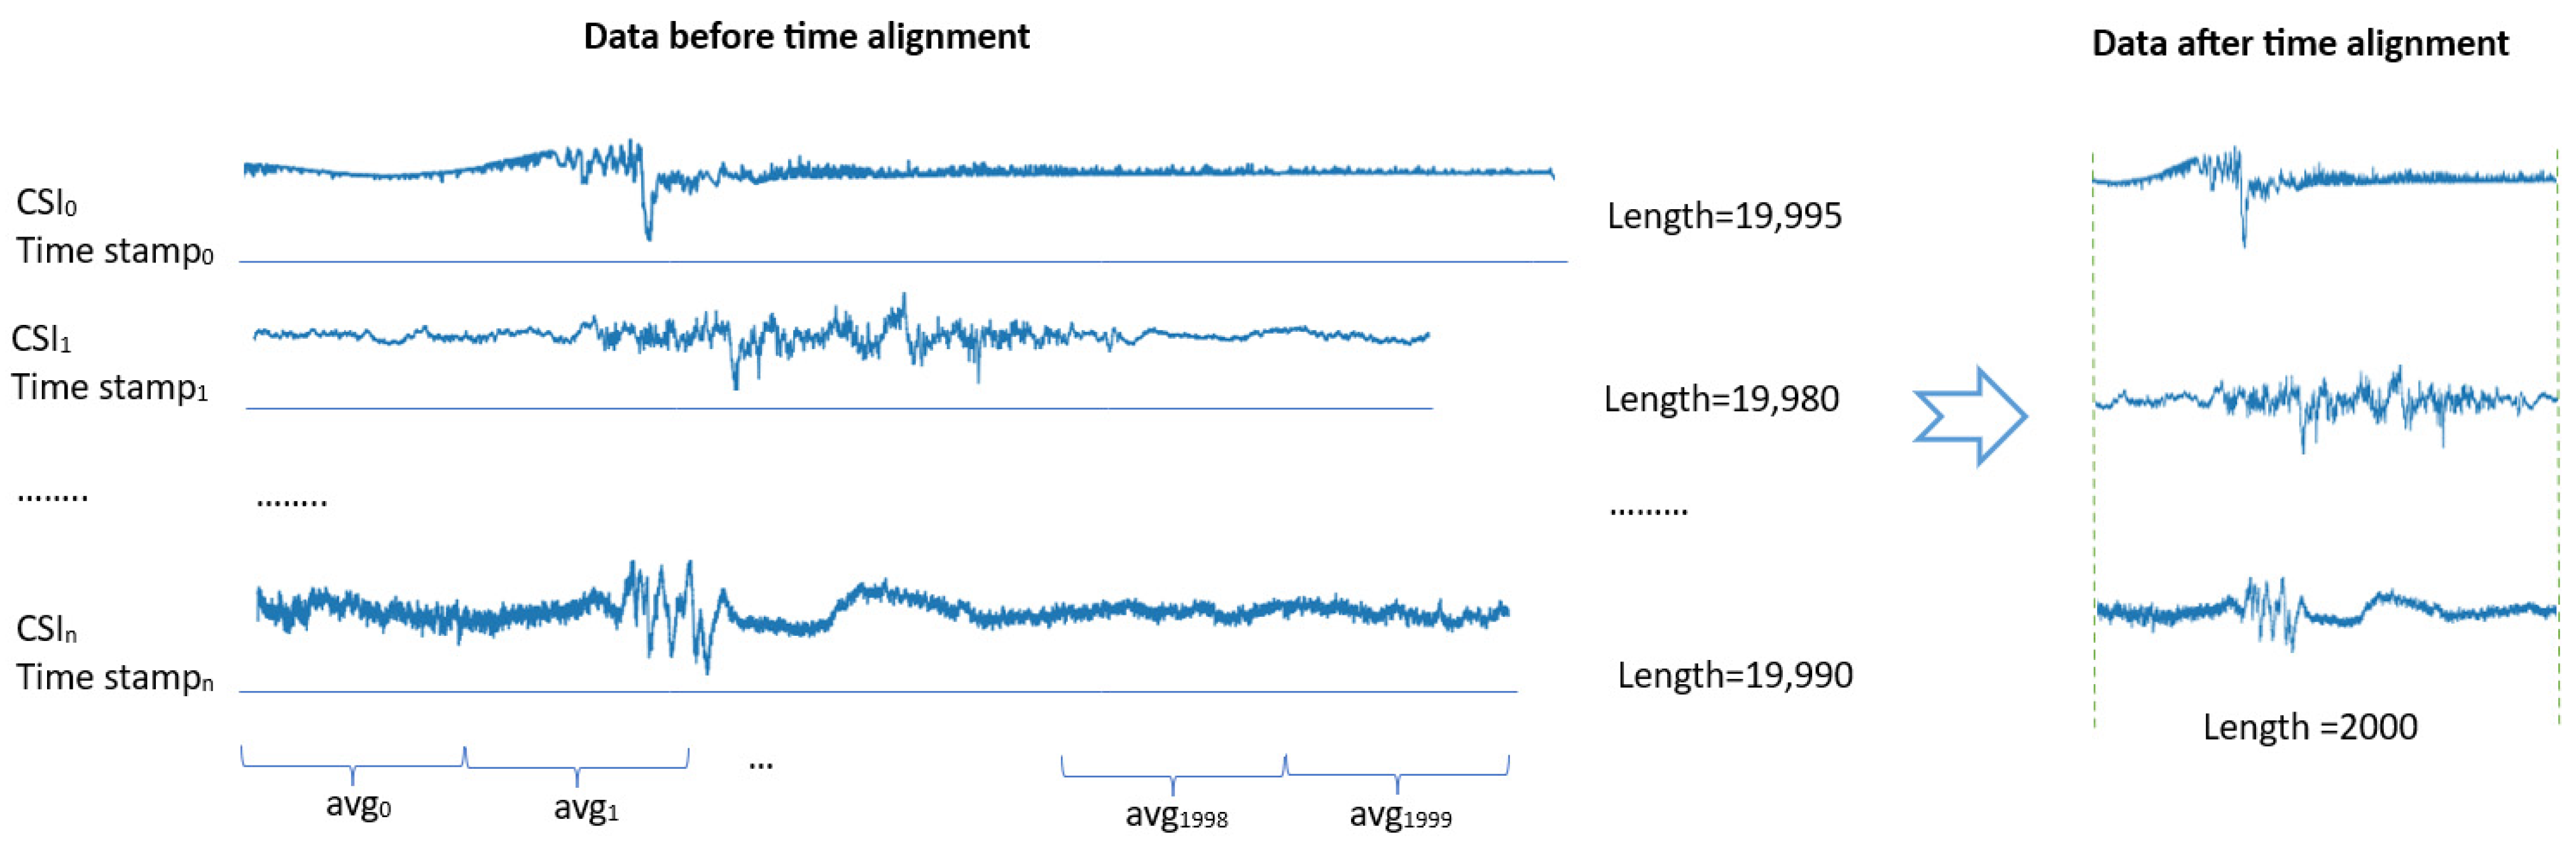
3.3.3. Preprocessing: Time Alignment
3.3.4. Preprocessing: Feature Extraction
3.3.5. Normalization
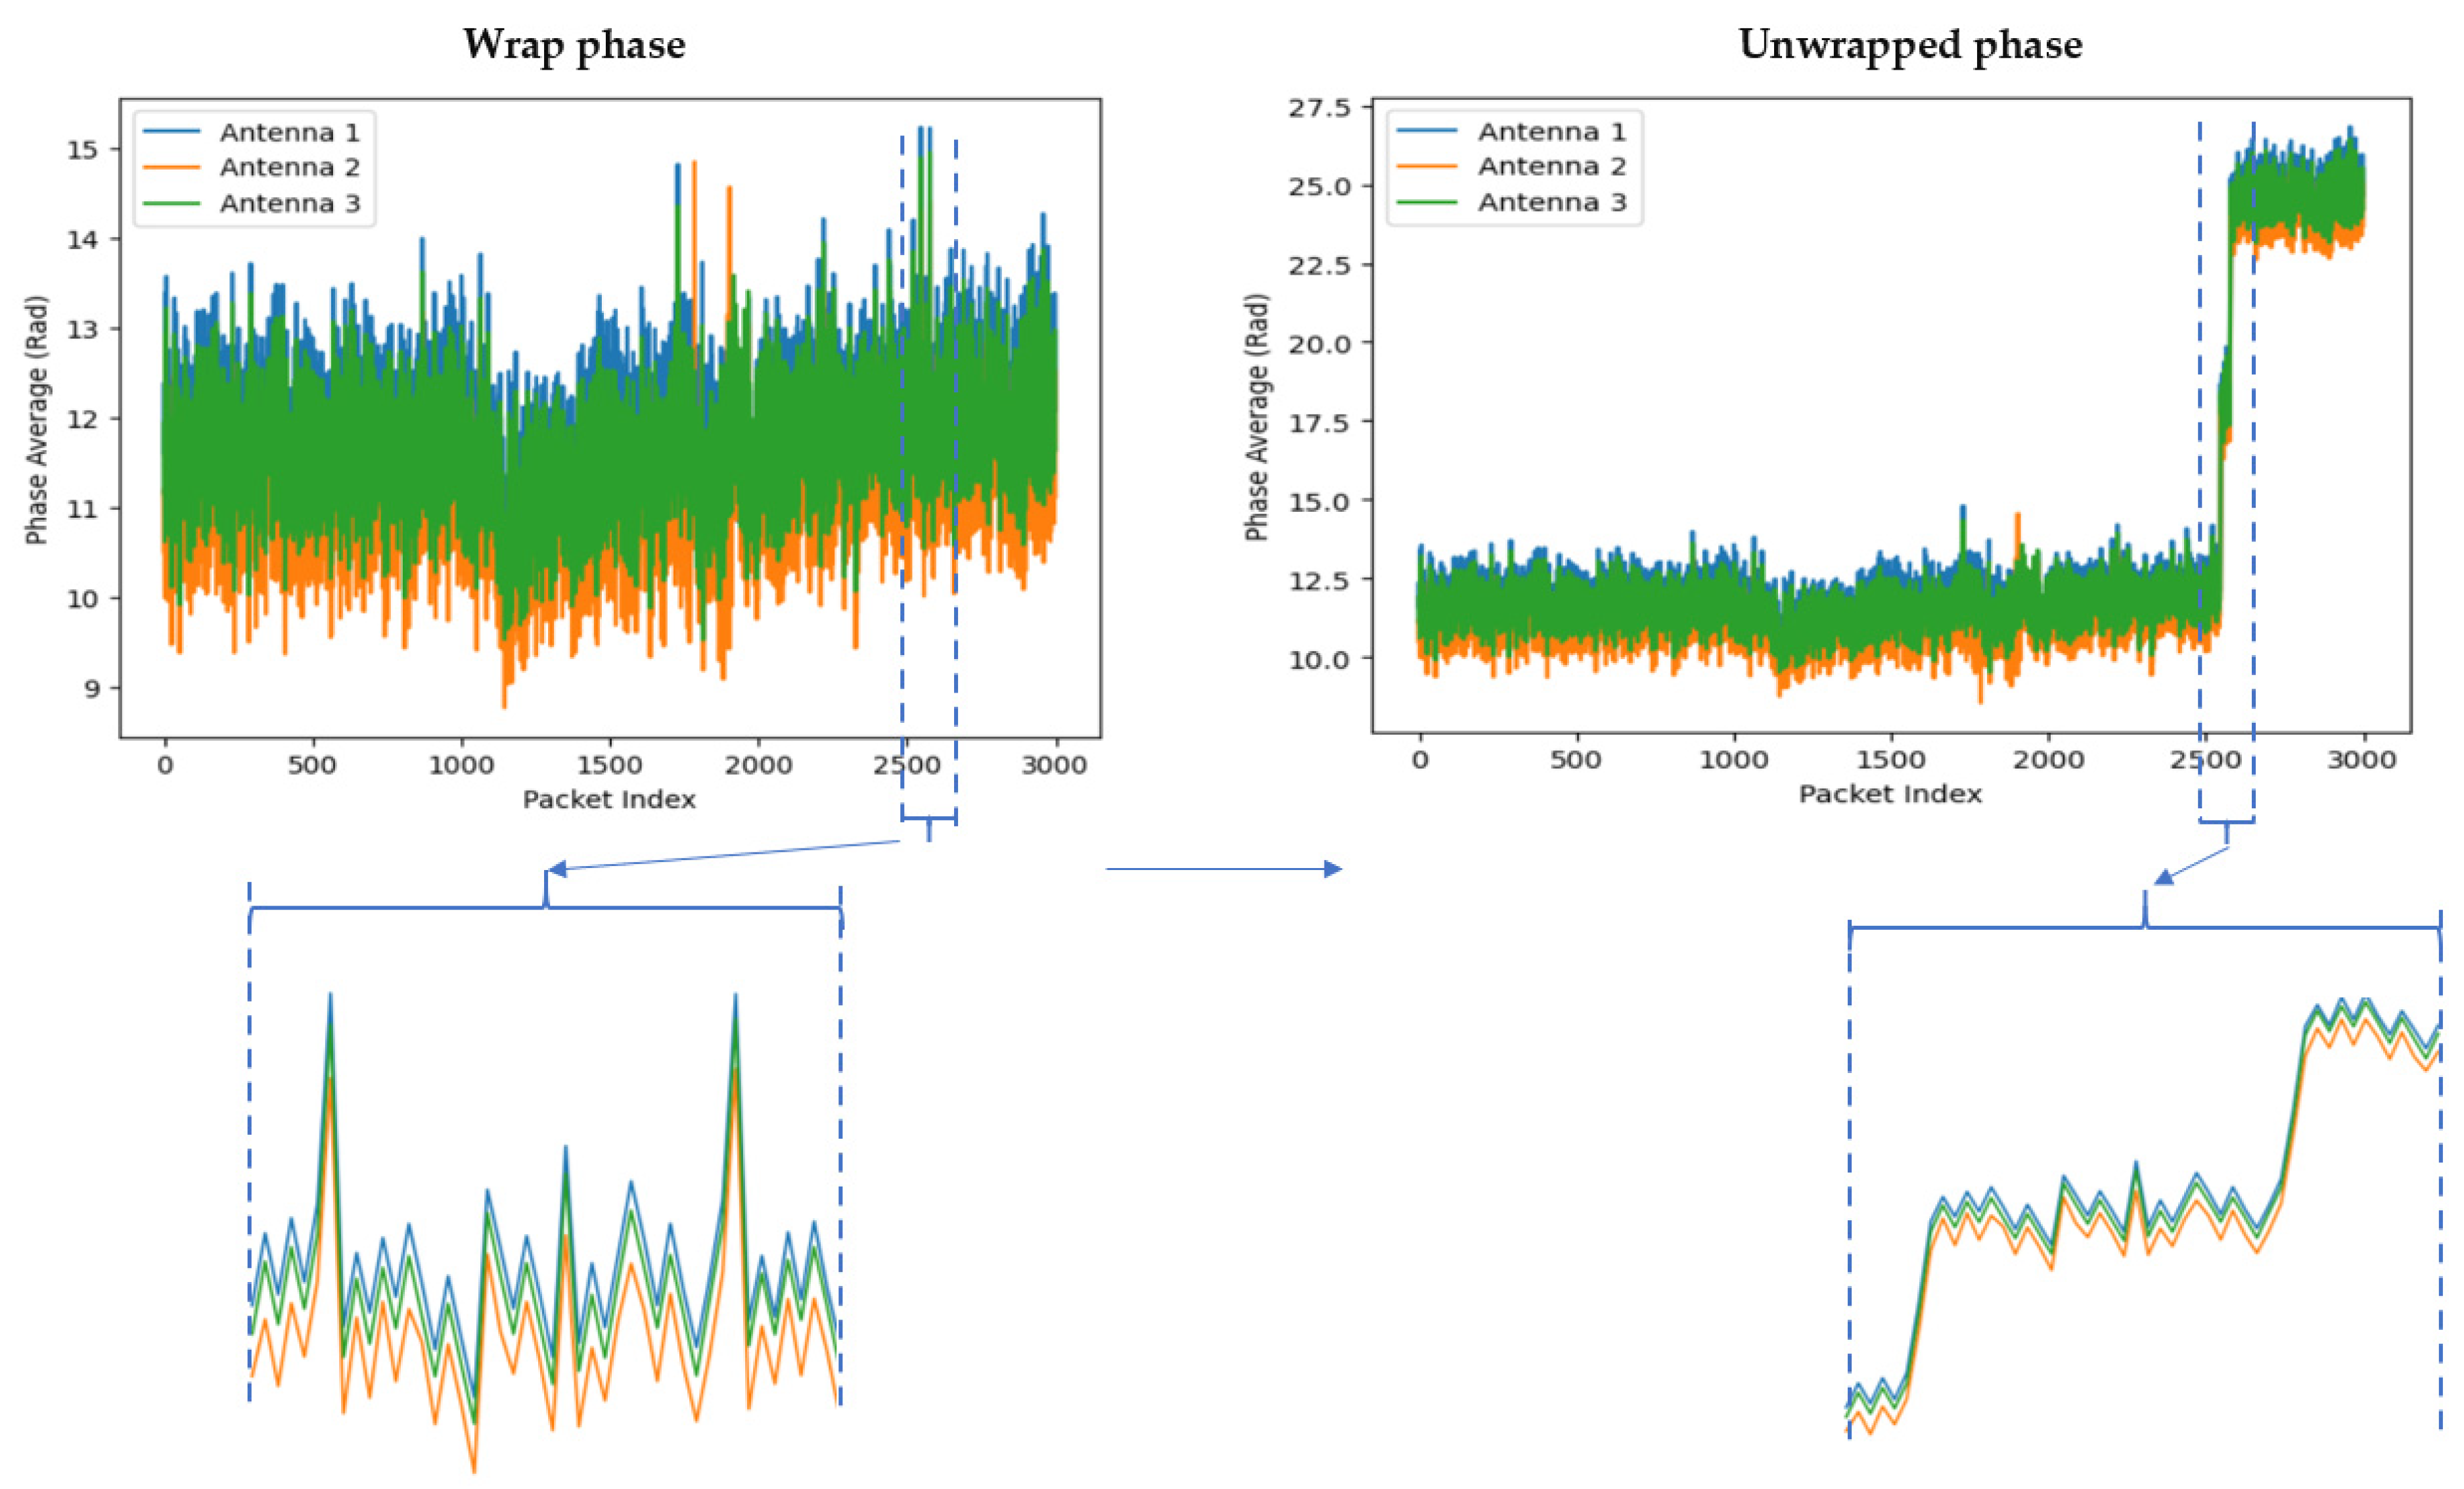
3.3.6. Phase Unwrapping
3.3.7. Gaussian Range Encoding
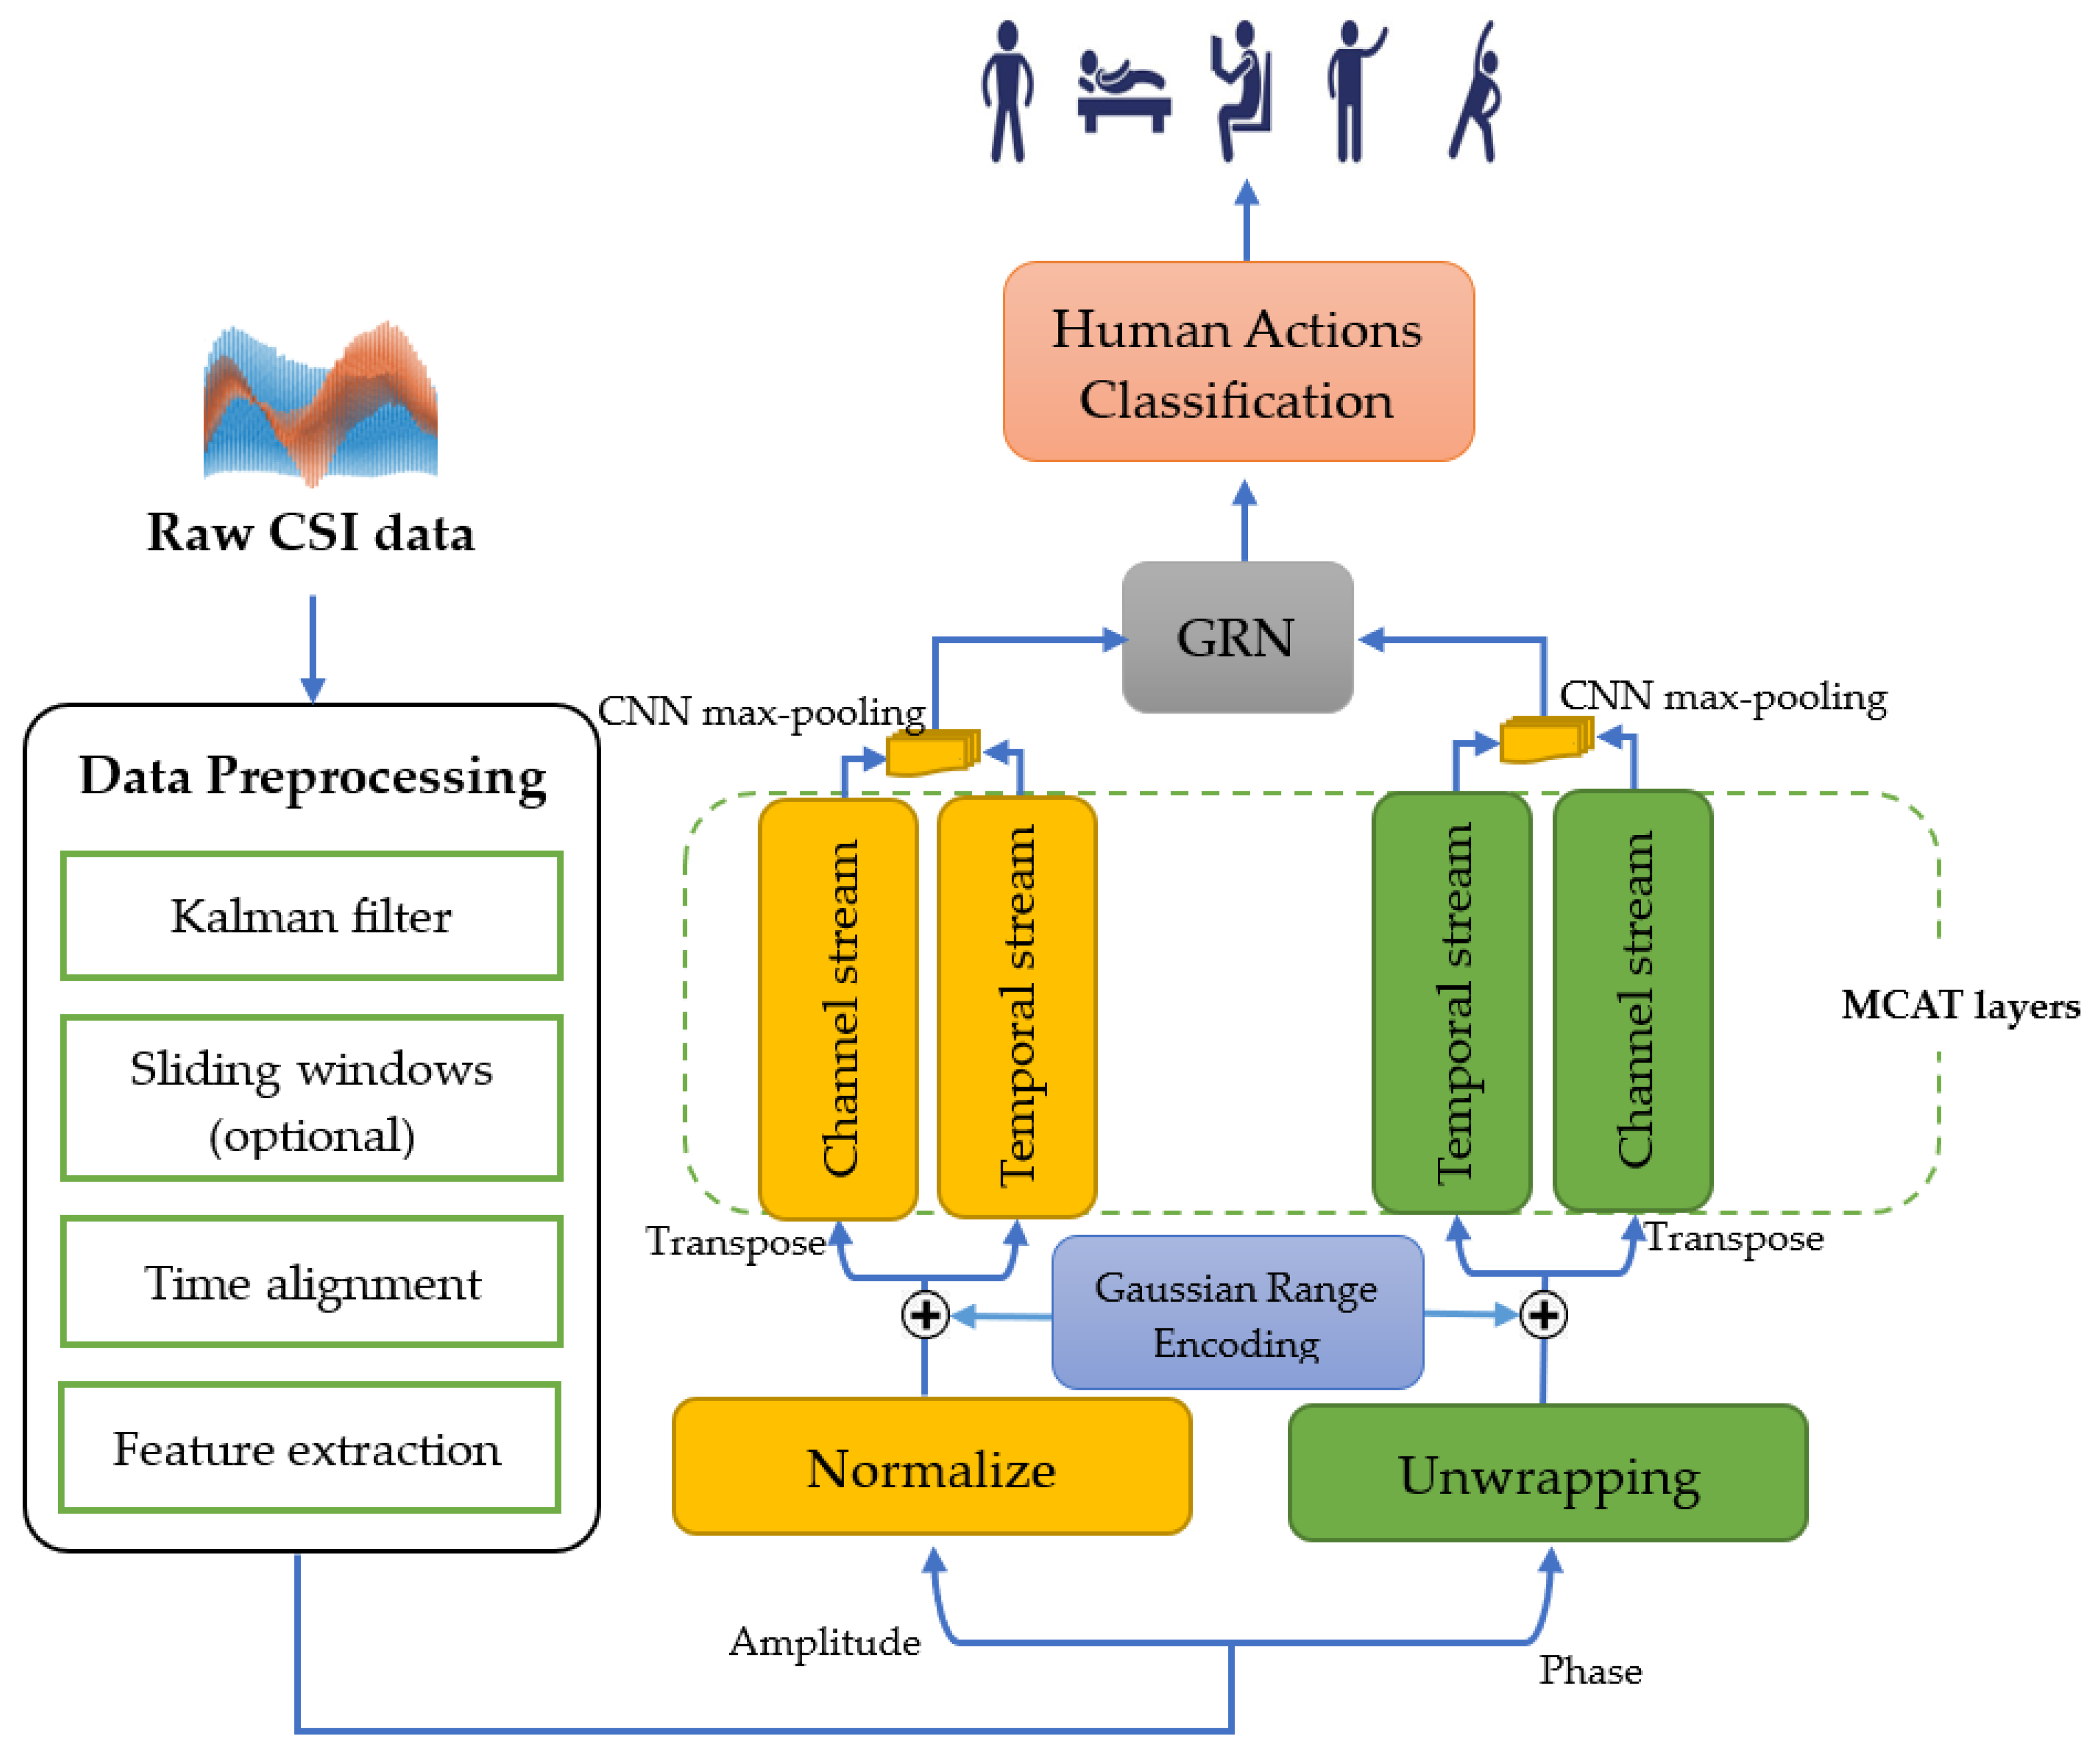
3.3.8. Multi-Scale Convolution Augmented Transformer (MCAT) Layer
3.3.9. Gated Residual Network (GRN)
4. Experimental Evaluation
4.1. Hyperprameters
4.2. Experimental Results on StanWiFi and MINE Lab Datasets
4.3. Experimental Results on MultiEnv Dataset
5. Conclusions
Author Contributions
Funding
Institutional Review Board Statement
Informed Consent Statement
Data Availability Statement
Conflicts of Interest
References
- Kaseris, M.; Kostavelis, I.; Malassiotis, S. A Comprehensive Survey on Deep Learning Methods in Human Activity Recognition. Mach. Learn. Knowl. Extr. 2024, 6, 842–876. [Google Scholar] [CrossRef]
- Aggarwal, J.K.; Ryoo, M.S. Human Activity Analysis: A Review. ACM Comput. Surv. 2011, 43, 1–43. [Google Scholar] [CrossRef]
- Li, X.; He, Y.; Jing, X. A Survey of Deep Learning-Based Human Activity Recognition in Radar. Remote Sens. 2019, 11, 1068. [Google Scholar] [CrossRef]
- Zhuravchak, A.; Kapshii, O.; Pournaras, E. Human Activity Recognition Based on Wi-Fi CSI Data -A Deep Neural Network Approach. In Proceedings of the Procedia Computer Science; Elsevier B.V.: Amsterdam, The Netherlands, 2021; Volume 198, pp. 59–66. [Google Scholar]
- Jannat, M.K.A.; Islam, M.S.; Yang, S.H.; Liu, H. Efficient Wi-Fi-Based Human Activity Recognition Using Adaptive Antenna Elimination. IEEE Access 2023, 11, 105440–105454. [Google Scholar] [CrossRef]
- Chen, C.; Zhou, G.; Lin, Y. Cross-Domain WiFi Sensing with Channel State Information: A Survey. ACM Comput. Surv. 2023, 55, 231. [Google Scholar] [CrossRef]
- Lin, C.-Y.; Lin, C.-Y.; Liu, Y.-T.; Chen, Y.-W.; Shih, T.K. WiFi-TCN: Temporal Convolution for Human Interaction Recognition Based on WiFi Signal. IEEE Access 2024, 12, 126970–126982. [Google Scholar] [CrossRef]
- Yang, Z.; Qian, K.; Wu, C.; Zhang, Y. Smart Wireless Sensing: From IoT to AIoT; Springer Nature: Berlin/Heidelberg, Germany, 2021; ISBN 9789811656583. [Google Scholar]
- Sigg, S.; Blanke, U.; Troster, G. The Telepathic Phone: Frictionless Activity Recognition from WiFi-RSSI. In Proceedings of the IEEE International Conference on Pervasive Computing and Communications (PerCom), Budapest, Hungary, 24–28 March 2014. [Google Scholar]
- Gu, Y.; Ren, F.; Li, J. PAWS: Passive Human Activity Recognition Based on WiFi Ambient Signals. IEEE Internet Things J. 2016, 3, 796–805. [Google Scholar] [CrossRef]
- Gu, Y.; Quan, L.; Ren, F. WiFi-Assisted Human Activity Recognition. In Proceedings of the Wireless and Mobile, 2014 IEEE Asia Pacific Conference, Bali, Indonesia, 28–30 August 2014; pp. 60–65. [Google Scholar]
- Sigg, S.; Shi, S.; Buesching, F.; Ji, Y.; Wolf, L. Leveraging RF-Channel Fluctuation for Activity Recognition: Active and Passive Systems, Continuous and RSSI-Based Signal Features. In Proceedings of the MoMM 2013: The 11th International Conference on Advances in Mobile Computing and Multimedia, Vienna, Austria, 2–4 December 2013; Association for Computing Machinery: New York, NY, USA, December, 2013; p. 599. [Google Scholar]
- Youssef, M.; Mah, M.; Agrawala, A. Challenges: Device-Free Passive Localization for Wireless Environments. In Proceedings of the 13th Annual ACM International Conference on Mobile Computing and Networking, Montréal, QC, Canada, 9–14 September 2007; ACM Digital Library: New York, NY, USA, 2007; pp. 222–229. [Google Scholar]
- Rathnayake, R.M.M.R.; Maduranga, M.W.P.; Tilwari, V.; Dissanayake, M.B. RSSI and Machine Learning-Based Indoor Localization Systems for Smart Cities. Eng 2023, 4, 1468–1494. [Google Scholar] [CrossRef]
- Alsaify, B.A.; Almazari, M.M.; Alazrai, R.; Daoud, M.I. A Dataset for Wi-Fi-Based Human Activity Recognition in Line-of-Sight and Non-Line-of-Sight Indoor Environments. Data Brief 2020, 33, 106534. [Google Scholar] [CrossRef] [PubMed]
- Yousefi, S.; Narui, H.; Dayal, S.; Ermon, S.; Valaee, S. A Survey on Behavior Recognition Using WiFi Channel State Information. IEEE Commun. Mag. 2017, 55, 98–104. [Google Scholar] [CrossRef]
- Zhang, Y.; Zheng, Y.; Qian, K.; Zhang, G.; Liu, Y.; Wu, C.; Yang, Z. Widar3.0: Zero-Effort Cross-Domain Gesture Recognition With Wi-Fi. IEEE Trans. Pattern Anal. Mach. Intell. 2022, 44, 8671–8688. [Google Scholar] [CrossRef]
- Guo, L.; Guo, S.; Wang, L.; Lin, C.; Liu, J.; Lu, B.; Fang, J.; Liu, Z.; Shan, Z.; Yang, J. Wiar: A Public Dataset for Wifi-Based Activity Recognition. IEEE Access 2019, 7, 154935–154945. [Google Scholar] [CrossRef]
- Yang, J.; Chen, X.; Zou, H.; Lu, C.X.; Wang, D.; Sun, S.; Xie, L. SenseFi: A Library and Benchmark on Deep-Learning-Empowered WiFi Human Sensing. Patterns 2023, 4, 100703. [Google Scholar] [CrossRef]
- Meneghello, F.; Fabbro, N.D.; Garlisi, D.; Tinnirello, I.; Rossi, M. A CSI Dataset for Wireless Human Sensing on 80 MHz Wi-Fi Channels. IEEE Commun. Mag. 2023, 61, 146–152. [Google Scholar] [CrossRef]
- Wang, W.; Liu, A.X.; Shahzad, M.; Ling, K.; Lu, S. Device-Free Human Activity Recognition Using Commercial WiFi Devices. IEEE J. Sel. Areas Commun. 2017, 35, 1118–1131. [Google Scholar] [CrossRef]
- Alsaify, B.A.; Almazari, M.; Alazrai, R.; Alouneh, S.; Daoud, M.I. A CSI-Based Multi-Environment Human Activity Recognition Framework. Appl. Sci. 2022, 12, 930. [Google Scholar] [CrossRef]
- Chen, Z.; Zhang, L.; Jiang, C.; Cao, Z.; Cui, W. WiFi CSI Based Passive Human Activity Recognition Using Attention Based BLSTM. IEEE Trans. Mob. Comput. 2019, 18, 2714–2724. [Google Scholar] [CrossRef]
- Yadav, S.K.; Sai, S.; Gundewar, A.; Rathore, H.; Tiwari, K.; Pandey, H.M.; Mathur, M. CSITime: Privacy-Preserving Human Activity Recognition Using WiFi Channel State Information. Neural Netw. 2022, 146, 11–21. [Google Scholar] [CrossRef]
- Moshiri, F.P.; Shahbazian, R.; Nabati, M.; Ghorashi, S.A. A CSI-Based Human Activity Recognition Using Deep Learning. Sensors 2021, 21, 7225. [Google Scholar] [CrossRef]
- Salehinejad, H.; Valaee, S. LiteHAR: Lightweight Human Activity Recognition from WiFi Signals with Random Convolution Kernels. In Proceedings of the ICASSP 2022—2022 IEEE International Conference on Acoustics, Speech and Signal Processing (ICASSP), Singapore, 23–27 May 2022. [Google Scholar] [CrossRef]
- Shalaby, E.; ElShennawy, N.; Sarhan, A. Utilizing Deep Learning Models in CSI-Based Human Activity Recognition. Neural Comput. Appl. 2022, 34, 5993–6010. [Google Scholar] [CrossRef]
- Islam, M.S.; Jannat, M.K.A.; Hossain, M.N.; Kim, W.S.; Lee, S.W.; Yang, S.H. STC-NLSTMNet: An Improved Human Activity Recognition Method Using Convolutional Neural Network with NLSTM from WiFi CSI. Sensors 2023, 23, 356. [Google Scholar] [CrossRef]
- Vaswani, A.; Shazeer, N.; Parmar, N.; Uszkoreit, J.; Jones, L.; Gomez, A.N.; Kaiser, L.; Polosukhin, I. Attention Is All You Need. arXiv 2017, arXiv:1706.03762. [Google Scholar]
- Ding, X.; Jiang, T.; Zhong, Y.; Wu, S.; Yang, J.; Zeng, J. Wi-Fi-Based Location-Independent Human Activity Recognition with Attention Mechanism Enhanced Method. Electronics 2022, 11, 642. [Google Scholar] [CrossRef]
- Yang, M.; Zhu, H.; Zhu, R.; Wu, F.; Yin, L.; Yang, Y. WiTransformer: A Novel Robust Gesture Recognition Sensing Model with WiFi. Sensors 2023, 23, 2612. [Google Scholar] [CrossRef]
- Li, B.; Cui, W.; Wang, W.; Zhang, L.; Chen, Z.; Wu, M. Two-Stream Convolution Augmented Transformer for Human Activity Recognition. Proc. AAAI Conf. Artif. Intell. 2021, 35, 286–293. [Google Scholar] [CrossRef]
- Zeng, Y.; Wu, D.; Gao, R.; Gu, T.; Zhang, D. FullBreathe. Proc. ACM Interact. Mob. Wearable Ubiquitous Technol. 2018, 2, 1–19. [Google Scholar] [CrossRef]
- Li, C.; Brauer, J.; Sezgin, A.; Zenger, C. Kalman Filter Based MIMO CSI Phase Recovery for COTS WiFi Devices. In Proceedings of the ICASSP 2021—2021 IEEE International Conference on Acoustics, Speech and Signal Processing (ICASSP), Toronto, ON, Canad, 6–11 June 2021; Institute of Electrical and Electronics Engineers Inc.: Piscataway, NJ, USA, 2021; pp. 4820–4824. [Google Scholar]
- Savarese, P.; Figueiredo, D. Residual Gates: A Simple Mechanism for Improved Network Optimization. 2017. Available online: https://home.ttic.edu/~savarese/savarese_files/Residual_Gates.pdf (accessed on 6 February 2025).
- Lim, B.; Arik, S.O.; Loeff, N.; Pfister, T. Temporal Fusion Transformers for Interpretable Multi-Horizon Time Series Forecasting. Int. J. Forecast. 2019, 37, 1748–1764. [Google Scholar] [CrossRef]
- Stragapede, G.; Delgado-Santos, P.; Tolosana, R.; Vera-Rodriguez, R.; Guest, R.; Morales, A. Mobile Keystroke Biometrics Using Transformers. In Proceedings of the 2023 IEEE 17th International Conference on Automatic Face and Gesture Recognition (FG), Waikoloa Beach, HI, USA, 5–8 January 2022. [Google Scholar]
- Ba, J.L.; Kiros, J.R.; Hinton, G.E. Layer Normalization. arXiv 2016, arXiv:1607.06450. [Google Scholar]
- Qin, Z.; Yang, S.; Zhong, Y. Hierarchically Gated Recurrent Neural Network for Sequence Modeling. arXiv 2023, arXiv:2311.04823. [Google Scholar]


| Source | Dataset Name | Description |
|---|---|---|
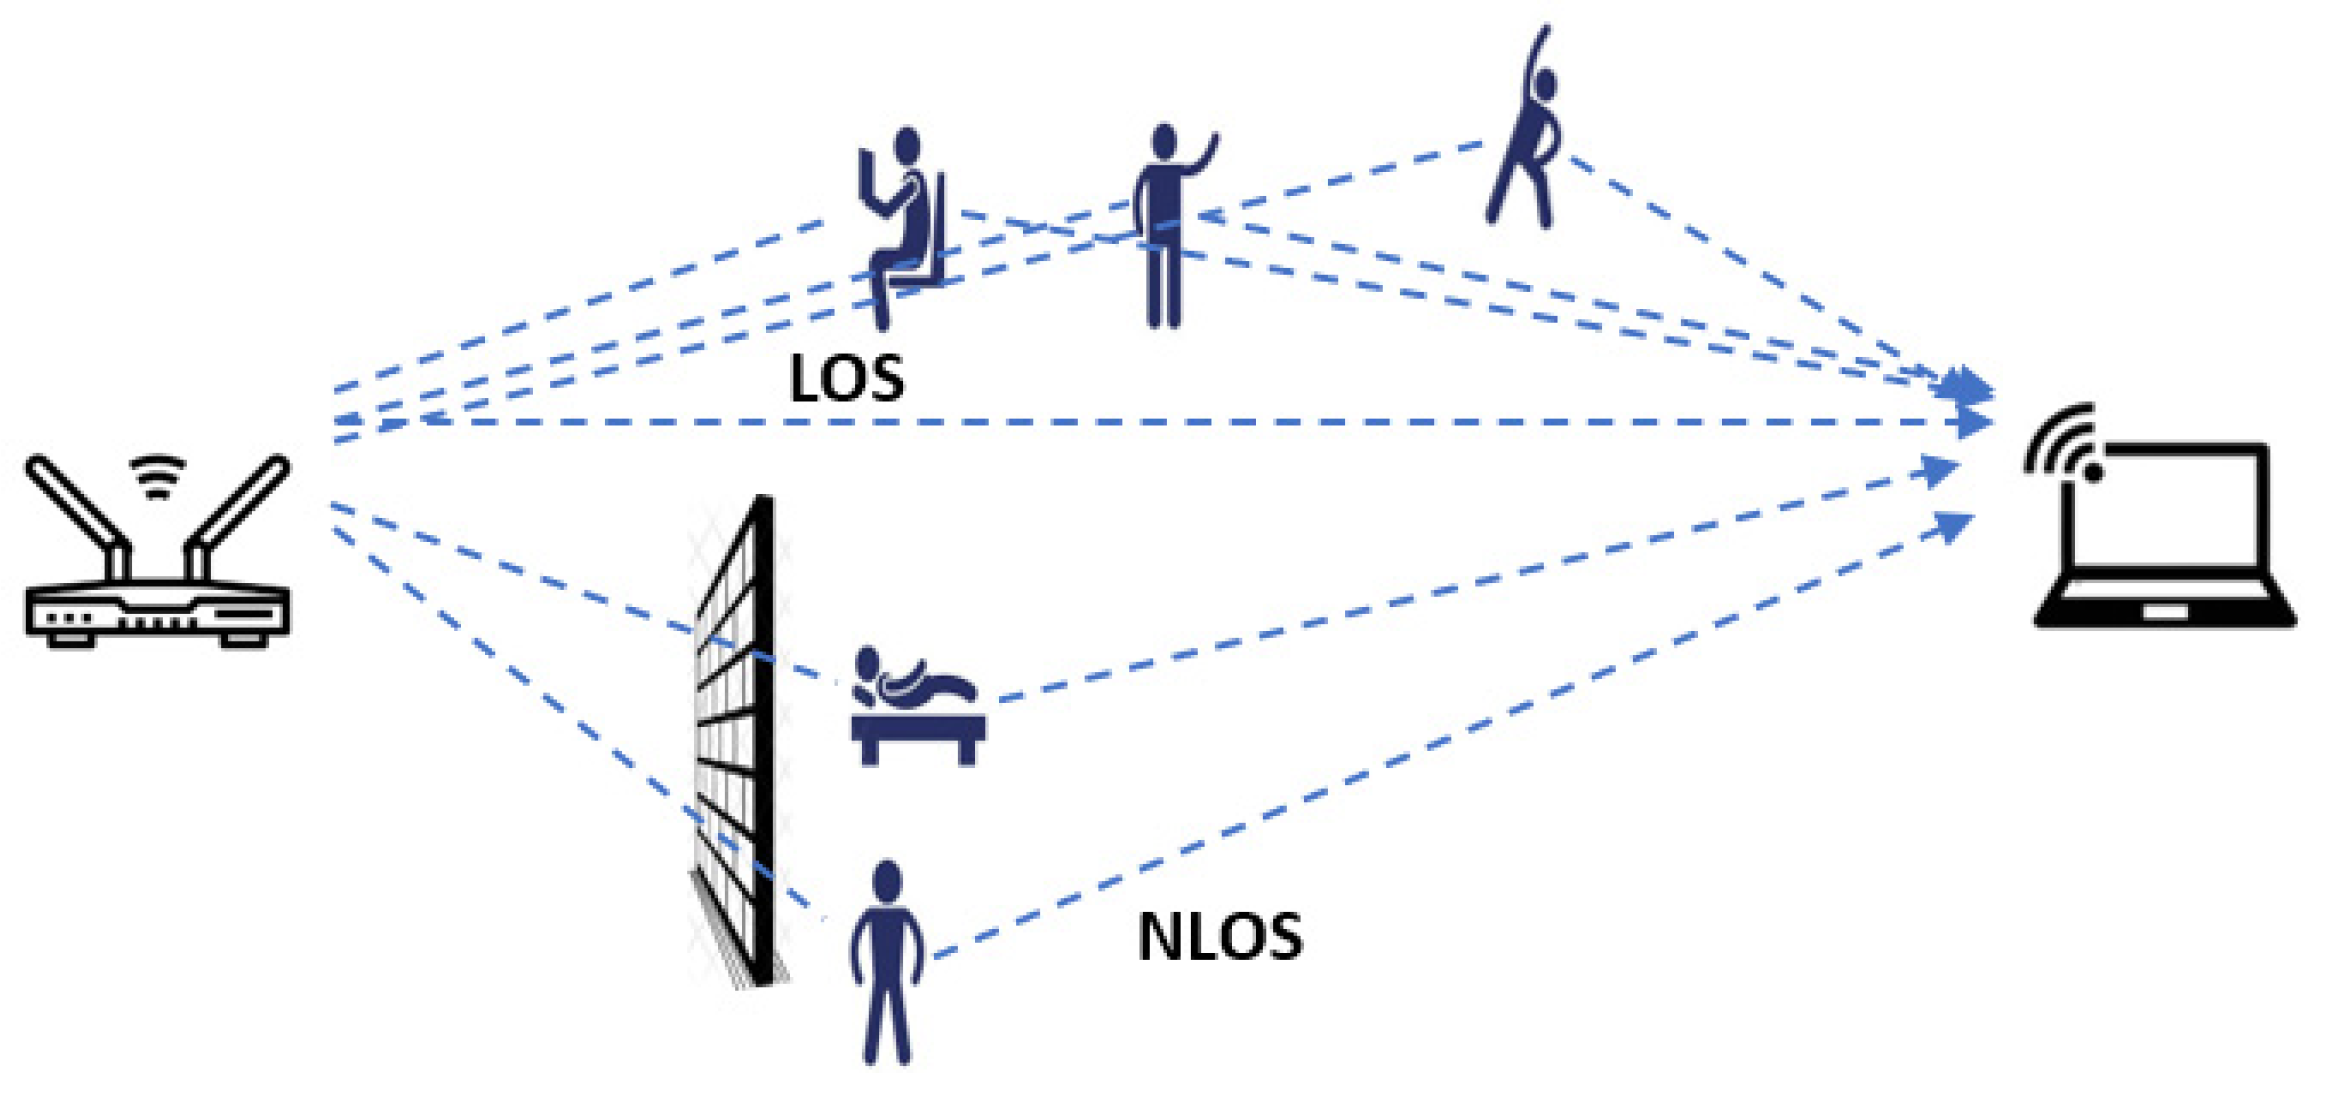
| Alsaify et al. (2020) [15] | MultiEnv | This dataset was collected in three scenarios: line-of-sight (LOS) in both the office and hall, and non-line-of-sight (NLOS). |
| Yousefi et al. (2017) [16] | StanWiFi | This dataset contains continuous CSI data for six activities without precise segmentation timestamps for each sample. |
| Yang et al. (2022) [17] | Widar 3.0 | This large dataset, collected using Intel 5300 NIC with 30 subcarriers and containing 258 K Wi-Fi-based hand gesture instances spanning 8620 min across 75 domains. |
| Guo et al. (2019) [18] | WiAR | This dataset includes 16 activities, comprising coarse-grained activities and gestures, performed 30 times each, by ten volunteers. |
| Yang et al. (2023) [19] | NTU-Fi | Collected using the Atheros CSI tool, this dataset features 114 subcarriers per antenna pair, and it includes 6 human activities and 14 gait patterns. |
| Meneghello et al. (2023) [20] | WiFi-80 MHz | Collected using two Netgear X4S AC2600 IEEE 802.11ac routers with 256 subcarriers (242 usable), this dataset features ten subjects and three applications |
| Class | Activity | Description |
|---|---|---|
| 0 | No movement | Sitting, standing, or lying on the ground |
| 1 | Falling | Falling from a standing position or from a chair |
| 2 | Sitting down or standing up | Sitting down on a chair or standing up from a chair |
| 3 | Walking | Walking between the transmitter and receiver |
| 4 | Turning | Turning at the transmitter’s or receiver’s location |
| 5 | Picking up | Picking up an object such as a pen from the ground |
| Hyperparameter | Values |
|---|---|
| Window size | StanWiFi dataset: 2000; our own dataset: 1000 |
| Stride size | StanWiFi dataset: 200; our own dataset: 100 |
| K-Gaussian encoding | 10 |
| Input data dimensions ) | StanWiFi dataset: (2000, 90); MultiEnv dataset: (850, 90); MINE lab dataset: (1000, 90) |
| Filter size in Multi-scale CNN (horizontal, vertical) | Horizontal: {10, 40}; Vertical: {2, 4} |
| Number of heads in the multi-head self-attention mechanism | h-head: 9; v-head: 50 |
| Dropout rate | 0.1 |
| Number of dense layers in GRN | 256 |
| Optimizer | Adam (learning rate = 0.001; decay rate = 0.9) |
| Batch size | 8 |
| Epochs | 200 |
| Training environment | NVIDIA GeForce RTX 3060 with CUDA v. 12.4, Python 3.11, TensorFlow 2.16 |
| Source | Model | Acc | Pre | Recall | F1-Score |
|---|---|---|---|---|---|
| Li et al. [32] | THAT (2021) | 98.20 | - | - | - |
| Yadav et al. [24] | CSITime (2022) | 98.00 | - | - | - |
| Salehinejad et al. [26] | LiteHAR (2022) | 98.00 | 99.16 | 98.87 | 99.01 |
| Salaby et al. [27] | CNN-GRU (2022) | 99.31 | 99.5 | 99.43 | - |
| Islam et al. [28] | STC-NLSTMNet (2023) | 99.88 | 99.72 | 99.73 | - |
| Jannat et al. [5] | AAE+RF (2023) | 99.84 | 99.82 | 99.83 | 99.81 |
| Ours | PA-CSI (2024) | 99.93 | 99.86 | 99.95 | 99.95 |
| Source | Model | Acc | Pre | Recall | F1-Score |
|---|---|---|---|---|---|
| Li et al. [32] | THAT (2021) | 97.00 | 97.00 | 97.00 | 97.00 |
| Ours | PA-CSI (2024) | 99.24 | 99.24 | 99.24 | 99.24 |
| Environment | Source | Model | Acc | Pre | Recall | F1-Score |
|---|---|---|---|---|---|---|
| E1: Office (LOS) | Alsaify et al. [15] | SVM (2020) | 94.03 | - | - | - |
| Li et al. [32] | THAT (2021) | 98.95 | 98.28 | 98.26 | 98.26 | |
| Alsaify et al. [22] | SVM (2022) | 91.27 | - | - | - | |
| Islam et al. [28] | STC-NLSTMNet (2023) | 98.20 | 98.10 | 98.08 | 98.09 | |
| Jannat et al. [5] | AAE+RF (2023) | 97.65 | 96.42 | 96.41 | 94.40 | |
| Ours | PA-CSI (2024) | 99.47 | 99.48 | 99.47 | 99.47 | |
| E2: Hall (LOS) | Alsaify et al. [15] | SVM (2020) | 94.03 | - | - | - |
| Li et al. [32] | THAT (2021) | 97.39 | 97.24 | 97.22 | 97.22 | |
| Alsaify et al. [22] | SVM (2022) | 91.27 | - | - | - | |
| Islam et al. [28] | STC-NLSTMNet (2023) | 96.65 | 96.54 | 96.41 | 96.48 | |
| Ours | PA-CSI (2024) | 98.43 | 98.01 | 97.90 | 97.90 | |
| E3: Room and hall (NLOS) | Li et al. [32] | THAT (2021) | 97.56 | 97.04 | 97.04 | 97.03 |
| Islam et al. [28] | STC-NLSTMNet (2023) | 94.68 | 94.57 | 94.55 | 94.56 | |
| Jannat et al. [5] | AAE+RF (2023) | 93.33 | 93.12 | 93.07 | 93.14 | |
| Ours | PA-CSI (2024) | 98.78 | 98.79 | 98.78 | 98.78 |
Disclaimer/Publisher’s Note: The statements, opinions and data contained in all publications are solely those of the individual author(s) and contributor(s) and not of MDPI and/or the editor(s). MDPI and/or the editor(s) disclaim responsibility for any injury to people or property resulting from any ideas, methods, instructions or products referred to in the content. |
© 2025 by the authors. Licensee MDPI, Basel, Switzerland. This article is an open access article distributed under the terms and conditions of the Creative Commons Attribution (CC BY) license (https://creativecommons.org/licenses/by/4.0/).
Share and Cite
Quy, T.D.; Lin, C.-Y.; Shih, T.K. Enhanced Human Activity Recognition Using Wi-Fi Sensing: Leveraging Phase and Amplitude with Attention Mechanisms. Sensors 2025, 25, 1038. https://doi.org/10.3390/s25041038
Quy TD, Lin C-Y, Shih TK. Enhanced Human Activity Recognition Using Wi-Fi Sensing: Leveraging Phase and Amplitude with Attention Mechanisms. Sensors. 2025; 25(4):1038. https://doi.org/10.3390/s25041038
Chicago/Turabian StyleQuy, Thai Duy, Chih-Yang Lin, and Timothy K. Shih. 2025. "Enhanced Human Activity Recognition Using Wi-Fi Sensing: Leveraging Phase and Amplitude with Attention Mechanisms" Sensors 25, no. 4: 1038. https://doi.org/10.3390/s25041038
APA StyleQuy, T. D., Lin, C.-Y., & Shih, T. K. (2025). Enhanced Human Activity Recognition Using Wi-Fi Sensing: Leveraging Phase and Amplitude with Attention Mechanisms. Sensors, 25(4), 1038. https://doi.org/10.3390/s25041038