This section presents a deep analysis of the traffic sign detection and classification performance of the YOLOv8 model under various light conditions. This section delves into the detection rates, classification accuracy, and quality metrics of traffic signs, highlighting the impact of lighting on the model’s effectiveness. By examining these results, the study provides valuable insights into the robustness and reliability of the model in real-world scenarios, ultimately contributing to the enhancement of AV perception systems.
4.1. Detection Rate Comparison
The detection rate refers to the maximum percentage of traffic signs correctly identified and classified by a detection model (YOLOv8) within a specific set of conditions. This metric evaluates the model’s peak performance in accurately detecting traffic signs. The detection rate of traffic signs by AV systems varies significantly between day and night due to differences in lighting conditions. During the day, traffic signs are generally more visible, resulting in a higher detection rate. Natural lighting enhances the clarity and contrast of the signs. In contrast, night-time conditions pose challenges such as reduced illumination, glare from external light sources, and partial occlusion, which can obscure sign details and reduce detection accuracy.
Table 2 presents the distribution of detection rates between day and night, highlighting the model’s ability to perform consistently under varying lighting conditions. The detection rate during the day shows a mean of 0.82 with a relative standard deviation (RSD) of 22%, while the night detection rate has a slightly higher mean of 0.83 and a lower RSD of 20%. This minor variation implies that the model performs reliably under both conditions.
An independent two-sample
t-test was conducted to examine whether there is a significant difference in the mean detection rate between day and night. The analysis, presented in
Table 3, was performed using the Statistical Package for the Social Sciences (SPSS) software, version 27.0.1, with a significance level (α) of 0.05, a two-tailed test, and 178 degrees of freedom. The critical value (CV) from the student’s t-distribution was calculated to be 1.973, and the resulting
t-value of −0.34 is lower than the critical value. The corresponding
p-value of 0.736 exceeds the chosen significance level, leading to the acceptance of the null hypothesis, which was that there is no statistically significant difference in the mean detection rates between daytime and night-time. The 95% confidence interval for the difference in means includes zero, further reinforcing this conclusion.
However, while the mean detection rates and standard deviations show no significant overall difference, a detailed individual analysis reveals noteworthy variability.
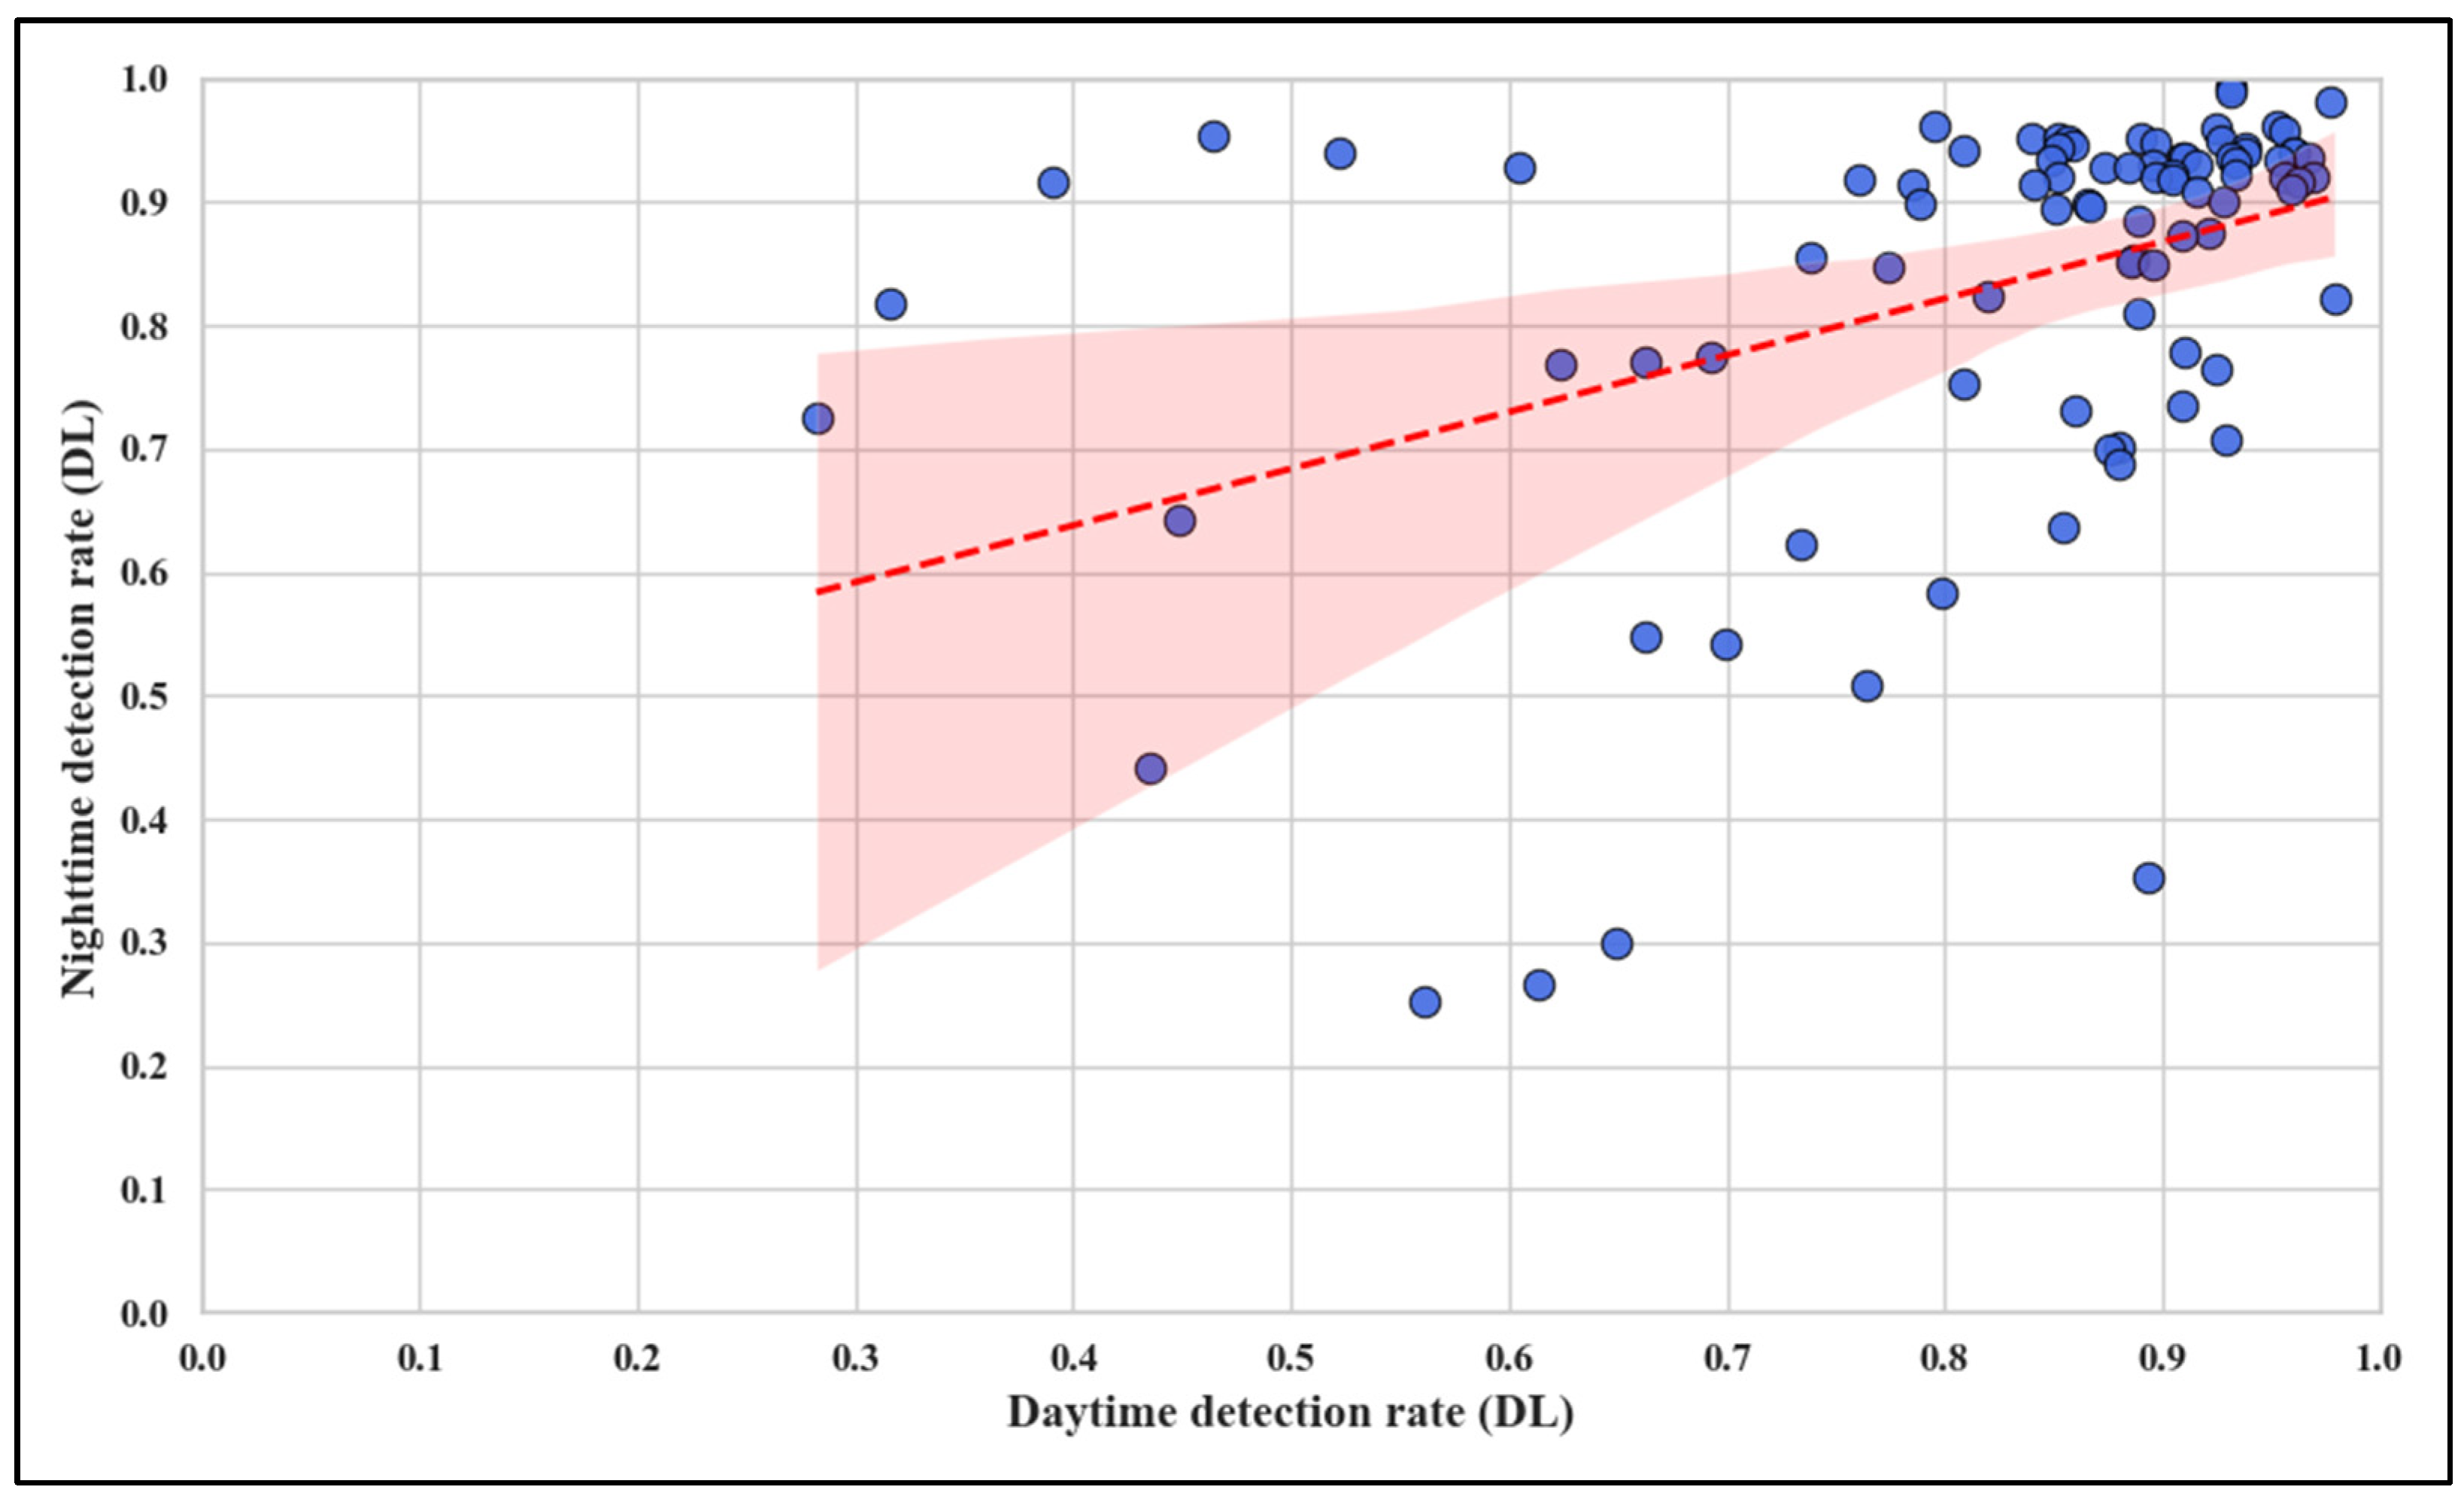
Figure 8 investigates the relationship between daytime and night-time detection rates, showing only a weak positive correlation, with Pearson and Spearman coefficients of 0.42 and 0.44, respectively. The weak correlation indicates that although signs with higher daytime detection rates are likely to perform well at night, the relationship is not definitive. Notably, as shown by the outliers in
Figure 8, signs that deviate markedly from the trend line highlight potential factors such as reduced retroreflectivity, glare, shadows, or environmental occlusions, particularly at night. Additionally, signs with consistently low detection rates across both conditions may reflect poor quality, degradation, or suboptimal positioning, necessitating targeted investigation and maintenance.
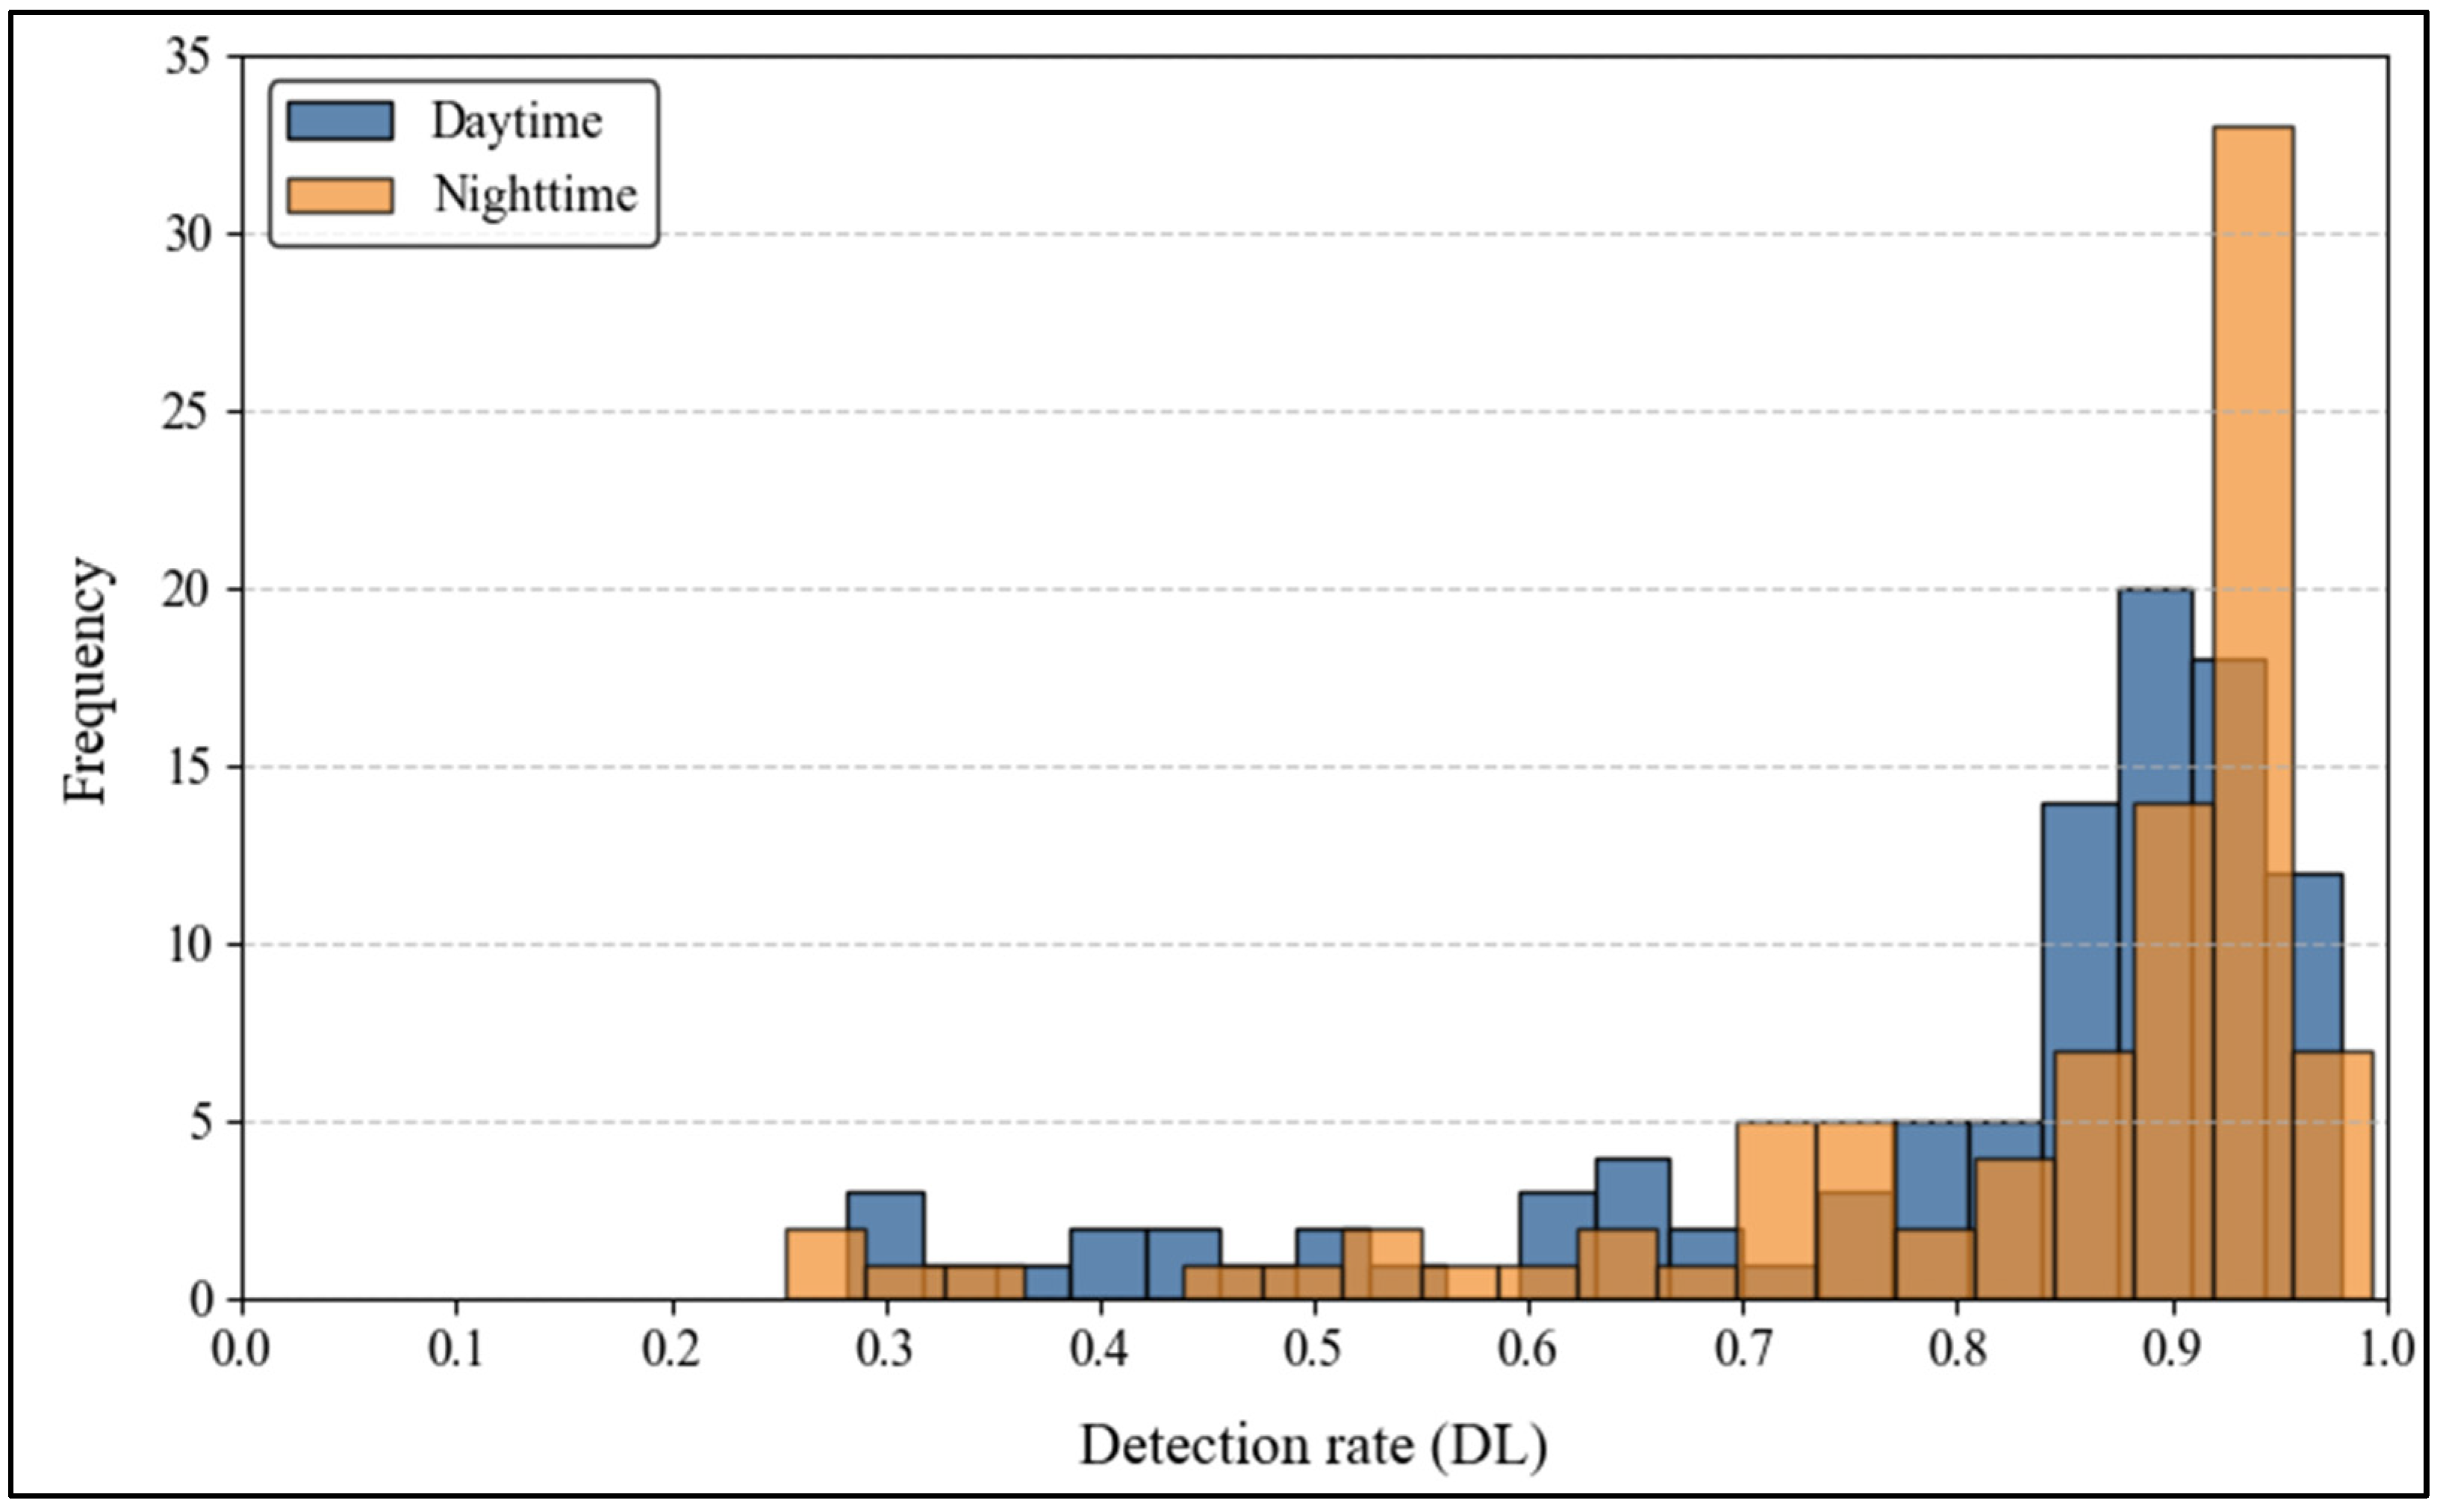
Figure 9 provides a comparative distribution of daytime and night-time detection rates. The data show a mean detection rate of 0.82 during the day and 0.83 at night, with relative standard deviations (RSDs) of 22% and 20%, respectively. While the distributions appear similar overall, the higher frequency of misdetections at night suggests challenges such as glare and reduced illumination. The model performs consistently across both conditions on average, but the broader spread of night-time data indicates variability in detection performance. Understanding the factors contributing to this variability, such as poor sign retroreflectivity or challenging lighting conditions, is essential for improving detection algorithms, particularly under night-time conditions.
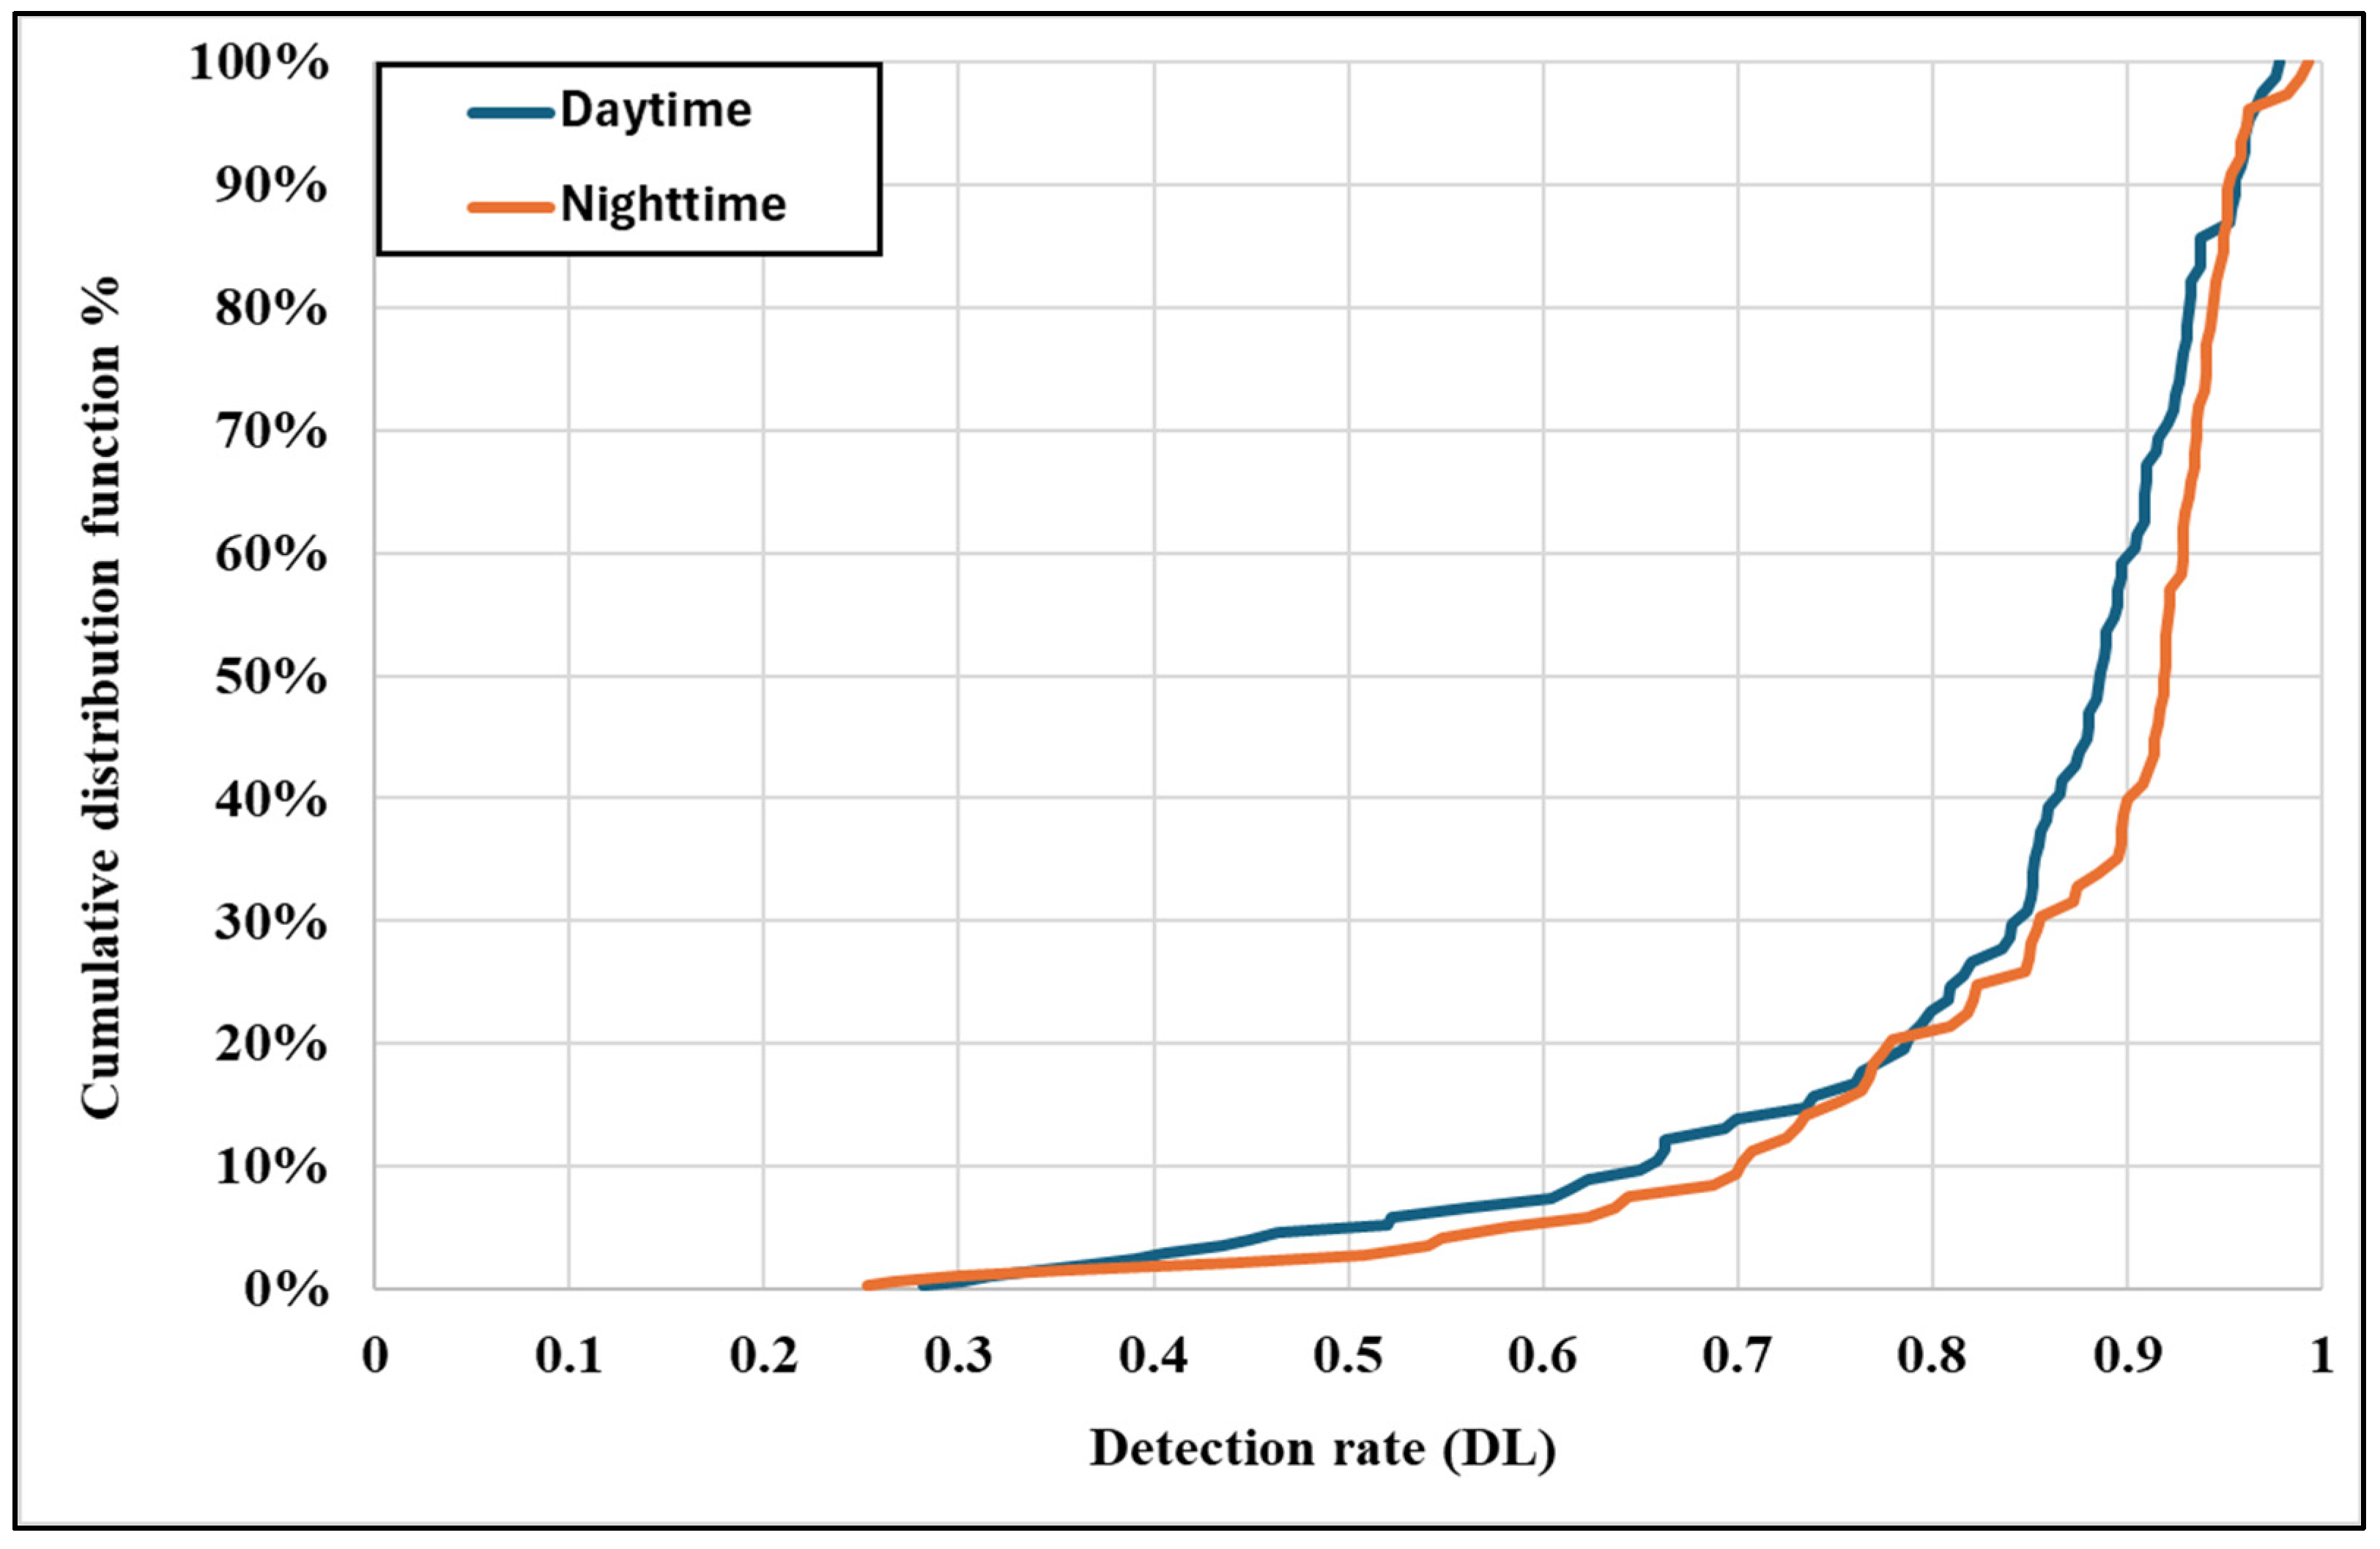
Figure 10 illustrates the cumulative distribution functions (CDFs) of detection rates for daytime and night-time conditions. The CDFs reveal that night-time conditions exhibit a steeper cumulative curve than daytime, indicating that a greater proportion of signs are detected at lower rates at night. The lower tail of the night-time CDF suggests that specific traffic signs experience a significantly reduced detection performance under low-light conditions. These discrepancies emphasize the critical impact of illumination and glare on detection capabilities. Detection systems could achieve a consistent performance across varying lighting conditions by integrating adaptive exposure control and low-light image enhancement, particularly at night.
Furthermore,
Figure 11 visually illustrates the detection rates for the same traffic signs under daytime and night-time conditions. The figure emphasizes that traffic signs are generally easier to detect during the day due to the better clarity and contrast provided by natural lighting. At night, however, the detection performance is heavily dependent on the retroreflective properties of the signs. Well-maintained retroreflective signs are more visible, while those with degraded retroreflectivity or affected by glare and shadows are often missed or misclassified. These findings underscore the importance of assessing and maintaining retroreflectivity and the need for regular retroreflectivity evaluations to ensure a consistent detection performance, particularly under challenging night-time conditions. Moreover, glare-reducing and adaptive imaging algorithms can significantly enhance the reliability of traffic sign detection systems in autonomous vehicles.
The data reveal that 10% of traffic signs were missed during night-time detection despite being detected during the day. This discrepancy highlights the specific challenges associated with night-time detection, particularly under low-light conditions. For instance, one of the signs that was detected during the day may have had sufficient visibility due to good natural lighting. Still, it was missed during the night, possibly because of degraded retroreflectivity or obstructions like glare from streetlights or nearby vehicle headlights. These signs are difficult to detect under night-time conditions when environmental factors affect the clarity of the signs.
Figure 12 shows examples of such traffic signs: the same sign being detected during the day with a high level of clarity and contrast and the same sign failing to be detected at night due to the reduced retroreflectivity and glare.
The night-time detection performance is significantly affected by environmental factors that influence traffic sign visibility. While streetlights are intended to improve illumination, they can create uneven lighting, glare, or overexposure, impairing detection algorithms’ ability to identify fine details. Similarly, glare from oncoming headlights and reflective surfaces can obscure sign edges or symbols, reducing the effectiveness of camera-based detection systems. Shadows cast by infrastructure or moving vehicles further distort visibility, complicating detection. These challenges highlight the need for adaptive exposure controls and glare reduction techniques in detection algorithms. Integrating real-time lighting adjustments and regular retroreflectivity assessments can enhance low-light detection, particularly for autonomous systems in varied night-time conditions.
The results align with previous research highlighting the critical role of environmental conditions in traffic sign detection. Seraj et al., (2021) [
13] emphasized the detrimental effects of low visibility, glare, and occlusions on detection accuracy. Similarly, other studies have shown that night-time conditions exacerbate challenges for AV systems, including increased false-negative rates and misclassifications [
32]. The steeper cumulative distribution curve for night-time detection rates (
Figure 10) supports these findings, indicating that a higher proportion of signs are detected at lower rates under low-light conditions.
While prior studies using advanced preprocessing techniques and hybrid architectures report improved robustness in night-time detection, the YOLOv8 model appears more sensitive to environmental variability. This is evidenced by the weak correlation in detection rates between day and night and the presence of outliers (
Figure 8). These findings suggest that while YOLOv8 achieves commendable mean detection rates, its performance is less consistent under challenging conditions compared to models employing multispectral imaging, adaptive exposure control, or glare reduction algorithms [
13,
32].
The visual analysis presented in
Figure 11 highlights the critical role of retroreflectivity in night-time detection. Signs with well-maintained retroreflective properties exhibit higher nighttime detection rates, while those with degraded retroreflectivity or obstructed by glare and shadows are more prone to misdetections. These results underscore the need for regular maintenance and retroreflectivity evaluations, as also advocated in the related literature.
4.2. Impact of Retroreflectivity on Detection Performance
Retroreflectivity plays a critical role in ensuring the visibility and detectability of traffic signs, particularly under varying light conditions. A higher retroreflectivity coefficient (Ra) improves the ability of drivers and detection systems to recognize traffic signs effectively, especially during night-time when artificial illumination is necessary for reflection. Conversely, lower retroreflectivity can result in an inconsistent or poor detection performance due to inadequate light reflection. The retroreflective properties of a sign are highly dependent on the material used, commonly categorized into classes such as RA1 and RA2. Signs with higher retroreflectivity values (e.g., RA2) demonstrate superior detection rates in daytime and night-time conditions than signs with lower retroreflectivity (e.g., RA1). It is important to note that retroreflective sheet class RA3 was not included in the scope of this study.
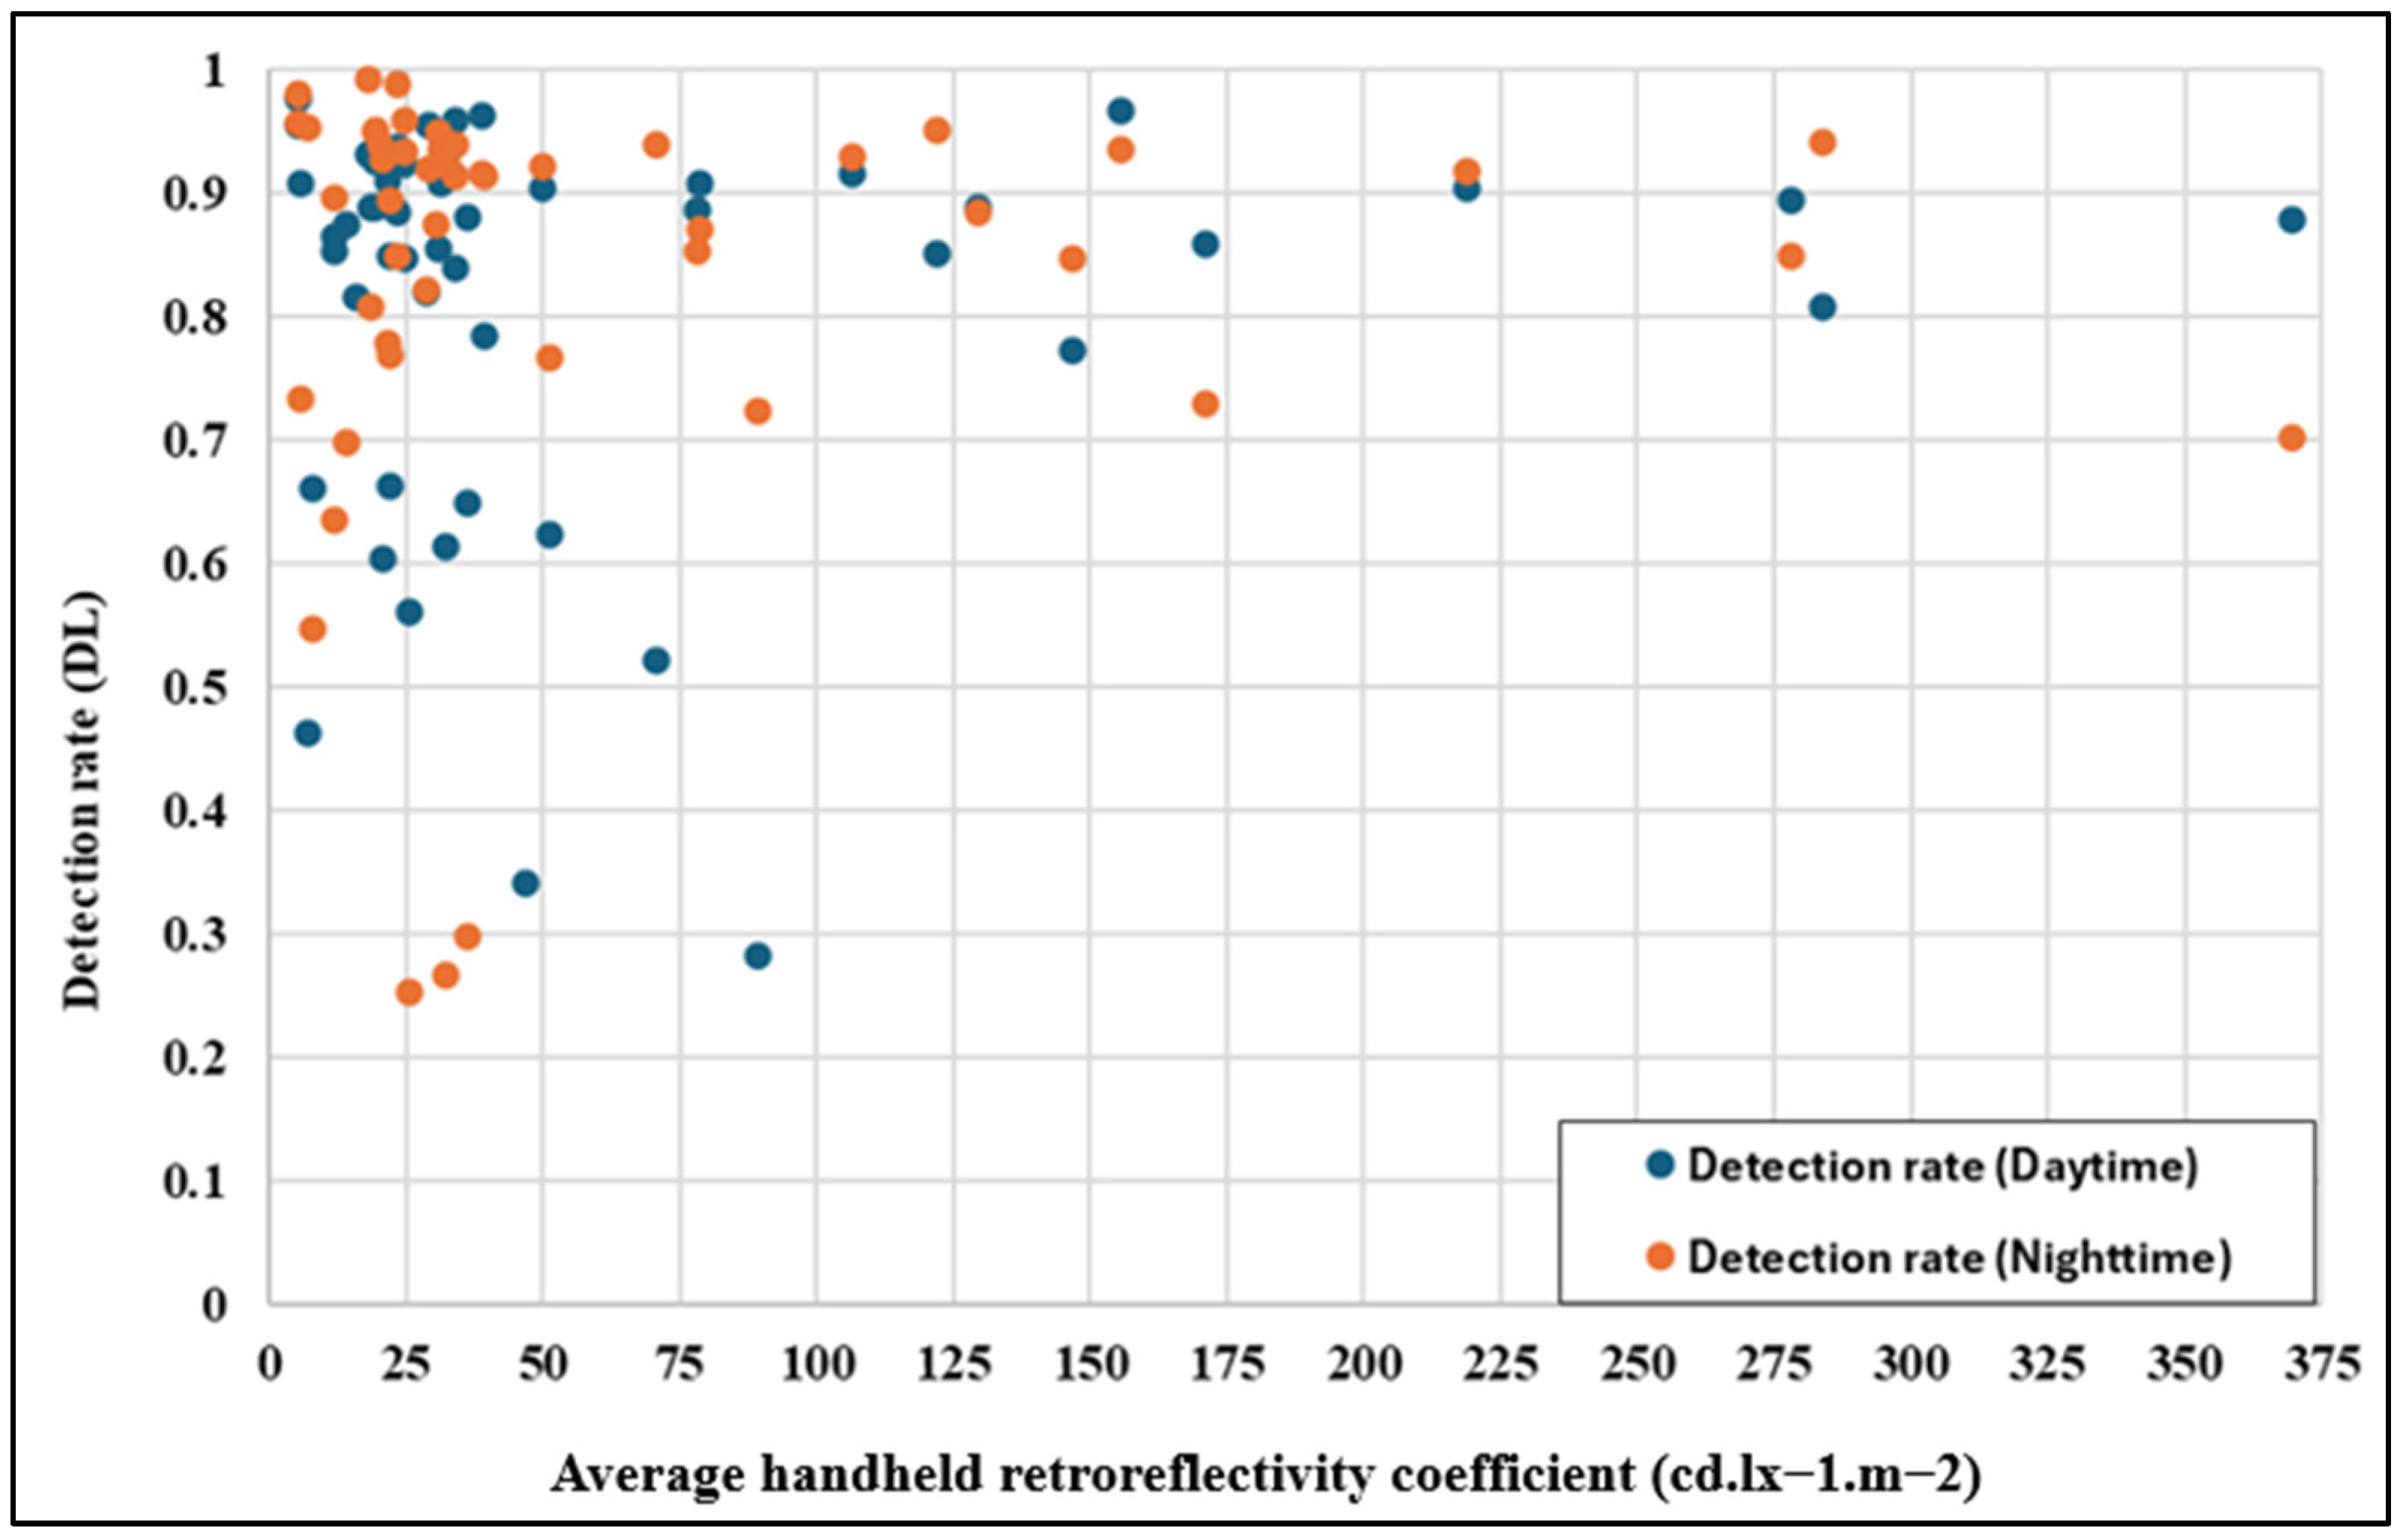
Figure 13 illustrates the relationship between retroreflectivity (Ra) and the detection rate under daytime and night-time conditions for two different classes of materials, RA1 and RA2. When the retroreflectivity exceeds 100 cd. lx
−1.m
−2, the detection performance remains consistently high for both light conditions. This trend highlights the effectiveness of materials with higher retroreflectivity in providing reliable detection rates. Conversely, when the retroreflectivity falls below 100 cd. lx
−1.m
−2, as seen with RA1, there is a noticeable variation in detection performance, particularly at night-time. The significant drop in detection consistency can be attributed to the limited light reflection of these lower-grade materials, which affects night-time visibility more severely than daytime performance.
Table 4 provides a detailed statistical comparison of the retroreflectivity and detection performance for RA1 and RA2 materials.
RA1 signs exhibit low retroreflectivity, with a mean Ra of 29 cd. lx−1.m−2, a standard deviation (STD) of 18.0 and a relative standard deviation (RSD) of 63%, indicating significant variability in their reflective properties. This inconsistency in retroreflectivity directly impacts detection rates. The detection rate during the day has a mean of 0.8, with an STD of 0.17 and an RSD of 21%, reflecting moderate variability. At night, the mean detection rate is slightly higher at 0.83, but with more significant variability (STD = 0.19, RSD = 23%). Therefore, RA1 materials, with their lower retroreflectivity, are particularly prone to inconsistent detection performance under night-time conditions when retroreflection is critical.
In contrast, RA2 signs exhibit significantly higher retroreflectivity, with a mean Ra of 187 cd. lx−1.m−2, an STD of 89.9 and an RSD of 48%, demonstrating better reflective properties despite moderate variability. The detection rate during the day for RA2 is 0.88, with a very low STD of 0.06 and an RSD of 6%, indicating remarkable stability in daytime performance. RA2 signs maintain excellent performance at night-time, with a mean detection rate of 0.87, an STD of 0.08, and an RSD of 9%. This stability highlights the direct correlation between the higher retroreflectivity and consistent detection performance across varying light conditions.
The findings from
Table 4 reinforce the observation in
Figure 13: RA2 materials, with significantly higher retroreflectivity, outperform RA1 materials by delivering stable and reliable detection rates during daytime and night-time conditions. In contrast, RA1 materials show substantial variability, particularly at night, due to their insufficient retroreflective properties.
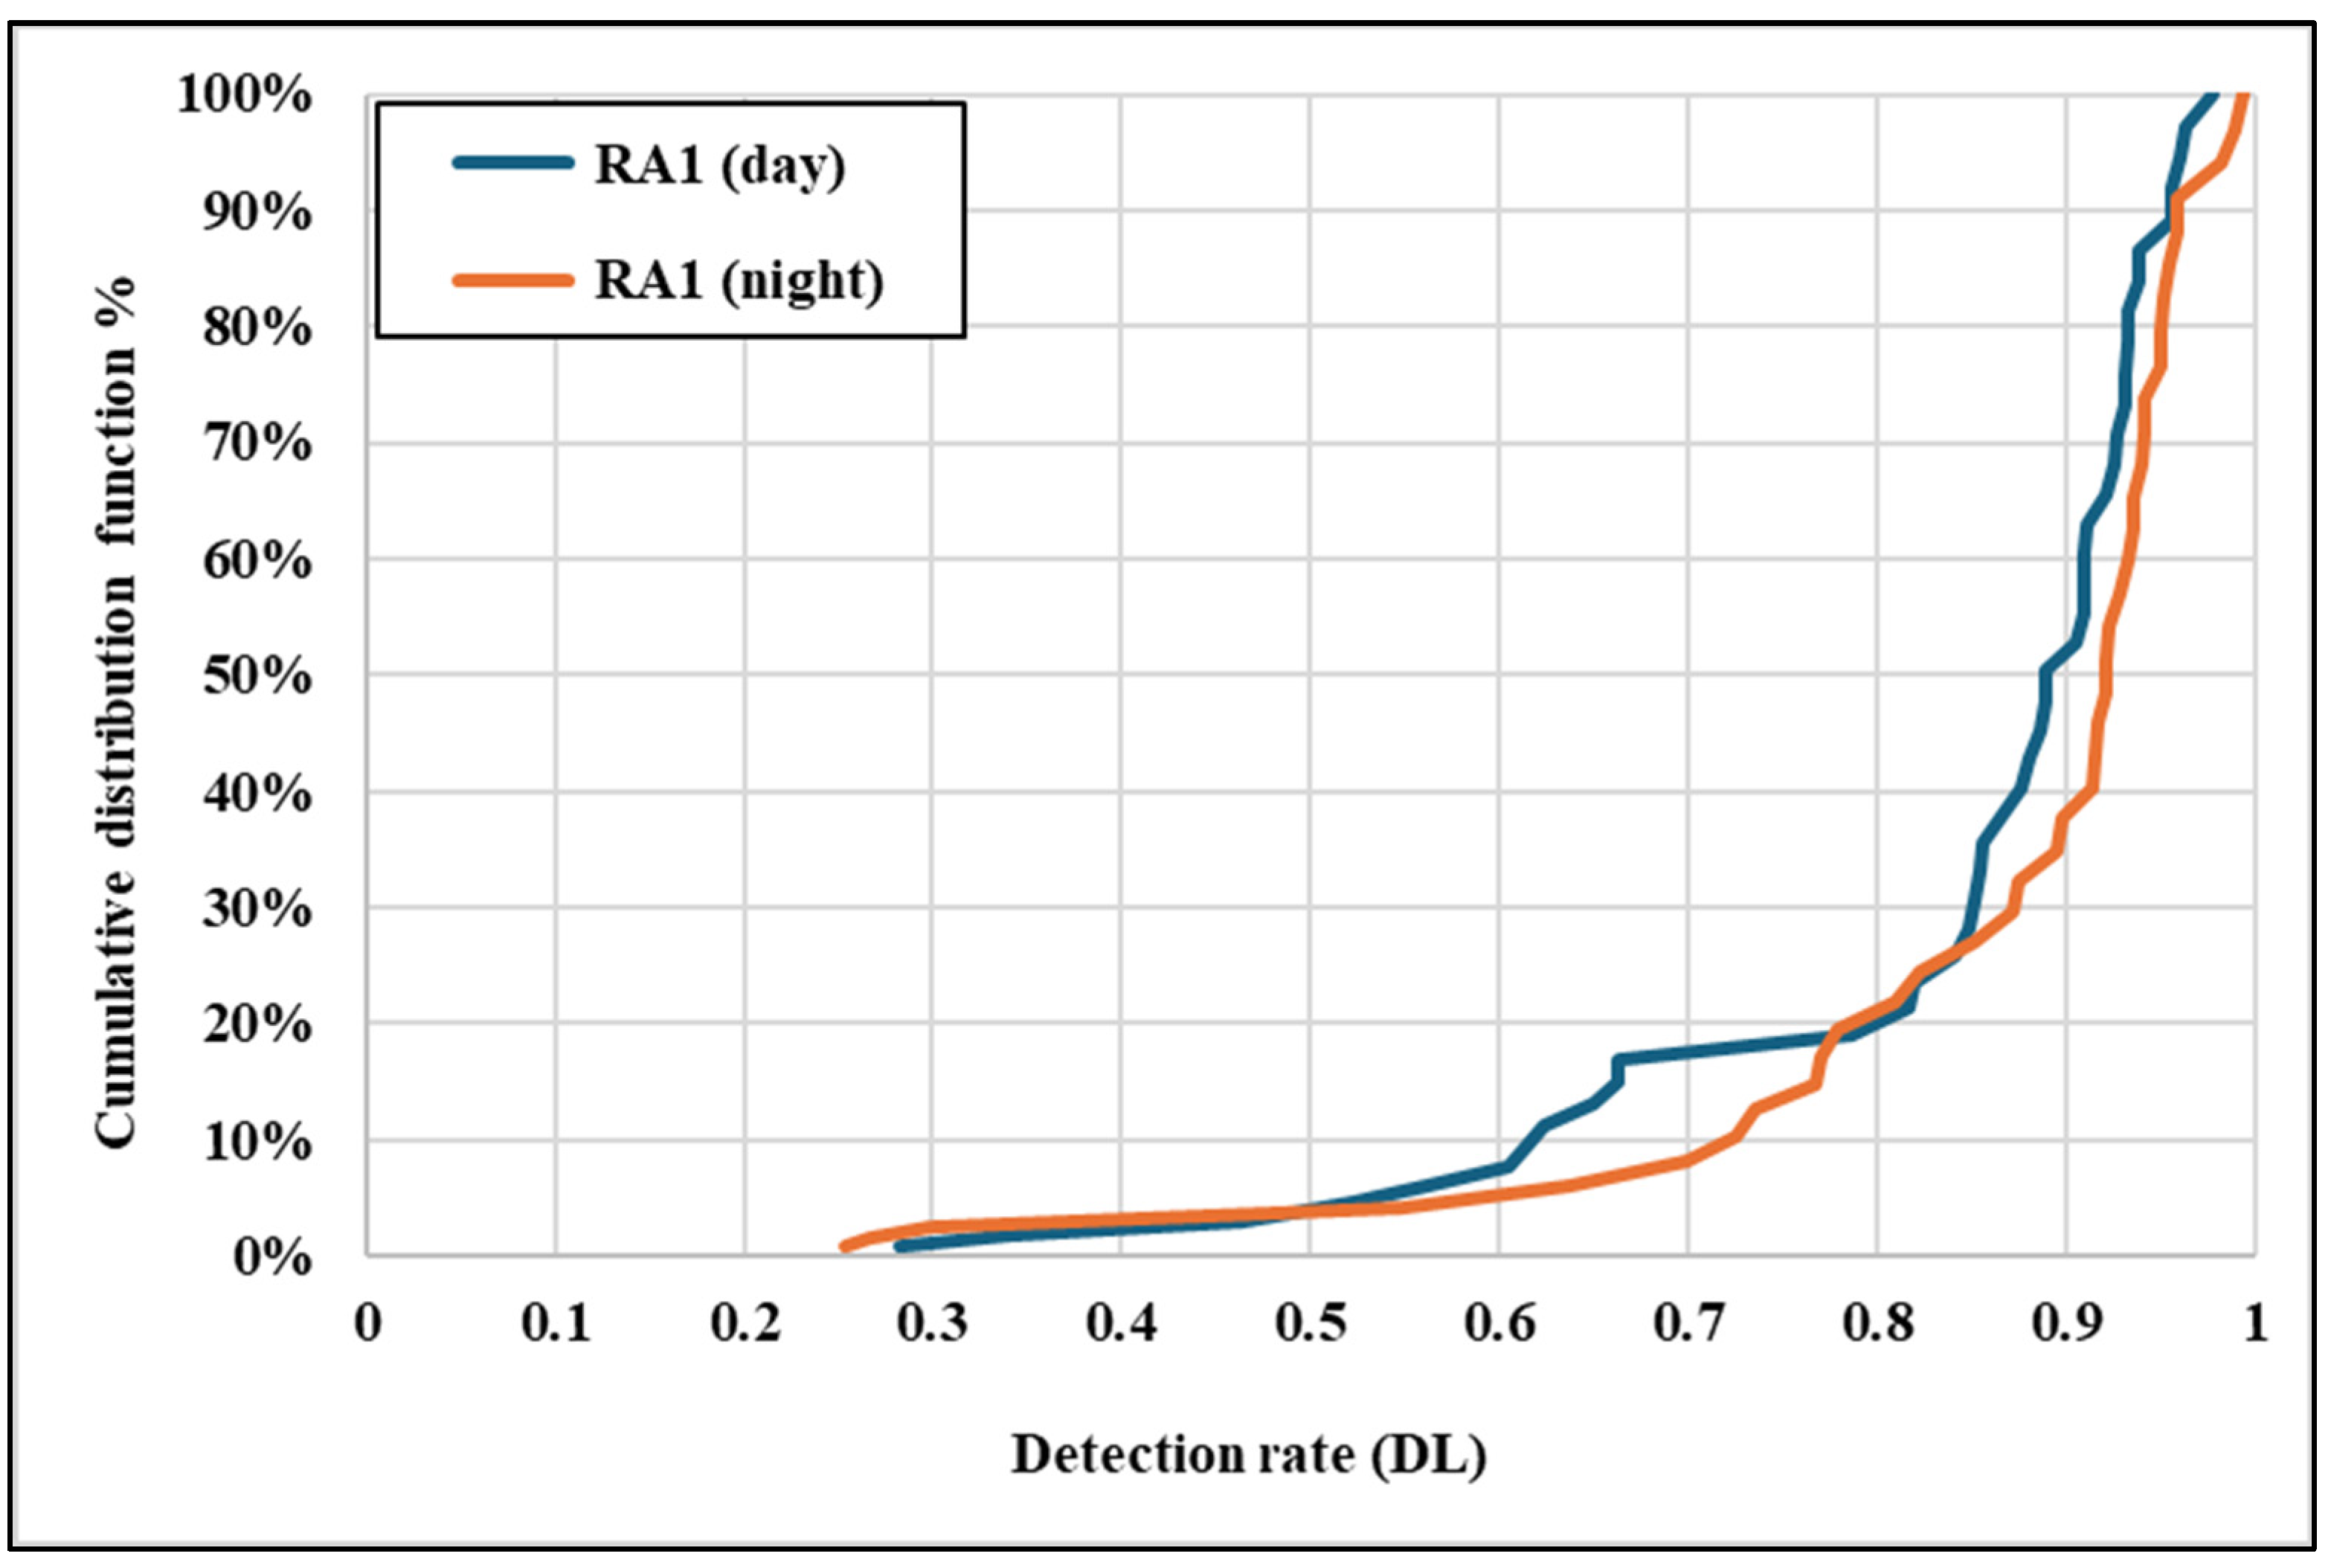
Figure 14 presents the CDF for RA1 detection rates under daytime and night-time conditions. The daytime CDF shows a gradual slope, with detection rates steadily increasing and reaching values close to 0.98. This indicates that RA1 traffic signs generally achieve moderate daily detection rates despite their lower retroreflectivity (mean Ra = 29). However, the night-time CDF exhibits a steeper slope, with detection rates starting much lower (around 0.25) and displaying significant variability. The slower growth and broader spread of detection rates reflect the difficulty of detecting RA1 signs under low-light conditions due to an inadequate retroreflective performance. This highlights the limitations of RA1 materials, where low Ra values result in a reduced and less reliable detection performance, particularly at night.
Figure 15 illustrates the CDF for RA2 detection rates under different lighting conditions. The daytime CDF shows a steep slope, with detection rates consistently above 0.77 and reaching up to 0.97, reflecting the excellent performance of RA2 signs during daylight. The clustering of detection rates at the higher end indicates minimal variability, supported by the low standard deviation and RSD values for the daytime performance of RA2. Similarly, the night-time CDF for RA2 starts at a relatively high value (0.70) and quickly rises toward the maximum (0.95), demonstrating strong performance even under low-light conditions. The consistency of the night-time detection rates is attributed to the higher retroreflectivity (mean Ra = 187), which enables superior light reflection and ensures high visibility. Compared to RA1, RA2 signs exhibit significantly less variability in both conditions, as indicated by the uniform slope of the CDF curves.
The data presented in
Figure 13,
Figure 14 and
Figure 15 and
Table 4 demonstrate the critical role of retroreflectivity in traffic sign detection performance. RA2 materials with higher retroreflectivity values exhibit consistent and superior detection rates under both daytime and night-time conditions. In contrast, RA1 materials, with lower retroreflectivity and higher variability, show reduced and inconsistent performance, particularly at night. These findings emphasize the importance of maintaining sufficient retroreflectivity in traffic signs, mainly through higher-grade materials like RA2, to ensure an optimal detection performance and road safety under all lighting conditions.
This study’s findings align with prior research emphasizing the critical role of retroreflectivity in traffic sign detection, particularly under night-time and low-light conditions. Higher retroreflectivity materials (e.g., RA2) demonstrated superior and a consistent detection performance compared to lower-grade materials (RA1), mirroring the trends reported by Aldoski et al., (2024) [
44] and Seraj et al., (2021) [
13]. The observed variability in RA1 detection rates under night-time conditions reinforces the limitations of lower retroreflectivity materials, as previously noted in studies addressing environmental and lighting challenges [
13,
23]. These results complement advancements in detection algorithms, such as YOLOv3 and TFSANet, which have shown improved robustness under dynamic conditions [
20,
23]. Furthermore, this study highlights the importance of integrating retroreflectivity assessments into autonomous vehicle (AV) detection systems, supporting findings that physical material properties significantly impact detection accuracy [
5,
32]. These comparisons underscore the necessity of higher-grade retroreflective materials to enhance detection reliability in real-world scenarios.
4.3. Overall Intensity
The overall intensity refers to the average pixel intensity of an entire traffic sign in an image, serving as a crucial metric for evaluating a sign’s brightness, contrast, and visibility. This parameter is critical for human drivers and automated detection systems, as higher intensity values are associated with improved detectability. The intensity is determined by averaging the pixel values across the traffic sign’s area, where in an 8-bit grayscale image, the pixel values range from 0 (black) to 255 (white). The visibility and detectability of traffic signs depend heavily on external factors such as the lighting conditions, retroreflective properties, and the quality of materials. A direct comparison between daytime and night-time intensities reveals significant disparities, which influence detection performance under varying light conditions.
The statistical analysis clearly contrasts the daytime and night-time overall intensity values, as shown in
Table 5. During the daytime, the mean overall intensity is 128, with an STD of 52 and an RSD of 41%, indicating a moderate variation in intensity across traffic signs. This variability can be attributed to ambient lighting, sign positioning, and material retroreflectivity differences. In comparison, the night-time overall intensity exhibits significantly lower values, with a mean of 42, an STD of 19, and an RSD of 45%. The higher relative variability during night-time suggests that certain traffic signs struggle to reflect sufficient light, reducing brightness. This can be attributed to lower retroreflectivity in some signs or environmental challenges, such as glare, shadows, or occlusions. The reduced mean intensity at night highlights the critical role of retroreflective materials, as visibility in low-light conditions relies entirely on the reflection of artificial illumination.
The daytime CDF demonstrates a wider spread of intensity values, with a gradual slope and clustering towards higher intensity values (above 100), as presented in
Figure 16. This distribution reflects the consistent availability of natural light during the day, which enhances the overall visibility of traffic signs across a broader intensity range. In contrast, the night-time CDF shows a steeper slope, with intensity values clustered predominantly below 80. This steep curve highlights the significant reduction in sign brightness under night-time conditions, emphasizing the limitations of low retroreflectivity and the challenges associated with artificial illumination. Signs with lower retroreflectivity disproportionately exhibit poor visibility and an inconsistent detection performance.
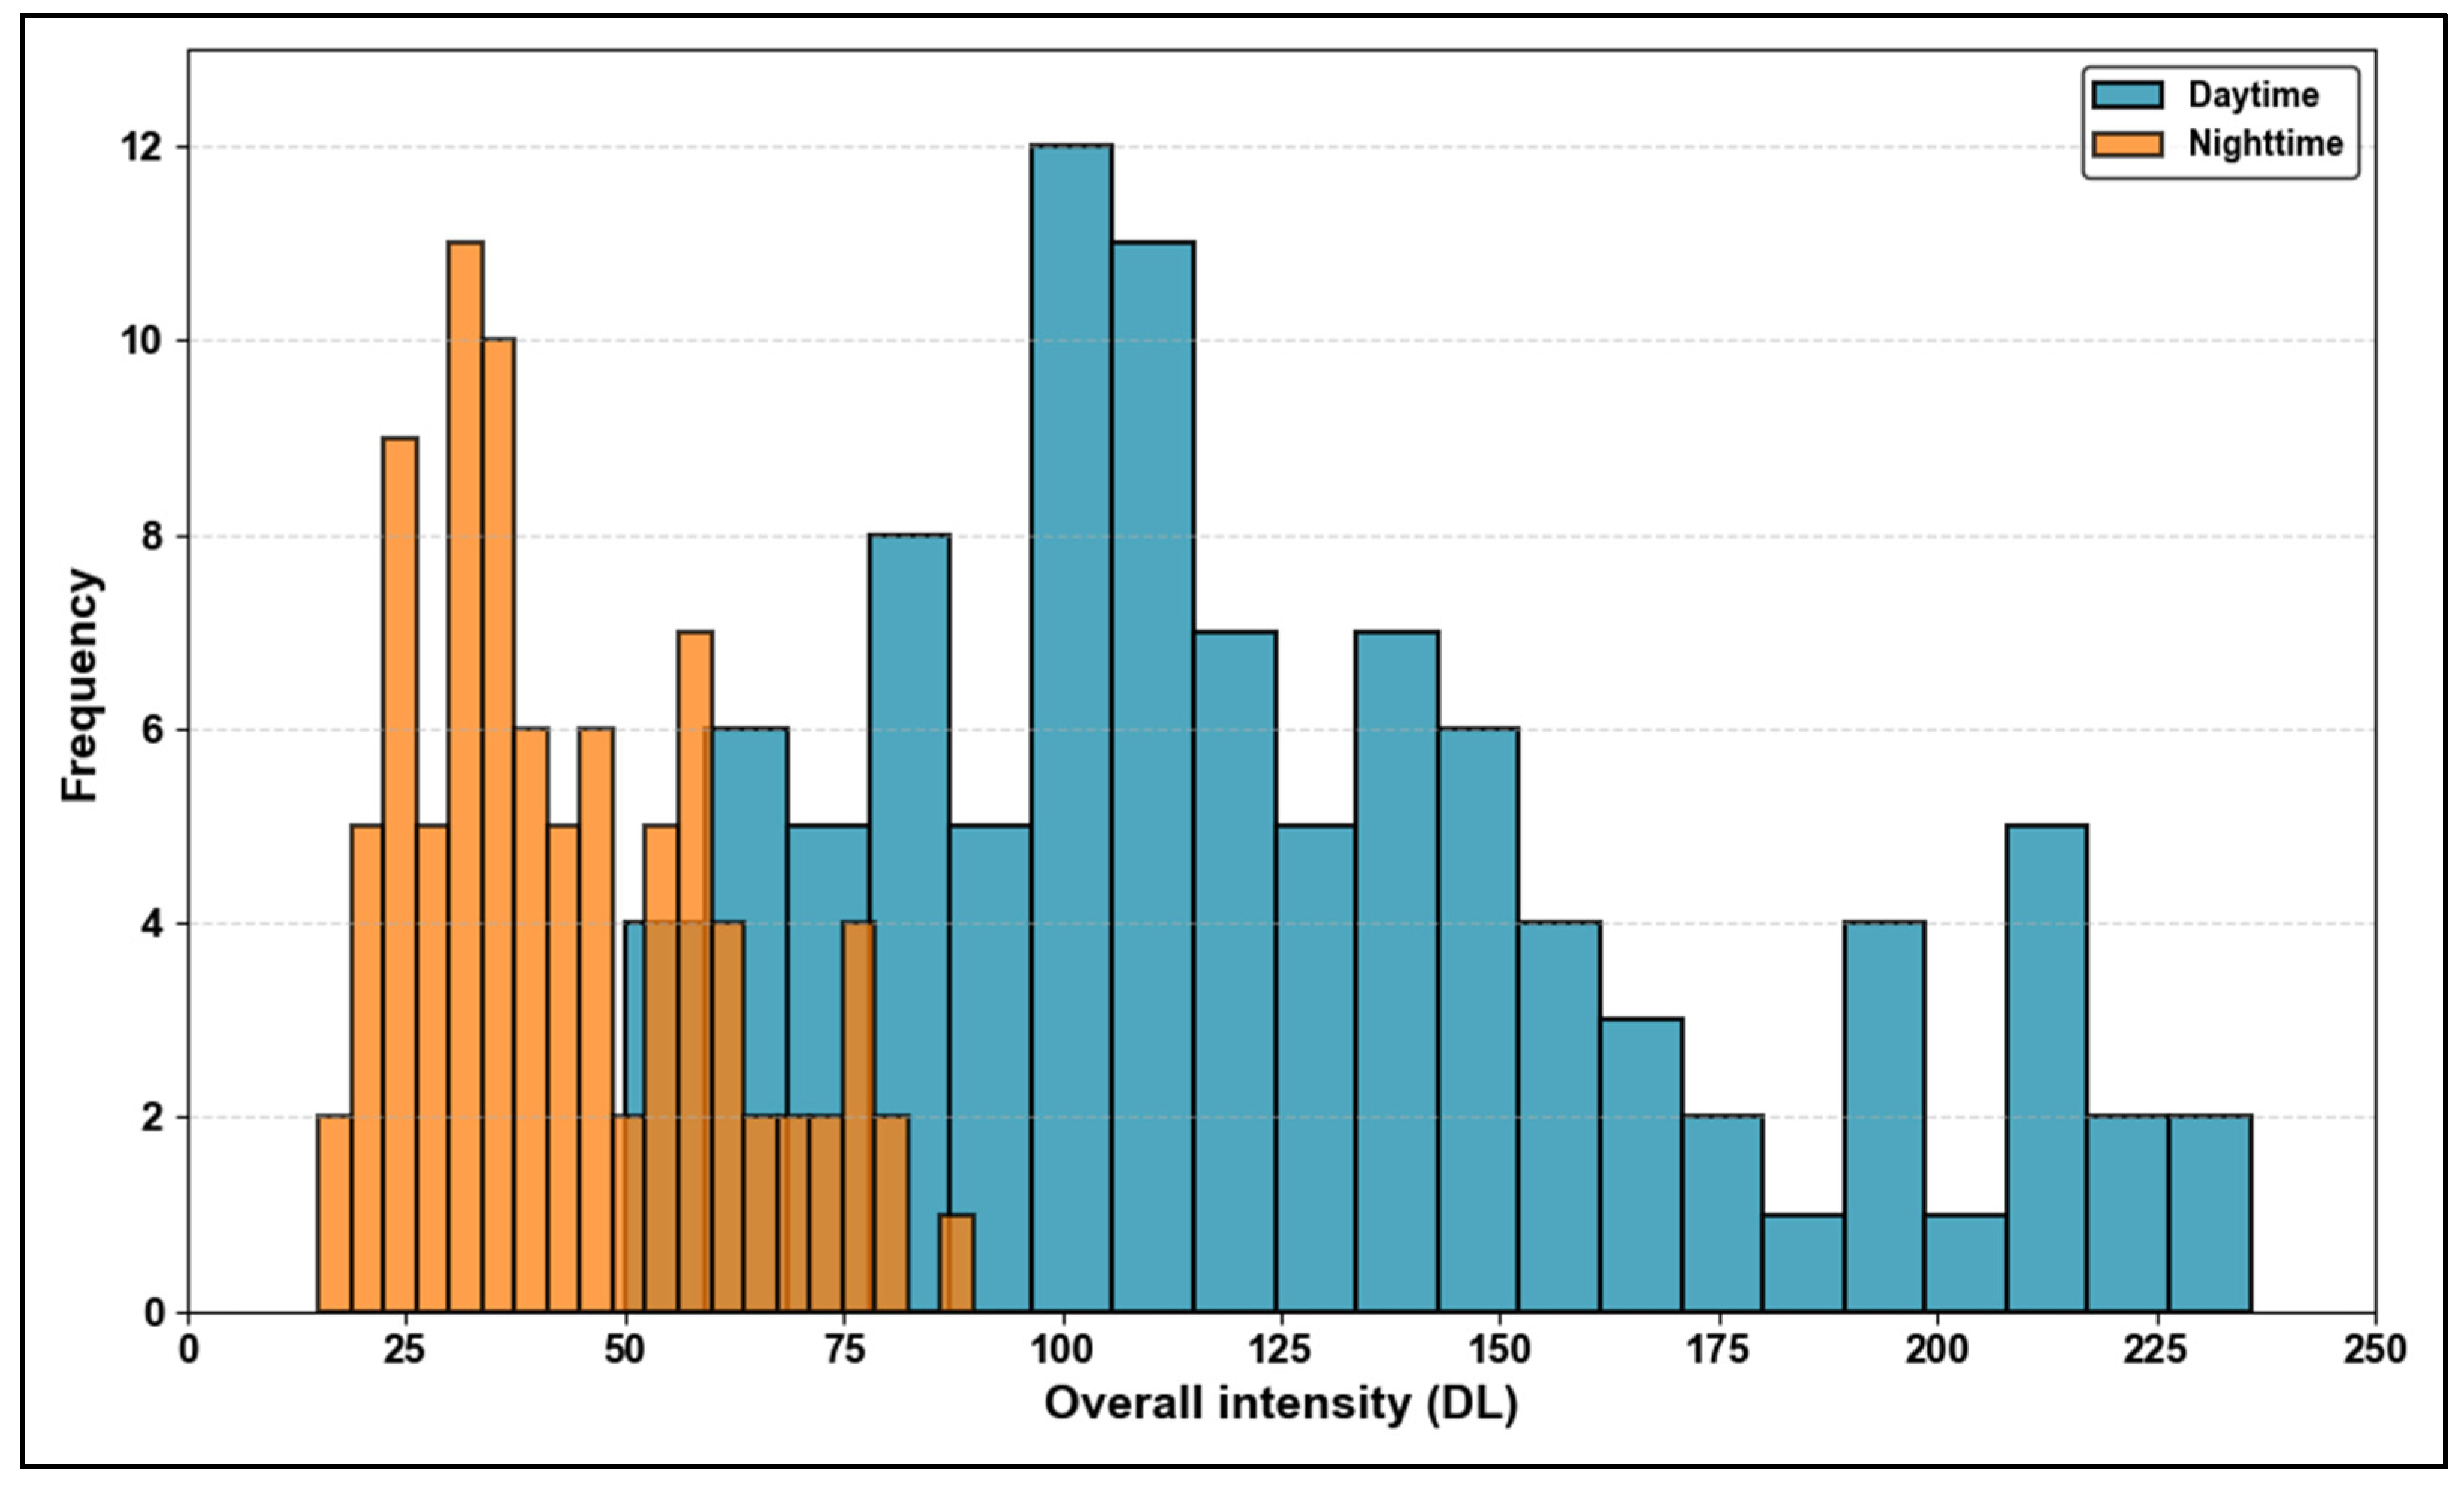
The histogram of overall intensity in
Figure 17 shows a clear contrast between daytime and night-time conditions. The daytime intensity values are widely distributed, mostly ranging from 50 to 230, reflecting the benefit of natural light for improved sign visibility. In contrast, the night-time intensities cluster between 20 and 80, emphasizing the challenge of maintaining visibility in low-light conditions. The minimal overlap between the two distributions highlights the significant reduction in intensity at night, underscoring the importance of retroreflective materials for reliable night-time visibility.
The analysis of overall intensity reveals that the daytime intensity values are substantially higher and more widely distributed than the night-time values, as evidenced by the statistical metrics and the CDF in
Figure 16. The daytime mean intensity of 128 benefits from natural lighting, enhancing visibility and ensuring a reliable detection performance. In contrast, the night-time mean intensity of 42 reflects the challenges posed by reduced light conditions, where the effectiveness of traffic signs relies heavily on their retroreflective properties. The higher variability in night-time intensities (RSD = 45%) further underscores the importance of high-quality retroreflective materials to ensure consistent brightness and visibility. These findings highlight the need for targeted improvements in traffic sign materials, particularly for night-time conditions, to maintain an optimal detection performance and ensure traffic safety under all lighting scenarios.
4.5. Relationship Between On-Site and Camera-Based Human Evaluation Data
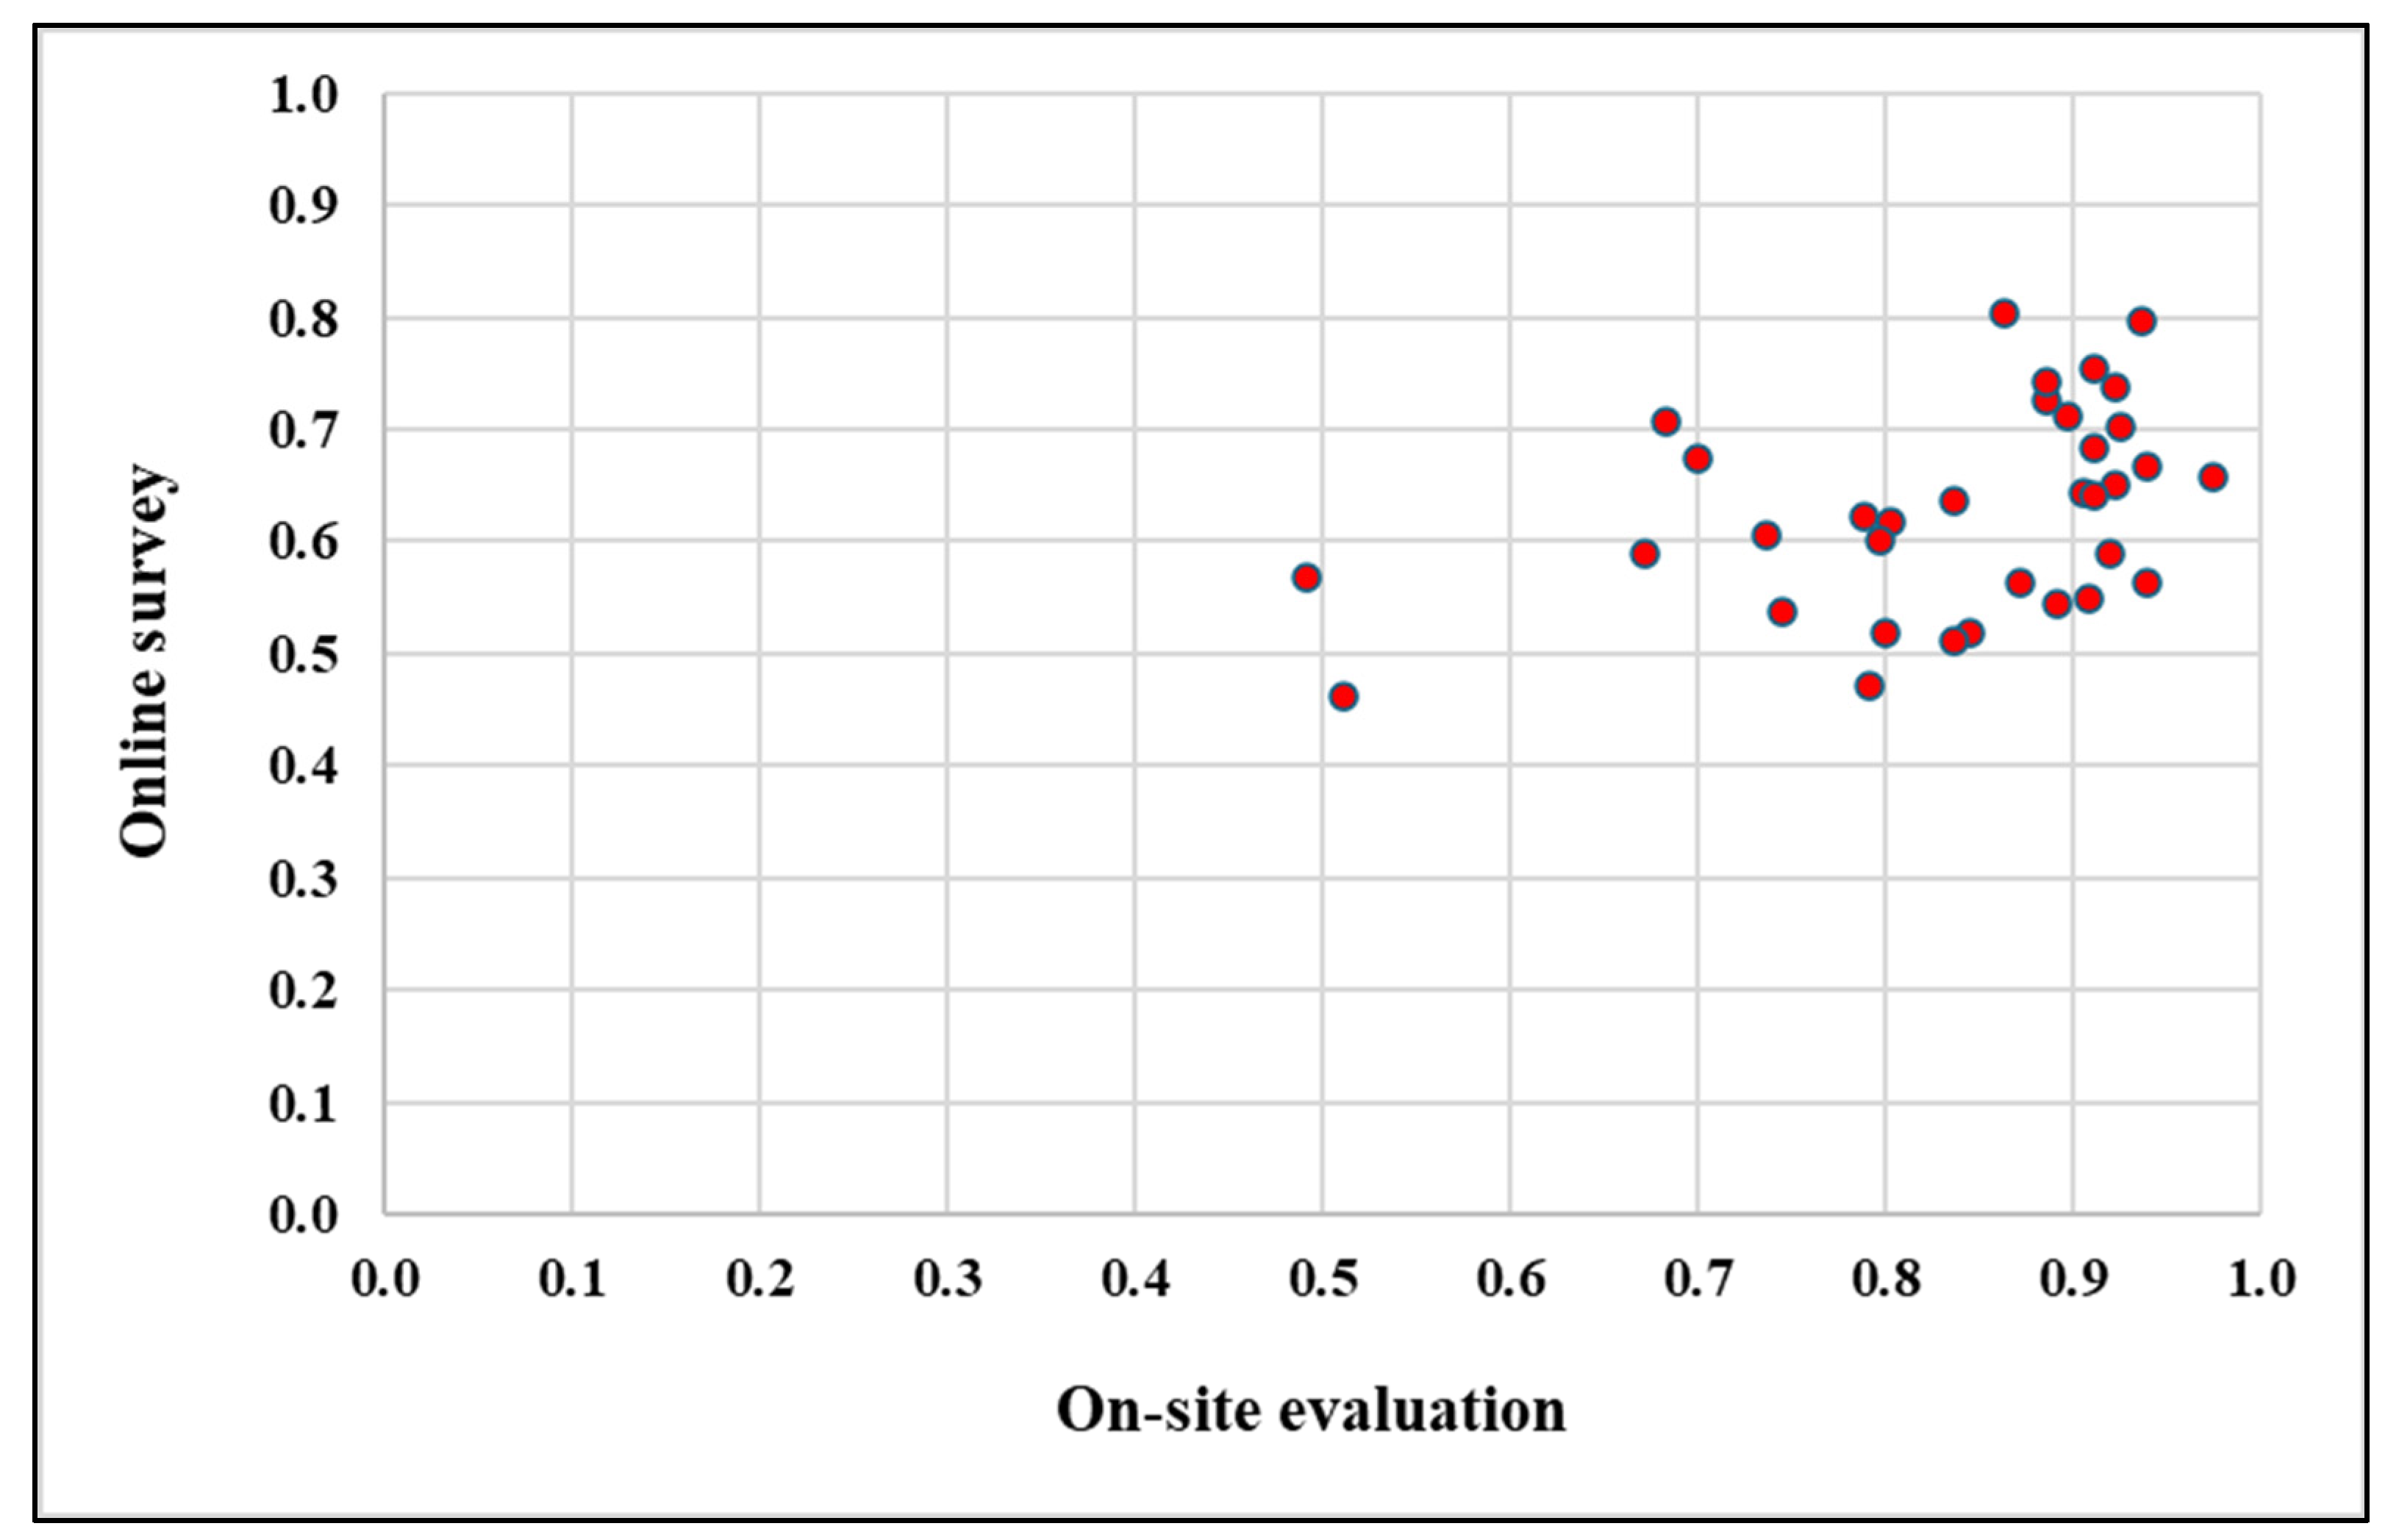
The relationship between the on-site and online evaluation of traffic signs, as shown in
Figure 18, indicates a weak correlation between the two methods. The scatter diagram reveals that the scores from the on-site evaluation span a broader range, from 0.49 to 0.98, compared to the narrower range of 0.46 to 0.80 in the online survey. The on-site scores are generally higher, particularly in the middle and upper range of the scale. For instance, when the on-site scores fall within the range of 0.70 to 0.90, the corresponding online scores often remain below 0.80, suggesting that the evaluation conditions significantly influence the results.
Evidence of this disparity appears in the clustering of higher scores. The on-site evaluations frequently produced ratings exceeding 0.90, whereas the online survey rarely exceeded this threshold. Conversely, when the on-site scores were in the lower range (e.g., below 0.60), the online scores were more closely aligned, indicating the consistent underperformance of online scores relative to their on-site counterparts across most ranges.
This pattern underscores the impact of contextual and environmental factors inherent in the on-site evaluations. Factors such as lighting, viewing angle, and the dynamic context of real-world interactions likely contribute to the broader range and generally higher scores in on-site assessments. In contrast, the absence of these factors in the static-image-based online survey restricts participants’ ability to fully evaluate traffic sign visibility, leading to more conservative scores. These findings highlight the limitations of online surveys and suggest that on-site evaluations provide a more comprehensive and favorable representation of traffic sign visibility and effectiveness.
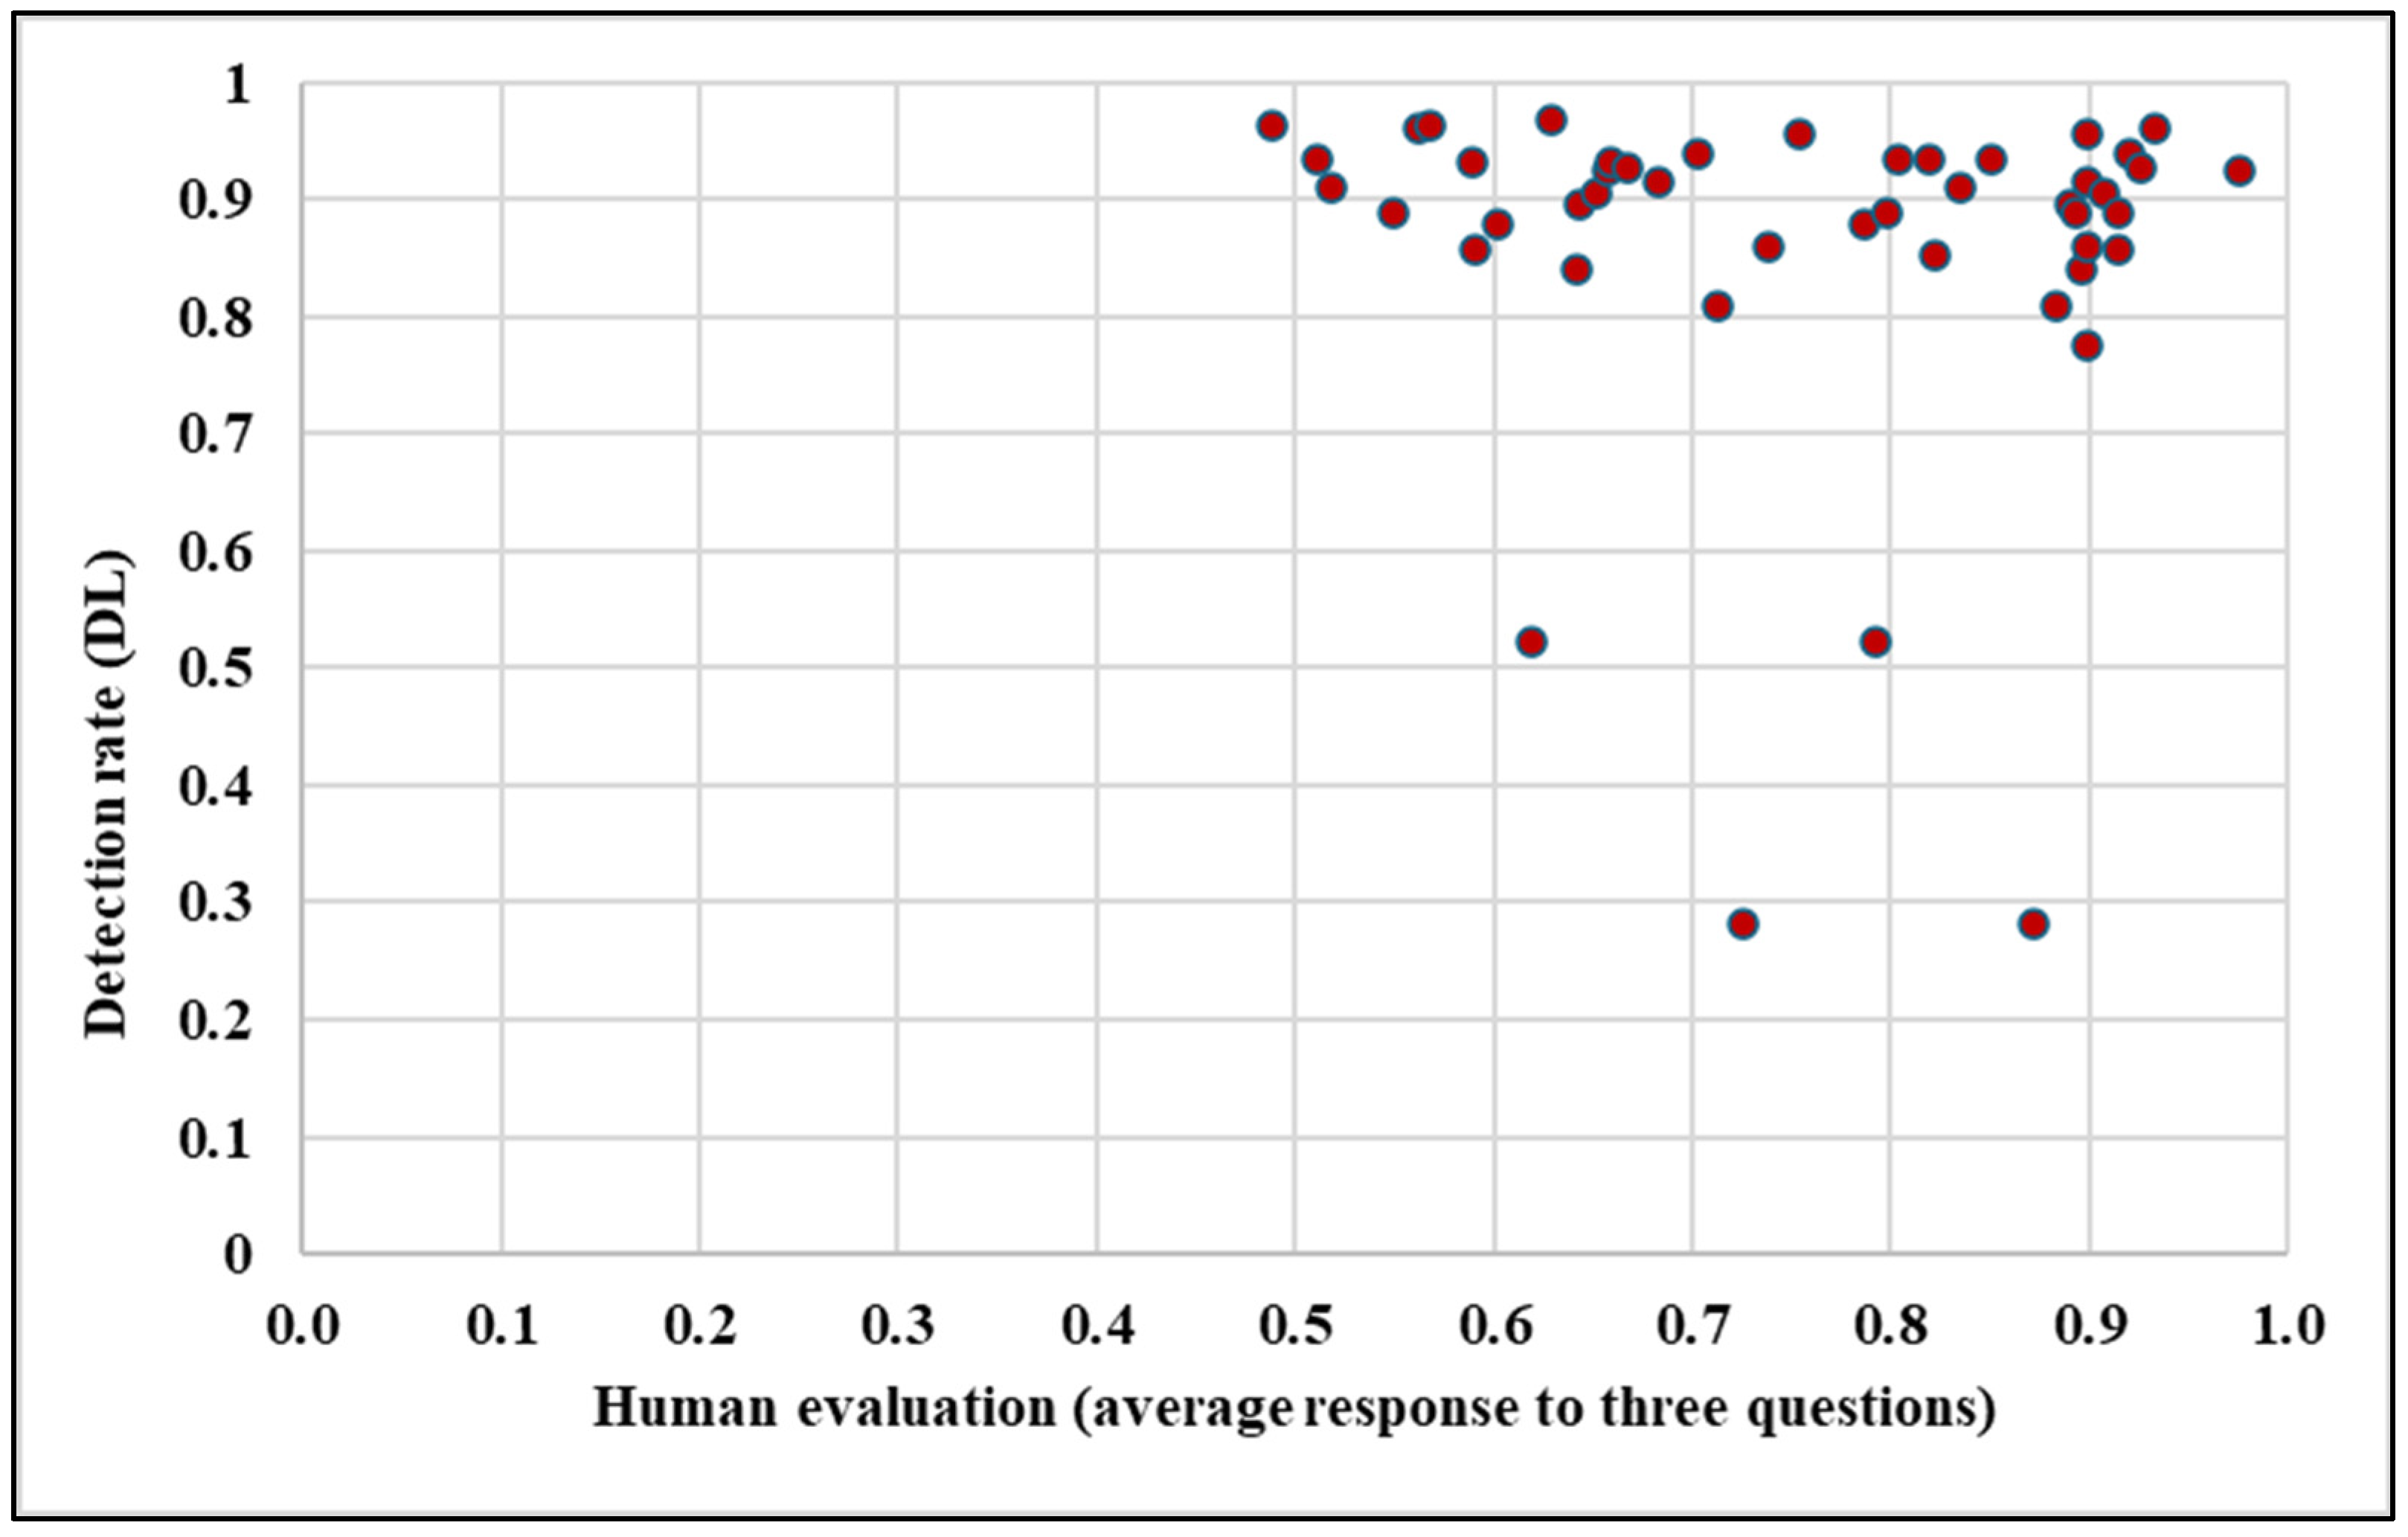
The analysis of the relationship between human evaluation scores and the detection rates during daytime, as shown in
Figure 19, reveals no significant correlation. While there are instances where higher human evaluation scores align with better detection rates, the overall trend does not consistently support a clear relationship between the two metrics. The mean human evaluation score (0.75) is slightly lower than the mean detection rate (0.88), indicating that the camera system often performs better in specific scenarios. This is especially true for signs with high retroreflective properties or optimal positioning, where the camera system can detect signs more reliably than human evaluators.
Generally, when the average response to the three questions in human evaluation exceeds 0.5, the detection rate tends to exceed 0.8, as illustrated in
Figure 19. This implies that higher human evaluation scores are generally associated with a better detection performance, reflecting the system’s effectiveness when rated more favorably by human evaluators.
However, there are notable exceptions to this trend. Sometimes, even when on-site human evaluation scores surpass 0.5, the detection rate does not meet the expected threshold of 0.8. These anomalies suggest that while human evaluation provides valuable insights into the system’s effectiveness, other factors, such as environmental conditions, camera quality, or specific scenarios where the detection model may not perform optimally, influence the detection performance.
However, there are notable exceptions to this trend. Sometimes, even when the on-site human evaluation scores surpass 0.5, the detection rate does not meet the expected threshold of 0.8. These anomalies suggest that while human evaluation provides valuable insights into the system’s effectiveness, other factors, such as environmental conditions, camera quality, or specific scenarios where the detection model may not perform optimally, influence the detection performance.
Considerable variability is observed in the data, as reflected in the RSD values of 16.3% for human evaluation and 15.3% for detection rates. This variability indicates that, in some instances, signs with lower human evaluation scores can still achieve high detection rates. Such discrepancies can be attributed to the camera’s reliance on retroreflectivity and other technical factors that enhance visibility. At the same time, human evaluators may be influenced by subjective visual factors, such as the contrast, angle of observation, or environmental distractions, leading to differences in evaluation outcomes.
An independent t-test further revealed a statistically significant difference (p < 0.001) between the human evaluation scores and detection rates, emphasizing that they are distinct while the two metrics are related. Human evaluations capture a broader range of subjective visual factors, while camera detection primarily relies on retroreflectivity and algorithmic recognition, which may not always align with human perception.
The findings indicate no clear correlation between human evaluation and the camera-based detection rates. While both metrics emphasize the importance of retroreflective properties and sign visibility, their differing evaluation criteria, with subjective visual impressions versus algorithmic recognition, highlight each assessment method’s distinct roles. Addressing factors such as glare, shadows, and environmental conditions could enhance the performance of both human evaluators and camera systems, ensuring consistent traffic sign detectability. These results underscore the value of using human evaluation as a complementary measure in assessing automated detection systems.
Comparison of Human and Algorithmic Methods for Evaluating Traffic Sign
This study employed two complementary methods to assess traffic sign visibility: human evaluations (on-site and online) and algorithmic detection using the YOLOv8 model. Human evaluations provided subjective insights into visibility, readability, and contrast based on real-world perceptions. Viewing angles, environmental distractions, and lighting conditions influenced them. In contrast, the YOLOv8 algorithm relied on objective metrics, such as retroreflectivity and pixel intensity, to evaluate traffic signs.
A key distinction is the ability of the algorithm to maintain consistency across varying conditions, such as low-light scenarios, where human evaluations often exhibit variability due to subjective factors. For instance, human evaluators were more affected by glare or shadows, whereas the algorithm demonstrated robust performance when the retroreflective properties were high. However, in poor retroreflectivity or low-contrast scenarios, human evaluators outperformed the algorithm by relying on contextual understanding and prior knowledge.
These differences highlight the complementary nature of both methods. While human evaluations capture real-world perceptions critical for human-centric design, algorithmic methods excel in providing objective, repeatable assessments, particularly under controlled conditions


