
Analysis of Structural Design Variations in MEMS Capacitive Microphones


Abstract
1. Introduction
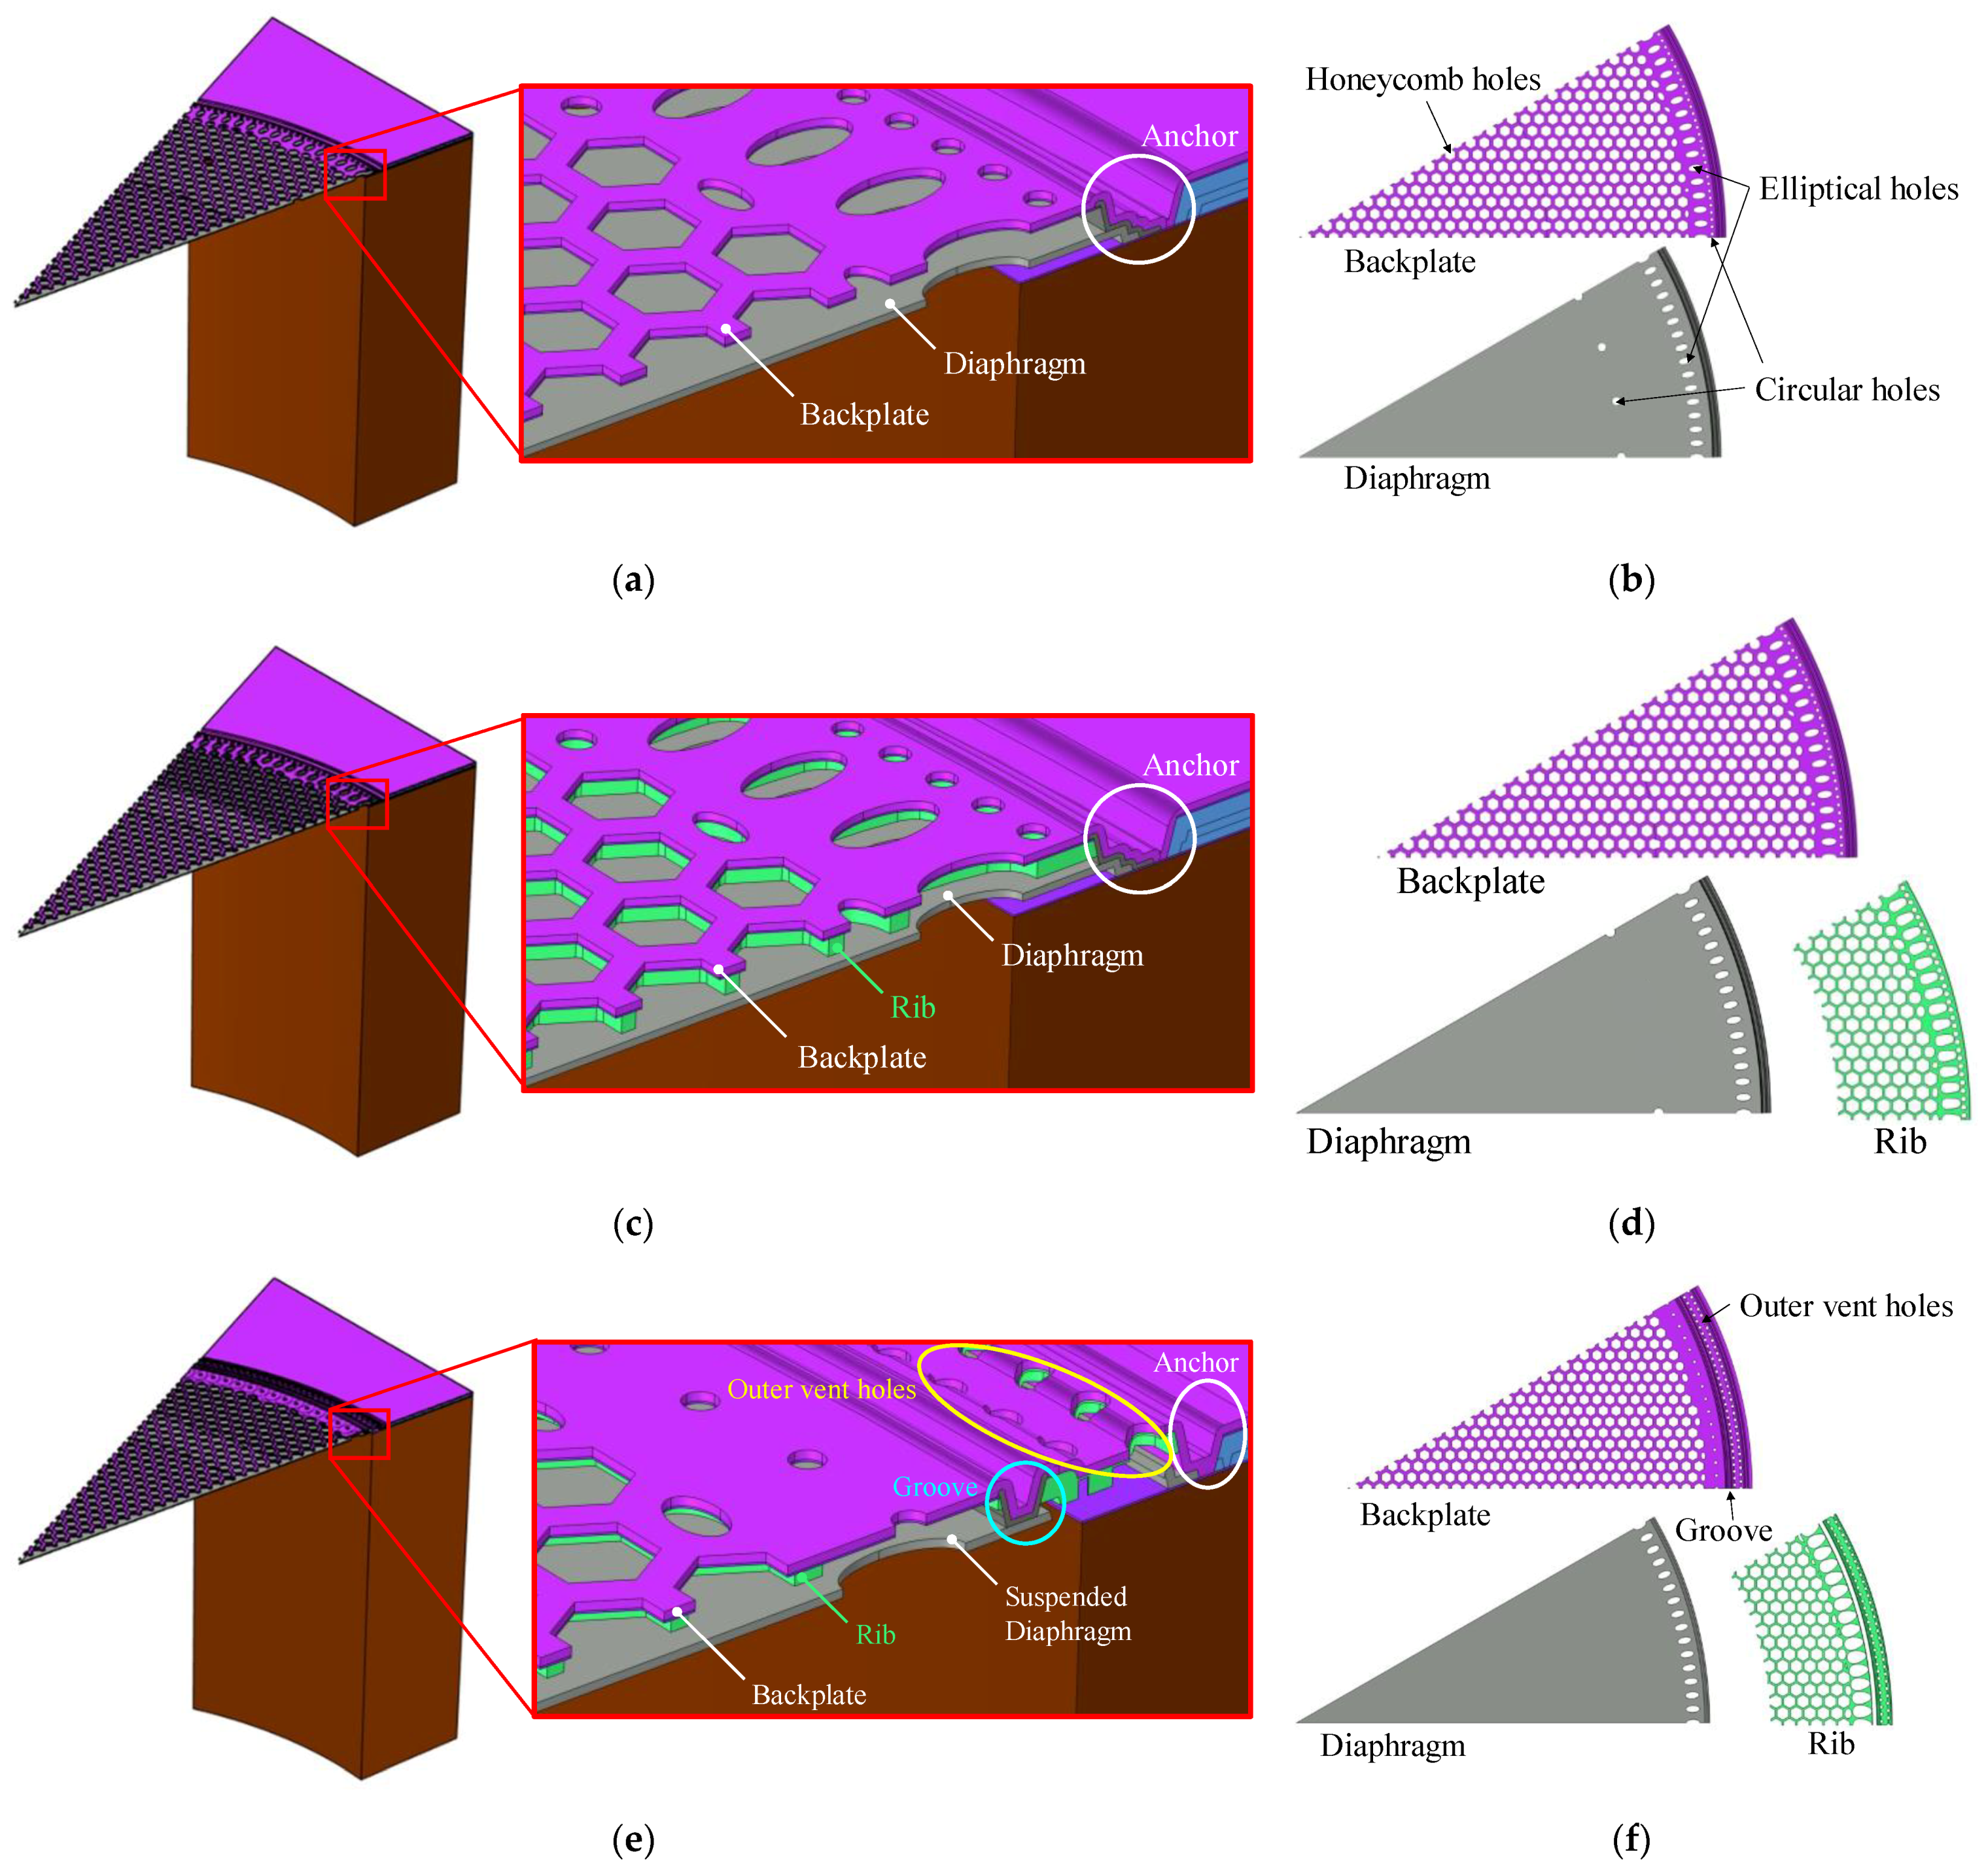
2. The Designs of the Microphones
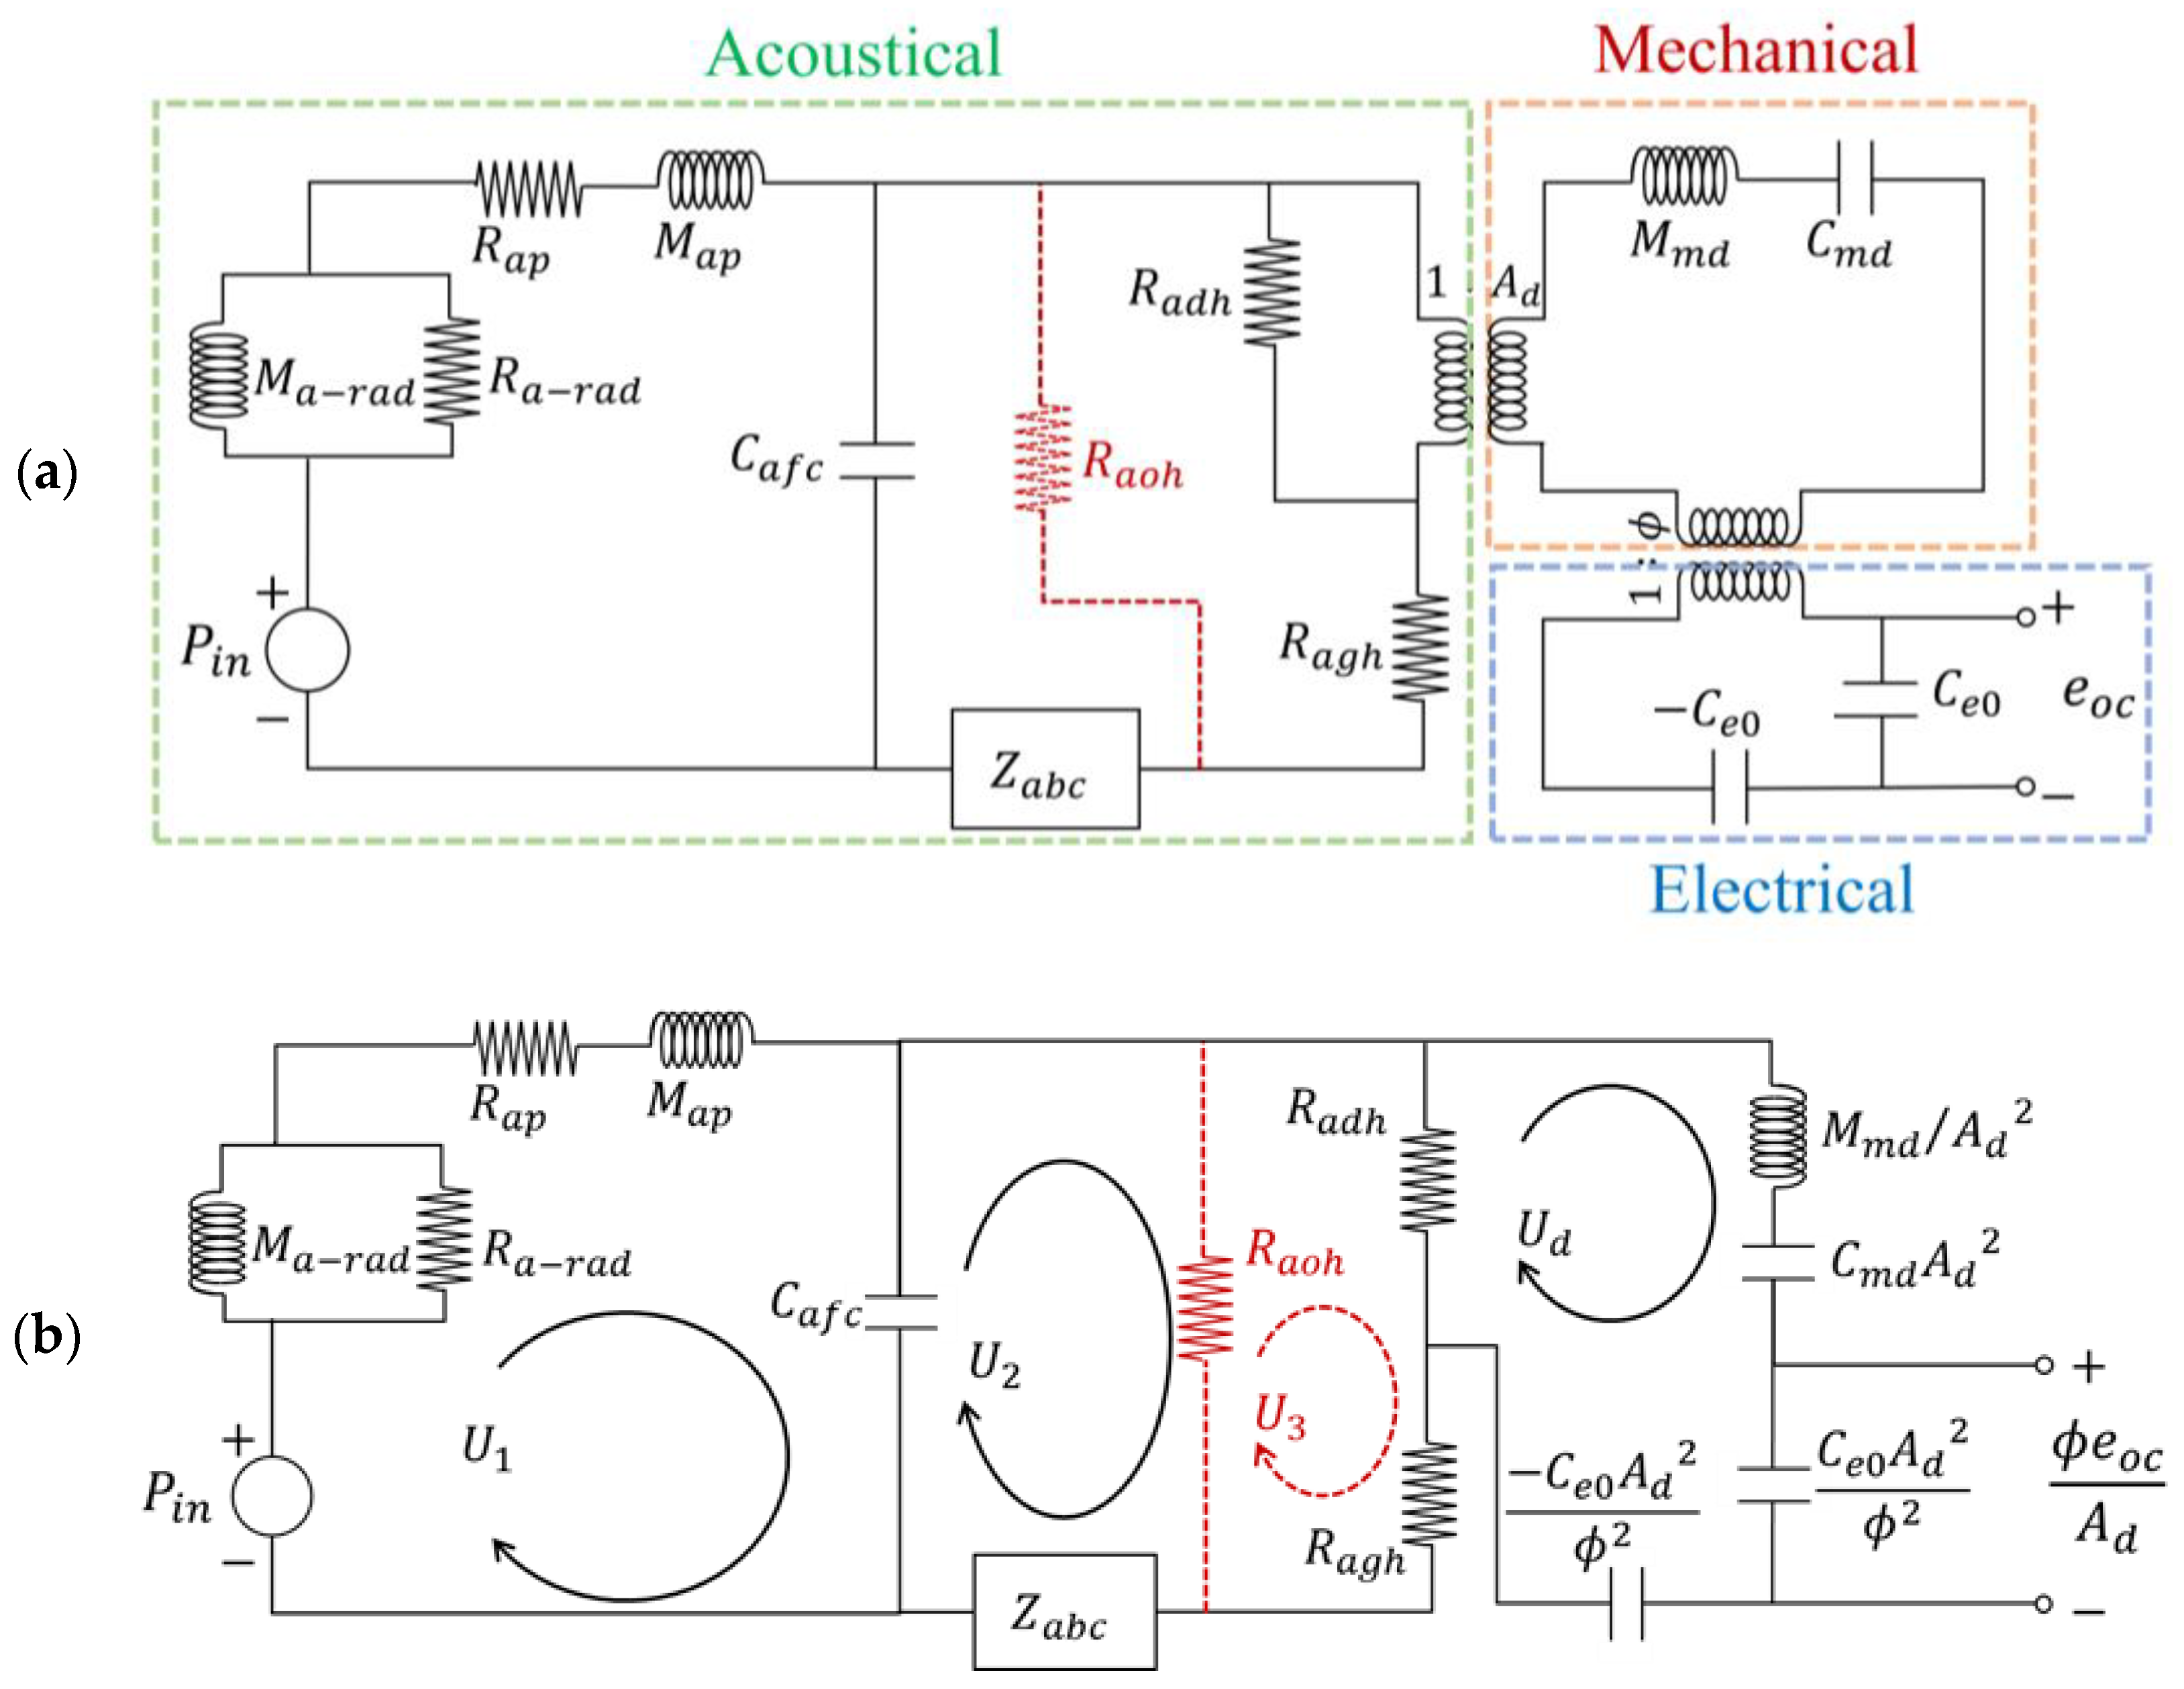
3. Equivalent Circuit Model
3.1. Sensitivity
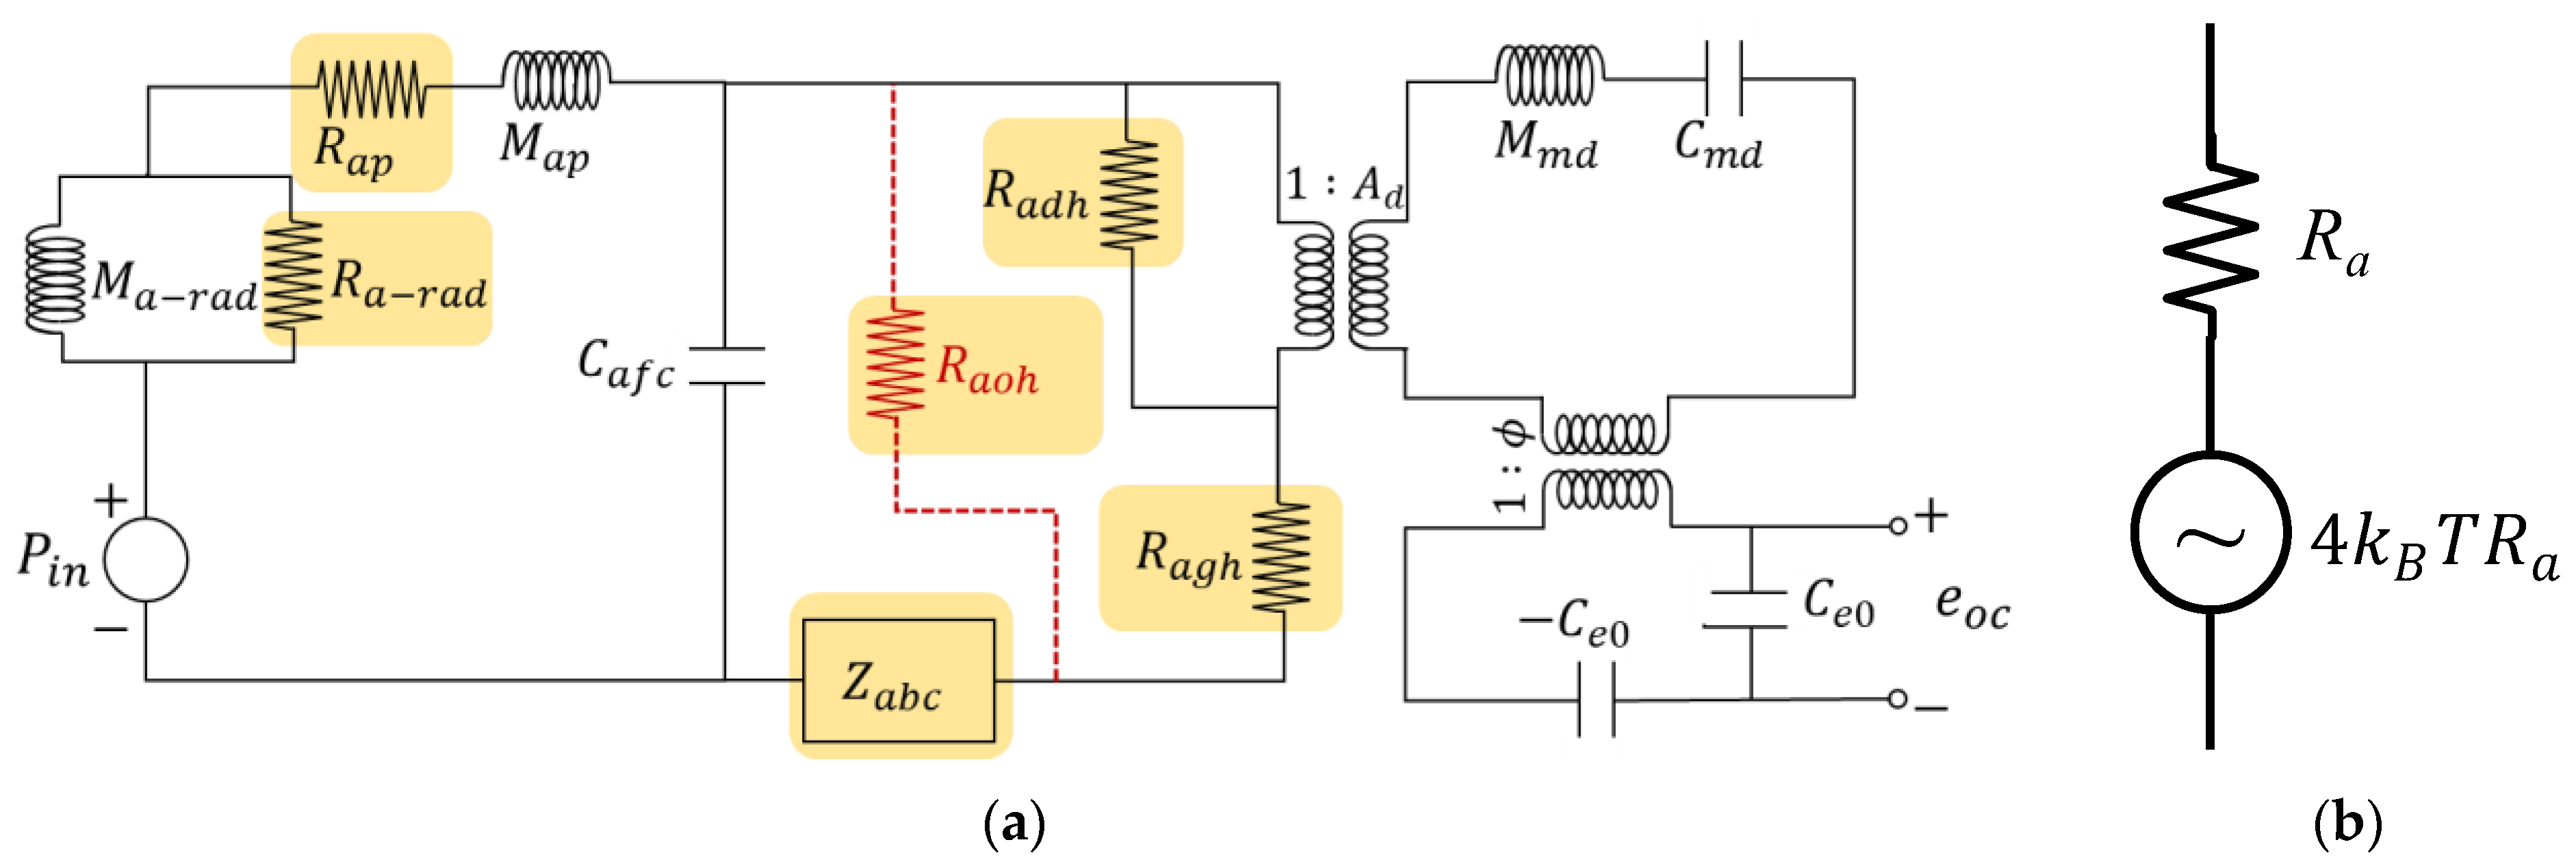
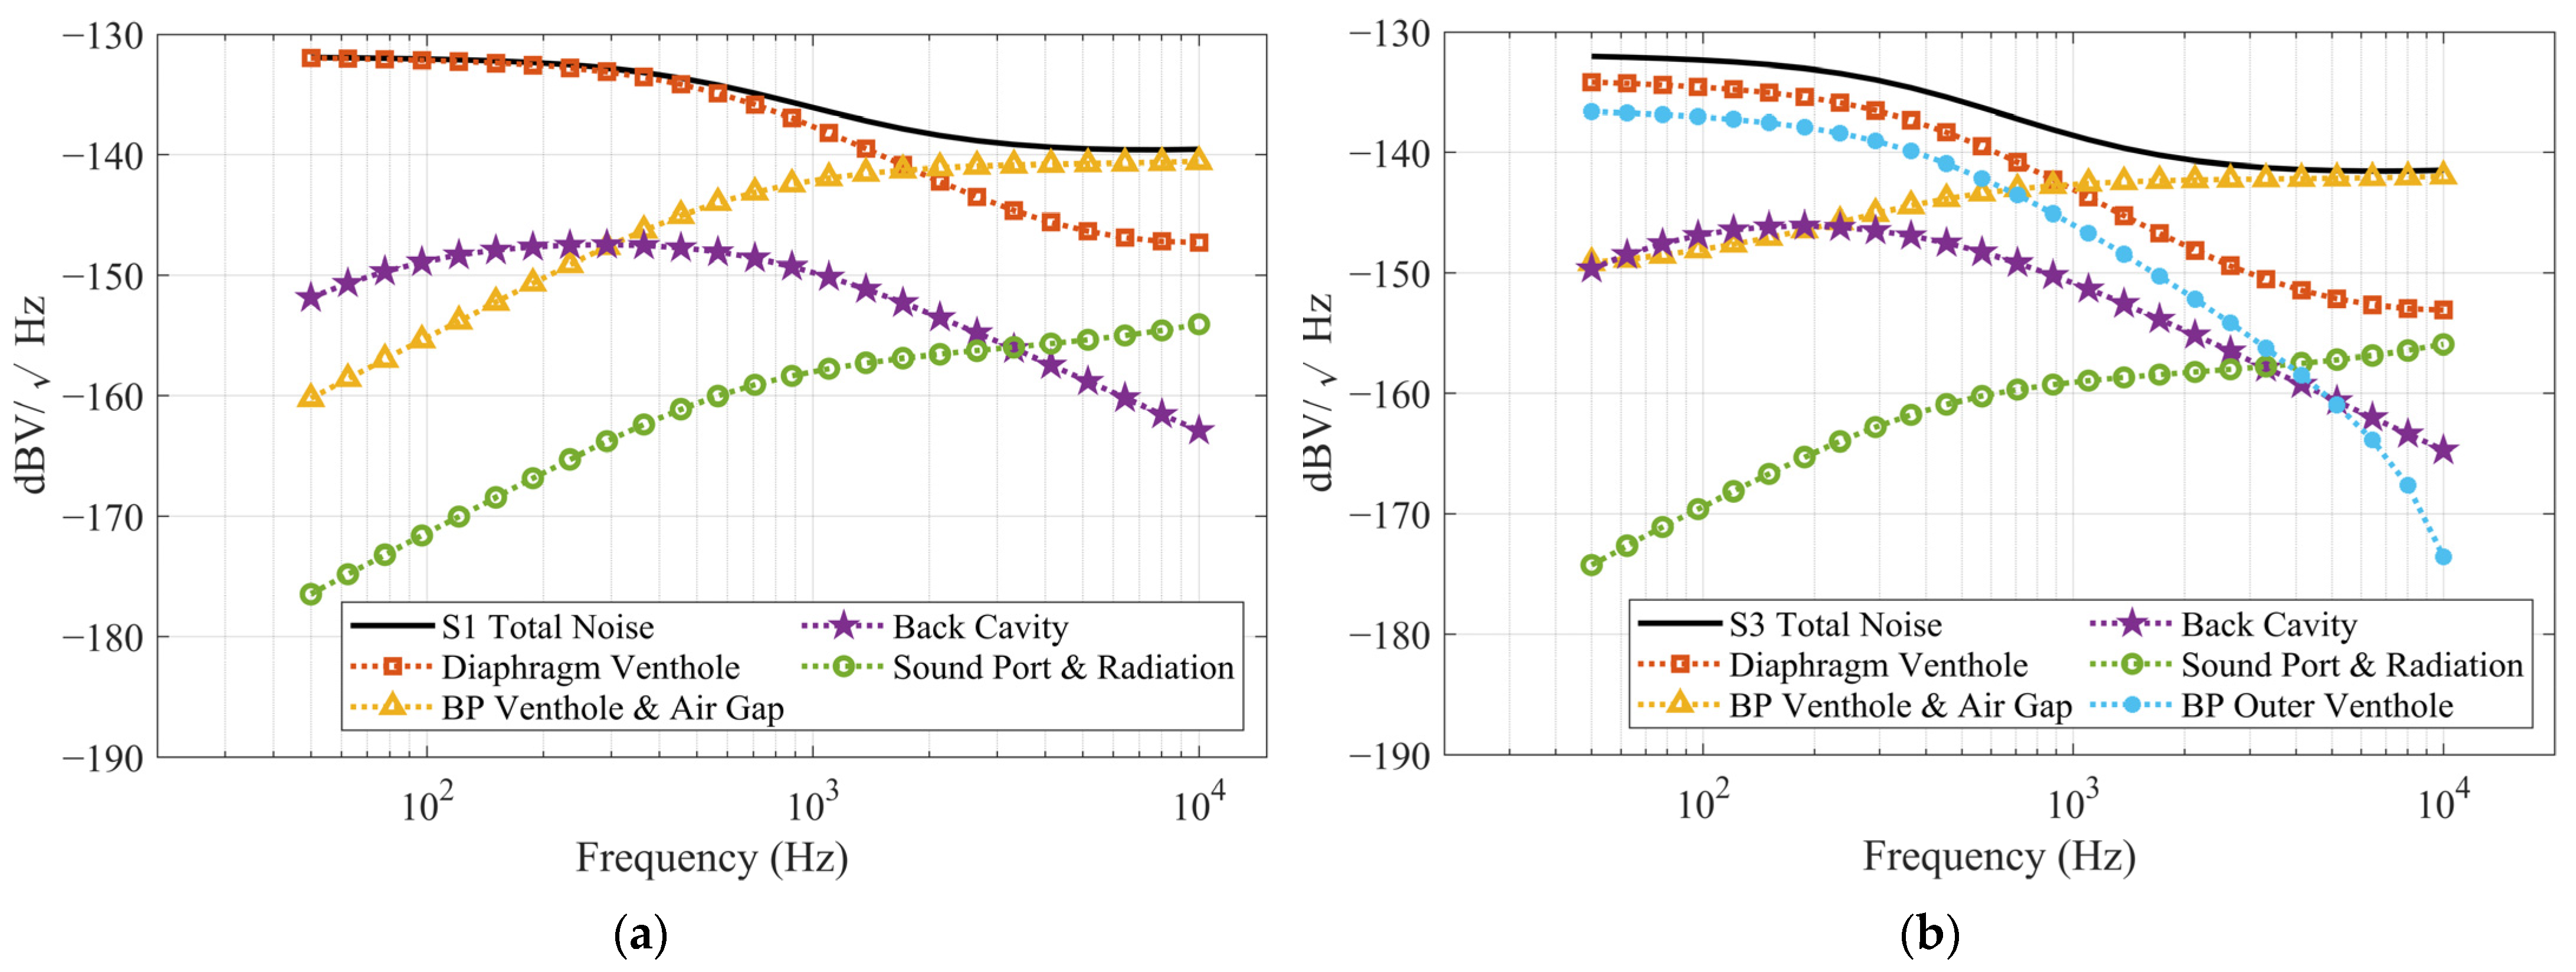
3.2. Thermal Noise
3.3. Lumped Parameters
3.3.1. Acoustic Radiation Impedance
3.3.2. Acoustic Impedance of the Sound Port
3.3.3. Air-Gap and Backplate-Vent-Hole Resistance (Damping)
3.3.4. Acoustic Impedance of the Back Chamber
3.3.5. The Transduction Factor
3.3.6. Damping of the Diaphragm and Outer Vent Holes
3.3.7. Mechanical Properties of Diaphragm
3.3.8. Static Electrical Capacitance Under Bias Voltage
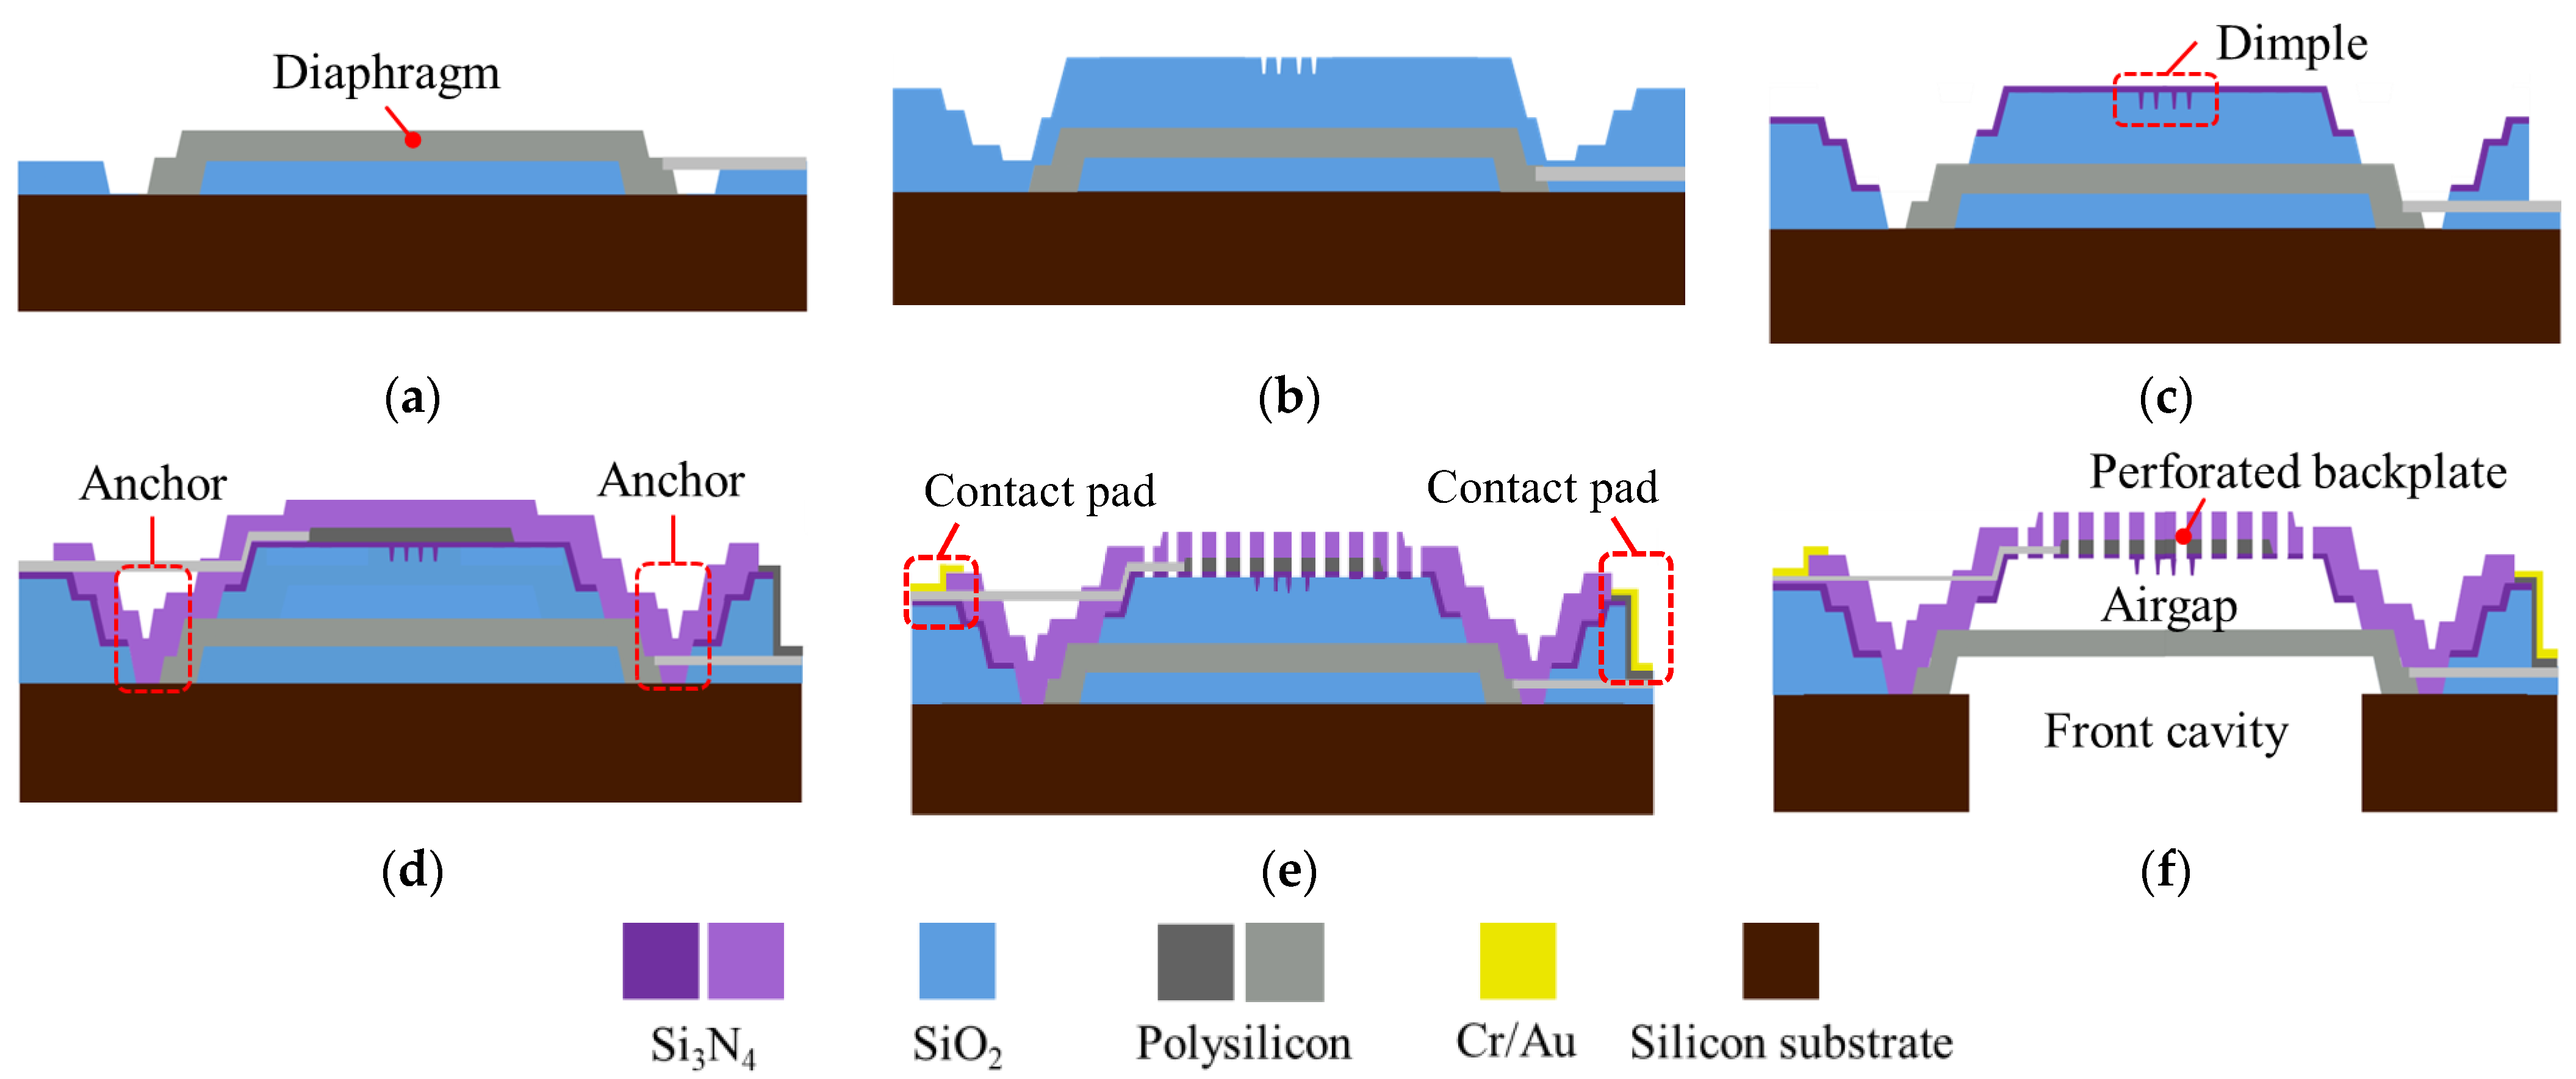
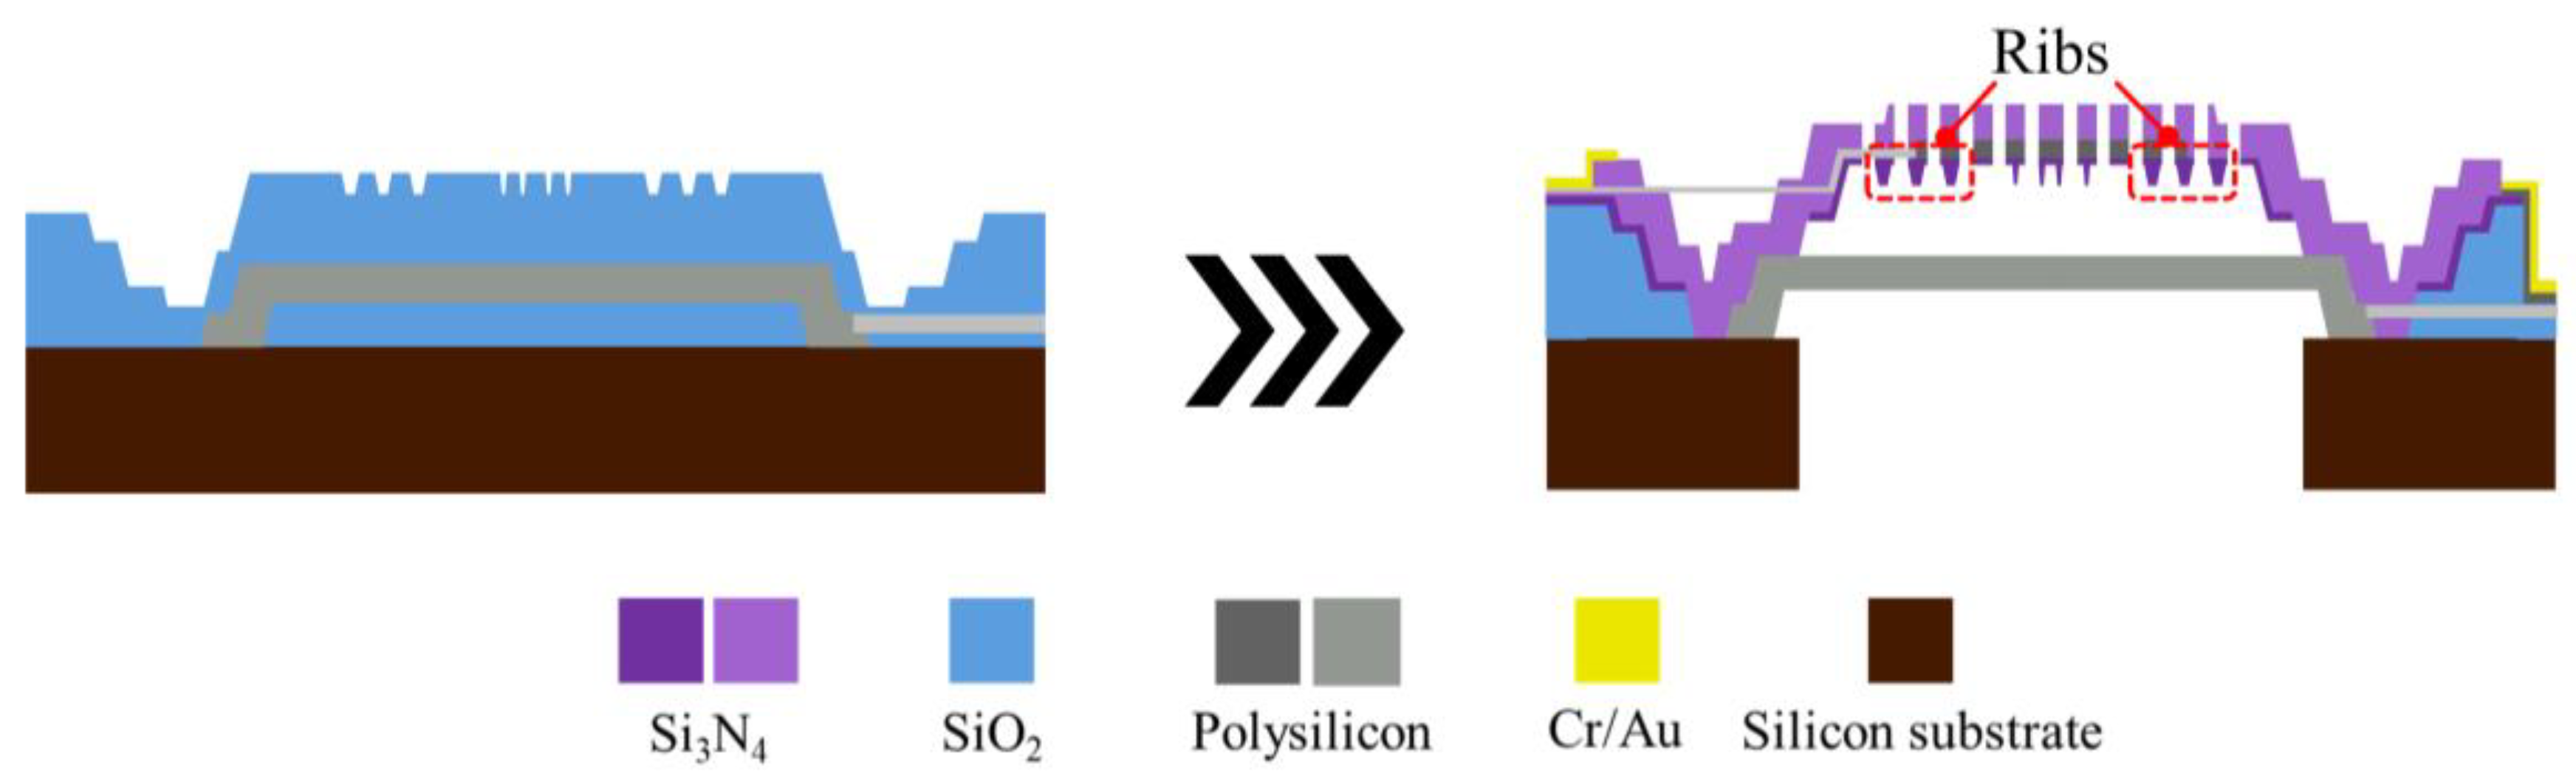
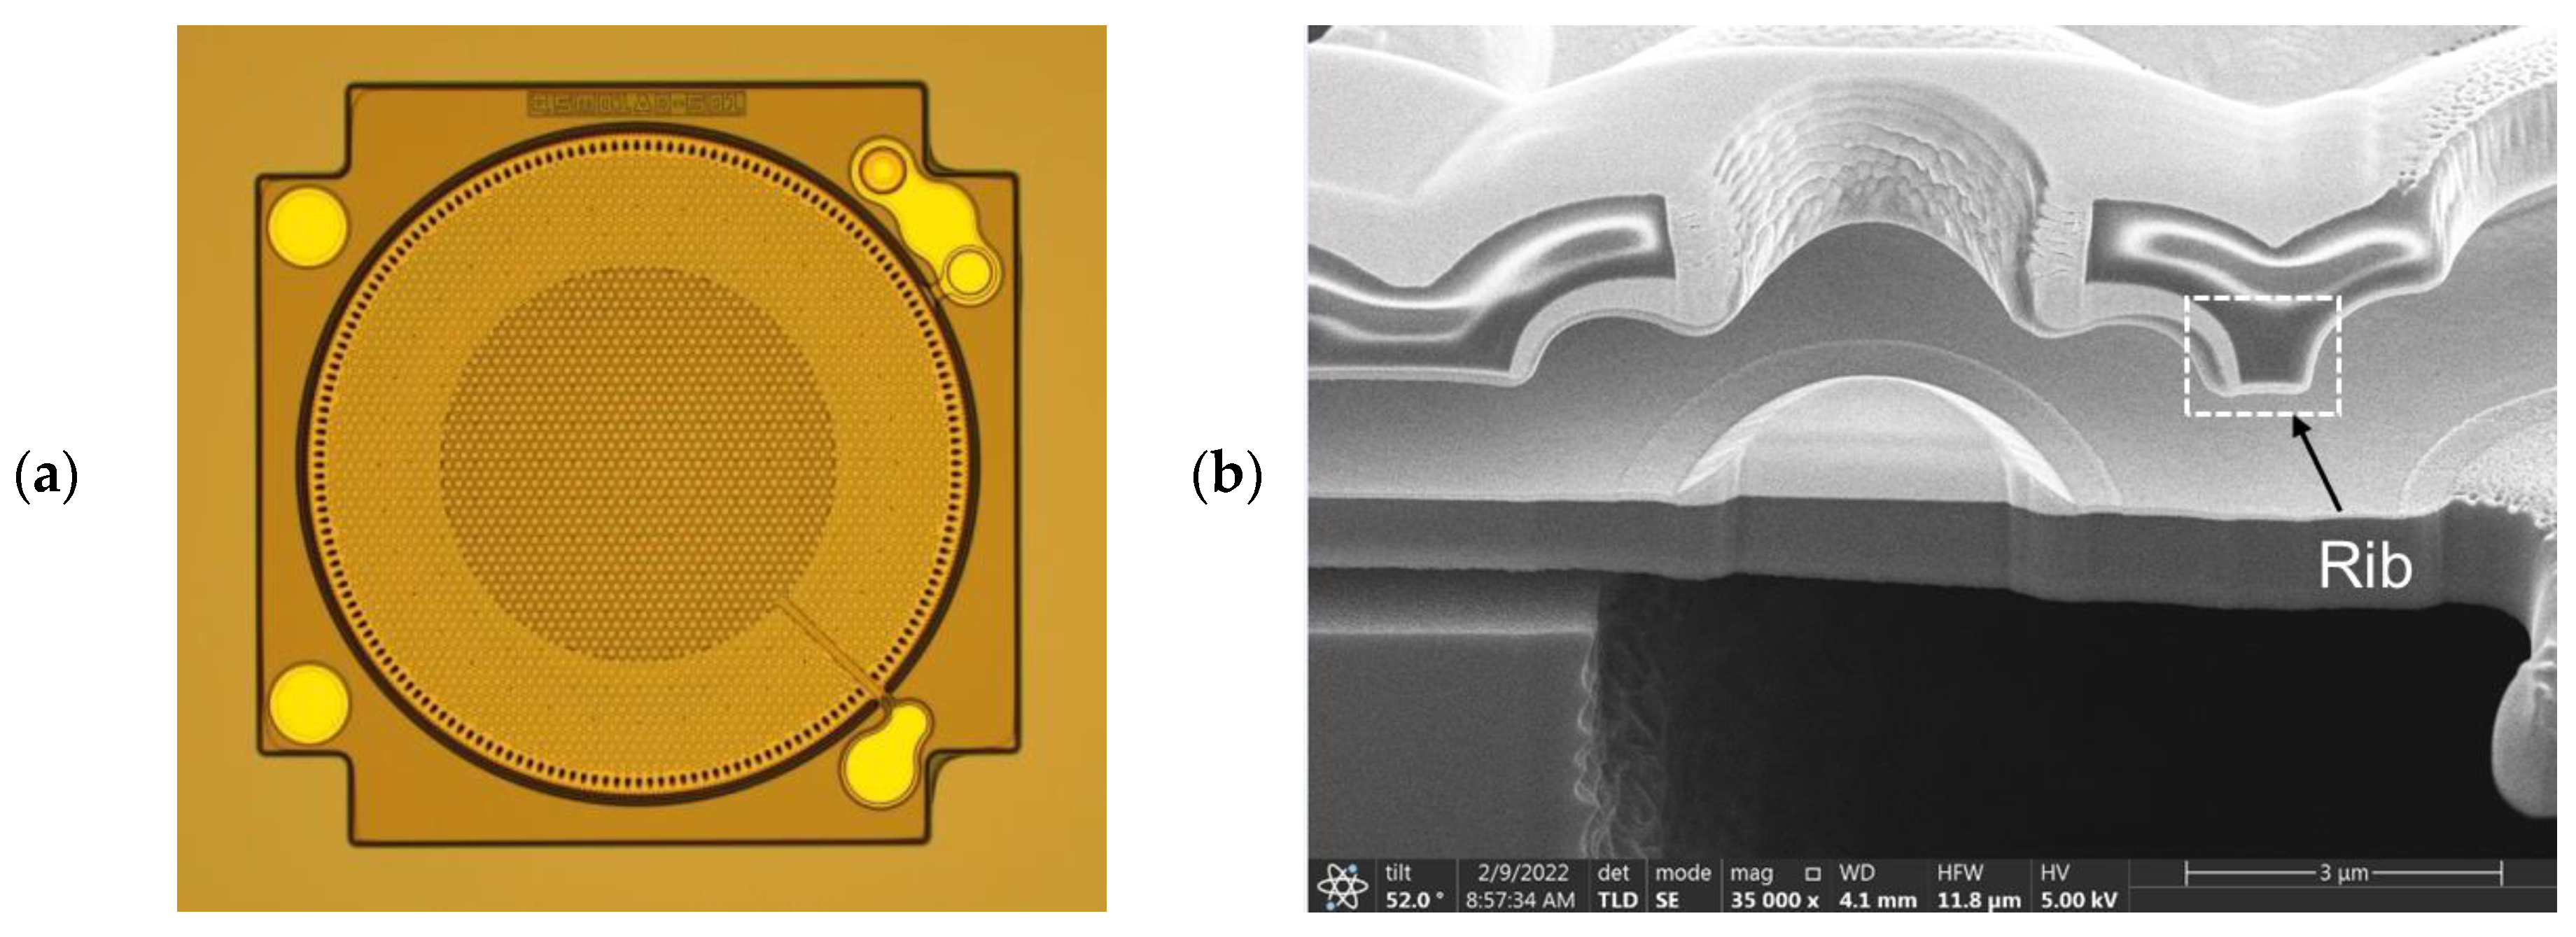
4. Fabrication
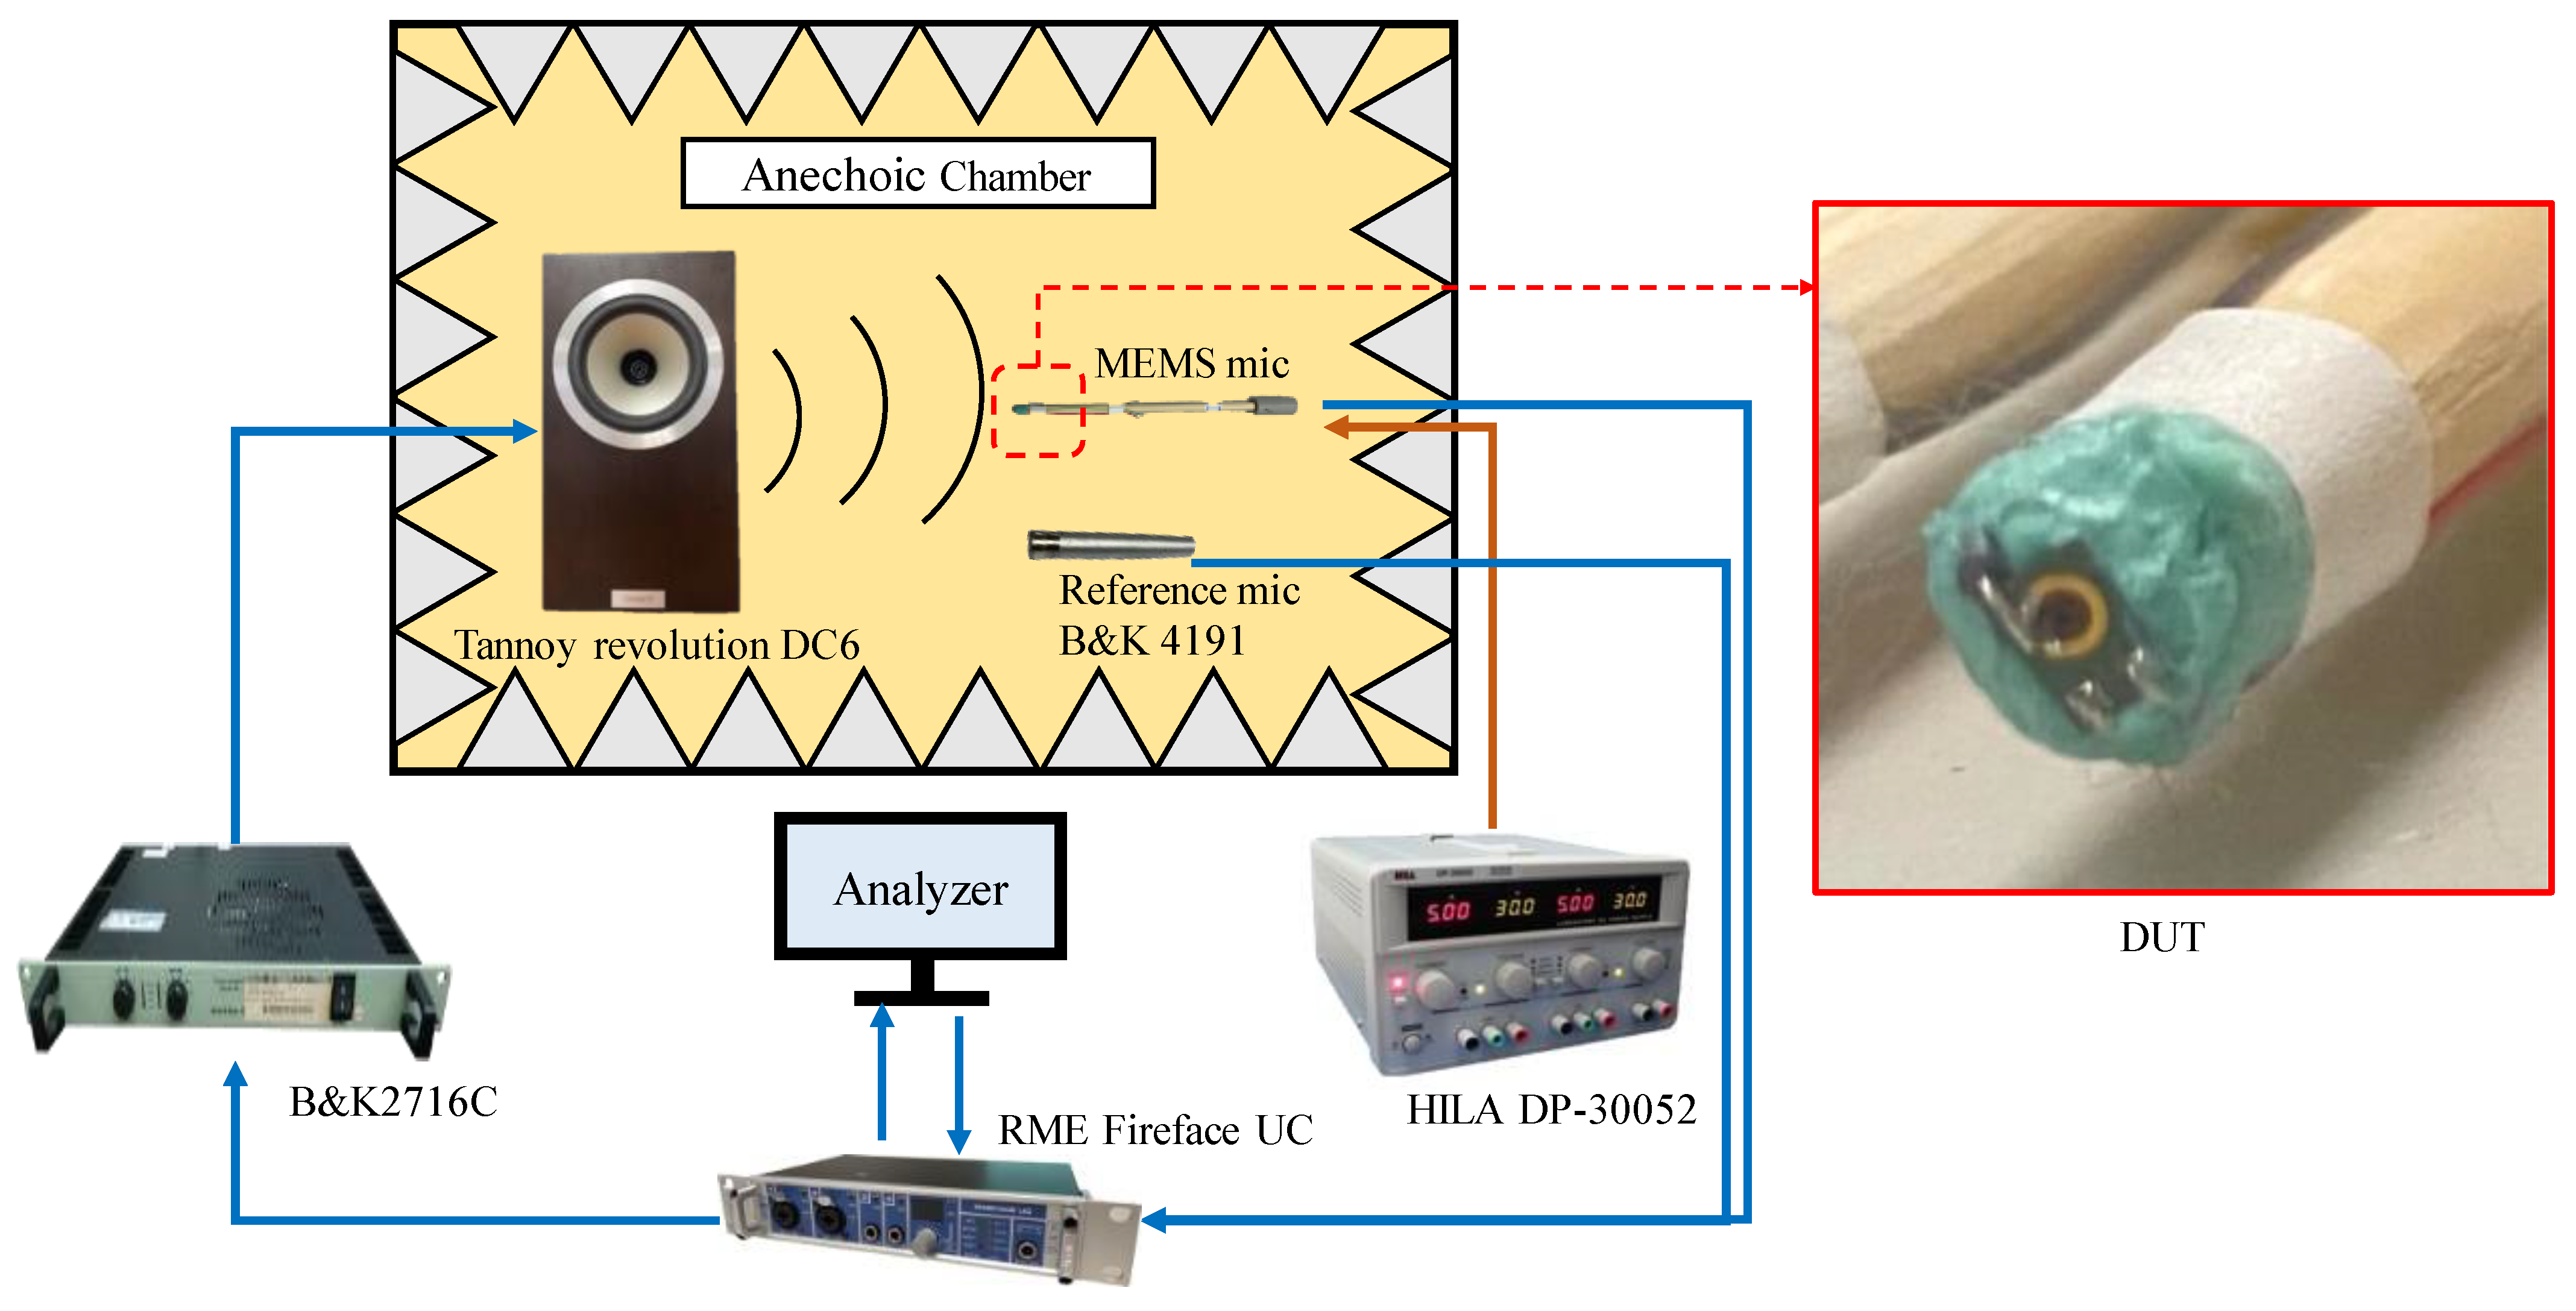
5. Measurement and Simulation
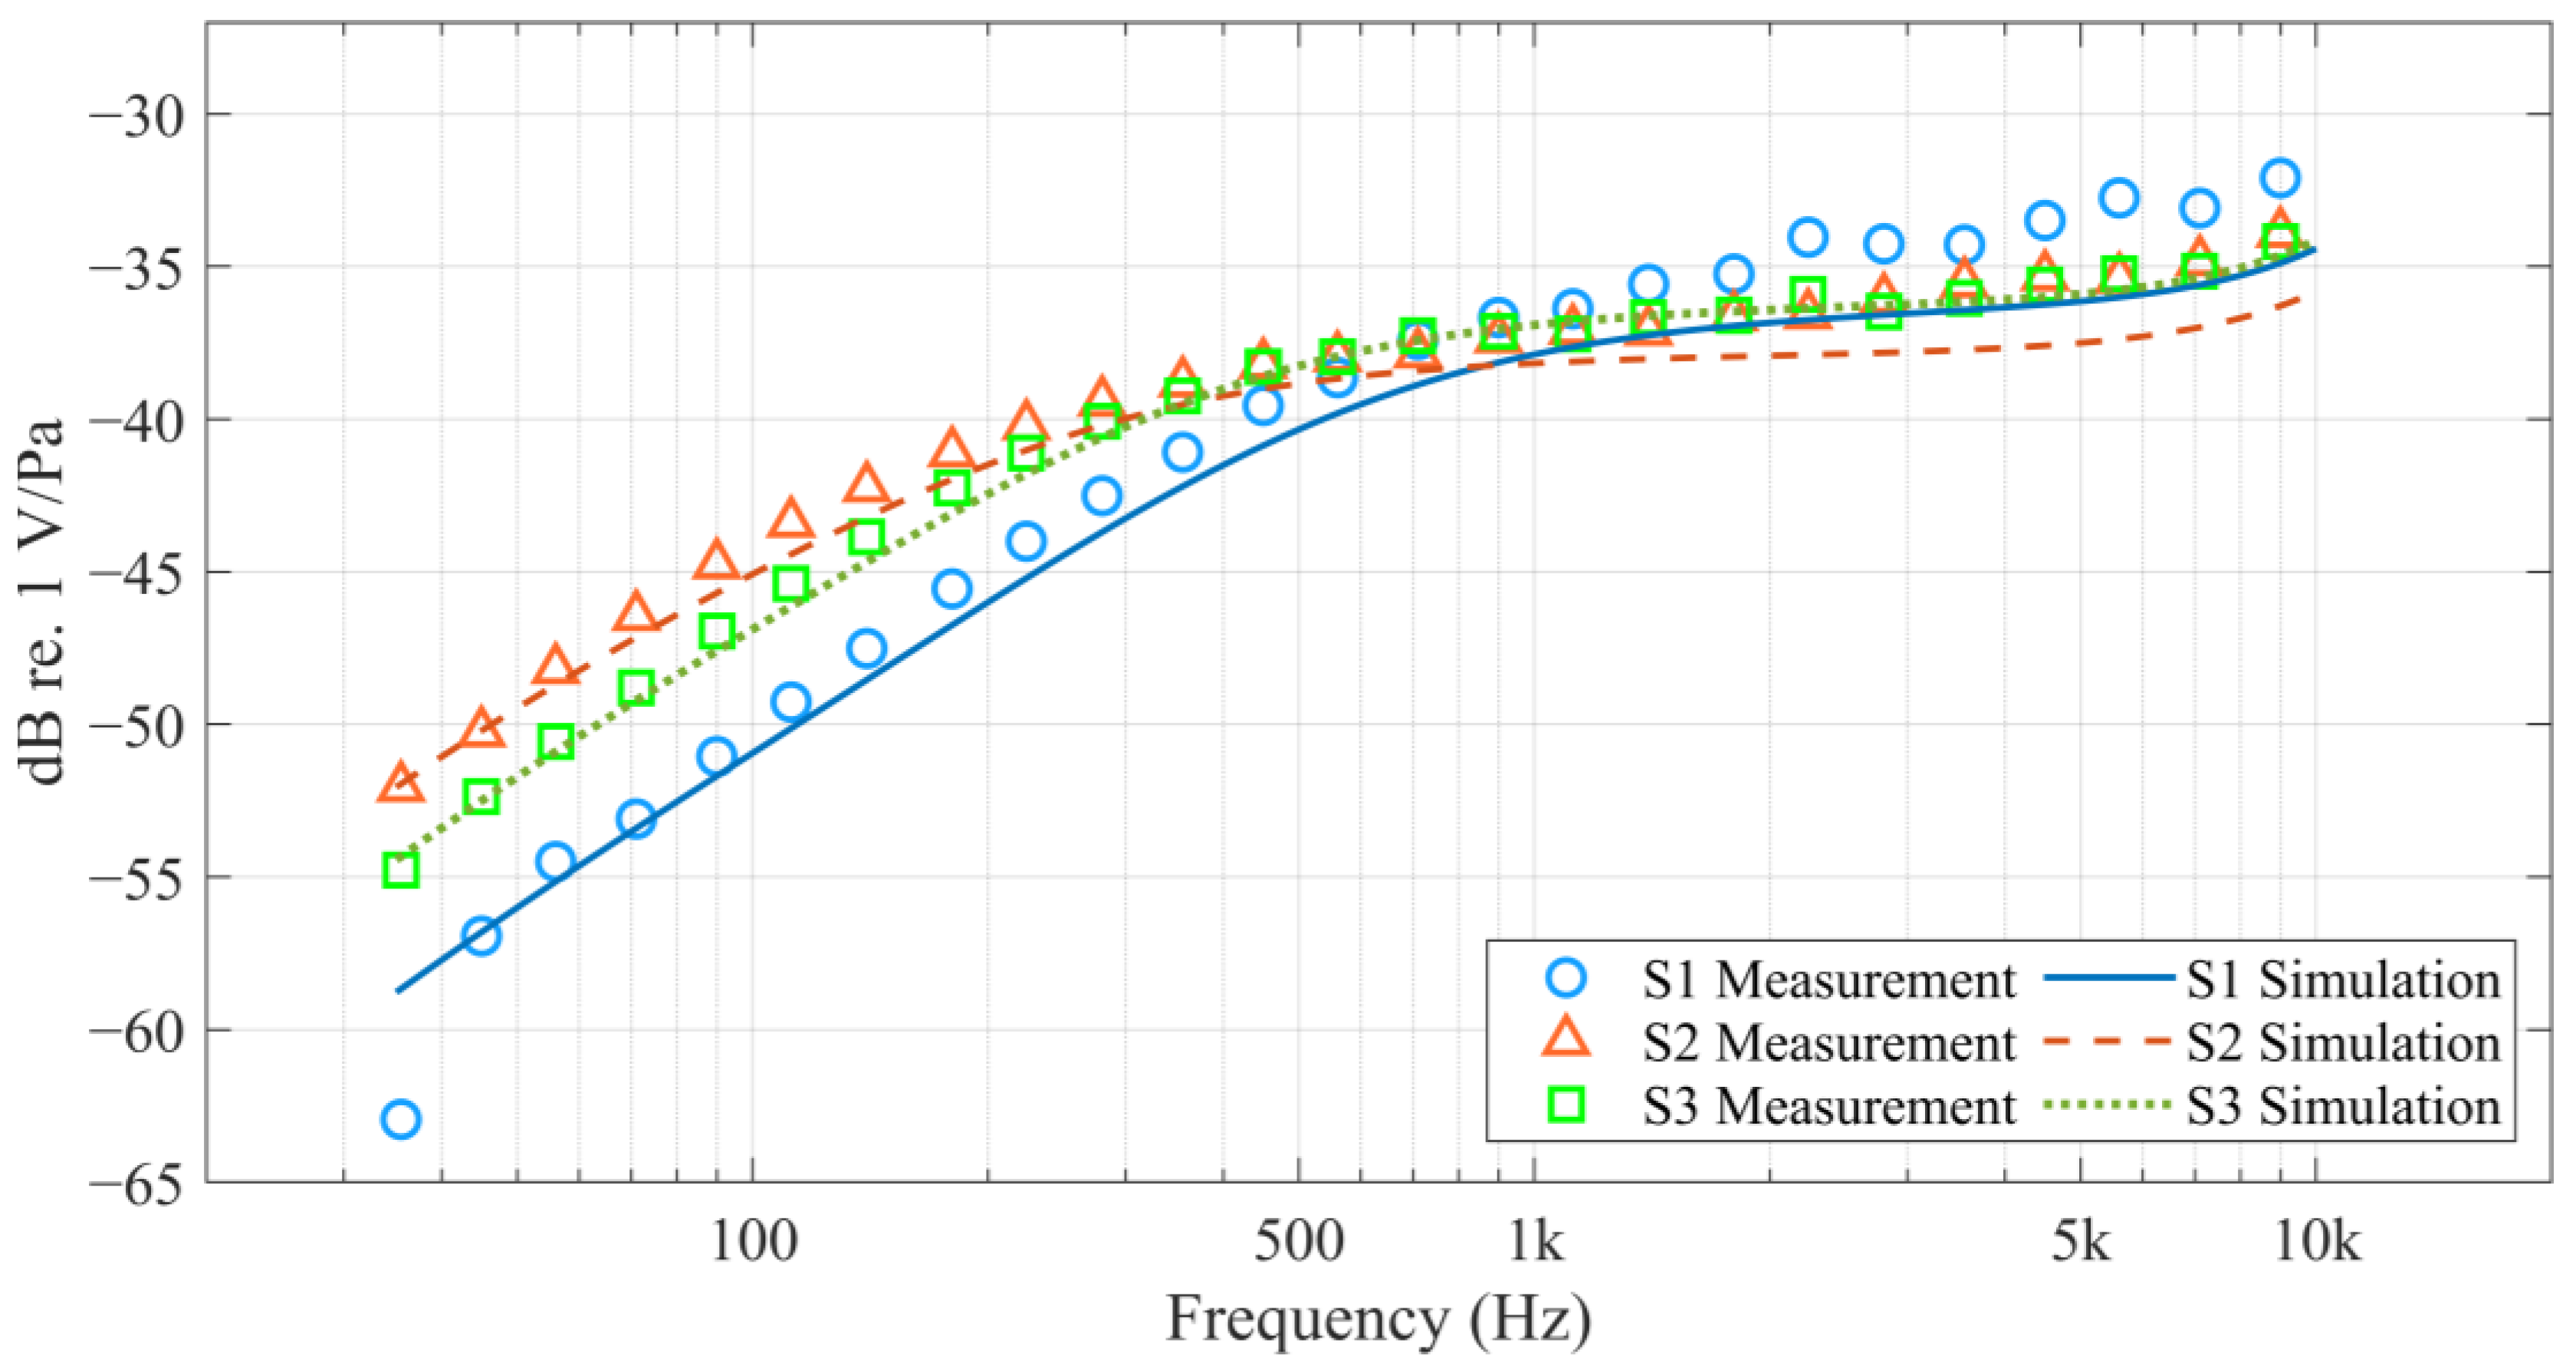
5.1. Frequency Response, SNR, and AOP
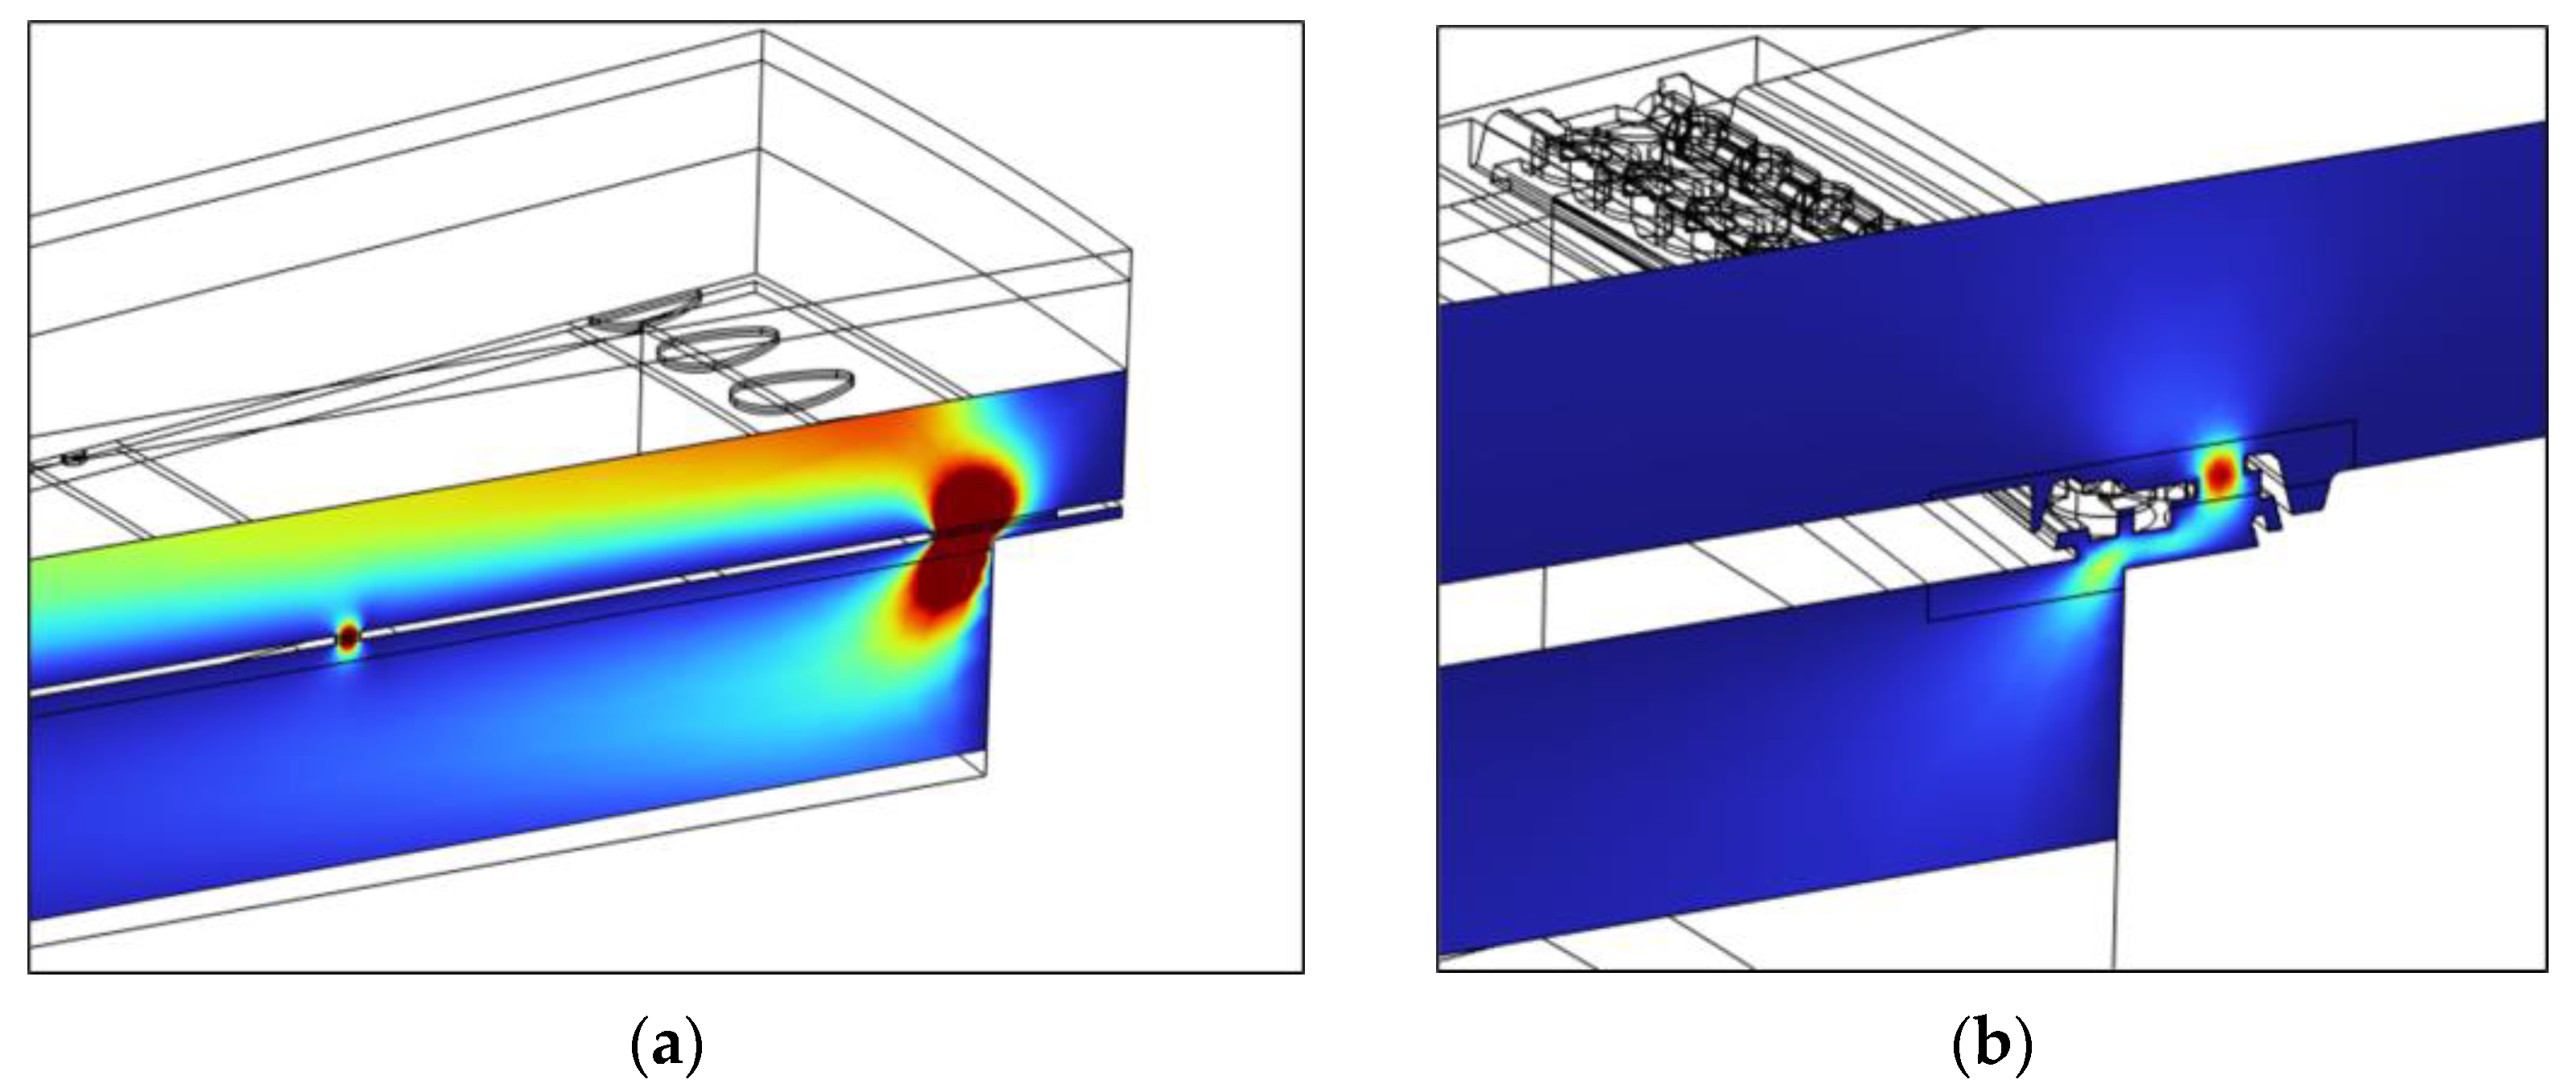
5.2. Compressed Air Test
6. Conclusions
Author Contributions
Funding
Institutional Review Board Statement
Informed Consent Statement
Data Availability Statement
Acknowledgments
Conflicts of Interest
References
- Gemelli, A.; Tambussi, M.; Fusetto, S.; Aprile, A.; Moisello, E.; Bonizzoni, E.; Malcovati, P. Recent Trends in Structures and Interfaces of MEMS Transducers for Audio Applications: A Review. Micromachines 2023, 14, 847. [Google Scholar] [CrossRef] [PubMed]
- Kressmann, R.; Klaiber, M.; Hess, G. Silicon Condenser Microphones with Corrugated Silicon Oxide/Nitride Electret Membranes. Sens. Actuators A Phys. 2002, 100, 301–309. [Google Scholar] [CrossRef]
- Silicon Nitride Corrugated Membrane with High-Width-Aspect-Ratio for MEMS Microphones. Available online: https://www.comsol.com/paper/silicon-nitride-corrugated-membrane-with-high-width-aspect-ratio-for-mems-microphones-93531 (accessed on 27 January 2025).
- Yoo, I.; Sim, J.; Yang, S.; Kim, H. Development of Capacitive MEMS Microphone Based on Slit-Edge for High Signal-to-Noise Ratio. In Proceedings of the 2018 IEEE Micro Electro Mechanical Systems (MEMS), Belfast, UK, 21–25 January 2018. [Google Scholar]
- Chan, C.-K.; Lai, W.-C.; Wu, M.; Wang, M.-Y.; Fang, W. Design and Implementation of a Capacitive-Type Microphone With Rigid Diaphragm and Flexible Spring Using the Two Poly Silicon Micromachining Processes. IEEE Sens. J. 2011, 11, 2365–2371. [Google Scholar] [CrossRef]
- Sedaghat, S.B.; Ganji, B.A. A Novel MEMS Capacitive Microphone Using Spring-Type Diaphragm. Microsyst. Technol. 2019, 25, 217–224. [Google Scholar] [CrossRef]
- Loeppert, P.V.; Lee, S.B. SIS0NIC—THE FIRST COMMERCIALIZED MEMS MICROPHONE. In Proceedings of the 2006 Solid-State, Actuators, and Microsystems Workshop Technical Digest, Head Island, SC, USA, 4–8 June 2006; Transducer Research Foundation, Inc.: Hilton Head, SC, USA, 2006. [Google Scholar]
- Shubham, S.; Seo, Y.; Naderyan, V.; Song, X.; Frank, A.J.; Johnson, J.T.M.G.; da Silva, M.; Pedersen, M. A Novel MEMS Capacitive Microphone with Semiconstrained Diaphragm Supported with Center and Peripheral Backplate Protrusions. Micromachines 2021, 13, 22. [Google Scholar] [CrossRef]
- Martin, D.T.; Liu, J.; Kadirvel, K.; Fox, R.M.; Sheplak, M.; Nishida, T. A Micromachined Dual-Backplate Capacitive Microphone for Aeroacoustic Measurements. J. Microelectromechanical Syst. 2007, 16, 1289–1302. [Google Scholar] [CrossRef]
- Peña-García, N.N.; Aguilera-Cortés, L.A.; González-Palacios, M.A.; Raskin, J.-P.; Herrera-May, A.L. Design and Modeling of a MEMS Dual-Backplate Capacitive Microphone with Spring-Supported Diaphragm for Mobile Device Applications. Sensors 2018, 18, 3545. [Google Scholar] [CrossRef]
- Sant, L.; Füldner, M.; Bach, E.; Conzatti, F.; Caspani, A.; Gaggl, R.; Baschirotto, A.; Wiesbauer, A. A 130dB SPL 72dB SNR MEMS Microphone Using a Sealed-Dual Membrane Transducer and a Power-Scaling Read-Out ASIC. IEEE Sens. J. 2022, 22, 7825–7833. [Google Scholar] [CrossRef]
- Sun, C.; Sang, J.; Duanmu, Z.; Liu, B.; Li, X. Sensitivity Analysis for Dual-Membrane Capacitive MEMS Microphone. IEEE Sens. J. 2024, 24, 24015–24022. [Google Scholar] [CrossRef]
- Kim, B.-H.; Lee, H.-S. Acoustical-Thermal Noise in a Capacitive MEMS Microphone. IEEE Sens. J. 2015, 15, 6853–6860. [Google Scholar] [CrossRef]
- Tadashi, I.; Yuki, U.; Koichi, I.; Yasuhiro, H. Study and Development of Low-Noise MEMS Acoustic Sensors. Available online: https://www.omron.com/global/en/assets/file/technology/omrontechnics/vol50/OMT_Vol50_012.pdf (accessed on 27 January 2025).
- Mao, W.-J.; Cheng, C.-L.; Lo, S.-C.; Chen, Y.-S.; Fang, W. Design and Implementation of a CMOS-MEMS Microphone without the Back-Plate. In Proceedings of the 19th International Conference on Solid-State Sensors, Actuators and Microsystems (TRANSDUCERS), Kaohsiung, Taiwan, 18–22 June 2017. [Google Scholar]
- Jawed, S.A.; Cattin, D.; Massari, N.; Gottardi, M.; Baschirotto, A. A 1.8 V 828 μW 80 dB Digital MEMS Microphone. Analog. Integr. Circ. Sig Process 2011, 67, 395–405. [Google Scholar] [CrossRef]
- Citakovic, J.; Hovesten, P.F.; Rocca, G.; van Halteren, A.; Rombach, P.; Stenberg, L.J.; Andreani, P.; Bruun, E. A Compact CMOS MEMS Microphone with 66dB SNR. In Proceedings of the 2009 IEEE International Solid-State Circuits Conference—Digest of Technical Papers, San Francisco, CA, USA, 08-12 February 2009. [Google Scholar]
- Gaspar, S.; Mucha, I.; Malcovati, P. Comparison of Interface Circuits for Continuous-Time Read-Out from MEMS Microphones. In Proceedings of the 2023 18th Conference on Ph.D Research in Microelectronics and Electronics (PRIME), Valencia, Spain, 18–21 June 2023. [Google Scholar]
- Nikolić, M.; Florian, W.; Gaggl, R.; Liao, L. A 125dBSPL 1%-THD, 115μA MEMS Microphone Using Passive Pre-Distortion Technique. In Proceedings of the ESSCIRC 2023-IEEE 49th European Solid State Circuits Conference (ESSCIRC), Lisbon, Portugal, 11–14 September 2023. [Google Scholar]
- Wang, L.; Zhong, L.; Zhu, Z. A 132 dBSPL 67.34 dB-A SNR Single-Ended MEMS Microphone Using Self-Adaption Loop With 1.5-V Supply Voltage. IEEE Trans. Circuits Syst. I Regul. Pap. 2025, 1–10. [Google Scholar] [CrossRef]
- Winter, M.; Aoun, S.B.; Feiertag, G.; Leidl, A.; Scheele, P.; Seidel, H. A Method for Improving the Drop Test Performance of a MEMS Microphone. In Proceedings of the Smart Sensors, Actuators, and MEMS IV, Dresden, Germany, 18 May 2009. [Google Scholar]
- Meng, J.; Mattila, T.; Dasgupta, A.; Sillanpaa, M.; Jaakkola, R.; Andersson, K.; Hussa, E. Testing and Multi-Scale Modeling of Drop and Impact Loading of Complex MEMS Microphone Assemblies. In Proceedings of the 2012 13th International Thermal, Mechanical and Multi-Physics Simulation and Experiments in Microelectronics and Microsystems, Cascais, Portugal, 16–18 April 2012. [Google Scholar]
- Lall, P.; Abrol, A.; Locker, D. Effects of Sustained Exposure to Temperature and Humidity on the Reliability and Performance of MEMS Microphone. In Proceedings of the ASME InterPACK 2017, San Francisco, CA, USA, 29 August–1 September 2017. [Google Scholar]
- Shubham, S.; Song, X.; Ma, Y.; Da Silva, M.G.; Guo, Z.; Johnson, J.; Pedersen, M. Reliability Analysis Using Advanced Modeling Technique for MEMS Microphone. In Proceedings of the 2021 IEEE International Symposium on the Physical and Failure Analysis of Integrated Circuits (IPFA), Singapore, 15 September–15 October 2021. [Google Scholar]
- Ghisi, A.; Faraci, D.; Adorno, S.; Corigliano, A. The Role of Anchor Imposed Motion in the Failure of MEMS Microphones under Free Fall Tests. Microelectron. Reliab. 2022, 135, 114584. [Google Scholar] [CrossRef]
- Peng, T.-H.; Huang, J. The Effect of Compliant Backplate on Capacitive MEMS Microphones. IEEE Sens. J. 2024, 24, 17803–17811. [Google Scholar] [CrossRef]
- Mohd-Yasin, F.; Nagel, D.J.; Korman, C.E. Noise in MEMS. Meas. Sci. Technol. 2009, 21, 012001. [Google Scholar] [CrossRef]
- Beranek, L.L.; Mellow, T. Acoustics: Sound Fields and Transducers; Academic Press: Waltham, MA, USA, 2012; pp. 170–174. [Google Scholar]
- Maa, D.-Y. Potential of Microperforated Panel Absorber. J. Acoust. Soc. Am. 1998, 104, 2861–2866. [Google Scholar] [CrossRef]
- Kaczynski, J.; Ranacher, C.; Fleury, C. Computationally Efficient Model for Viscous Damping in Perforated MEMS Structures. Sens. Actuators A Phys. 2020, 314, 112201. [Google Scholar] [CrossRef]
- Skvor, Z. On the Acoustical Resistance Due to Viscous Losses in the Air Gap of Electrotastic Transducers: Acustica, Vol 19, No 5 (1967/68) Pp 295–299. Ultrasonics 1969, 7, 83. [Google Scholar] [CrossRef]
- Kuntzman, M.L.; LoPresti, J.L.; Du, Y.; Conklin, W.F.; Naderyan, V.; Lee, S.B.; Schafer, D.; Pedersen, M.; Loeppert, P.V. Thermal Boundary Layer Limitations on the Performance of Micromachined Microphones. J. Acoust. Soc. Am. 2018, 144, 2838–2846. [Google Scholar] [CrossRef]
- Her, H.-C.; Wu, T.-L.; Huang, J.H. Acoustic Analysis and Fabrication of Microelectromechanical System Capacitive Microphones. J. Appl. Phys. 2008, 104, 084509. [Google Scholar] [CrossRef]
- Dehe, A.; Wurzer, M.; Füldner, M.; Krumbein, U. The Infineon Silicon MEMS Microphone. In Proceedings of the SENSOR 2013, Nürnberg, German, 14–16 May 2013. [Google Scholar]
- Goertek, S15OB381-124 datasheet. Available online: https://mm.digikey.com/Volume0/opasdata/d220001/medias/docus/5342/S15OB381-124.pdf (accessed on 27 January 2025).
- TDK, MMICT4076-00-908 datasheet. Available online: https://product.tdk.com/system/files/dam/doc/product/sw_piezo/mic/mems-mic/catalog/mems_microphone_commercial_mmic_en.pdf (accessed on 27 January 2025).
- Knowles, SPV61A0LR5H-1 datasheet. Available online: https://mm.digikey.com/Volume0/opasdata/d220001/medias/docus/4808/SPV61A0LR5H-1.pdf (accessed on 27 January 2025).
- Knowles, SPV0142LR5H-1 datasheet. Available online: https://mm.digikey.com/Volume0/opasdata/d220001/medias/docus/5337/SPV0142LR5H-1_DS.pdf (accessed on 27 January 2025).
- Edwards, R.L.; Coles, G.; Sharpe, W.N. Comparison of Tensile and Bulge Tests for Thin-Film Silicon Nitride. Exp. Mech. 2004, 44, 49–54. [Google Scholar] [CrossRef]


| Material | Young’s Modulus | Poisson’s Ratio | Density | Internal Stress |
|---|---|---|---|---|
| Monocrystalline silicon | 170 | 0.28 | 2329 | 0 |
| Polycrystalline Silicon | 160 | 0.22 | 2320 | 30 |
| Si3N4 | 250 | 0.23 | 3100 | 280 |
| SiO2 | 70 | 0.17 | 2200 | −200 |
| Parameters | Description | Unit | S1 | S2 | S3 |
|---|---|---|---|---|---|
| Acoustic radiation mass | |||||
| Acoustic radiation resistance | |||||
| Acoustic mass of sound port (1 kHz) | |||||
| Acoustic resistance of sound port (1 kHz) | |||||
| Acoustic resistance of vent holes on DP * (1 kHz) | |||||
| Acoustic resistance of air gap and vent holes on BP ** (1 kHz) | |||||
| Acoustic resistance of outer vent holes of BP ** (1 kHz) | -- | -- | |||
| Acoustic compliance of front chamber | |||||
| Acoustic compliance of back chamber | |||||
| Effective mass of DP * | |||||
| Effective compliance of DP * | |||||
| Effective area | |||||
| Static capacitance | |||||
| Bias voltage | 16 | 12.5 | 11 | ||
| Transduction factor |
| S1 | S2 | S3 | |
| Experiment | |||
| Sensitivity @ 1 kHz (dBV/Pa) | −36.45 | −37.23 | −37.06 |
| (Hz) | 450 | 224 | 280 |
| SNR 1 (dBA) | 53.09 | 60.77 | 60.95 |
| AOP (dBSPL) | 127.94 | 124.96 | 124.43 |
| Simulation | |||
| Sensitivity @ 1 kHz (dBV/Pa) | −37.88 | −38.17 | −36.92 |
| (Hz) | 447 | 215 | 322 |
| SNR 1,2 (dBA) | 58.94 | 62.26 | 64.00 |
| S1 | S2 | S3 | |
| White Light Interferometry (WLI) | |||
| Diaphragm (μm) | 0.11 | −0.1 | −0.96 |
| Backplate (μm) | −0.256 | −0.81 | −1.475 |
| Air Gap * (μm) | 2.434 | 2.09 | 2.285 |
| FEA, COMSOL Multiphysics 6.3 | |||
| Diaphragm (μm) | −0.034 | −0.029 | −0.550 |
| Backplate (μm) | −0.528 | −0.931 | −1.348 |
| Air Gap * (μm) | 2.306 | 1.898 | 2.002 |
| Manufacturer (Model) | Microphone Type | LCF | Sensitivity | SNR | AOP (dBSPL) |
|---|---|---|---|---|---|
| Goertek [35] (S15OB381-124) | Bottom port | 12 | −38 | 62.5 | 128 |
| TDK InvenSense [36] (MMICT4076-00-908) | Bottom port | 85 | −38 | 63 | 127 |
| Knowles [37] (SPV61A0LR5H-1) | Bottom port | 35 | −40 | 66 | 133 |
| Knowles [38] (SPV0142LR5H-1) | Bottom port | 85 | −38 | 62.5 | 124 |
| This work (S3) | Bottom port | 280 | −37.06 | 60.95 | 124.43 |
| S1 | S2 | S3 | |
|---|---|---|---|
| Simulation: Max. von Mises stress (GPa) 1 | 6.26 | 3.68 | 3.34 |
| Experiment: Pass rate of CAT 2 | 38% | 100% | 100% |
Disclaimer/Publisher’s Note: The statements, opinions and data contained in all publications are solely those of the individual author(s) and contributor(s) and not of MDPI and/or the editor(s). MDPI and/or the editor(s) disclaim responsibility for any injury to people or property resulting from any ideas, methods, instructions or products referred to in the content. |
© 2025 by the authors. Licensee MDPI, Basel, Switzerland. This article is an open access article distributed under the terms and conditions of the Creative Commons Attribution (CC BY) license (https://creativecommons.org/licenses/by/4.0/).
Share and Cite
Peng, T.-H.; Hsu, H.-J.; Huang, J.H. Analysis of Structural Design Variations in MEMS Capacitive Microphones. Sensors 2025, 25, 900. https://doi.org/10.3390/s25030900
Peng T-H, Hsu H-J, Huang JH. Analysis of Structural Design Variations in MEMS Capacitive Microphones. Sensors. 2025; 25(3):900. https://doi.org/10.3390/s25030900
Chicago/Turabian StylePeng, Tzu-Huan, Huei-Ju Hsu, and Jin H. Huang. 2025. "Analysis of Structural Design Variations in MEMS Capacitive Microphones" Sensors 25, no. 3: 900. https://doi.org/10.3390/s25030900
APA StylePeng, T.-H., Hsu, H.-J., & Huang, J. H. (2025). Analysis of Structural Design Variations in MEMS Capacitive Microphones. Sensors, 25(3), 900. https://doi.org/10.3390/s25030900