Vibration Analysis of Aviation Electric Propulsion Test Stand with Active Main Rotor
Abstract
1. Introduction
2. Research Object
2.1. Test Stand
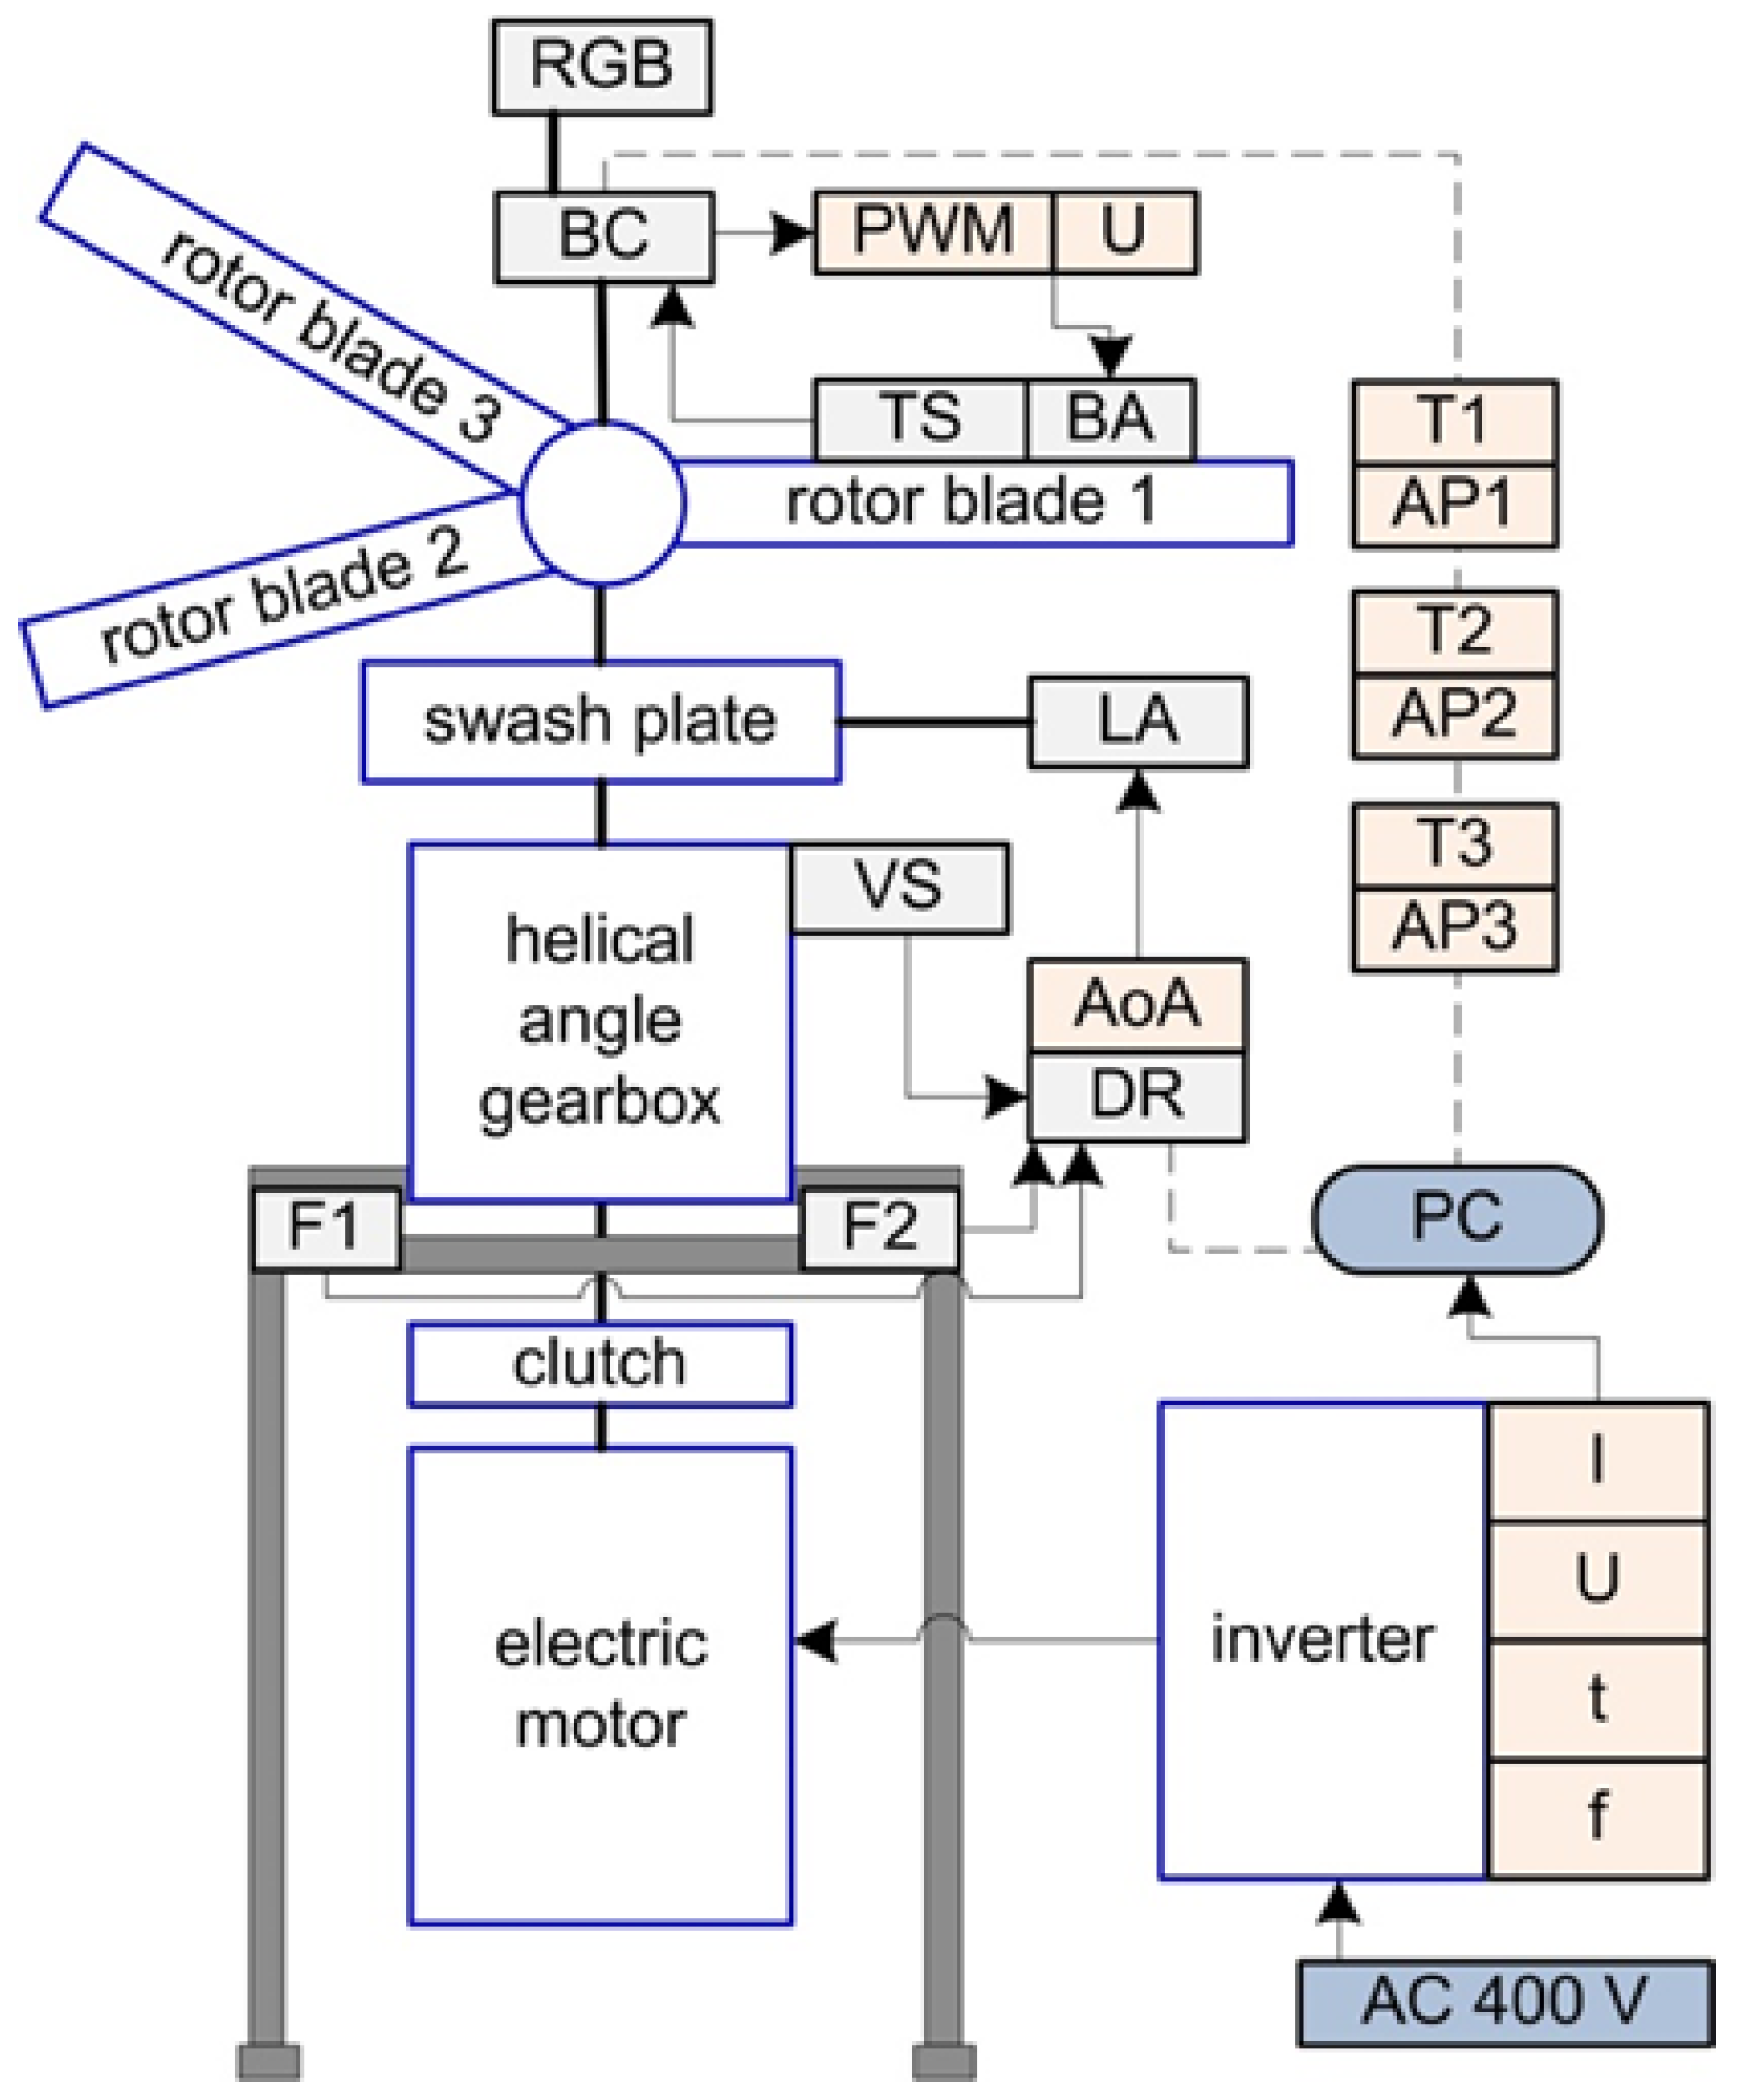
2.2. Measuring System
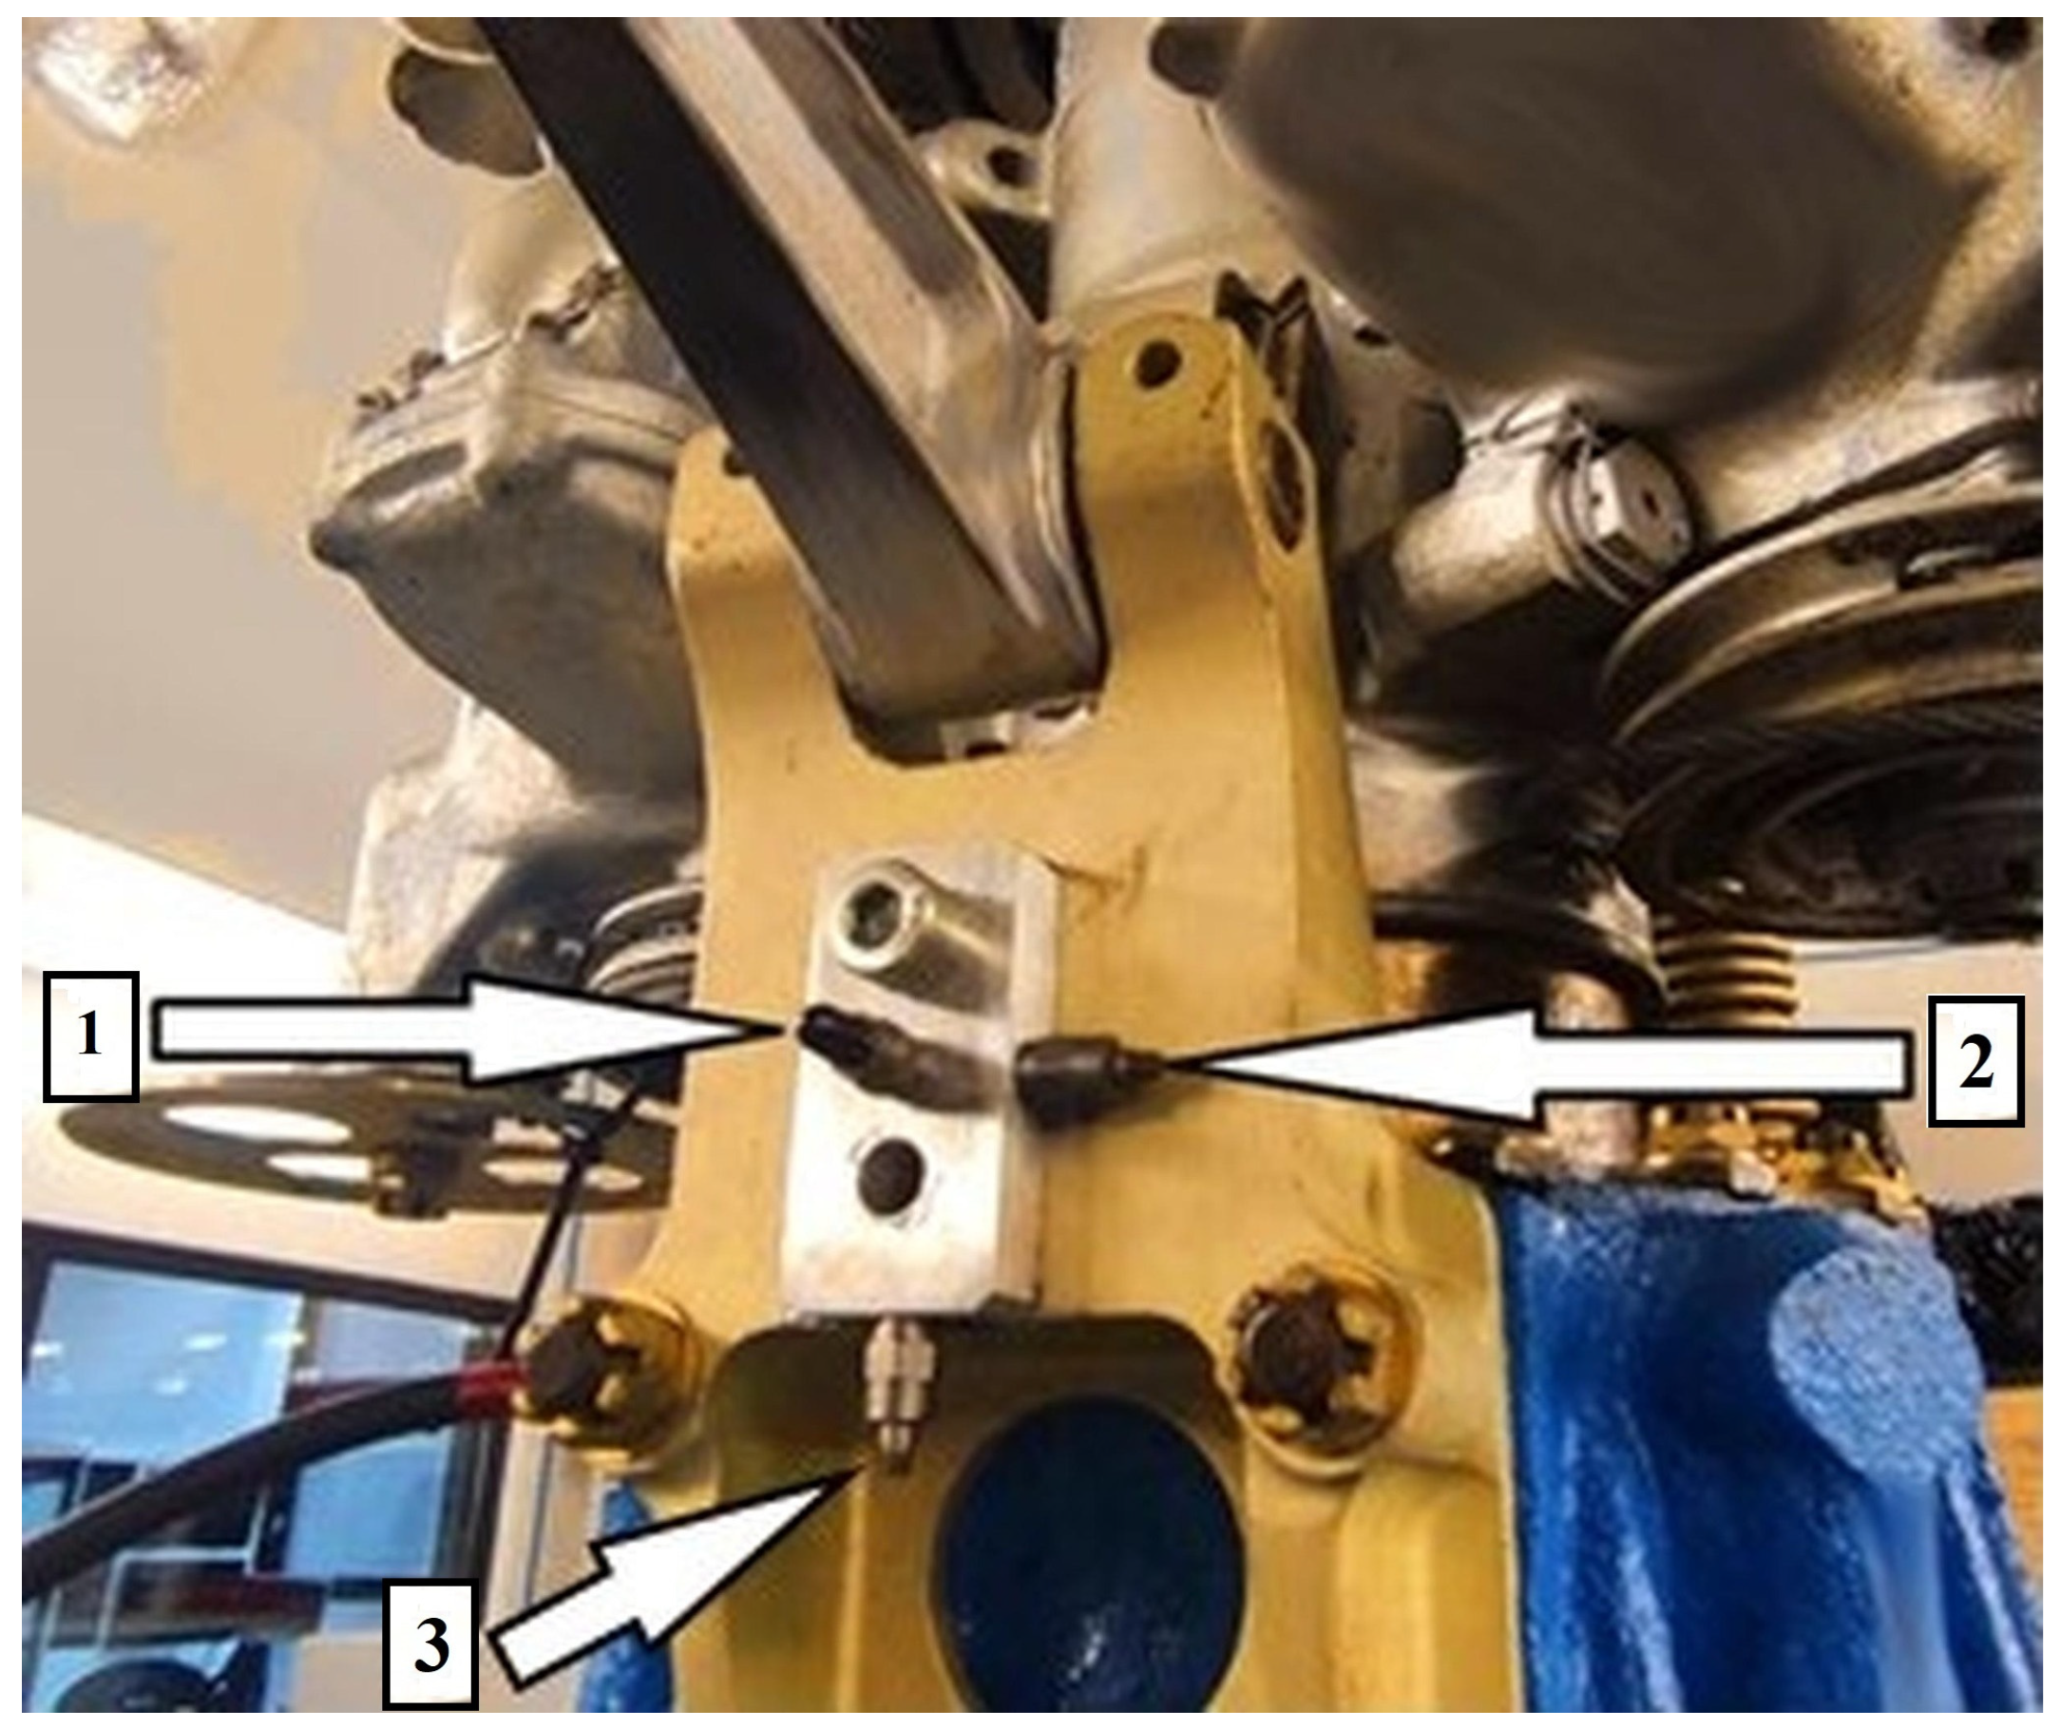
- A set of three piezoelectric vibration sensors M353B12 (PCB Piezotronics, Depew, NY, USA), showed in Figure 3, was used to record vibrations along all axes. The transverse sensitivity and nonlinearity of these sensors ensure accurate acquisition of dynamic responses across the frequency bands relevant to rotorcraft test stands.
- Signal conditioning was performed using the VibAMPPA-3000 (EC Electronics Ltd., Basingstoke, United Kingdom) charge amplifier, which provided charge-to-voltage conversion, impedance matching, and preliminary low-pass filtering appropriate for ICP piezoelectric sensor signals.
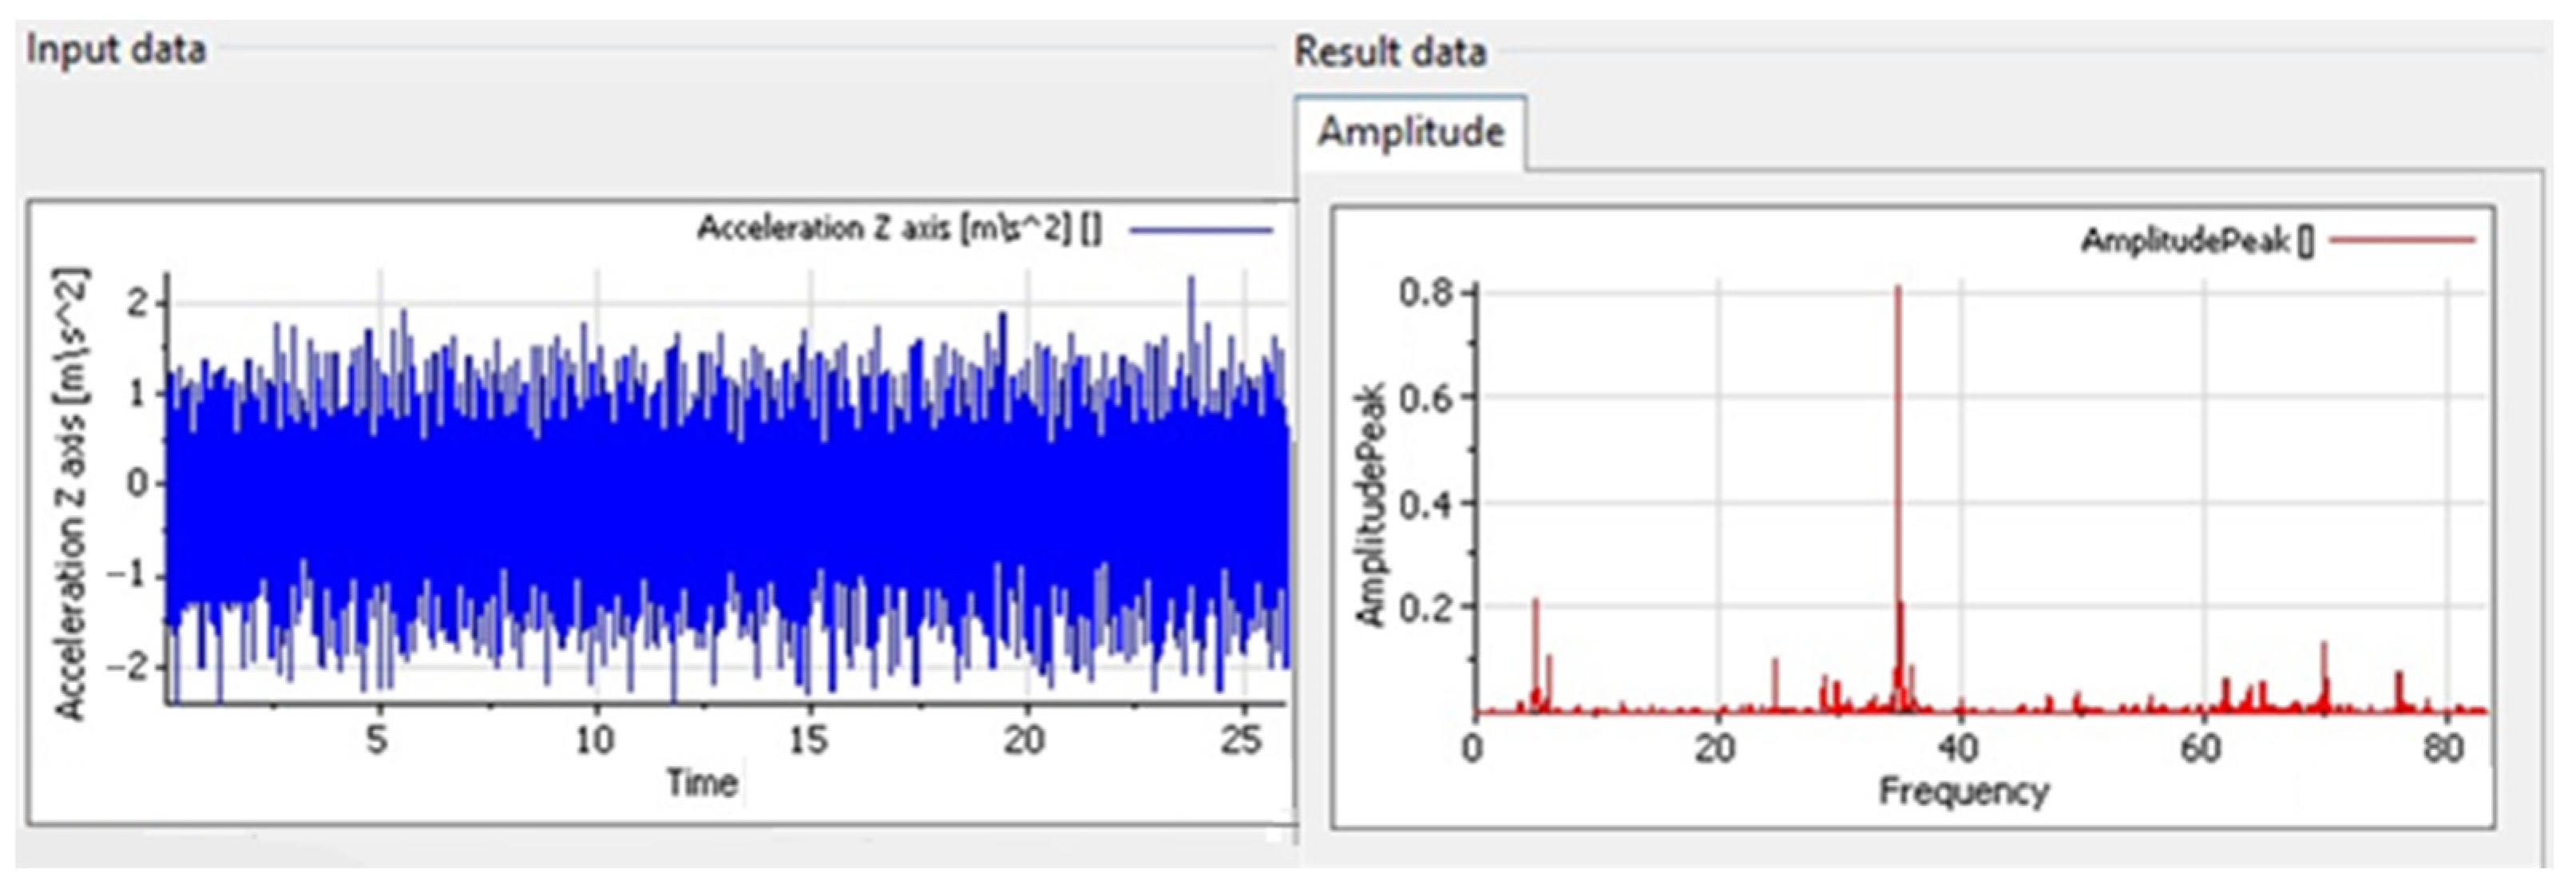
- Signal acquisition was performed using the NI-9215 C-Series (National Instruments, Austin, TX, USA) analog input module (Figure 4), equipped with four simultaneously sampled differential input channels.
3. Test Results
3.1. FFT Analysis
3.1.1. Measurement Setup and Preprocessing
3.1.2. Results at Lowest Rotor Velocity
3.1.3. Results at Medium Rotor Velocity
3.1.4. Results at Highest Rotor Velocity
3.1.5. Summary
3.2. PSD Analysis
3.2.1. Investigation Procedures
3.2.2. Results at Lowest Rotor Velocity
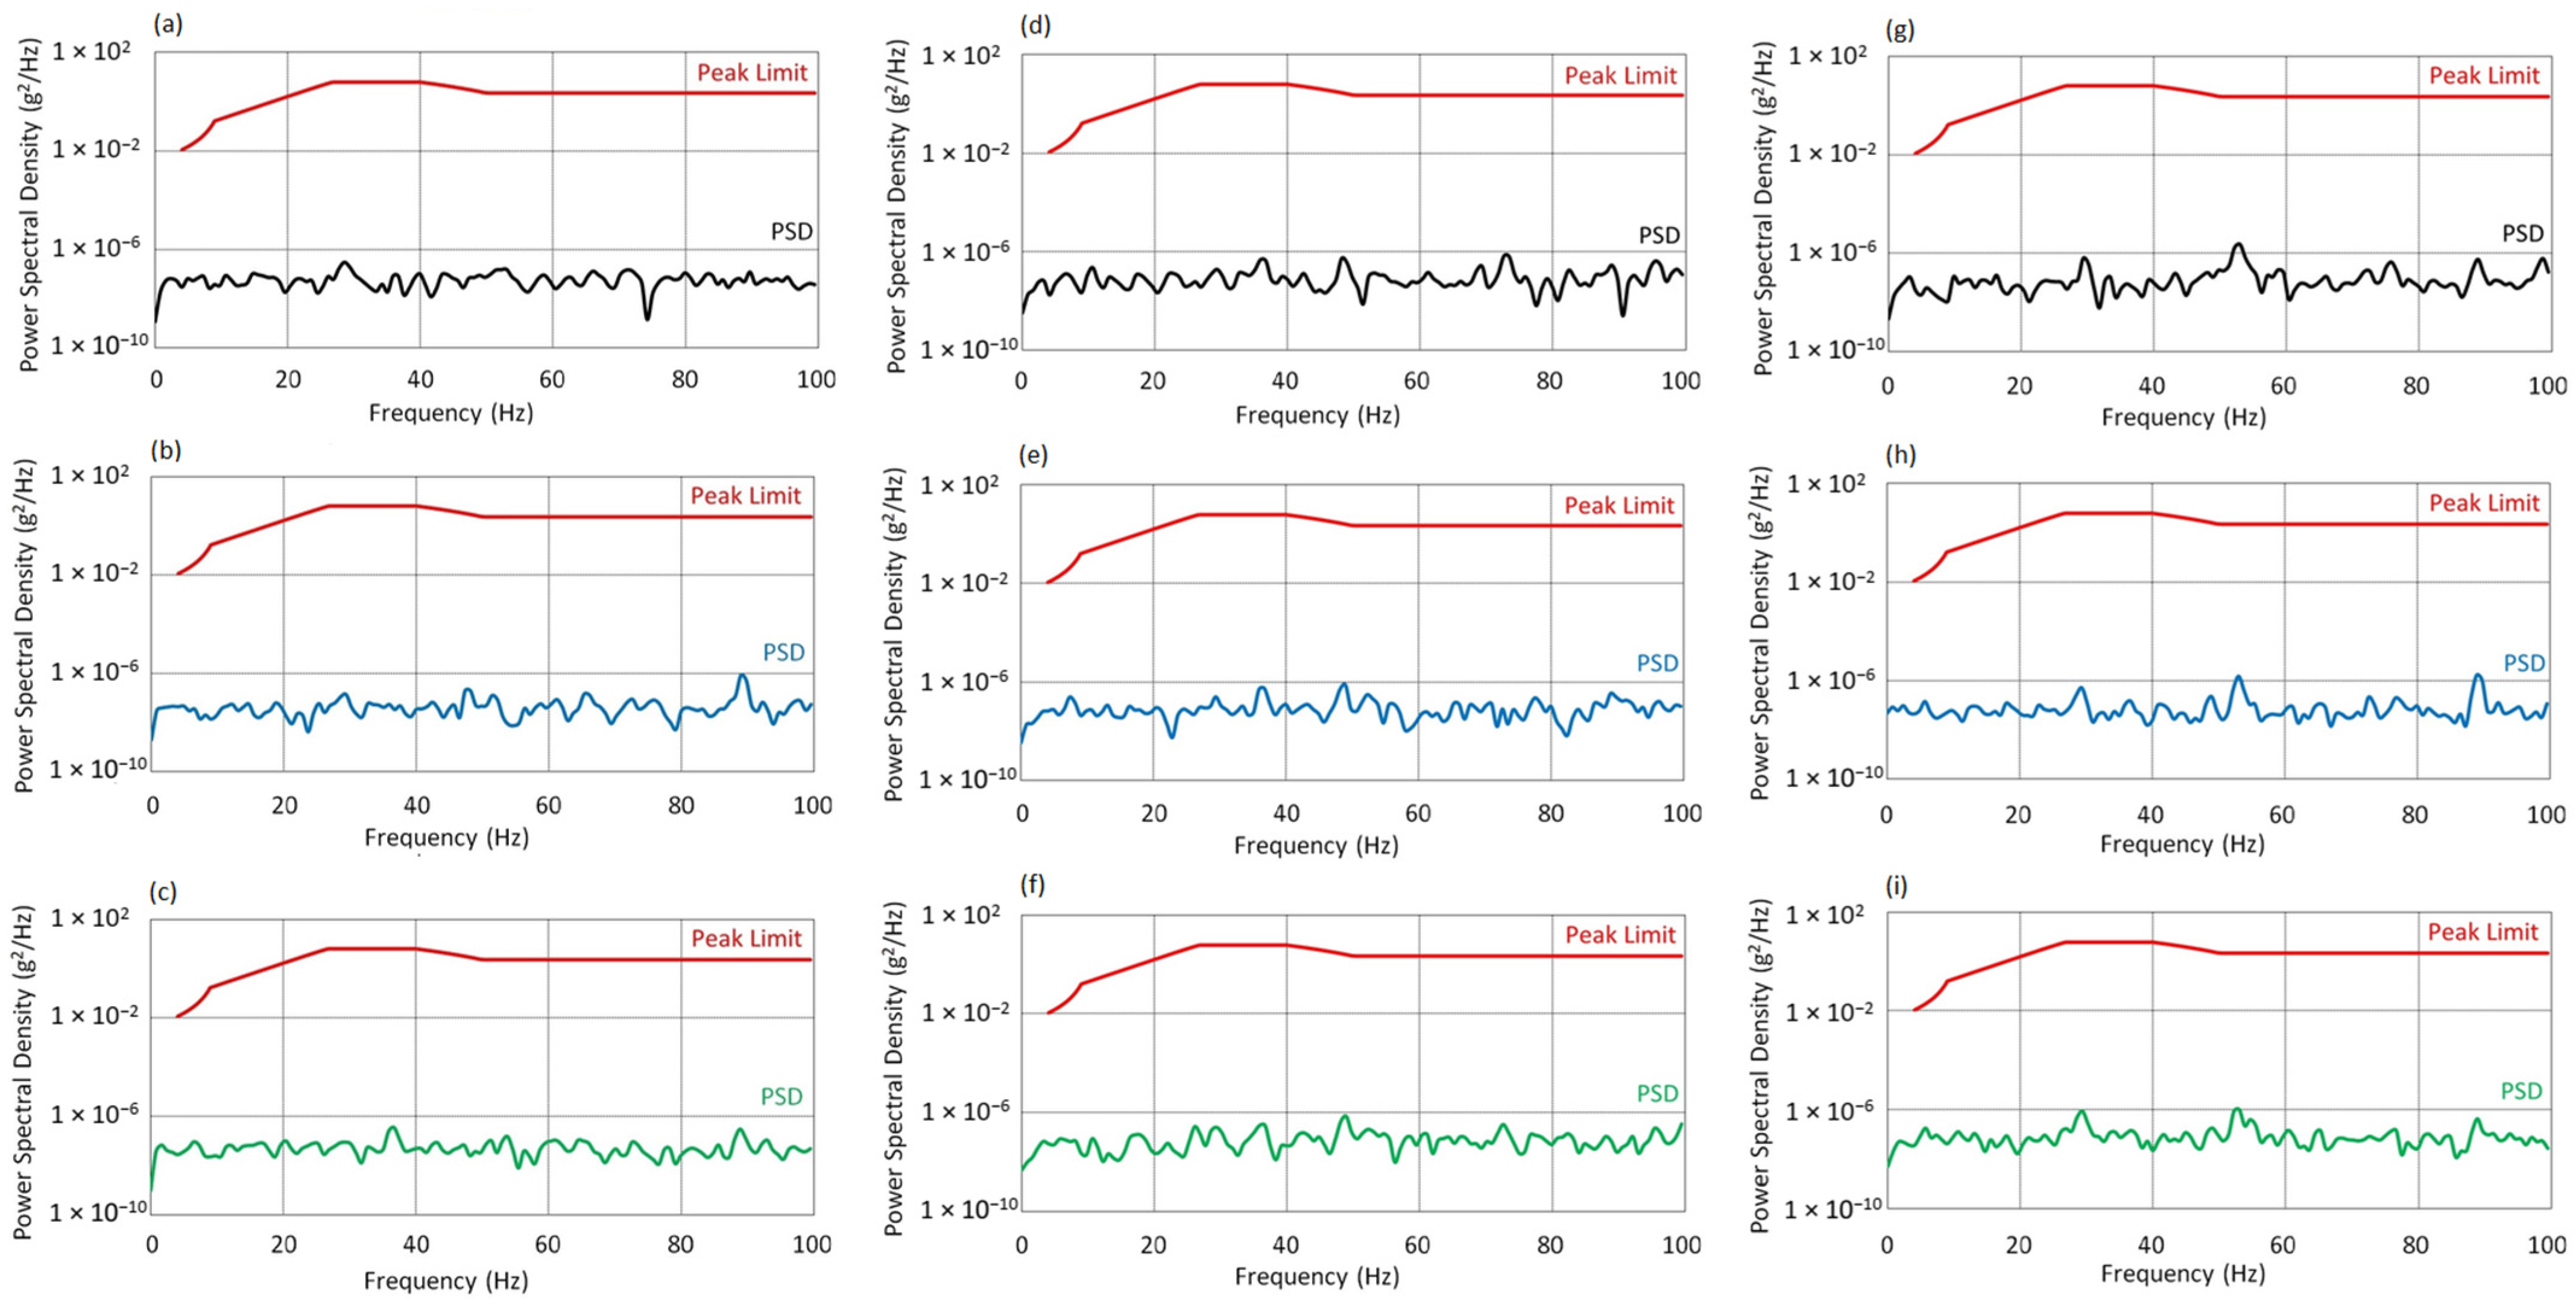
- At AoA = 0°, moderate vibrations occur within the 10–60 Hz range, with local maxima around 30–40 Hz. However, their amplitudes are significantly lower than the permissible limits. The dynamic response is linear and stable.
- At AoA = 8°, a slight increase in energy is observed in the 20–60 Hz range, along with local enhancements above 80 Hz. Nevertheless, PSD values remain well below the standard threshold, and the system exhibits only moderate dynamic activity without signs of overload.
- At AoA = 16°, the spectral character remains largely unchanged. The vibration levels stabilize across a broad frequency range, and the system maintains a controlled, harmonic operating mode even under full aerodynamic load.
- At AoA = 0°, the absence of distinct peaks indicates a stable structural response, which may result from effective vibration isolation in this configuration.
- At AoA = 8°, the spectrum shows more local maxima in the 20–60 Hz range, which may suggest the onset of resonant excitation or increased complexity of the dynamic response.
- At AoA = 16°, the spectral structure further develops; however, the amplitudes remain within safe limits. The increase in vibration energy indicates moderate intensification of dynamic interactions without exceeding safety margins.
- At AoA = 0°, the lowest energy level was recorded absence of significant peaks confirms a well-damped, harmonic system response.
- At AoA = 8°, minor components appear around 55 Hz and 90 Hz, yet their amplitudes remain very low. This may signal the onset of structural activity.
- At AoA = 16°, the spectrum becomes more dispersed, especially above 50 Hz. Despite the increase in PSD levels, the system still meets the standard’s criteria, although the intensification of dynamic interactions may warrant further investigation.
3.2.3. Results at Medium Rotor Velocity
- At AoA = 0°, the spectrum exhibits a compact structure with local maxima around 30, 55, and 90 Hz. The dynamic response is stable and well-controlled under nominal conditions.
- At AoA = 8°, the spectral range broadens into the 40–80 Hz band. The increase in amplitude around 90 Hz may result from the growing aerodynamic moment; however, PSD values remain safely within limits.
- At AoA = 16°, the spectrum becomes the most developed. The most noticeable amplitude increase is again observed near 90 Hz, which may indicate the activation of additional structural modes under full aerodynamic load. Despite this, vibration levels remain below critical thresholds.
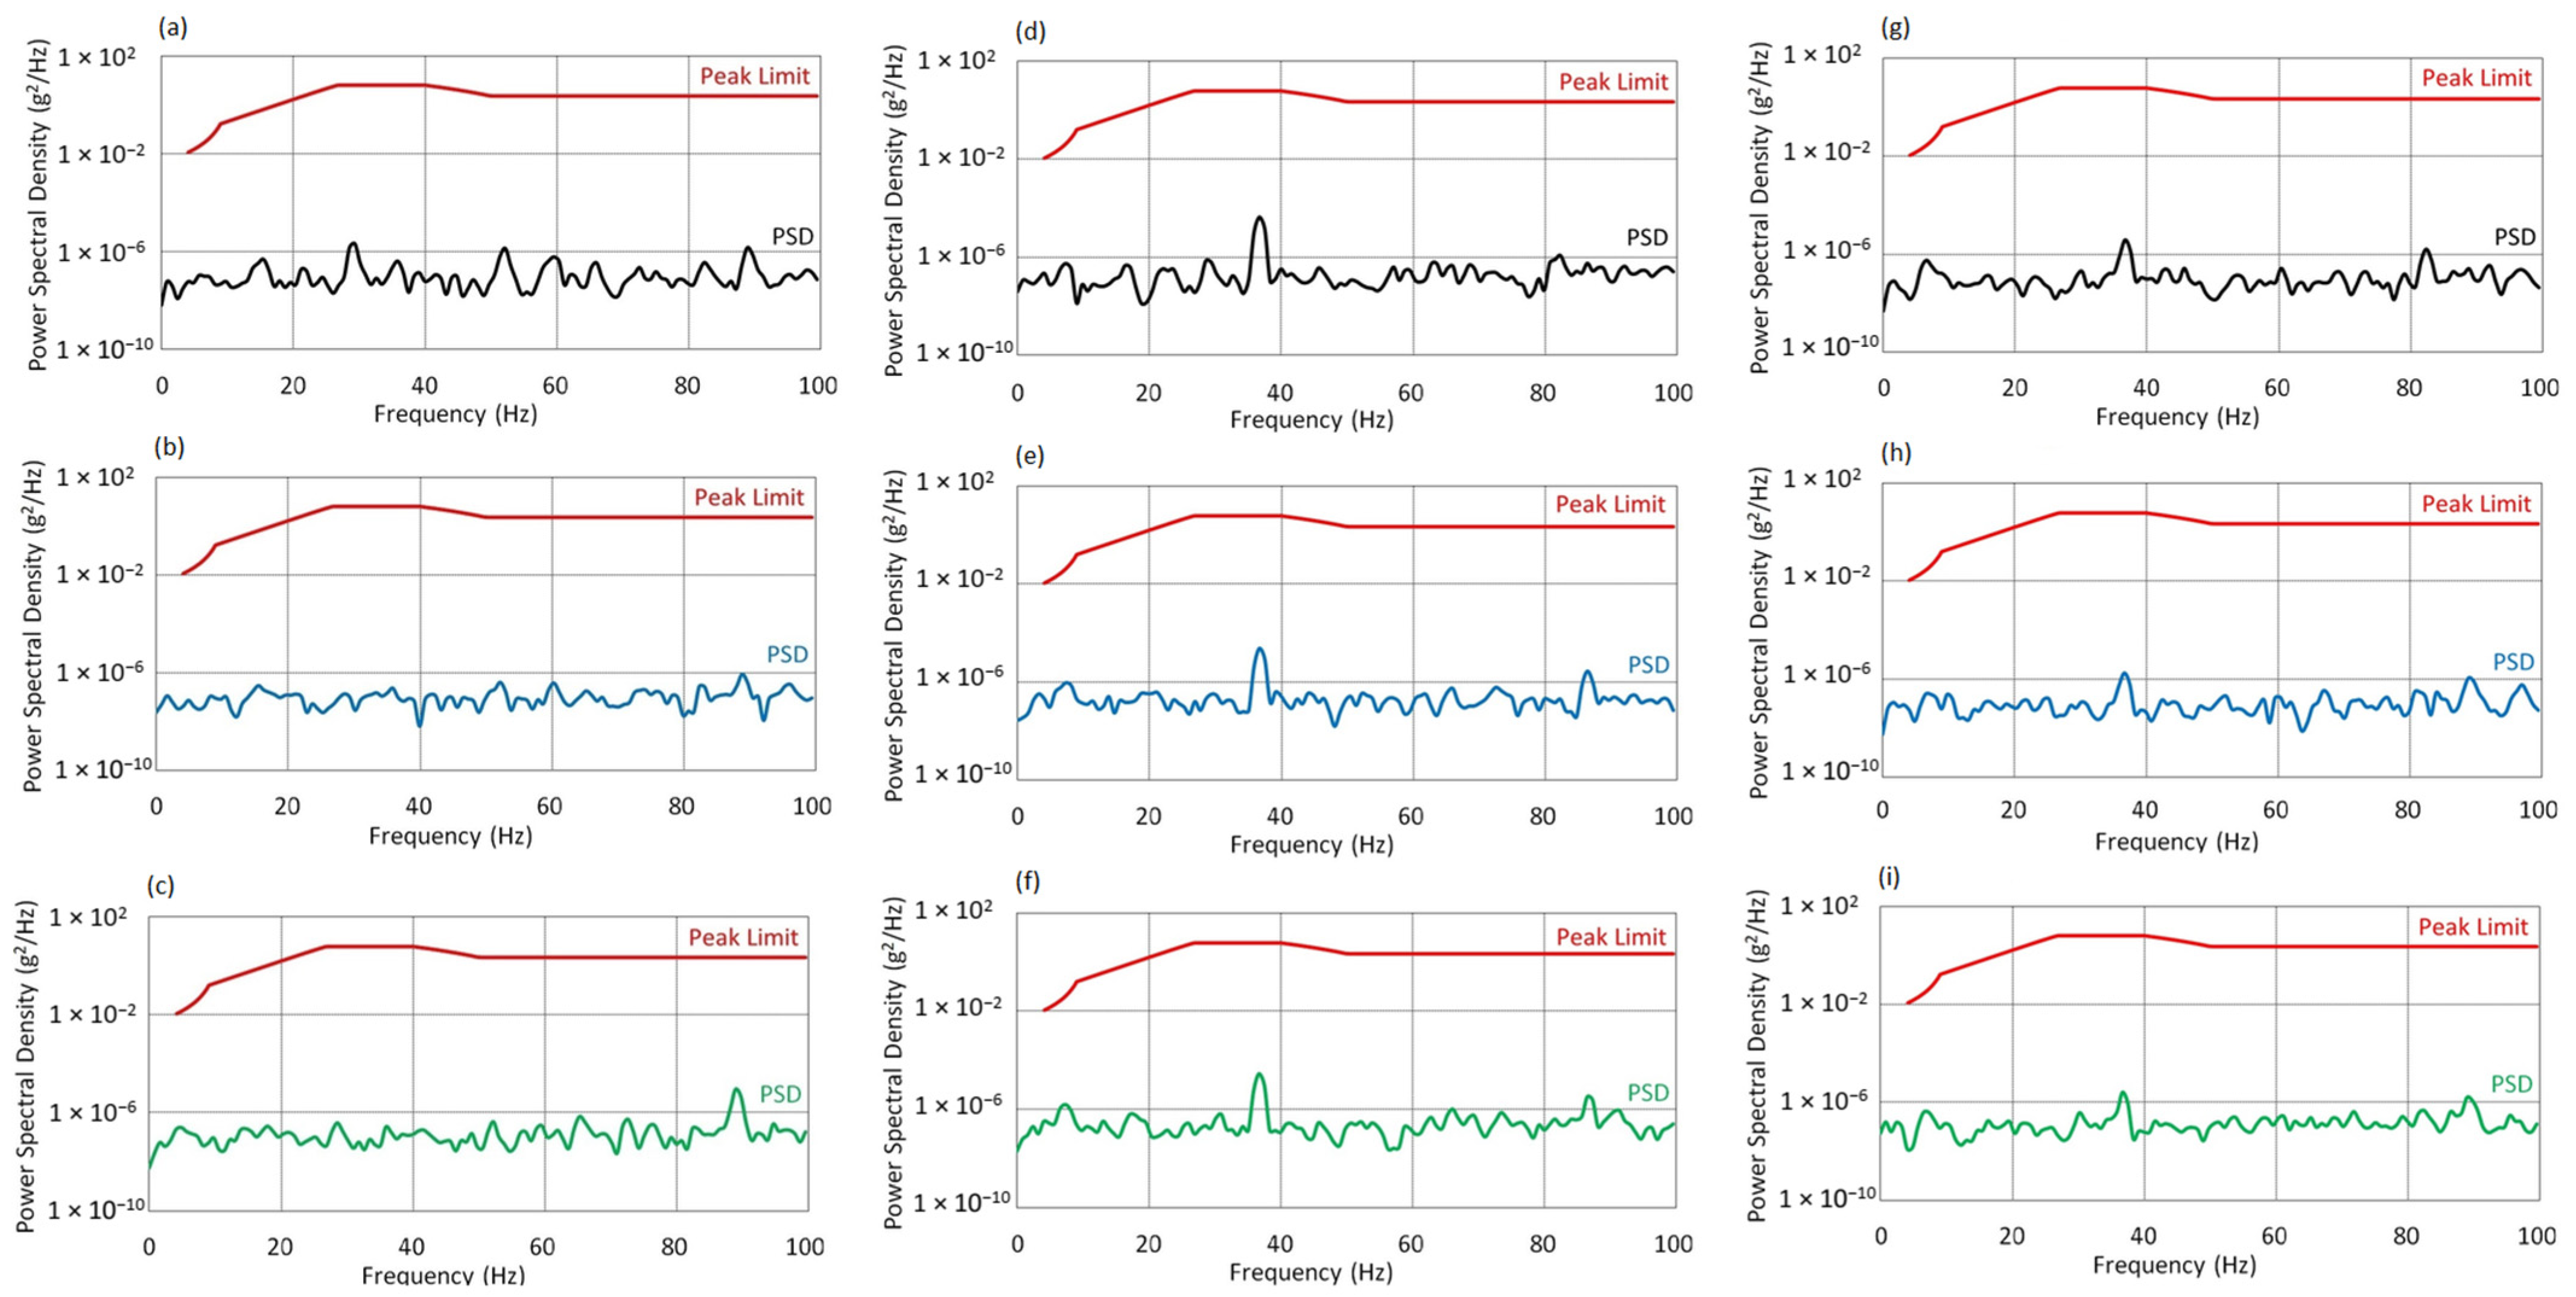
- At AoA = 0°, a pronounced maximum appears in the 35–40 Hz band, with a dominant peak around ~37 Hz, reaching values exceeding 1 × 10⁻⁶ g2/Hz. Despite this localized intensification, the amplitude remains below the standard’s threshold.
- At AoA = 8°, the energy level in this range slightly decreases. This may be interpreted as the result of minor damping due to altered aerodynamic conditions or redistribution of forces within the structure.
- At AoA = 16°, no further changes in spectral distribution are observed. The consistent amplitude level suggests stable resonance conditions, regardless of increased angle of attack.
- At AoA = 0°, the amplitudes are highest but maintain a clear margin below the MIL-STD threshold.
- As the angle of attack increases (AoA = 8° and 16°), a systematic decrease in PSD levels is observed both in the resonance region and across the entire analyzed spectrum. This may indicate increased system stiffness or a change in vibration propagation conditions under higher aerodynamic loads.
- In all cases, the dynamic response in the Z-axis remains safe and shows no signs of exceeding acceptable vibration levels.
3.2.4. Results at Highest Rotor Velocity
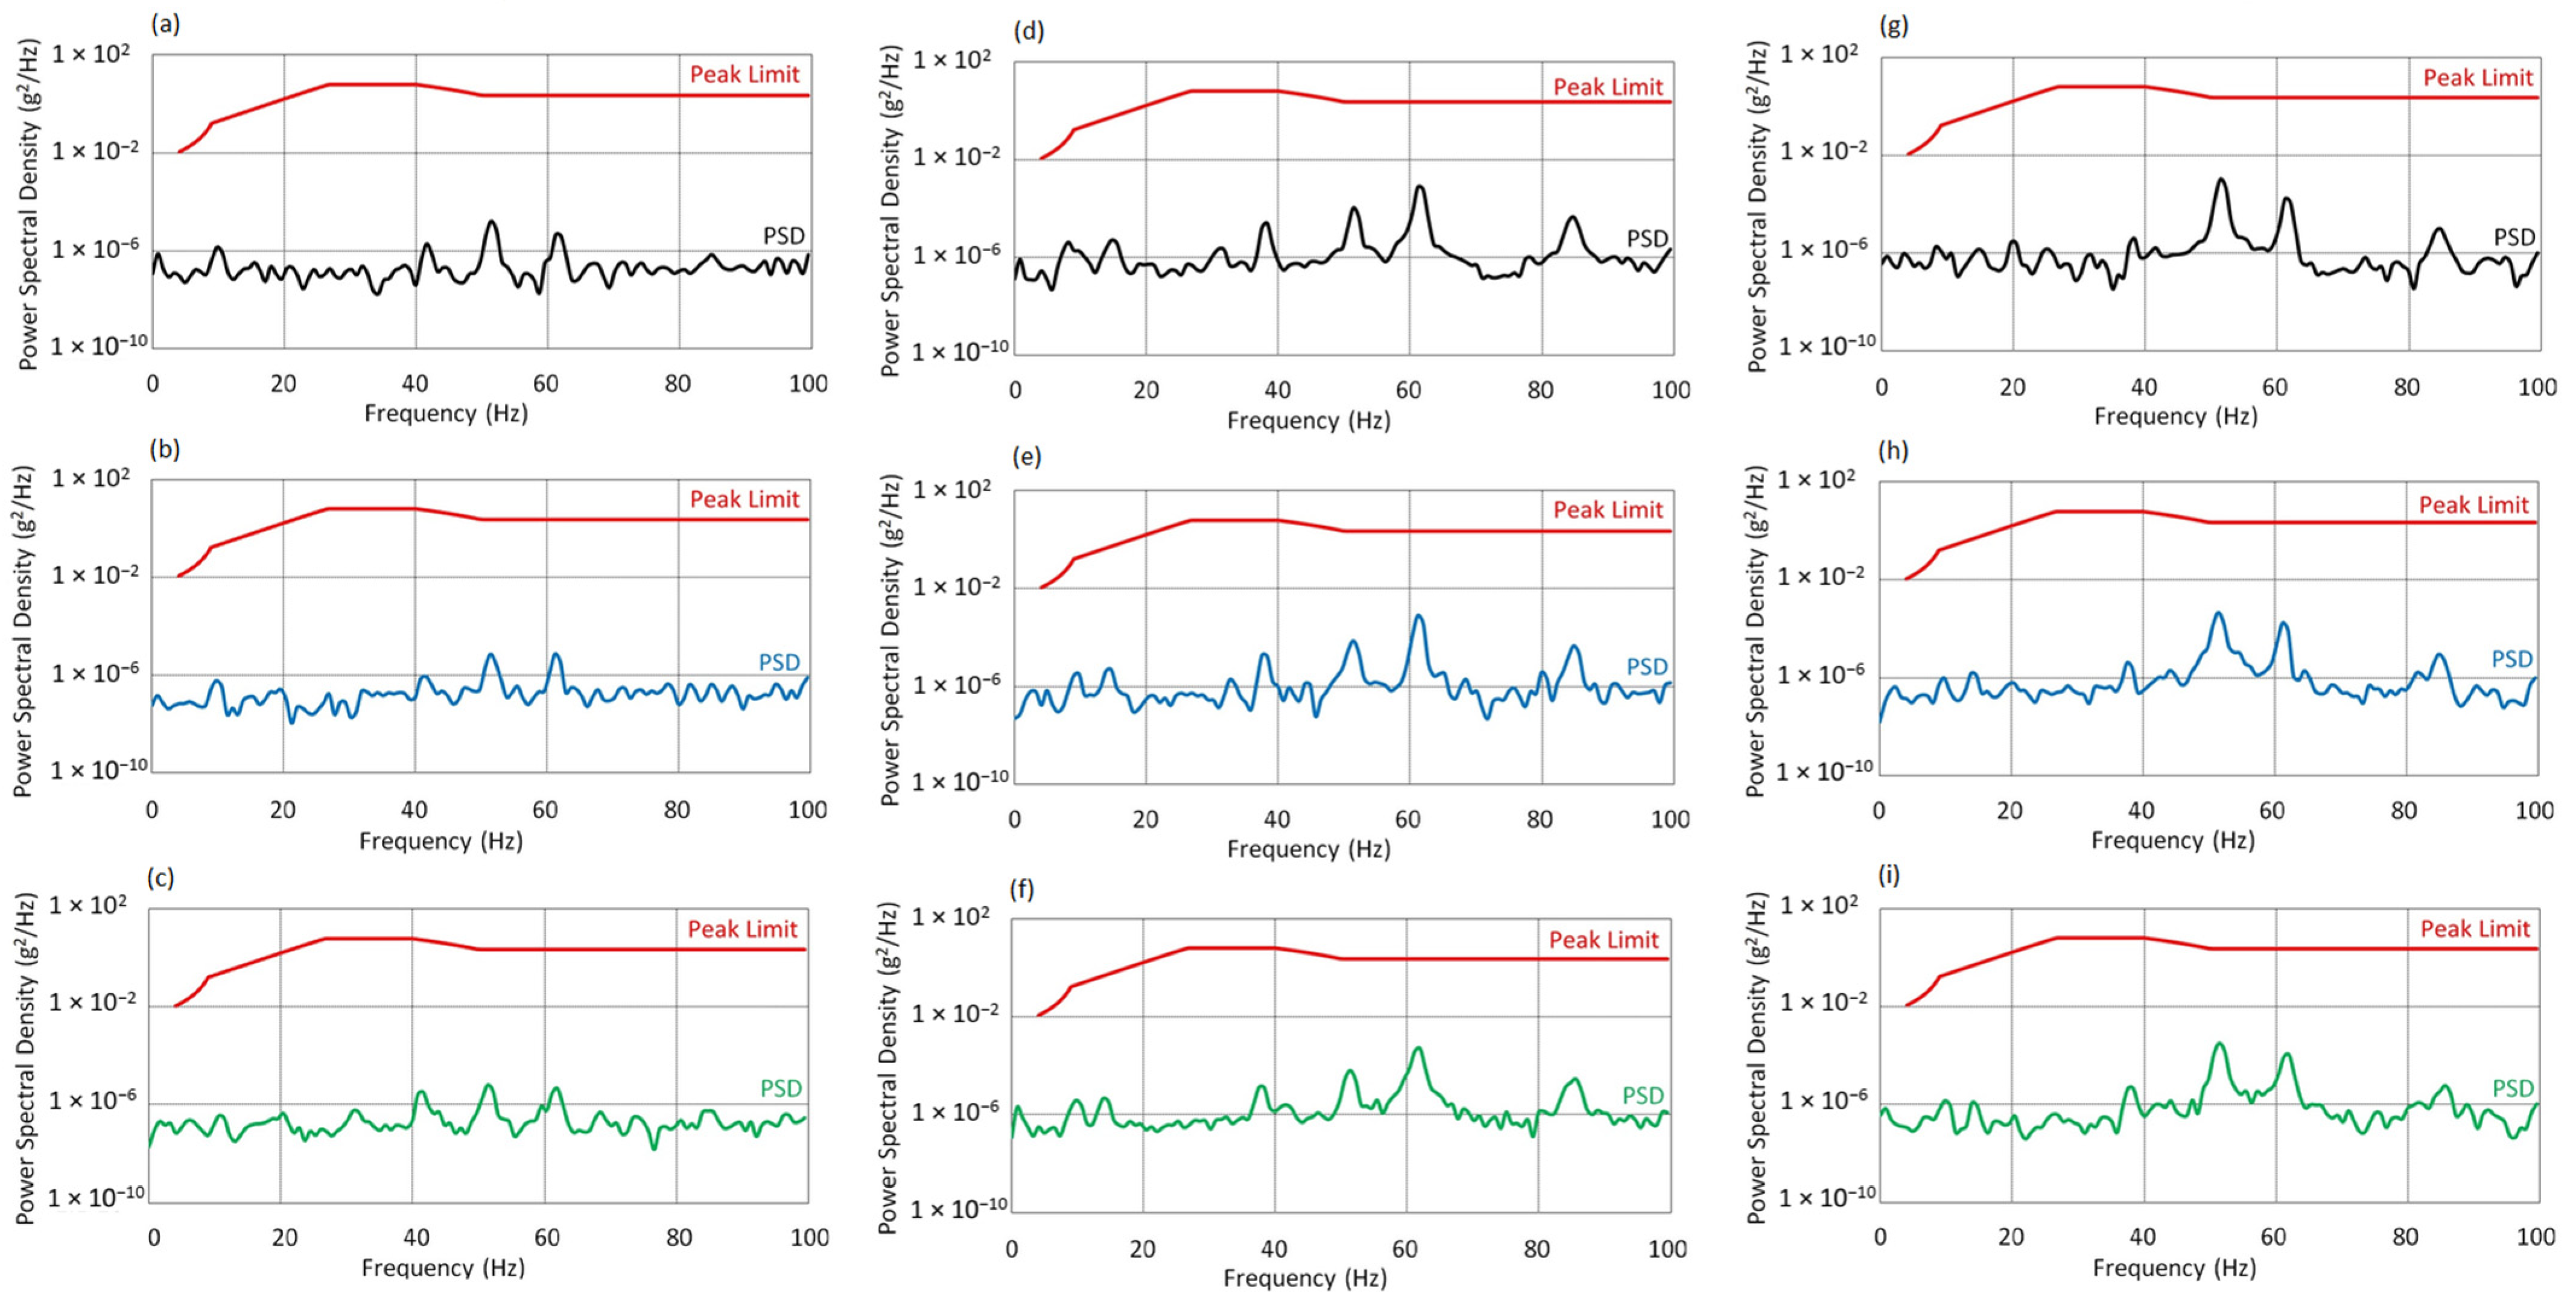
- At AoA = 0°, the PSD values remain well below the standard’s threshold.
- At AoA = 8°, a moderate decrease in amplitude is observed, whereas at AoA = 16°, the spectrum becomes more dispersed, and local maxima are further attenuated. This may indicate increased damping or a favorable shift in the system’s dynamic characteristics. Despite the presence of secondary resonances, the overall PSD remains within the MIL-STD-810H limits.
- At AoA = 0°, the dominant component occurs at 62 Hz, which may result from structural resonance excitation or secondary effects from the drive system. The spectral profile suggests significant energy interaction near the f0 frequency. Although the harmonic structure is denser, amplitudes remain below threshold values.
- At AoA = 8°, the main components remain within the same frequency intervals, confirming the stability of the dynamic response.
- At AoA = 16°, a noticeable increase in PSD is observed in the 30–50 Hz band, indicating intensified energy transfer from the drive to the structure. The spectrum becomes more dispersed, yet remains within the limits defined by the standard.
- At AoA = 8°, the spectral characteristics are similar, though shifts and densification of components in the 55–65 Hz range are visible. This may result from a varying distribution of centrifugal and aerodynamic forces.
- At AoA = 16°, an amplitude increase is observed around 70 Hz, and the spectrum becomes more complex. The appearance of minor peaks above 80 Hz may indicate the activation of additional structural modes. Despite the increased spectral complexity, PSD levels remain safely within the MIL-STD-810H compliance range.
3.2.5. Summary
4. Conclusions
- The following conclusions were drawn based on the FFT analysis: For f0 = 25 Hz: In the X axis, the dominant component was the subharmonic 12.5 Hz (0.5× f0), with no distinct peak at the base excitation frequency f0 = 25 Hz, indicating selective suppression of the primary forcing frequency. The dynamic response in the Y and Z axes was characterized by the stable presence of the drive frequency and its harmonics, with no signs of instability.
- For f0 = 50 Hz: The X axis continued to show dominance of the subharmonic (25 Hz), although an increase in amplitude was observed at f0 = 50 Hz for AoA = 16°. In the Y and Z axes, a stable spectral structure was identified with dominance of harmonics and blade-related signals around 7.3 Hz. Minor peaks, such as 57 Hz in the Z axis, were also detected, which may indicate local modal resonances.
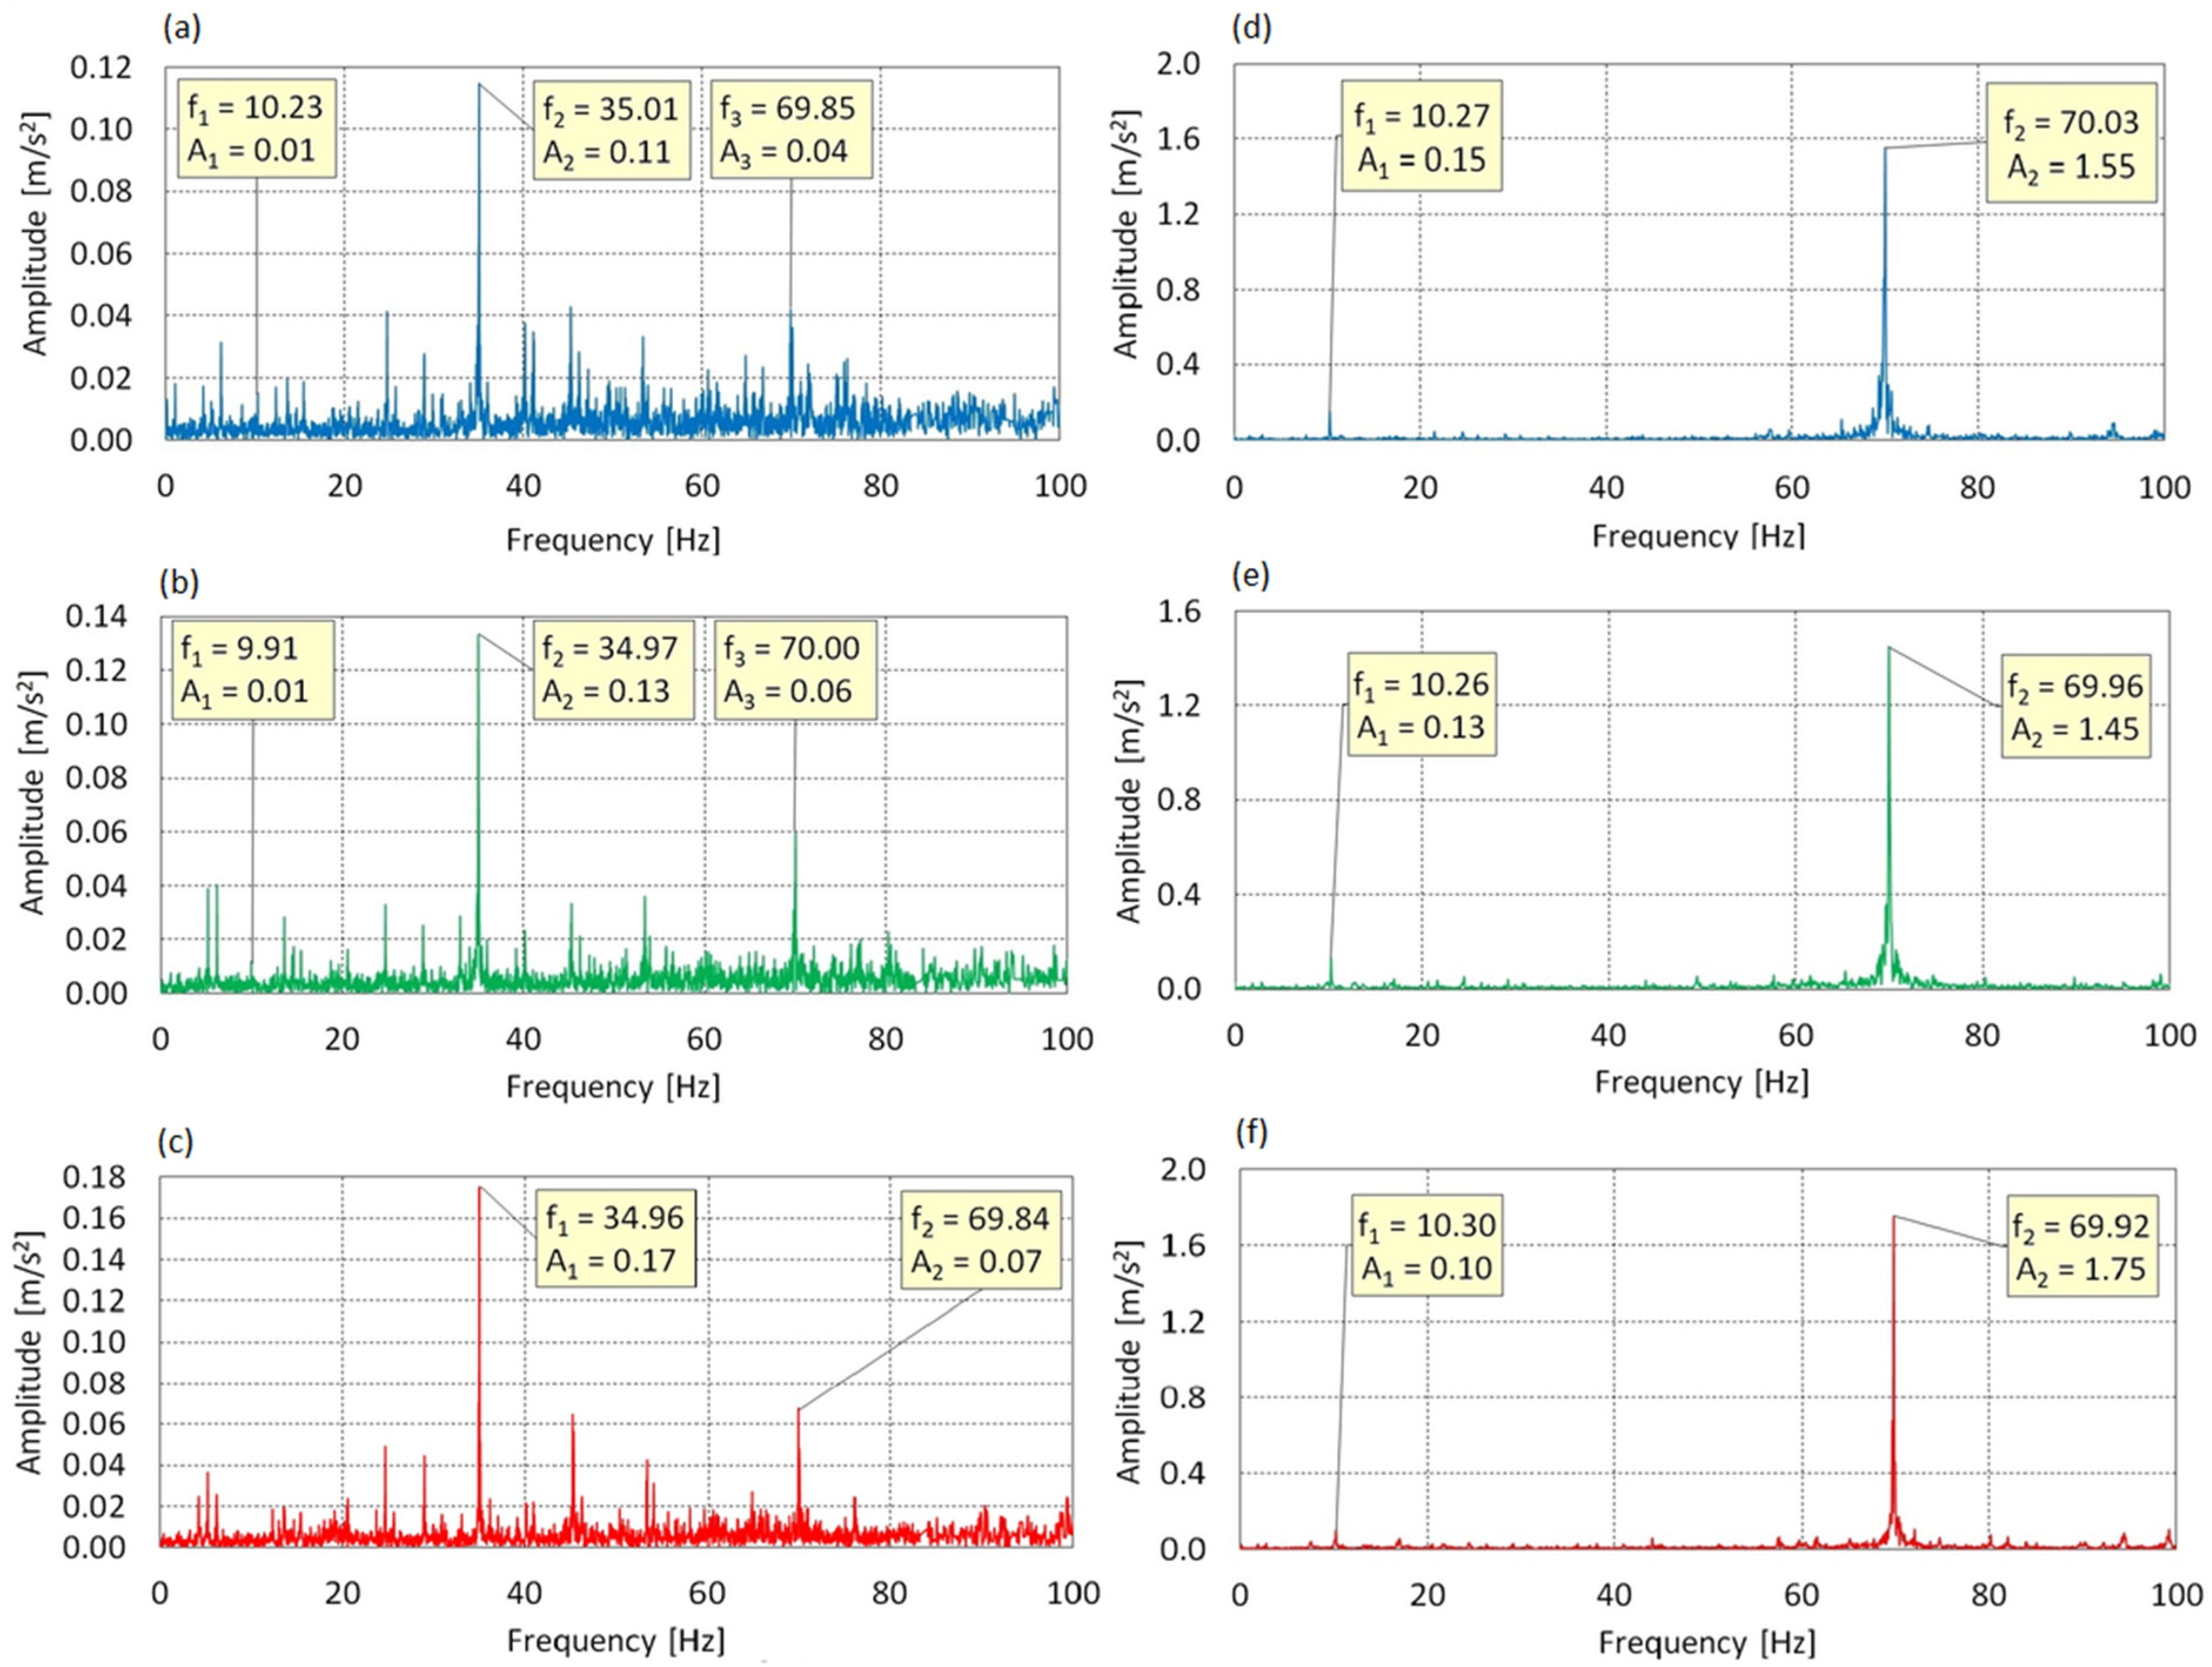
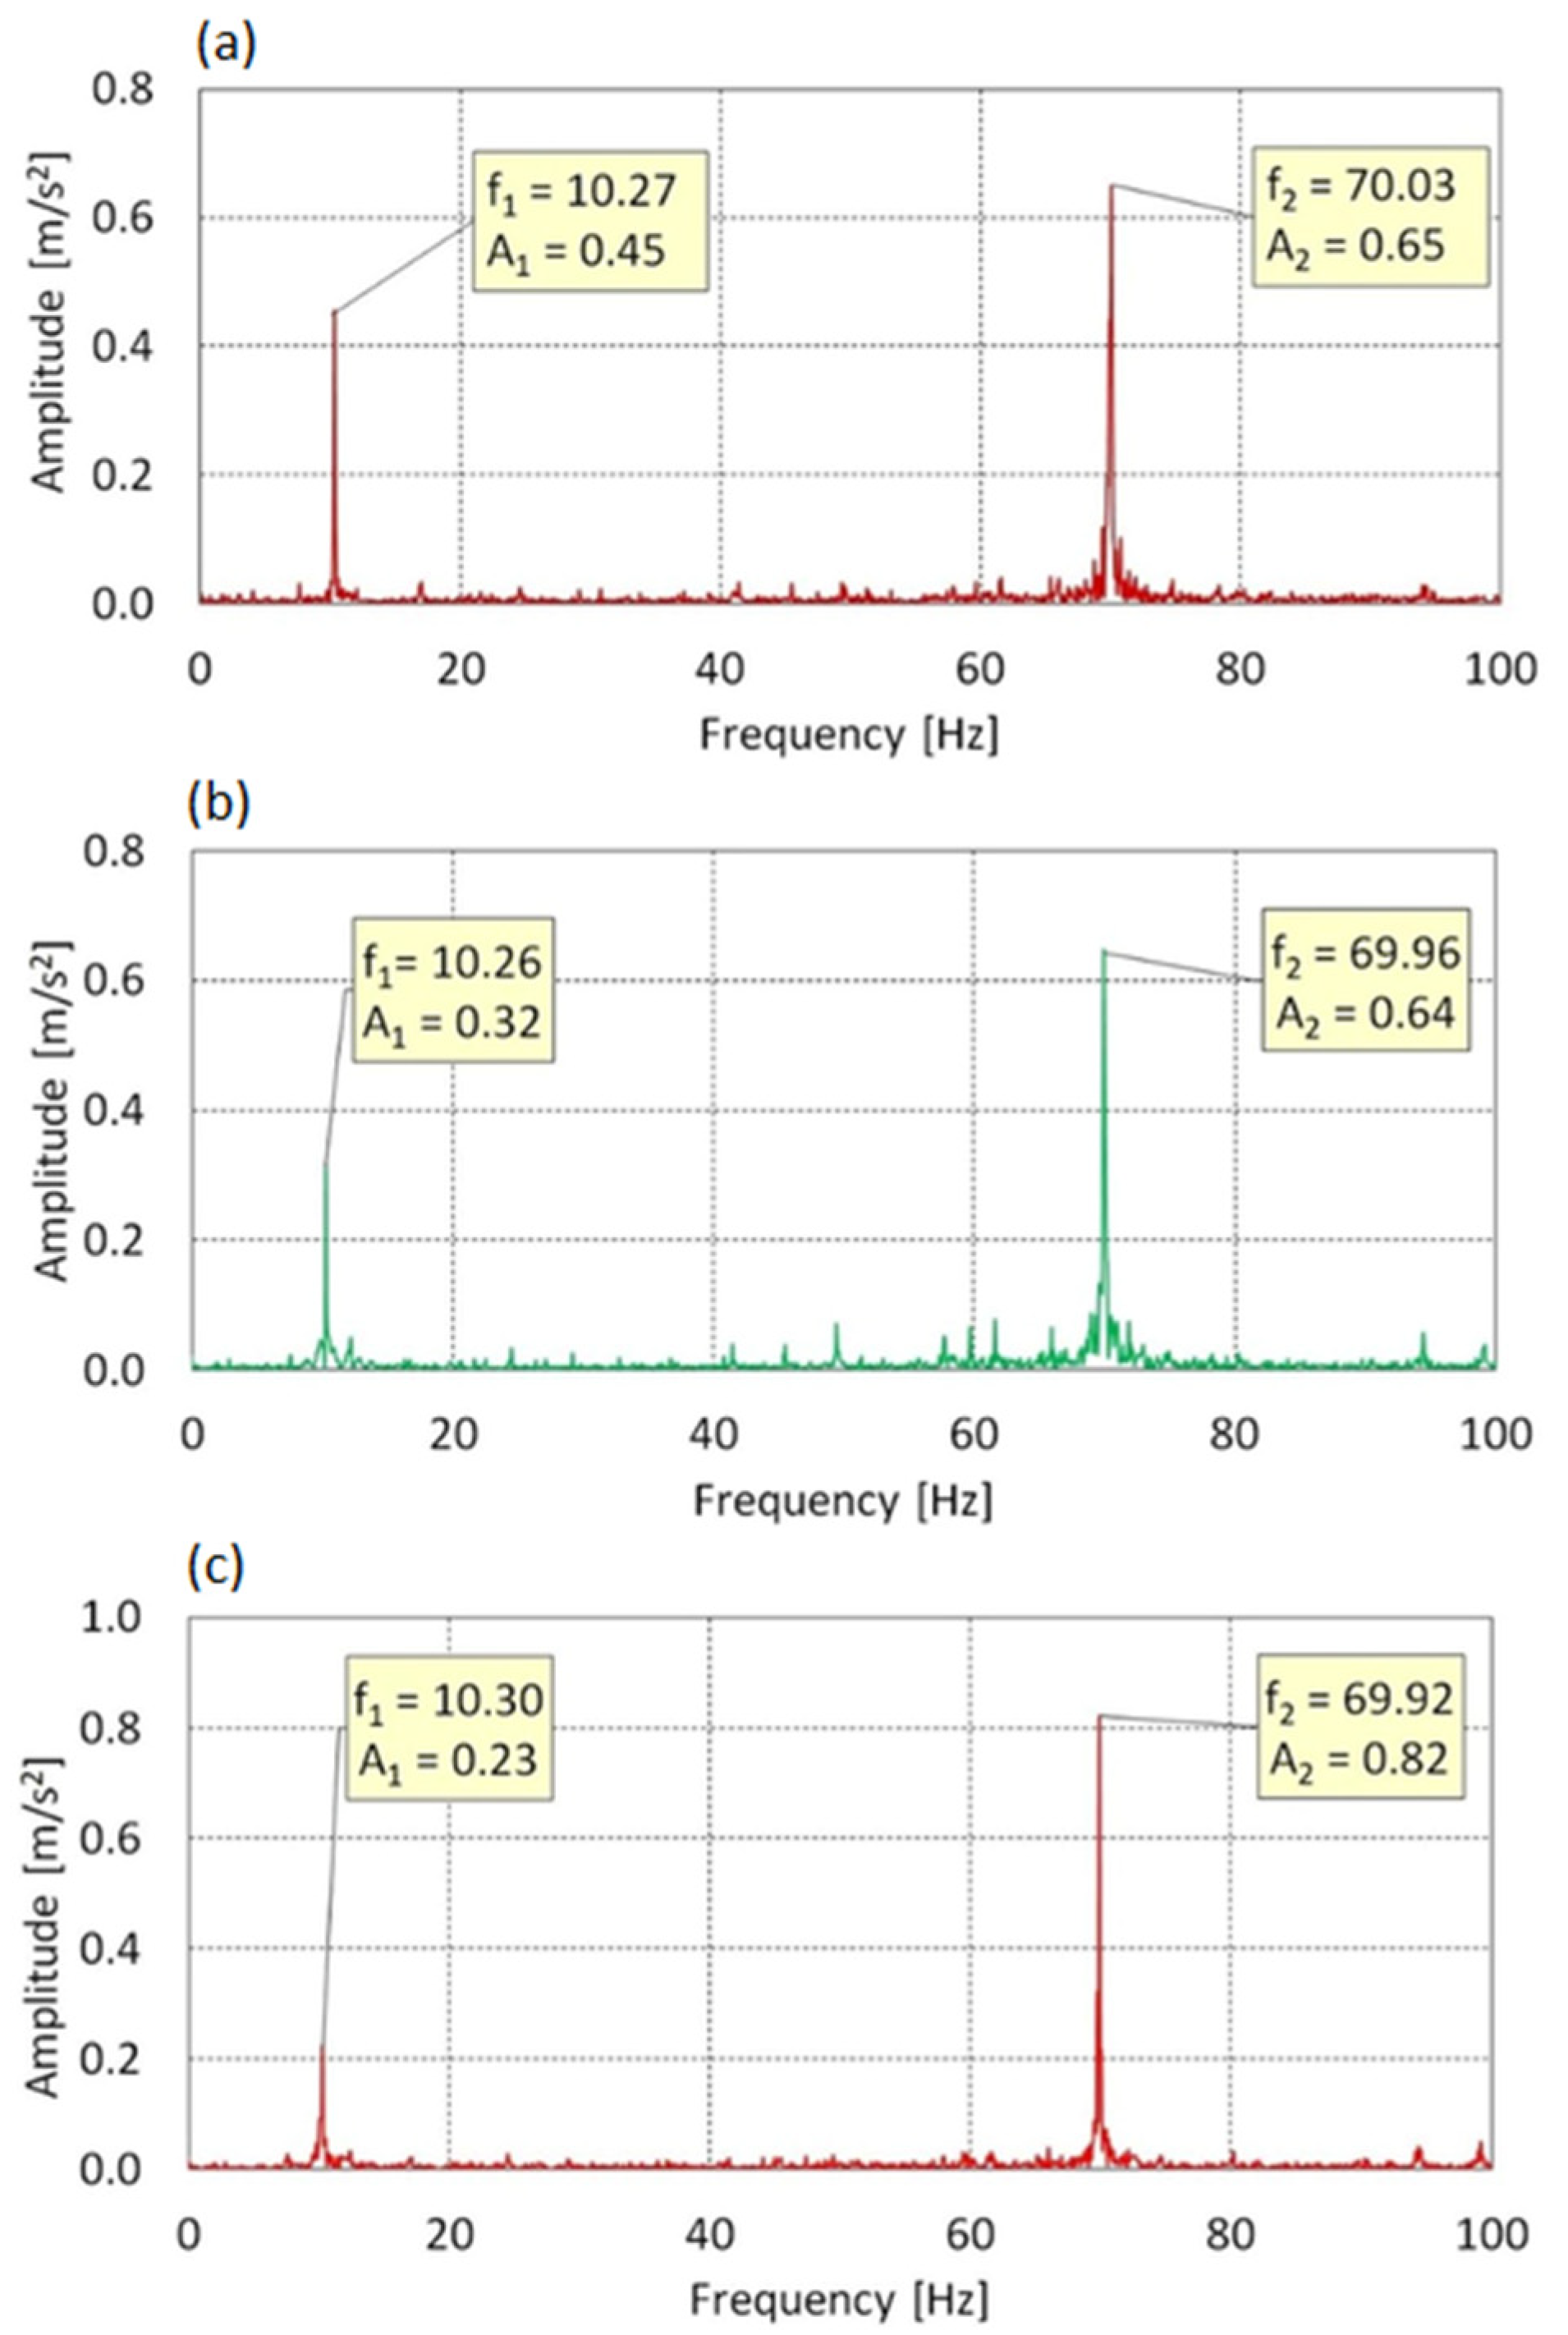
- For f0 = 70 Hz: The spectrum in the X axis exhibited a dispersed nature with multiple dominant components, but without a clear presence of f0. This could suggest the development of dynamic instability. In the Y and Z axes, the f0 = 70 Hz component and a blade-related frequency around 10.3 Hz were dominant, with amplitudes increasing with AoA, indicating greater structural stiffness and direct energy transfer from the drive system to the structure.
- Key findings from the PSD analysis include: In all cases, the PSD spectra remained below the permissible thresholds defined by the MIL-STD-810H standard, confirming safe operating conditions.
- At the lowest speed (f0 = 25 Hz), energy distribution was uniform, particularly in the Z axis, where PSD levels were the lowest.
- With increasing drive speed, especially at 70 Hz, a higher density of peaks and increased PSD amplitudes were observed, primarily in the Y and Z axes, which may indicate the activation of additional dynamic modes.
- The X axis exhibited the highest spectral instability at 70 Hz, there was no clear dominance of f0, and the system response appeared dispersed and nonlinear.
- In the Y and Z axes, the drive component was dominant, and the PSD profiles were harmonic in nature, indicating effective energy transmission and structural rigidity in the rotor plane.
Author Contributions
Funding
Data Availability Statement
Conflicts of Interest
Abbreviations
| EPS | Electric propulsion systems |
| AoA | Angle of attack |
| SMA | Smart material alloys |
| FFT | Fast Fourier transform |
| PSD | Power spectral density |
| UAV | Unmanned Aerial Vehicle |
| NES | Nonlinear energy sink |
| SEM | Single equivalent mass |
| TMM | Transfer matrix method |
| SANC | Self-adaptive noise cancelation |
| CSCD | Cyclic symplectic component decomposition |
| CNT | Continuous wavelet transform |
| VS | Vibration sensor |
| AR | Auto regression |
| AE | Acoustic emission |
| CAD | Computer-aided design |
| FEM | Finite element method |
| CFD | Computational fluid dynamics |
| AC | Alternating current |
| PC | Personal computer |
References
- Joshi, D.; Deb, D.; Muyeen, S.M. Comprehensive Review on Electric Propulsion System of Unmanned Aerial Vehicles. Front. Energy Res. 2022, 10, 752012. [Google Scholar] [CrossRef]
- Wang, L.; Deng, X.; Gui, J.; Jiang, P.; Zeng, F.; Wan, S. A review of Urban Air Mobility-enabled Intelligent Transportation Systems: Mechanisms, applications and challenges. J. Syst. Arch. 2023, 141, 102902. [Google Scholar] [CrossRef]
- Barbarino, S.; Saavedra-Flores, E.I.; Ajaj, R.M.; Dayyani, I.; Friswell, M.I. A review on shape memory alloys with applications to morphing aircraft. Smart Mater. Struct. 2014, 23, 063001. [Google Scholar] [CrossRef]
- Ścisłowski, K.; Skiba, K.; Wendeker, M.; Kliza, R.; Siadkowska, K.; Lusiak, T.; Novák, A. Durability Analysis of the Prototype Test Rig for Main Rotors. Commun. Sci. Lett. Univ. Zilina 2022, 24, B148–B157. [Google Scholar] [CrossRef]
- Skiba, K.; Raczyński, R.; Kliza, R.; Wendeker, M. Strength analysis of a propulsion shaft dedicated for the main rotor test bench. J. Phys. Conf. Ser. 2021, 1736, 012052. [Google Scholar] [CrossRef]
- Czyż, Z.; Karpiński, P.; Skiba, K.; Siadkowska, K. Numerical analysis of the airflow around the Gyro-One autogyro. J. Phys. Conf. Ser. 2021, 1736, 012049. [Google Scholar] [CrossRef]
- Raczyński, R.; Siadkowska, K. Numerical analysis issues in the evaluation of the helicopter’s main rotor stability. J. Phys. Conf. Ser. 2021, 1736, 012016. [Google Scholar] [CrossRef]
- Raczyński, R.; Siadkowska, K.; Ścisłowski, K.; Wendeker, M. An assessment of the transient effect on helicopter main rotor stability and power demand. Combust. Engines 2022, 191, 23–28. [Google Scholar] [CrossRef]
- Bielaczyc, P.; Hejny, B.; Suchecki, A.; SALA, R.; Sobieszczański, K. Methodology of electric motor testing on the hybrid engine test bench. Combust. Engines 2018, 174, 26–32. [Google Scholar] [CrossRef]
- Siadkowska, K.; Czajka, B.; Ścisłowski, K.; Wendeker, M. Analysis of propulsion units dedicated to test stands for aviation systems. Combust. Engines 2021, 185, 39–43. [Google Scholar] [CrossRef]
- Szmit, Z.; Kloda, L.; Kowalczuk, M.; Stachyra, G.; Warmiński, J. Experimental Analysis of Aerodynamic Loads of Three-Bladed Rotor. Materials 2022, 15, 3335. [Google Scholar] [CrossRef]
- Borowiec, M.; Gawryluk, J.; Bochenski, M. Influence of mechanical couplings on the dynamical behavior and energy harvesting of a composite structure. Polymers 2020, 13, 66. [Google Scholar] [CrossRef]
- Krzyzak, A.; Kosicka, E.; Borowiec, M.; Szczepaniak, R. Selected tribological properties and vibrations in the base resonance zone of the polymer composite used in the aviation industry. Materials 2020, 13, 1364. [Google Scholar] [CrossRef]
- Cao, Y.; Yao, H.; Li, Q.; Yang, P.; Wen, B. Vibration mitigation and dynamics of a rotor-blade system with an attached nonlinear energy sink. Int. J. Non Linear Mech. 2020, 127, 103614. [Google Scholar] [CrossRef]
- Ding, M.; Jiang, J.; Zhang, F.; Liang, X.; Shen, N. Reverse Design of a Novel Coupling Strut for Vibration Attenuation in the Helicopter Cabin. Aerospace 2022, 9, 843. [Google Scholar] [CrossRef]
- Czarnigowski, J.A.; Jaklinski, P.; Ścisłowski, K.; Rękas, D.; Skiba, K. The Use of a Low Frequency Vibration Signal in Detecting the Misfire of a Cylinder of an Aircraft Piston Engine. SAE Tech. Pap. 2020, 1–6. [Google Scholar] [CrossRef]
- Li, L.; Chen, M.; Wang, F.; Xu, A. The Influence of Rotor Adjustment Parameters on the Dynamic Balance of a Scale-Model Rigid Variable Speed Rotor. Appl. Sci. 2022, 12, 12125. [Google Scholar] [CrossRef]
- Zhu, Y.; Wang, Y.; Qiao, B.; Fu, S.; Liu, M.; Luo, X.; Chen, X. Full-field dynamic strain reconstruction of rotor blades under multi-mode vibration. Measurement 2022, 201, 111670. [Google Scholar] [CrossRef]
- Wallace, M.; Wagg, D.; Neild, S.; Bunniss, P.; Lieven, N.; Crewe, A. Testing coupled rotor blade–lag damper vibration using real-time dynamic substructuring. J. Sound Vib. 2007, 307, 737–754. [Google Scholar] [CrossRef]
- Shanbr, S.; Elasha, F.; Elforjani, M.; Teixeira, J. Detection of natural crack in wind turbine gearbox. Renew. Energy 2018, 118, 172–179. [Google Scholar] [CrossRef]
- Zhou, L.; Duan, F.; Corsar, M.; Elasha, F.; Mba, D. A study on helicopter main gearbox planetary bearing fault diagnosis. Appl. Acoust. 2019, 147, 4–14. [Google Scholar] [CrossRef]
- Pan, H.; Xu, H.; Zheng, J.; Liu, Q.; Tong, J. Cyclic symplectic component decomposition with application in planetary gearbox fault diagnosis. Mech. Mach. Theory 2022, 172, 104792. [Google Scholar] [CrossRef]
- Elasha, F.; Greaves, M.; Mba, D.; Addali, A. Application of Acoustic Emission in Diagnostic of Bearing Faults Within a Helicopter Gearbox. Procedia CIRP 2015, 38, 30–36. [Google Scholar] [CrossRef]
- Hu, J.; Hu, N.; Yang, Y.; Zhang, L.; Shen, G. Nonlinear dynamic modeling and analysis of a helicopter planetary gear set for tooth crack diagnosis. Measurement 2022, 198, 111347. [Google Scholar] [CrossRef]
- Yu, J.; Wang, S.; Wang, L.; Sun, Y. Gearbox fault diagnosis based on a fusion model of virtual physical model and data-driven method. Mech. Syst. Signal Process. 2022, 188, 109980. [Google Scholar] [CrossRef]
- Manarikkal, I.; Elasha, F.; Mba, D. Diagnostics and prognostics of planetary gearbox using CWT, auto regression (AR) and K-means algorithm. Appl. Acoust. 2021, 184, 108314. [Google Scholar] [CrossRef]
- Wróbel, R.; Łoza, Ł.; Haller, P.; Włostowski, R. The effect of fuel mixture on engine vibrations. Combust. Engines 2019, 177, 136–138. [Google Scholar] [CrossRef]
- Flekiewicz, M.; Fabiś, P.; Flekiewicz, B. Board recognition of different fuels feeding SI engines with the use of dimensional and nondimensional vibration signal parameters-part 1. SAE Tech. Pap. 2009, 1–7. [Google Scholar] [CrossRef]
- Qing, X.; Li, W.; Wang, Y.; Sun, H. Piezoelectric transducer-based structural health monitoring for aircraft applications. Sensors 2019, 19, 545. [Google Scholar] [CrossRef]
- Hassan, I.U.; Panduru, K.; Walsh, J. An In-Depth Study of Vibration Sensors for Condition Monitoring. Sensors 2024, 24, 740. [Google Scholar] [CrossRef] [PubMed]
- Kliza, R.; Ścisłowski, K.; Siadkowska, K.; Padyjasek, J.; Wendeker, M. Strength Analysis OF A Prototype Composite Helicopter Rotor Blade Spar. Appl. Comput. Sci. 2022, 18, 5–19. [Google Scholar] [CrossRef]
- Siadkowska, K. Investigation of a Main Rotor with Controlled Geometric Twist. Ph.D. Thesis, Lublin University of Technology, Lublin, Poland, 2024. [Google Scholar]
- U.S. Department of Defense. MIL-STD-810H: Environmental Engineering Considerations and Laboratory Tests—Method 514.8 Vibration. 2019. Available online: https://cvgstrategy.com/wp-content/uploads/2019/08/MIL-STD-810H-Method-514.8-Vibration.pdf (accessed on 20 July 2025).
- Łoza, Ł.; WRÓBEL, R.; Sitnik, L. The analysis of vibrations of gasoline and diesel vehicles as a function of their engine sizes. Combust. Engines 2019, 178, 20–23. [Google Scholar] [CrossRef]





| Parameter | Unit | Value |
|---|---|---|
| Model | - | YE3 220L-4 |
| Power | kW | 37 |
| Asynchronous motor shaft speed | rpm | 1480 |
| Current at triangle connection 400 V | A | 66.9 |
| Efficiency class | - | IE3 |
| Power factor | - | 0.85 |
| Rated torque | Nm | 238.8 |
| Weight | kg | 328 |
| f0 (Hz) | AoA (°) | f1 (Hz) | A1 (m/s2) | f2 (Hz) | A2 (m/s2) | f3 (Hz) | A3 (m/s2) | f4 (Hz) | A4 (m/s2) |
|---|---|---|---|---|---|---|---|---|---|
| 25 | 0 | 2.88 | 0.007 | 12.50 | 0.08 | 37.50 | 0.02 | 62.5 | 0.02 |
| 8 | 8.88 | 0.01 | 12.50 | 0.08 | 50.00 | 0.03 | - | - | |
| 16 | 8.84 | 0.004 | 12.48 | 0.01 | 25.00 | 0.01 | 37.5 | 0.01 | |
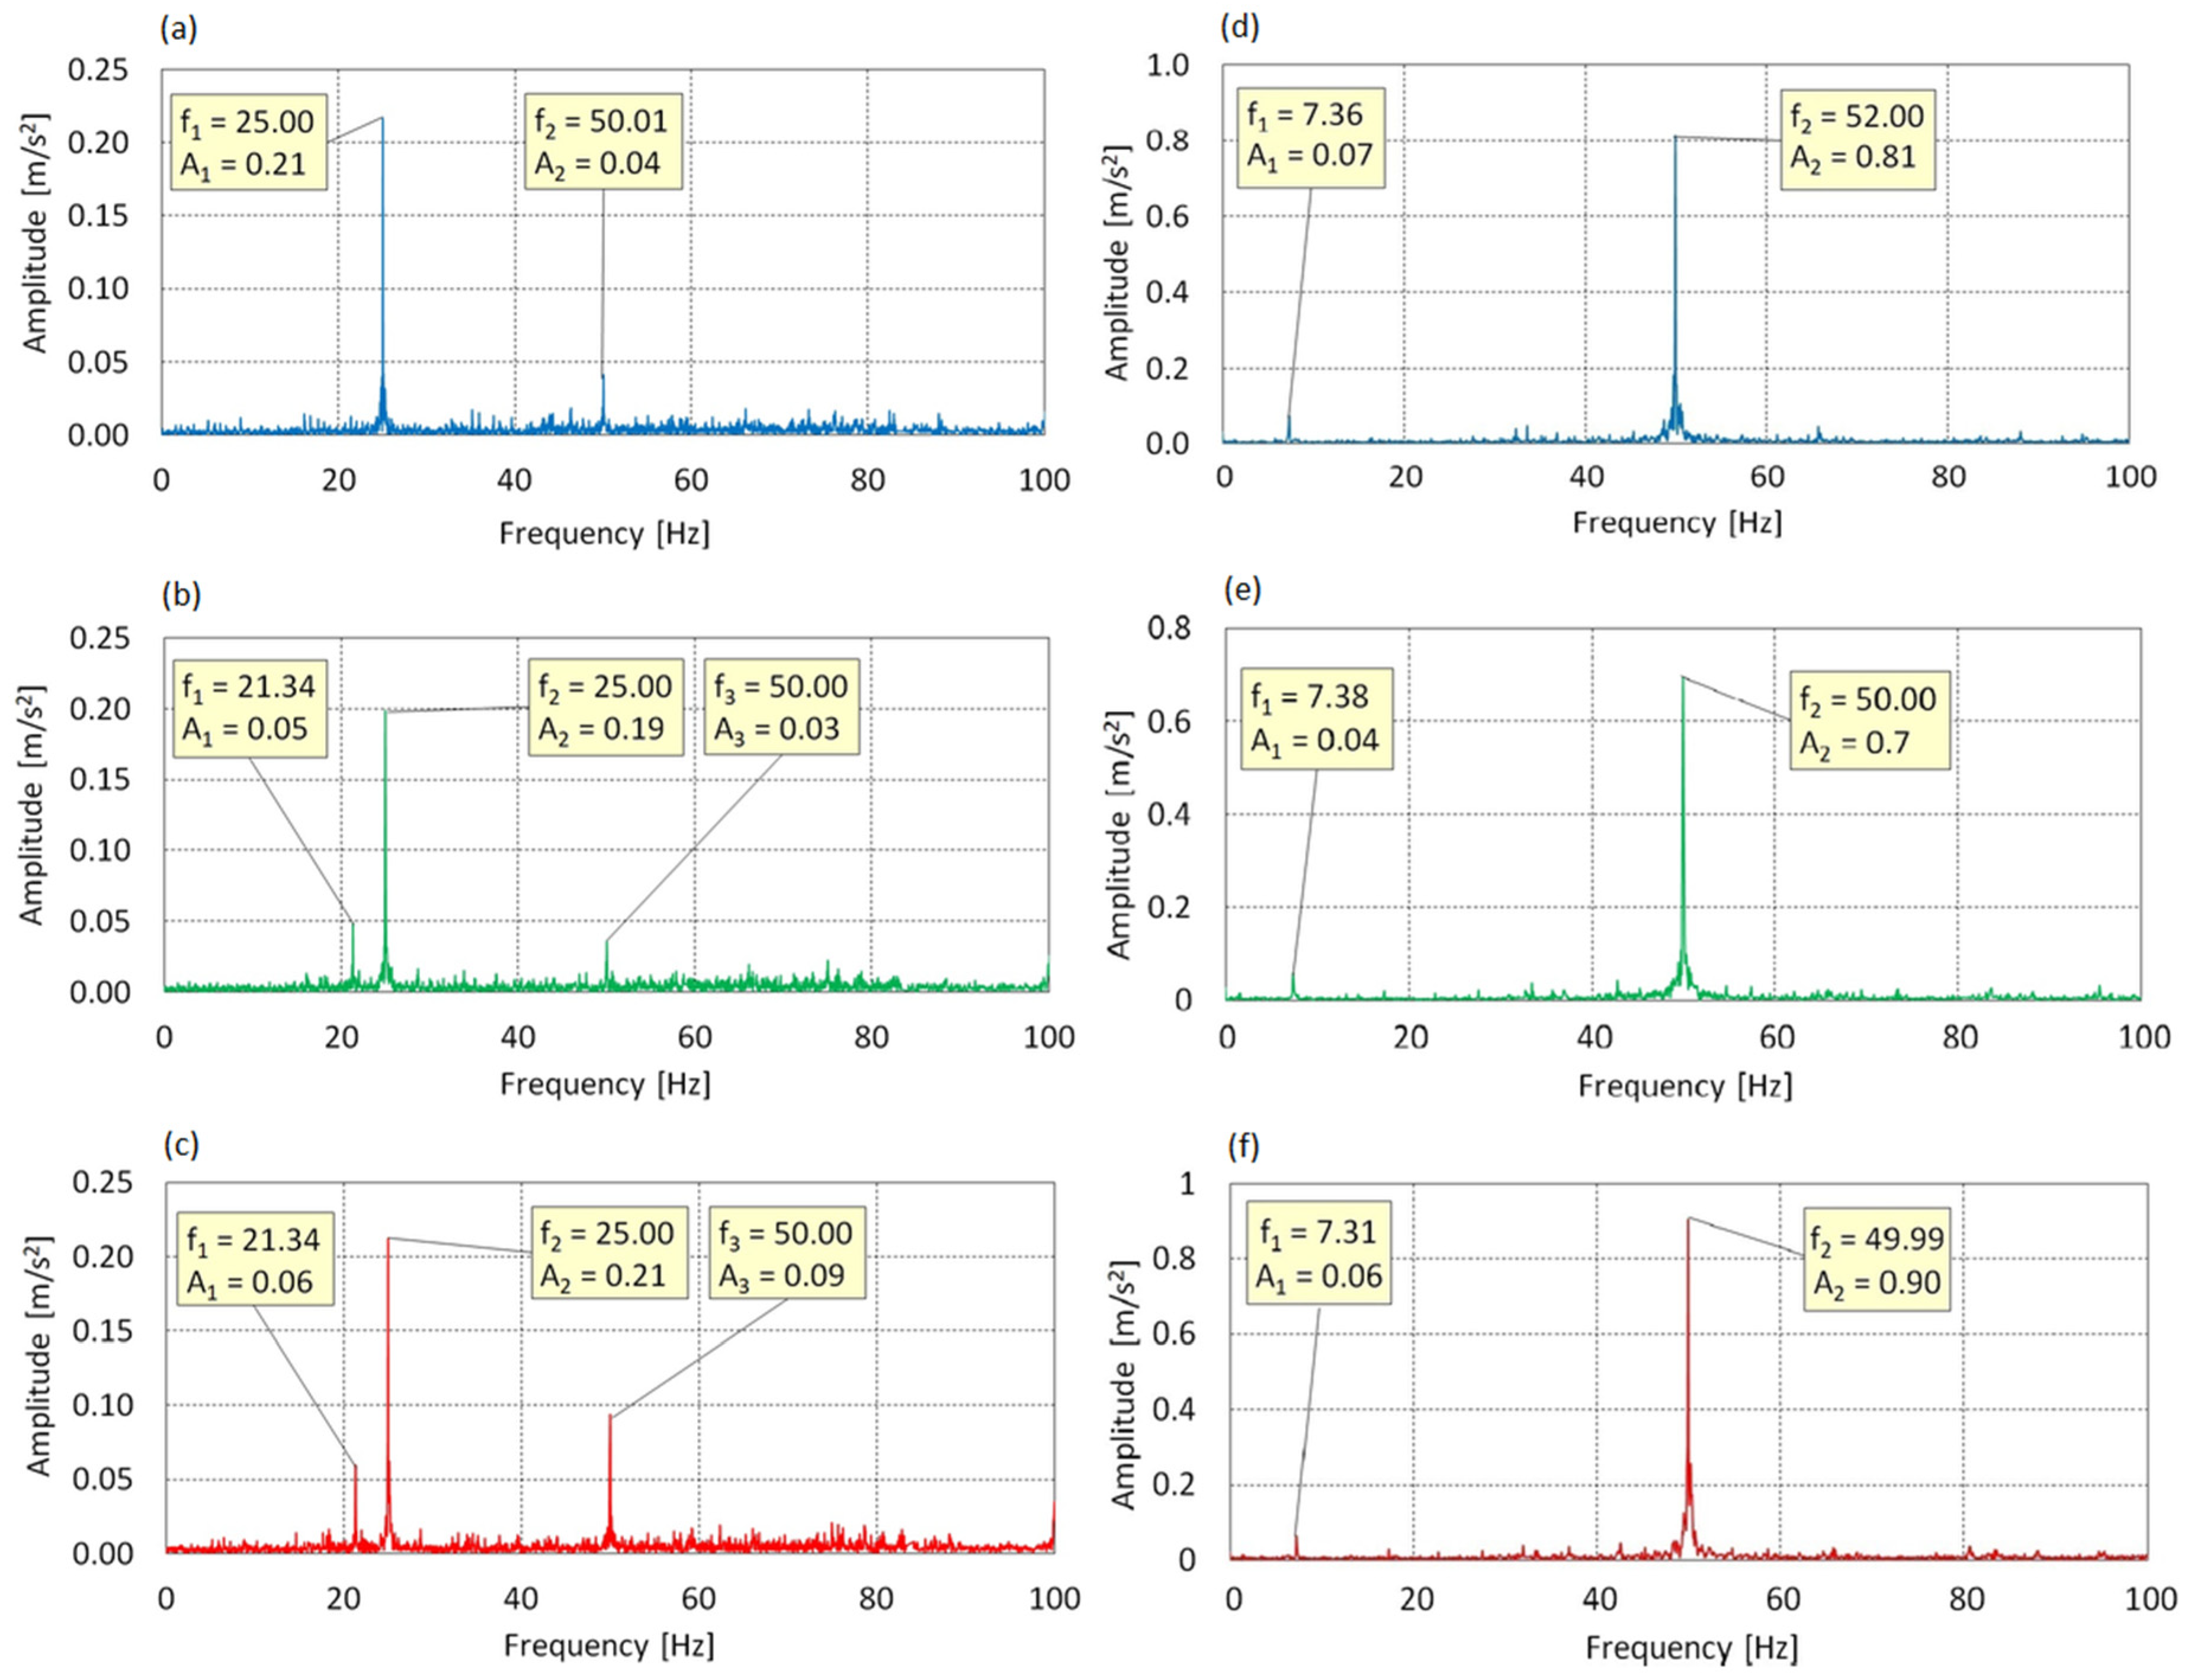
| 50 | 0 | 25.00 | 0.21 | 50.01 | 0.04 | - | - | - | - |
| 8 | 21.34 | 0.05 | 25.00 | 0.19 | 50.00 | 0.03 | - | - | |
| 16 | 21.34 | 0.06 | 25.00 | 0.21 | 50.00 | 0.09 | - | - | |
| 70 | 0 | 10.23 | 0.01 | 35.01 | 0.11 | 69.85 | 0.04 | - | - |
| 8 | 9.91 | 0.01 | 34.97 | 0.13 | 70.00 | 0.06 | - | - | |
| 16 | 34.96 | 0.17 | 69.84 | 0.07 | - | - | - | - |
| f0 (Hz) | AoA (°) | f1 (Hz) | A1 (m/s2) | f2 (Hz) | A2 (m/s2) | f3 (Hz) | A3 (m/s2) | f4 (Hz) | A4 (m/s2) | f5 (Hz) | A5 (m/s2) |
|---|---|---|---|---|---|---|---|---|---|---|---|
| 25 | 0 | 3.77 | 0.00 | 25.00 | 0.10 | 50.08 | 0.03 | - | - | - | - |
| 8 | 3.58 | 0.00 | 25.00 | 0.09 | 50.14 | 0.02 | 75.07 | 0.03 | - | - | |
| 16 | 3.28 | 0.00 | 24.98 | 0.11 | 50.02 | 0.09 | 62.16 | 0.02 | 75.00 | 0.03 | |
| 50 | 0 | 7.36 | 0.07 | 52.00 | 0.81 | - | - | - | - | - | - |
| 8 | 7.38 | 0.06 | 50.00 | 0.7 | - | - | - | - | - | - | |
| 16 | 7.31 | 0.06 | 49.99 | 0.90 | - | - | - | - | - | - | |
| 70 | 0 | 10.27 | 0.15 | 70.03 | 1.55 | - | - | - | - | - | - |
| 8 | 10.26 | 0.13 | 69.96 | 1.45 | - | - | - | - | - | - | |
| 16 | 10.30 | 0.10 | 69.92 | 1.75 | - | - | - | - | - |
| f0 (Hz) | AoA (°) | f1 (Hz) | A1 (m/s2) | f2 (Hz) | A2 (m/s2) | f3 (Hz) | A3 (m/s2) | f4 (Hz) | A4 (m/s2) |
|---|---|---|---|---|---|---|---|---|---|
| 25 | 0 | 3.54 | 0.00 | 25.00 | 0.10 | 50.00 | 0.02 | - | - |
| 8 | 3.24 | 0.00 | 25.00 | 0.09 | 50.07 | 0.02 | - | - | |
| 16 | 3.71 | 0.00 | 24.98 | 0.12 | 50.02 | 0.01 | 75.00 | 0.01 | |
| 50 | 0 | 7.36 | 0.02 | 50.02 | 0.70 | - | - | - | - |
| 8 | 7.31 | 0.06 | 49.99 | 0.69 | - | - | - | - | |
| 16 | 7.31 | 0.02 | 49.99 | 0.67 | 57.03 | 0.12 | - | - | |
| 70 | 0 | 10.27 | 0.45 | 70.03 | 0.65 | - | - | - | - |
| 8 | 10.26 | 0.32 | 69.96 | 0.64 | - | - | - | - | |
| 16 | 10.30 | 0.23 | 69.92 | 0.82 | - | - | - | - |
Disclaimer/Publisher’s Note: The statements, opinions and data contained in all publications are solely those of the individual author(s) and contributor(s) and not of MDPI and/or the editor(s). MDPI and/or the editor(s) disclaim responsibility for any injury to people or property resulting from any ideas, methods, instructions or products referred to in the content. |
© 2025 by the authors. Licensee MDPI, Basel, Switzerland. This article is an open access article distributed under the terms and conditions of the Creative Commons Attribution (CC BY) license (https://creativecommons.org/licenses/by/4.0/).
Share and Cite
Kliza, R.; Wendeker, M.; Drozd, P.; Siadkowska, K. Vibration Analysis of Aviation Electric Propulsion Test Stand with Active Main Rotor. Sensors 2025, 25, 6547. https://doi.org/10.3390/s25216547
Kliza R, Wendeker M, Drozd P, Siadkowska K. Vibration Analysis of Aviation Electric Propulsion Test Stand with Active Main Rotor. Sensors. 2025; 25(21):6547. https://doi.org/10.3390/s25216547
Chicago/Turabian StyleKliza, Rafał, Mirosław Wendeker, Paweł Drozd, and Ksenia Siadkowska. 2025. "Vibration Analysis of Aviation Electric Propulsion Test Stand with Active Main Rotor" Sensors 25, no. 21: 6547. https://doi.org/10.3390/s25216547
APA StyleKliza, R., Wendeker, M., Drozd, P., & Siadkowska, K. (2025). Vibration Analysis of Aviation Electric Propulsion Test Stand with Active Main Rotor. Sensors, 25(21), 6547. https://doi.org/10.3390/s25216547


