2.1. IPS Conditioning Circuitry Analysis Suitable for Embedded Technology
To analyze the circuit, the inductive proximity sensor is modelled with its inductivity, L
o, and its equivalent series resistance, r
o. The two circuit parameters depend on the coupling (therefore, the distance) and temperature [
13]. In parallel with the coil, the capacitor C
P is connected, and the circuit L
o–r
o–C
P forms a resonant circuit (tank circuit). When a metallic object is placed in the vicinity of the coil, part of the electromagnetic field energy produced by L
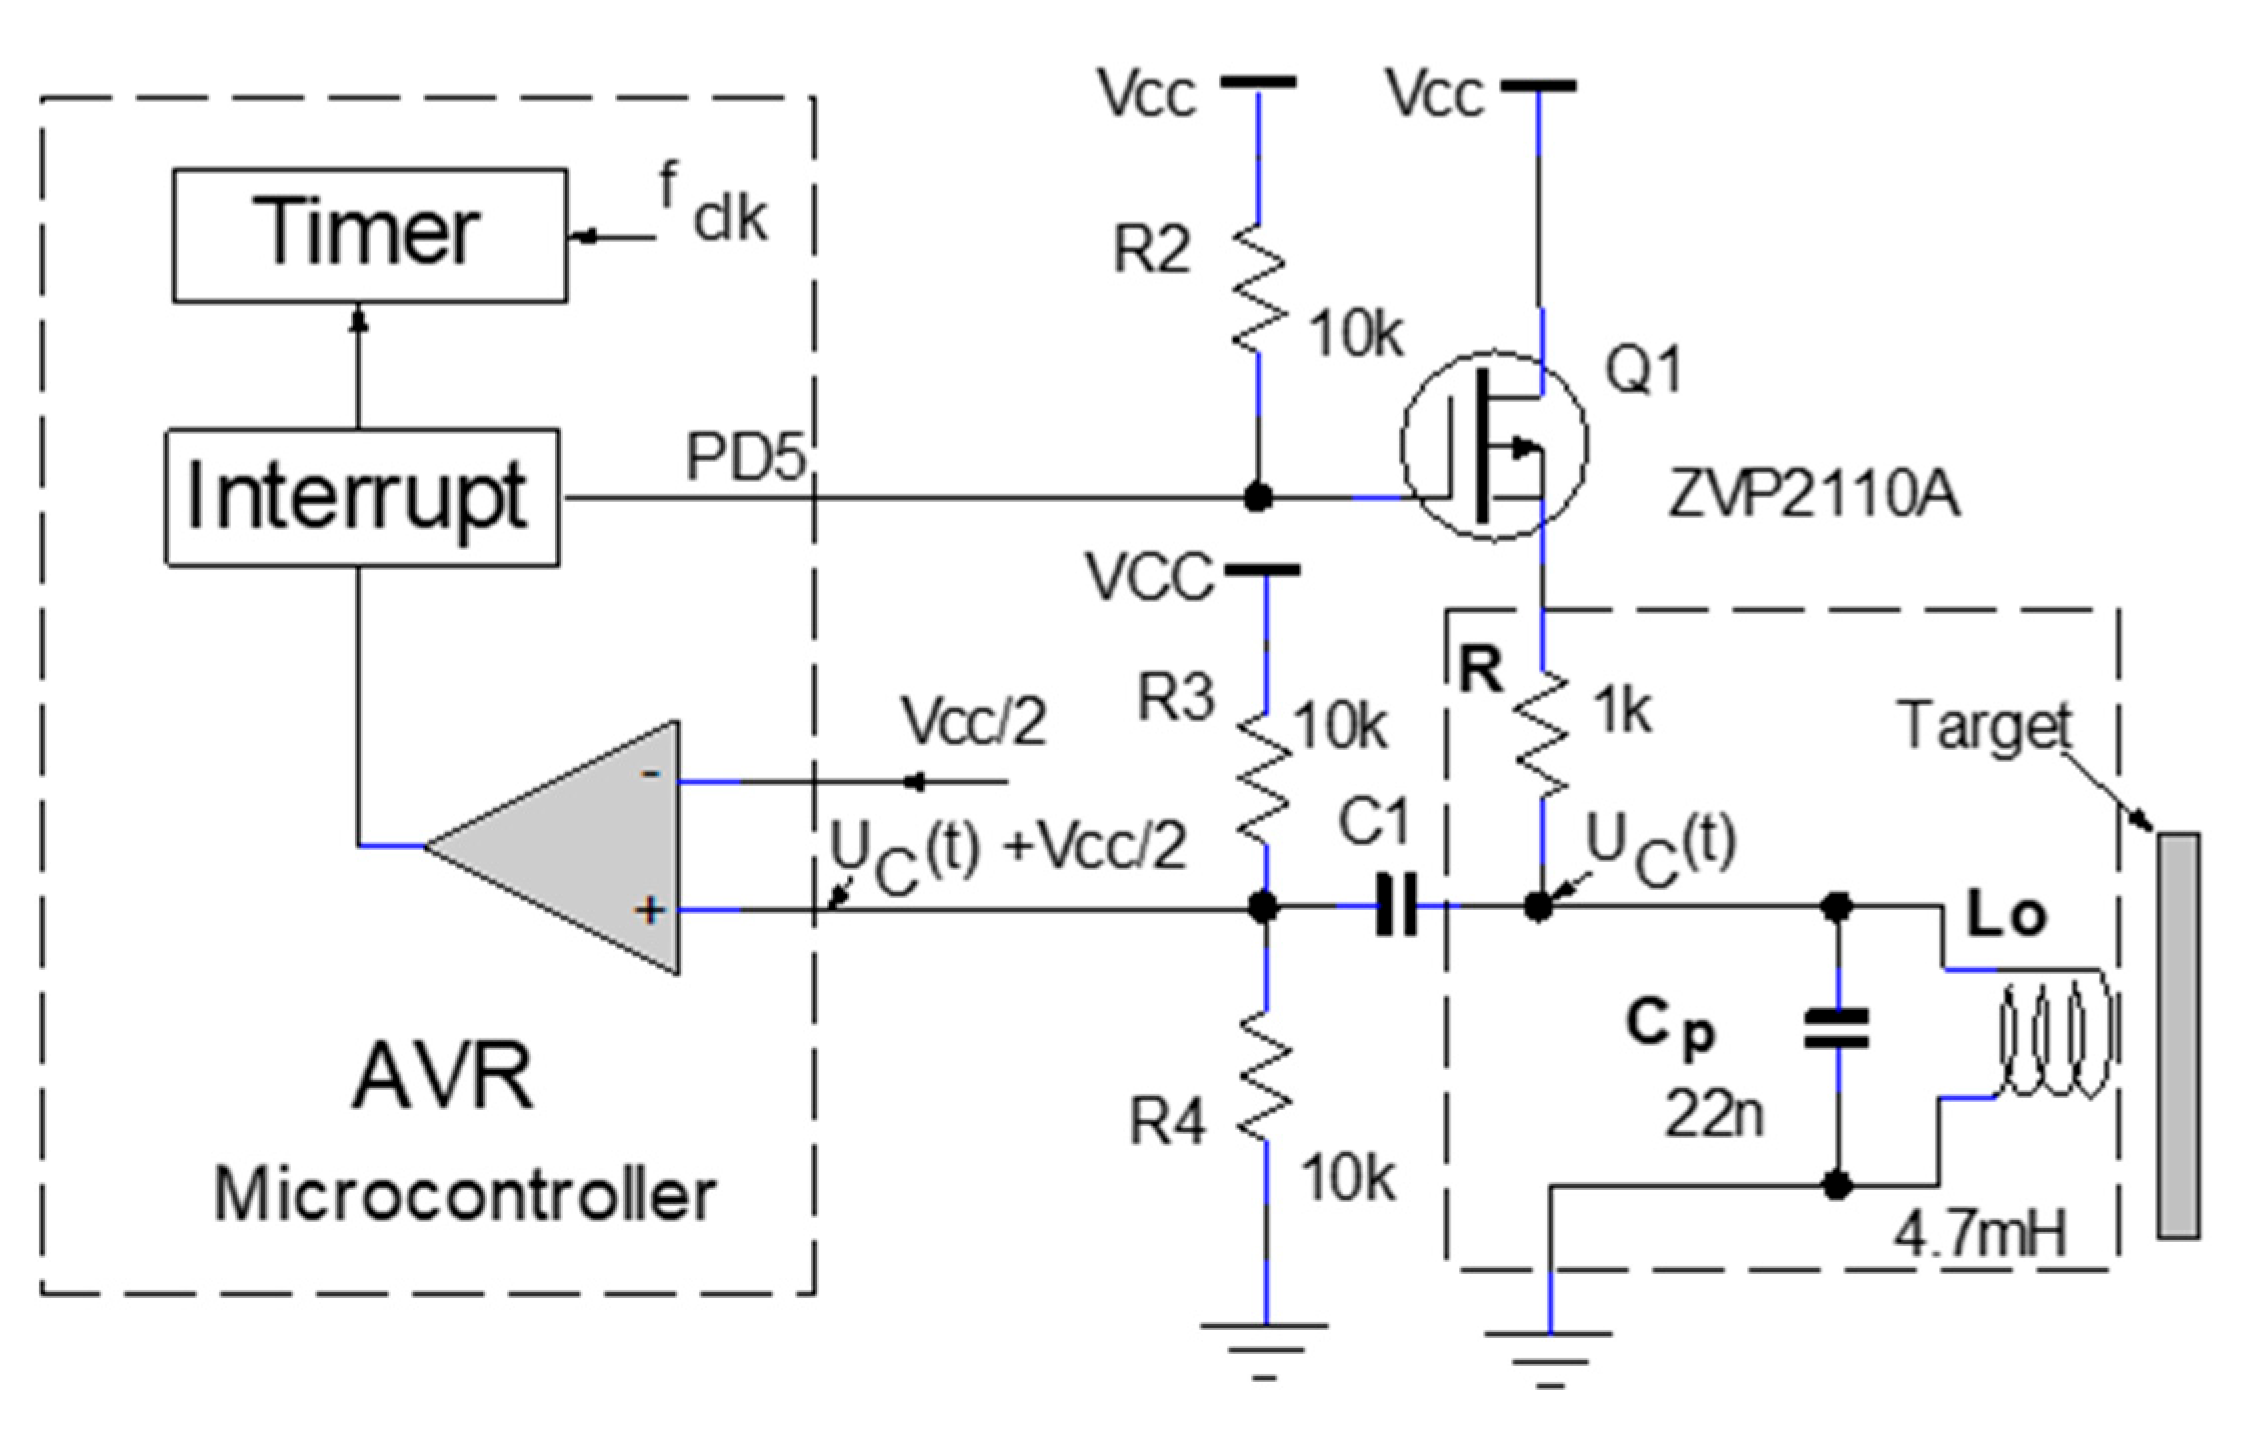
o is transferred to the conductive object. Due to energy transfer, a decrease in inductance and an increase in resistance is obtained. The electrical circuit proposed for distance sensing is shown in
Figure 1.
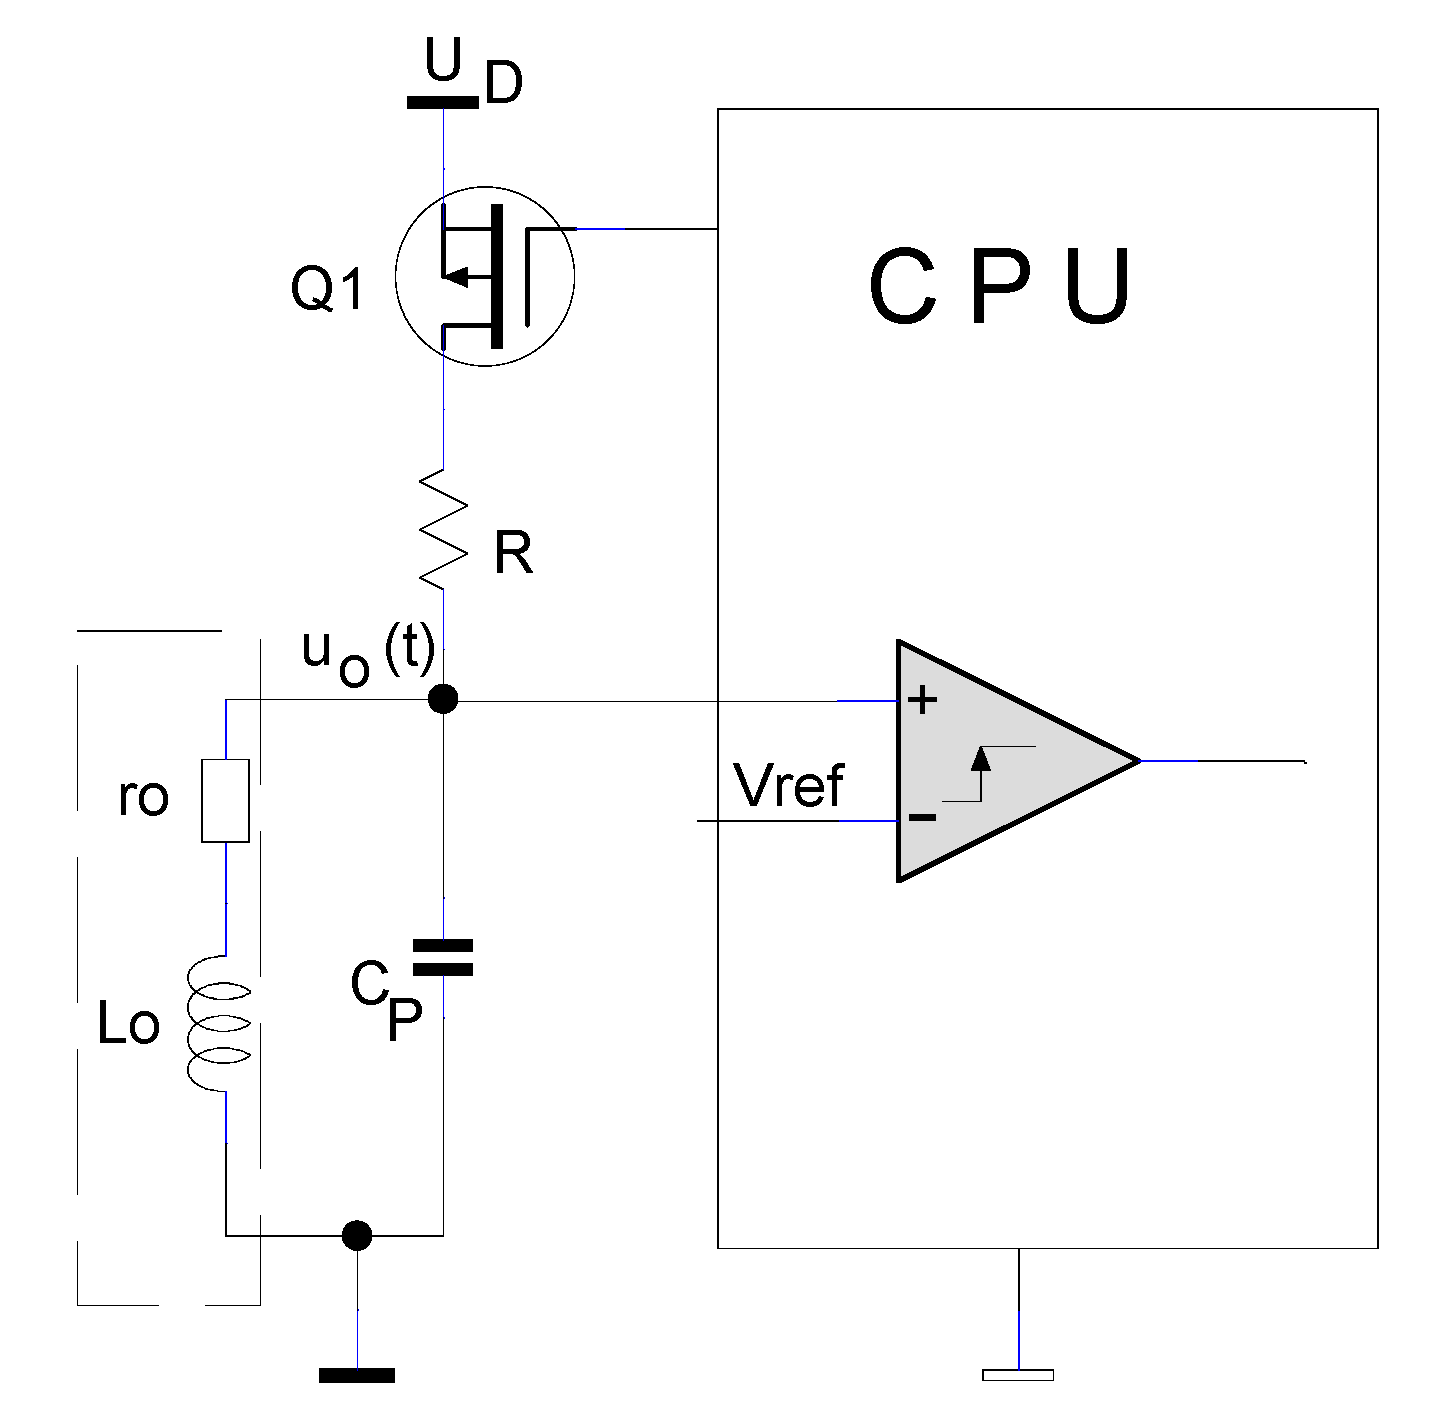
The capacitor CP has a fixed value, chosen to be much higher than the parasitic capacity of the coil. Considering that CP and Lo are in parallel, the parasitic capacity of the inductor can be neglected. The driving logic with the processing unit forms the loading circuit for the sensing coil. The resistance R, together with the coil’s own resistance ro, limits the charging current of the coil Lo, responsible for creating the magnetic field.
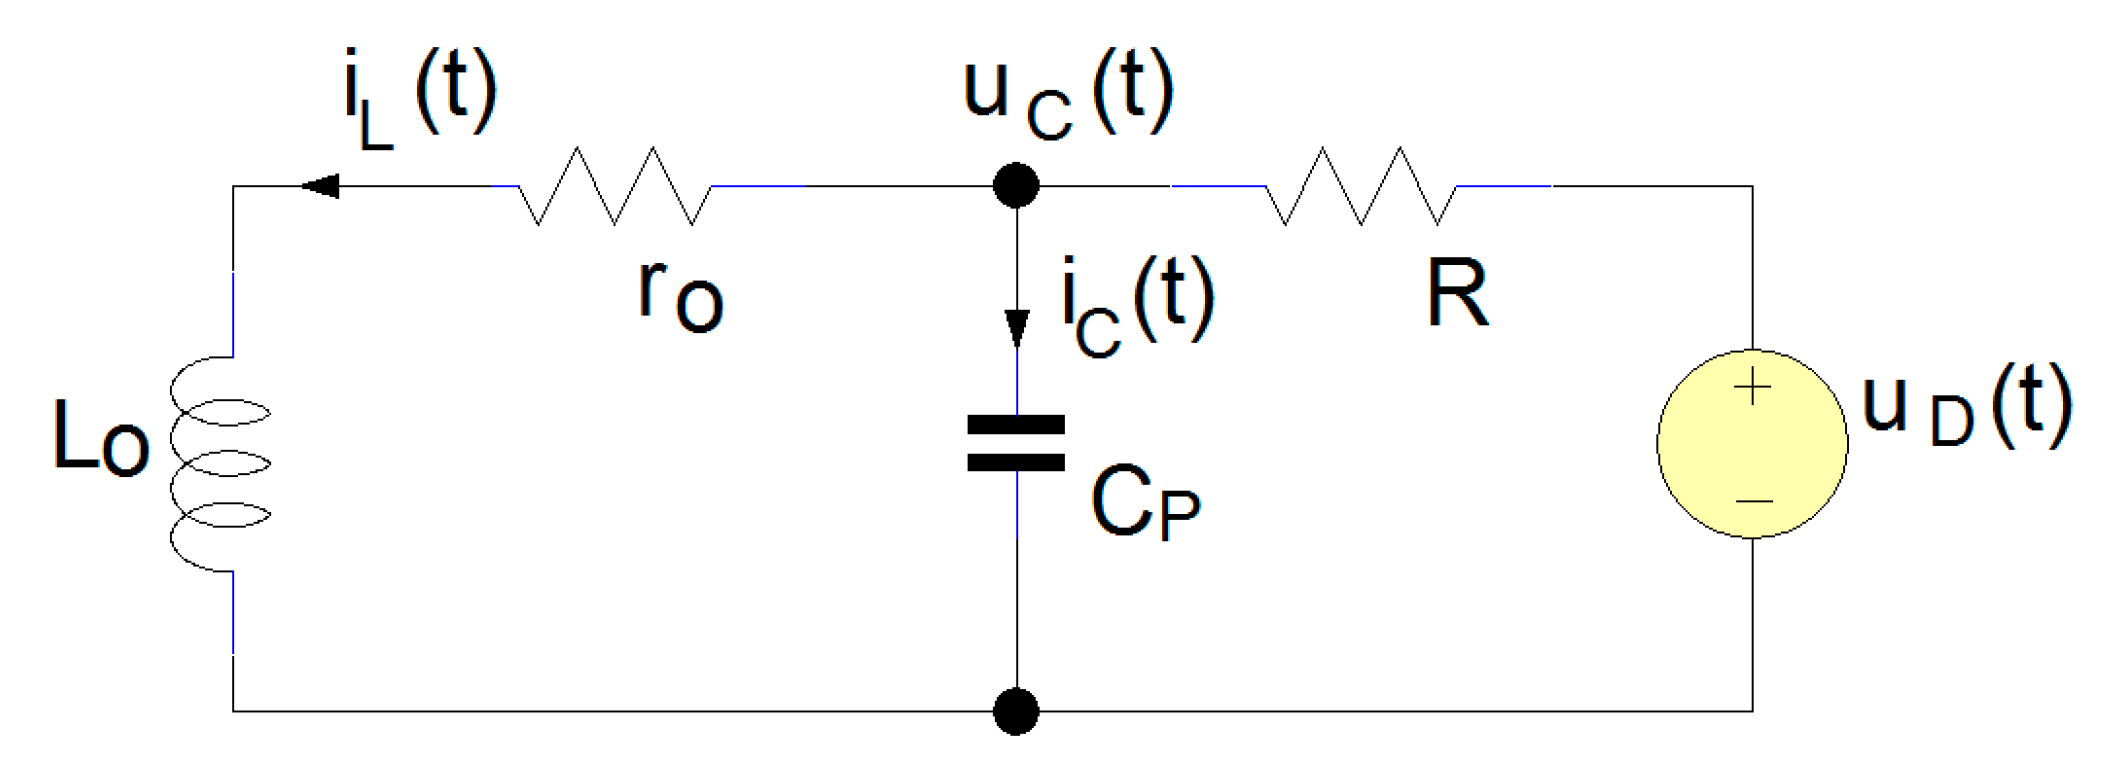
In
Figure 2, the equivalent sensor circuit is presented, having the command signal
uD(t), depending on the state of the Q transistor in
Figure 1. From the perspective of the circuit formed by the L
o, r
o, and C
p, the applied signal
uD(t) is a step input voltage. The first loop contains C
P, R, and
uD(t) and the secondary loop L
o, r
o, and C
p. If we apply Kirchhoff’s voltage law, the equation system (1) is obtained.
Replacing the voltage–current relations into Equation (1), the differential equations of the equivalent circuit are as follows:
The term
iL in the above equation should be eliminated by substituting it from Equation (2a) into Equation (2b). This substitution yields a second-order differential equation, with the output voltage at the measurement point
uC as the variable.
The general solution of the nonhomogeneous equation in (3) is the sum of the general solution
of the related homogeneous equation and the particular solution
of the nonhomogeneous equation, as expanded in (4):
The roots of the characteristic equation are as follows:
The waveform response of the output signal at the measurement point depends on the solutions of characteristic Equation (5). There are three cases to consider: when the two roots are distinct and real, the output signal response will be overdamped. Initially, the voltage at the measurement point will increase due to the capacitor charging and then decrease due to the inductor charging. If the roots are real and equal, the second-order system response will be critically damped. Finally, if the roots are distinct, complex conjugates, the second-order system response will be underdamped, and the output signal will exhibit damped oscillations.
All parameters of the electronic components are real, positive values. To achieve an underdamped waveform for the output signal, we will analyze the influence of the sensing coil inductance L
o and the capacitance C
P on the system’s behavior. The circuit must satisfy the following conditions.
The inductance of the sensing coil is not a constant parameter; in fact, its value changes as the detected material moves closer. Equation (6) is an upward-opening parabola that defines the maximum variation in inductance required to achieve underdamped behavior, as illustrated in
Figure 3. Both ends of the inductance range are determined by the zeros of Equation (6), with these points corresponding to the solutions of Equation (6).
The inductance L
o should be found in the interval [L
o,1, L
o,2], both extreme points being dependent on the capacitor C
P value; a low C
P value would reduce the graph area where the second-order system would have an underdamped response. Outside the region marked in
Figure 3, Equation (6) is positive,
, and the second-order system will exhibit overdamped behavior.
Furthermore, the values of the electronic components were selected to ensure compliance with the conditions expressed in Equation (6). The core element of the equivalent circuit is the inductance of the sensing coil. In our experimental setup, the initial inductance of the sensing coil is 4.7 mH, exhibiting a temperature drift of 350 ppm/°C. The inductance value decreases by up to 10% from its initial value, Lo. The equivalent series resistance of the coil, ro, is 16 Ω, with a temperature drift of 3900 ppm/°C. The coil used in our experiment has a cylindric geometry with 5.5 mm internal diameter and 8.5 mm external diameter; it is made with a copper wire of 0.16 mm diameter making 350 turns, on a ferrite core. The parallel capacitor CP has a value of 22 nF, with a tolerance of 5%. This capacitance is significantly larger than the measured parasitic capacitance of the sensing coil, approximately 15 pF, allowing the parasitic effects to be neglected. The circuit’s current-limiting resistor R was selected as 1 kΩ to ensure that the current remains within the maximum allowable limit specified by the manufacturer.
Considering the damping effect introduced by the resistance in the circuit, the solution to the system of equations can be determined based on the damped response:
In the above equation, the roots of the characteristic equation were simplified and expressed in the form λ1,2 = α1 ± jωd1, where ωd1 represents the damped oscillation frequency of the circuit. The constants of the general solution, A1 and B1, can be determined based on the initial conditions, while the particular solution, uC(t)P, can be calculated through the input signal.
At the initial moment, when the driving logic is inactive (t = 0), the parallel capacitor C
P and the sensing coil L
o are fully discharged. The system thus starts from a zero-state condition, and the rising edge of the step input voltage generates a zero-state response. When the transistor switches on (t = 0
+), a step voltage U
D is applied to the equivalent circuit, where the inductance L
o is considered a short circuit and the capacitor C
P is treated as an open circuit. Under these conditions, the output voltage u
C is influenced only by the series resistance of the inductance r
o, the current-limiting resistance R, and the applied step voltage U
D. The particular solution u
C(t)
P of the corresponding differential equation is given by the following:
In the zero-state condition of the equivalent circuit, the current through inductance is zero and the capacitor is discharged, and the zero-state constraints of the system are as follows:
By substituting the initial condition into u
C(t) in Equation (8), the constant A
1 is calculated as follows:
If, in Equation (2a), the initial conditions are substituted, the equation can be rewritten as follows:
By substituting the initial conditions into the derivative of the solution, as given in Equation (8), the following expression is obtained:
By combining Equations (12) and (13) for coefficients A
1 and B
1, the following constraint is obtained:
By combining Equations (11) and (14), the constants of the general solution and the solution of the initial system are as follows:
Starting from the zero-state initial condition and applying a step voltage through the driving logic, the capacitor starts to charge, and a current starts to flow through the inductance. The mathematical expression for inductance current, given in Equation (16), is derived from Equation (2a) by replacing the capacitor charging current as
.
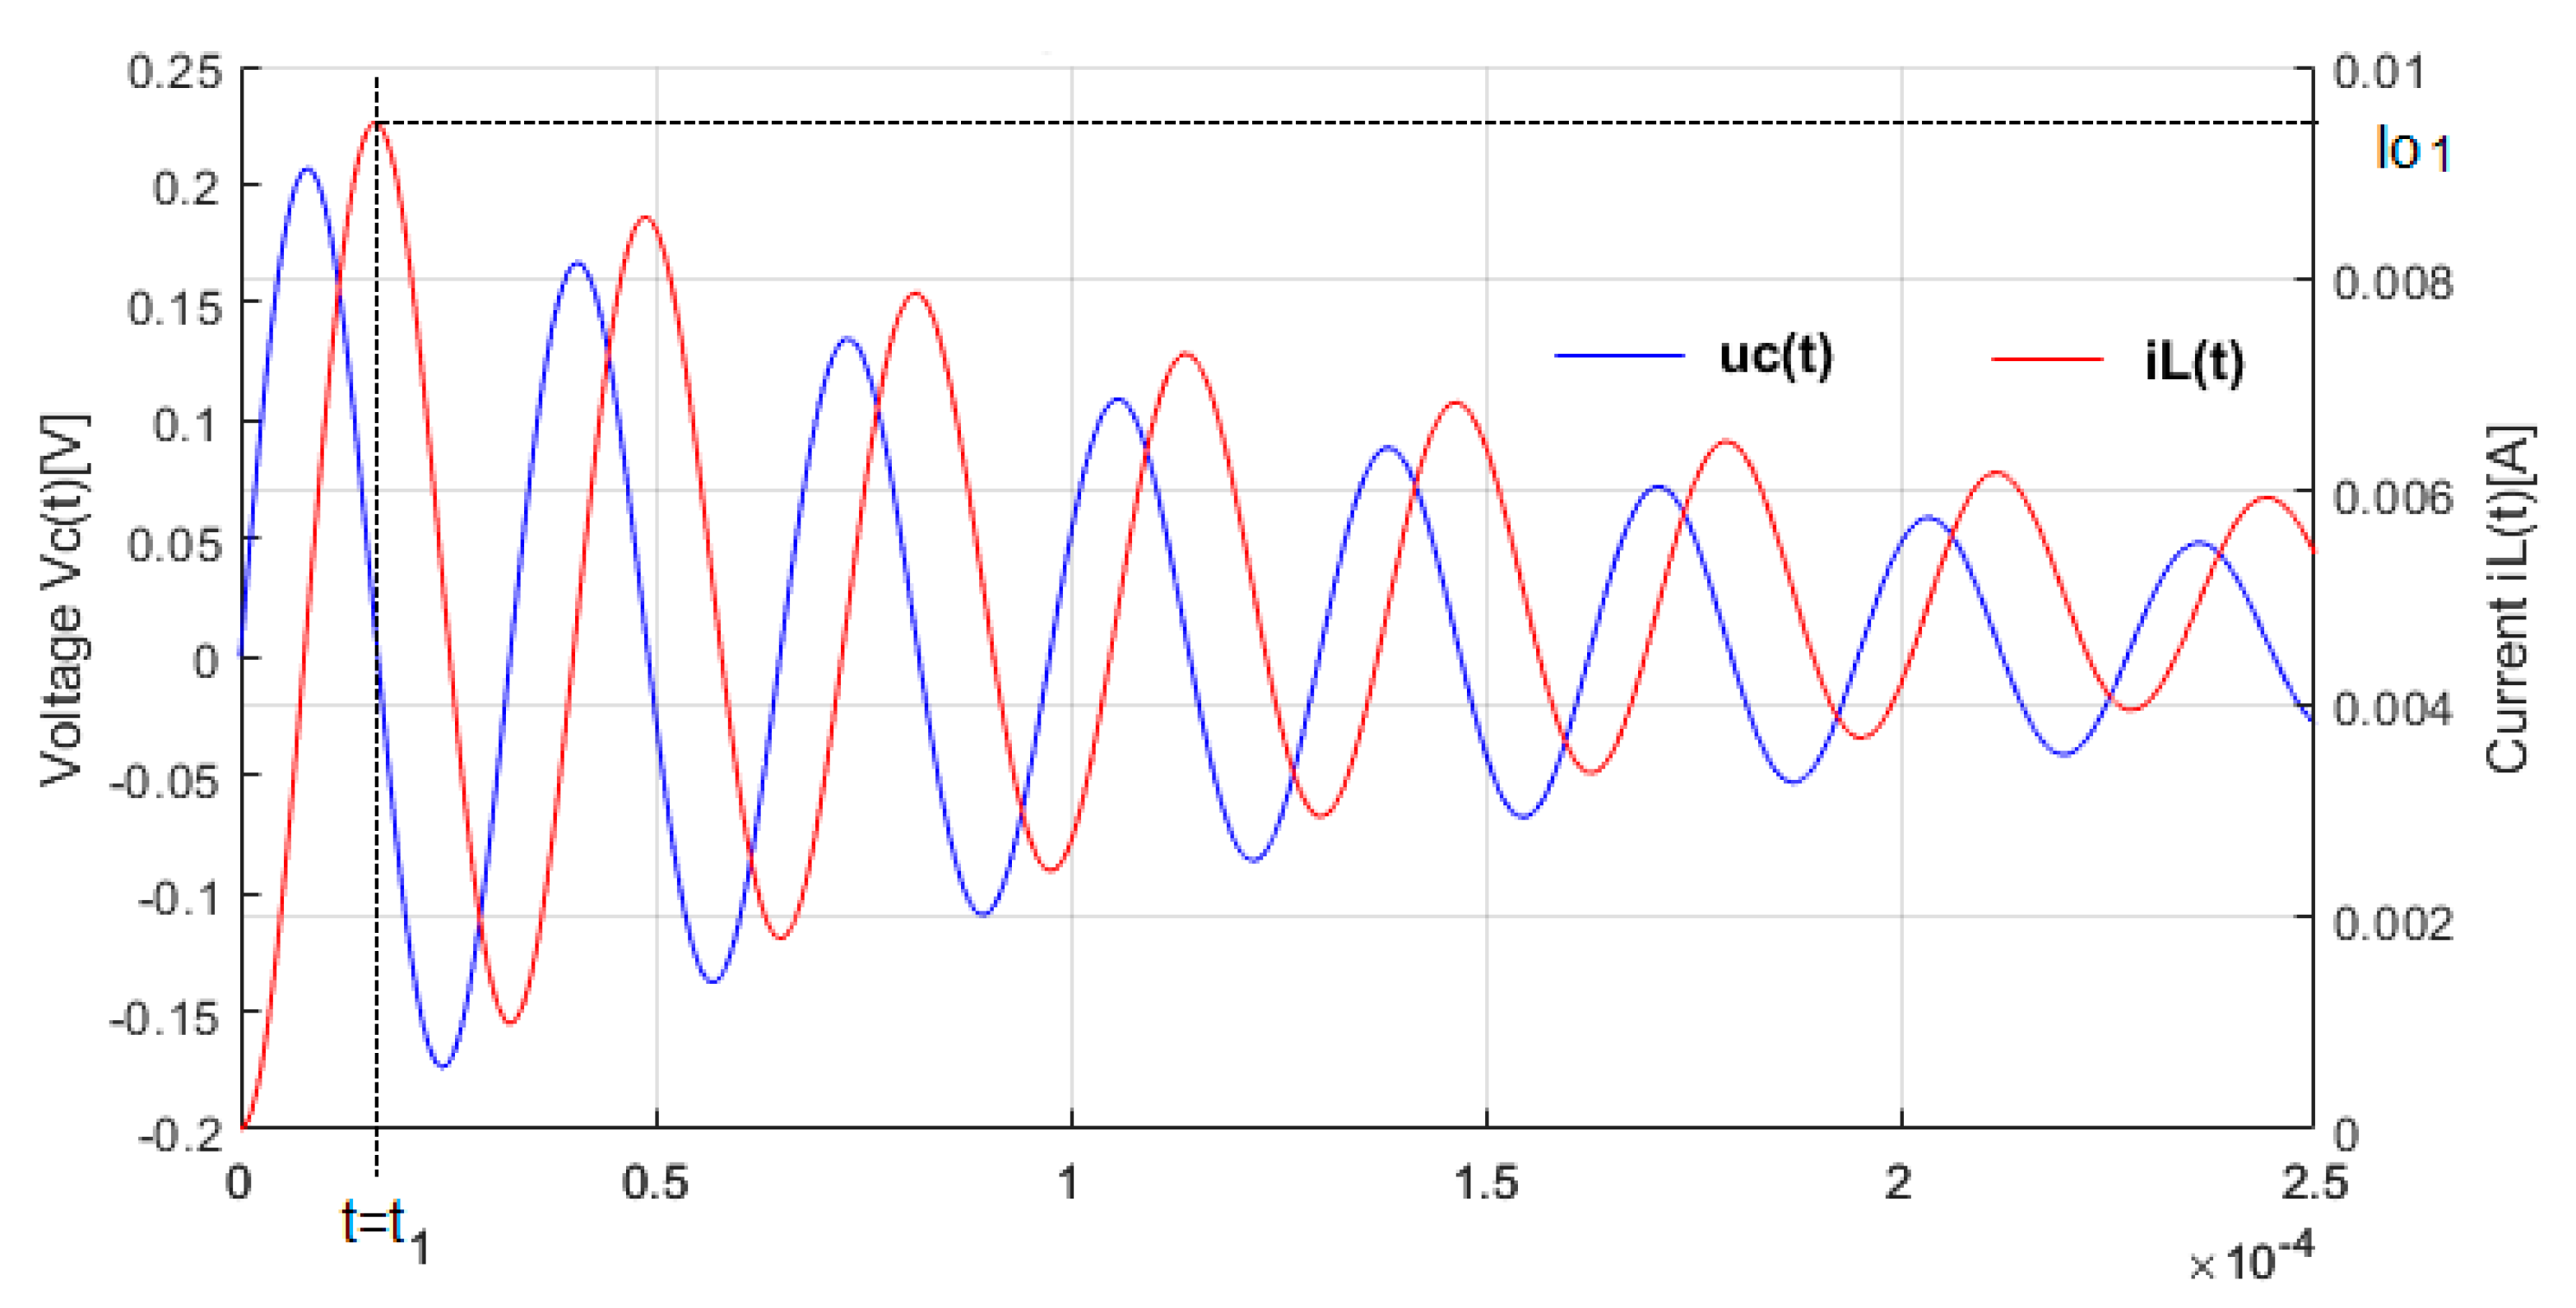
When a step voltage is applied, the voltage response and the current through inductance are underdamped sinusoidal waves, as shown in
Figure 4.
Because in our setup the coefficient ∝
1 is negative, the amplitudes of u
C(t) and i
L(t) decrease gradually and become zero at t→∞, when all the energy is consumed as losses by the equivalent series resistance. The inductance L
o is considered constant, so the energy transfer issue which enhances the consumed energy was not considered. In compliance with Equation (15), the voltage u
C(t) is shifted with an offset voltage dependent on the sensing coil’s equivalent series resistance, r
o. If the resistance that appears between the coil loops is neglected (
), then the output voltage would be centered on 0 V. The oscillation frequency of the output voltage is
. Based on these considerations, it can be estimated that the voltage across the capacitor is zero and the current through the inductance is maximum,
, at half of the oscillation period, when
,
. The value of the peak current through the inductance is defined by Equation (17).
During the discharging process, the capacitor generates a current that flows into the inductor. The peak current through the inductor, , exceeds the value limited by the resistance R.
This work presents a measurement system designed for distance detection using the principle of inductive sensing, where electromagnetic interaction occurs between a metallic target and the sensor’s primary transducer. The system incorporates a microcontroller as the central processing unit (CPU), which is responsible both for generating a continuous oscillating output signal and for determining the distance based on this signal. At the moment when
, corresponding to the zero crossing of the voltage in the
circuit, the external voltage source is disconnected. The equivalent circuit of the inductive proximity sensor with the driving source disconnected is shown in
Figure 5.
When the driving source is disconnected, then the first stage ends at
, and the second stage begins,
. In the second stage, the current flows through inductance and begins to charge the capacitor. Applying Kirchhoff’s Voltage Law, the next equation is obtained.
Taking into consideration the current
and substituting current–voltage relationships, the following equation can be obtained:
If we consider the capacitor C
P discharged at the beginning of this stage (the driving source
is disconnected at zero crossing of voltage
), the differential equation of the equivalent circuit is as follows:
The characteristic equation corresponding to differential Equation (20) has the following roots:
To maintain the oscillating response of the circuit in the second stage, when the driving source
is disconnected, an underdamped response is needed. The roots of the characteristic equation must be a pair of complex conjugates. The parameters of the equivalent circuit shown in
Figure 5 must satisfy the following condition:
The above-mentioned constraint establishes a relationship between the elements of equivalent circuit from
Figure 5.
The parallel capacitor C
P is selected based on the minimum inductance value within the measurement range. The solution of differential Equation (20), which describes the system’s behavior having the driving source disconnected, is as follows:
In the initial state condition of the second stage, the current through inductance is maximum and the capacitor is discharged, and the zero-state constraints of the system are as follows:
By substituting the initial condition into equation of the inductance current, in Equation (24), the constant
is calculated as follows:
The derivative of Equation (24) is calculated and brought into the initial conditions as follows:
Equation (18) is substituted into the initial condition as follows:
By combining Equations (26)–(28), the constant B
2 can be determined, and the solution of the differential equation is the following:
The voltage from the measurement point is equal to the voltage across the capacitor. The mathematical equation for u
C is obtained if, in Equation (18), the inductance current is substituted with the one in Equation (29).
The negative sign of the voltage from the measurement point defined by Equation (29) suggests that the signal is appended to the signal u
C, defined by Equation (15), with a negative alternance of the signal. Starting from the zero state, the voltage across the capacitor decreases to a negative value; the next zero value takes place at
,
. When the voltage across the capacitor is zero, the current through the circuit reaches the negative maximum value, I
02. The peak current is obtained by substituting the time into Equation (29) with
.
When the driving source is disconnected, the second stage ends at time t
2. The initial current through the inductance will be represented by the current I
02 if the driving source is reconnected to the circuit. When the voltage across the capacitor is zero
, the control voltage U
D is connected back into the circuit to preserve the sinusoidal shape of the signals. Furthermore, by replacing the initial current
from Equation (12) with I
02, the equation of voltage from the measurement point can be found using the results of earlier analyses if we consider the control voltage U
D connected in the circuit. Lastly, the following relationships can be used to determine the voltage from the measurement point and the current through the inductance based on the driving logic state.
If the circuit’s parameters are kept constant, the circuit can oscillate with a constant amplitude if energy is added periodically.
Figure 6 presents the mathematical simulation of the circuit in MATLAB modelled using Equation (32), the forced oscillating regime, the representation of the control voltage U
D(t), the voltage on the capacitor u
c(t), and the current through the coil i
L(t).
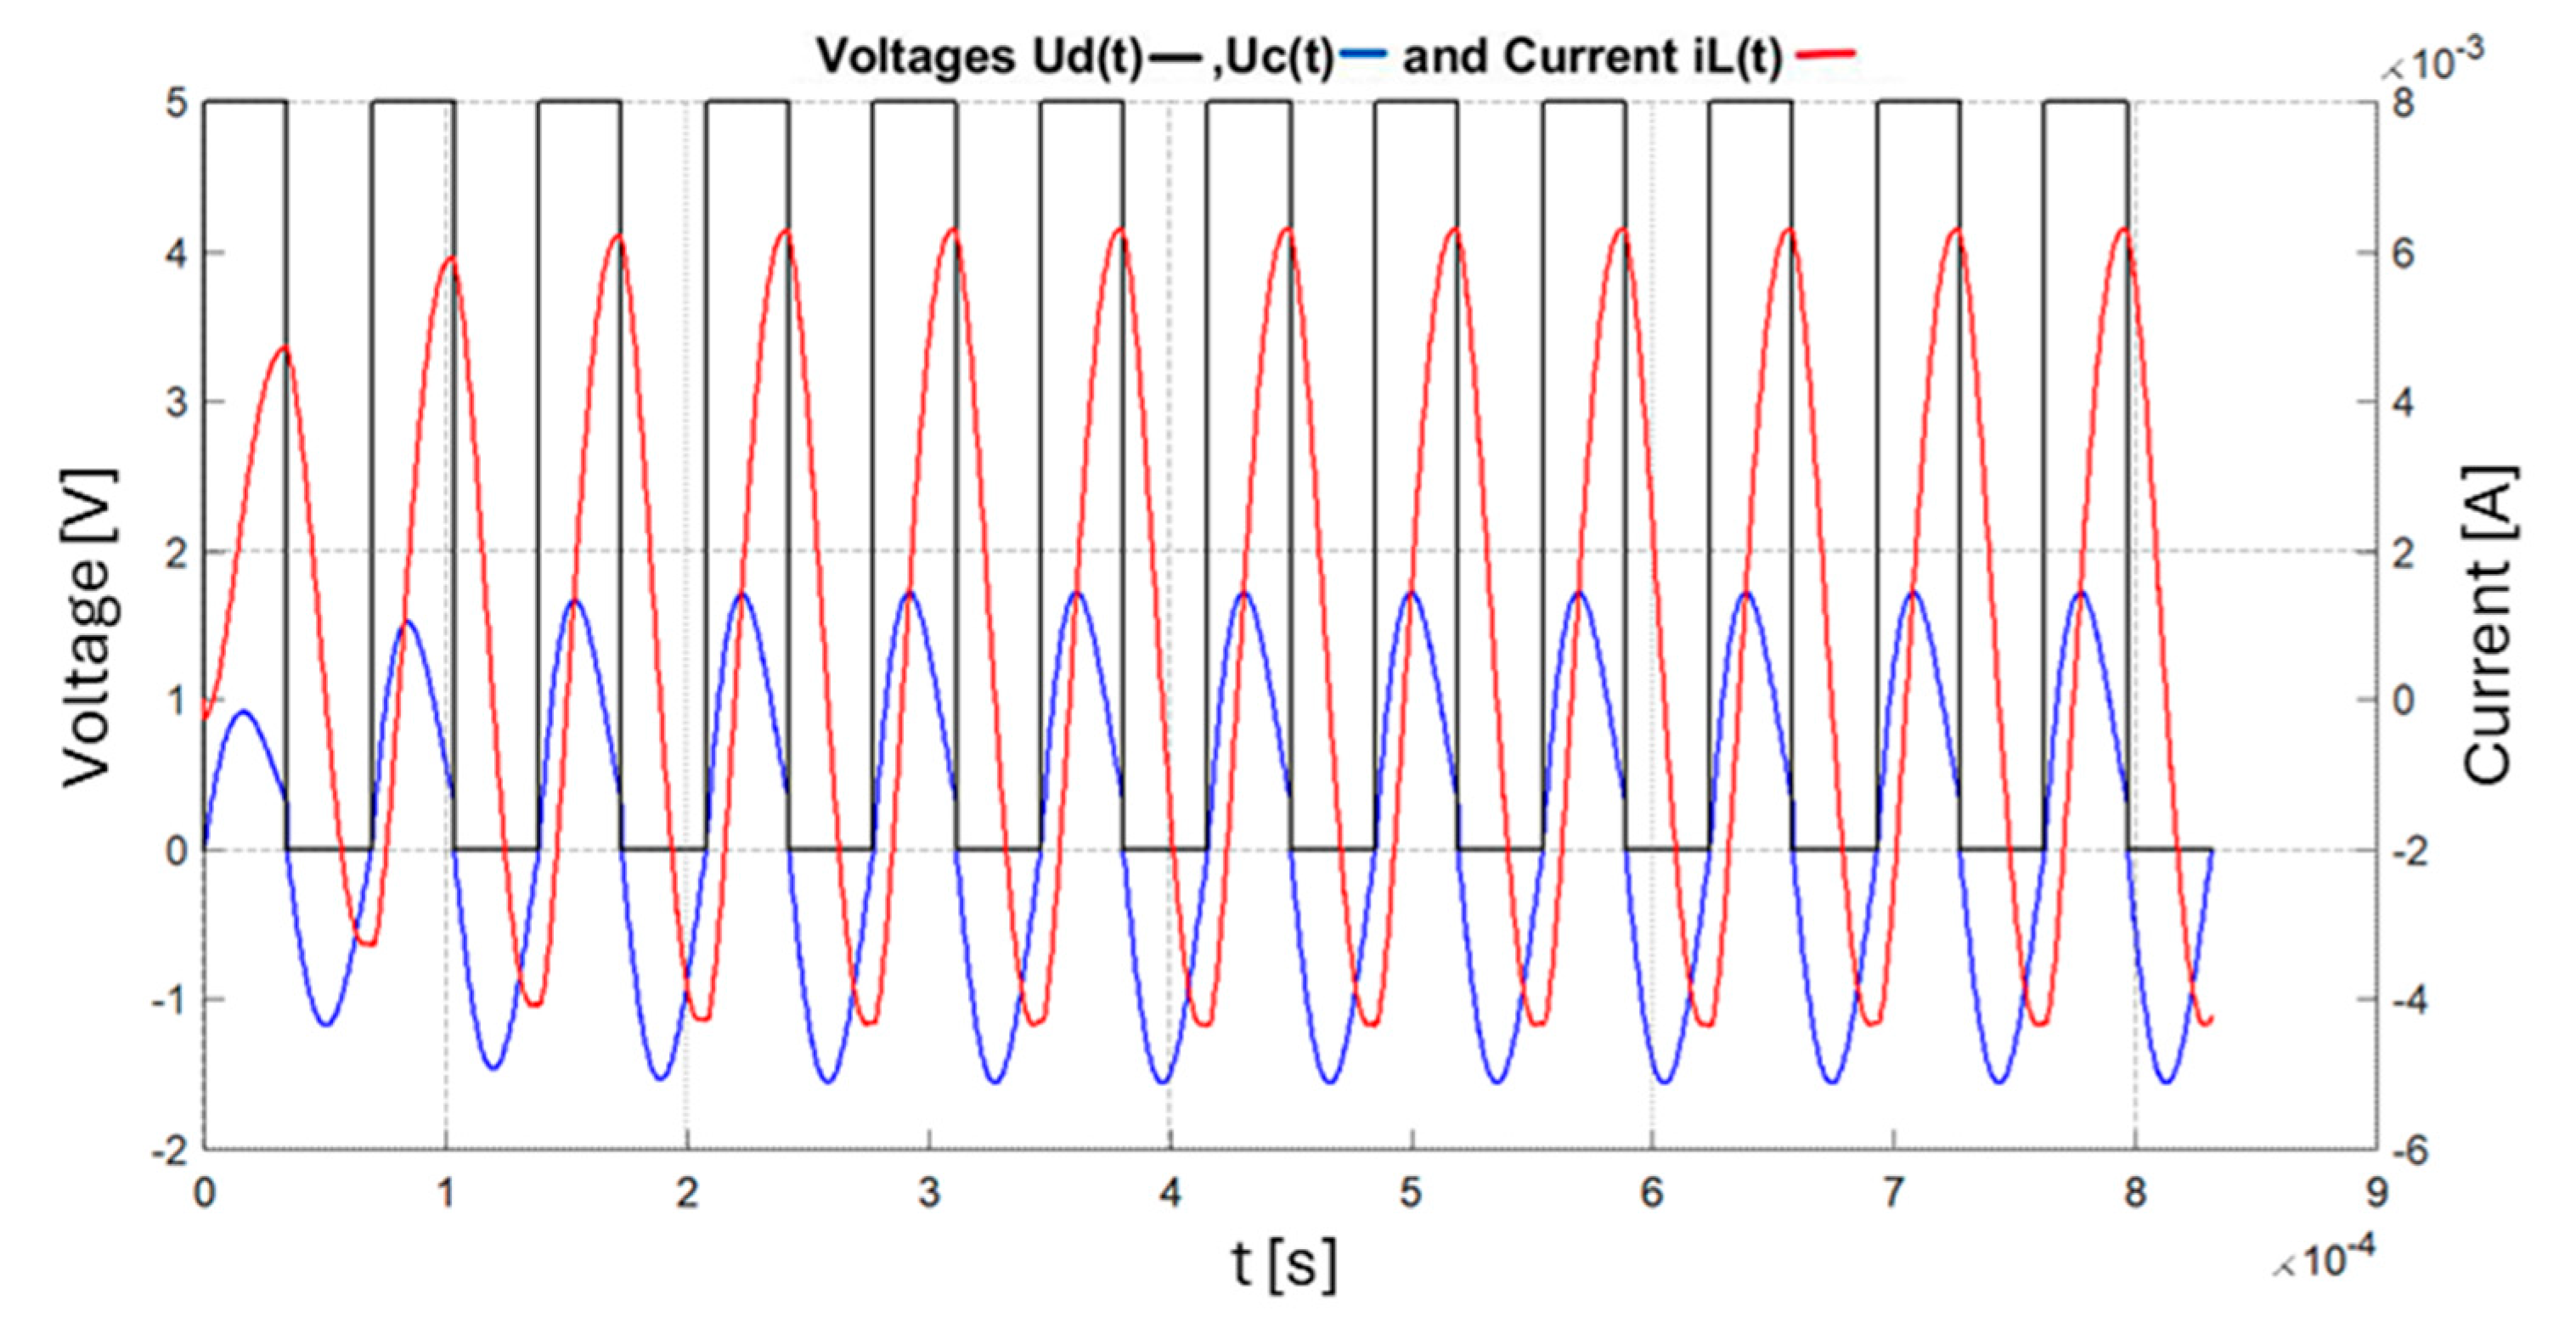
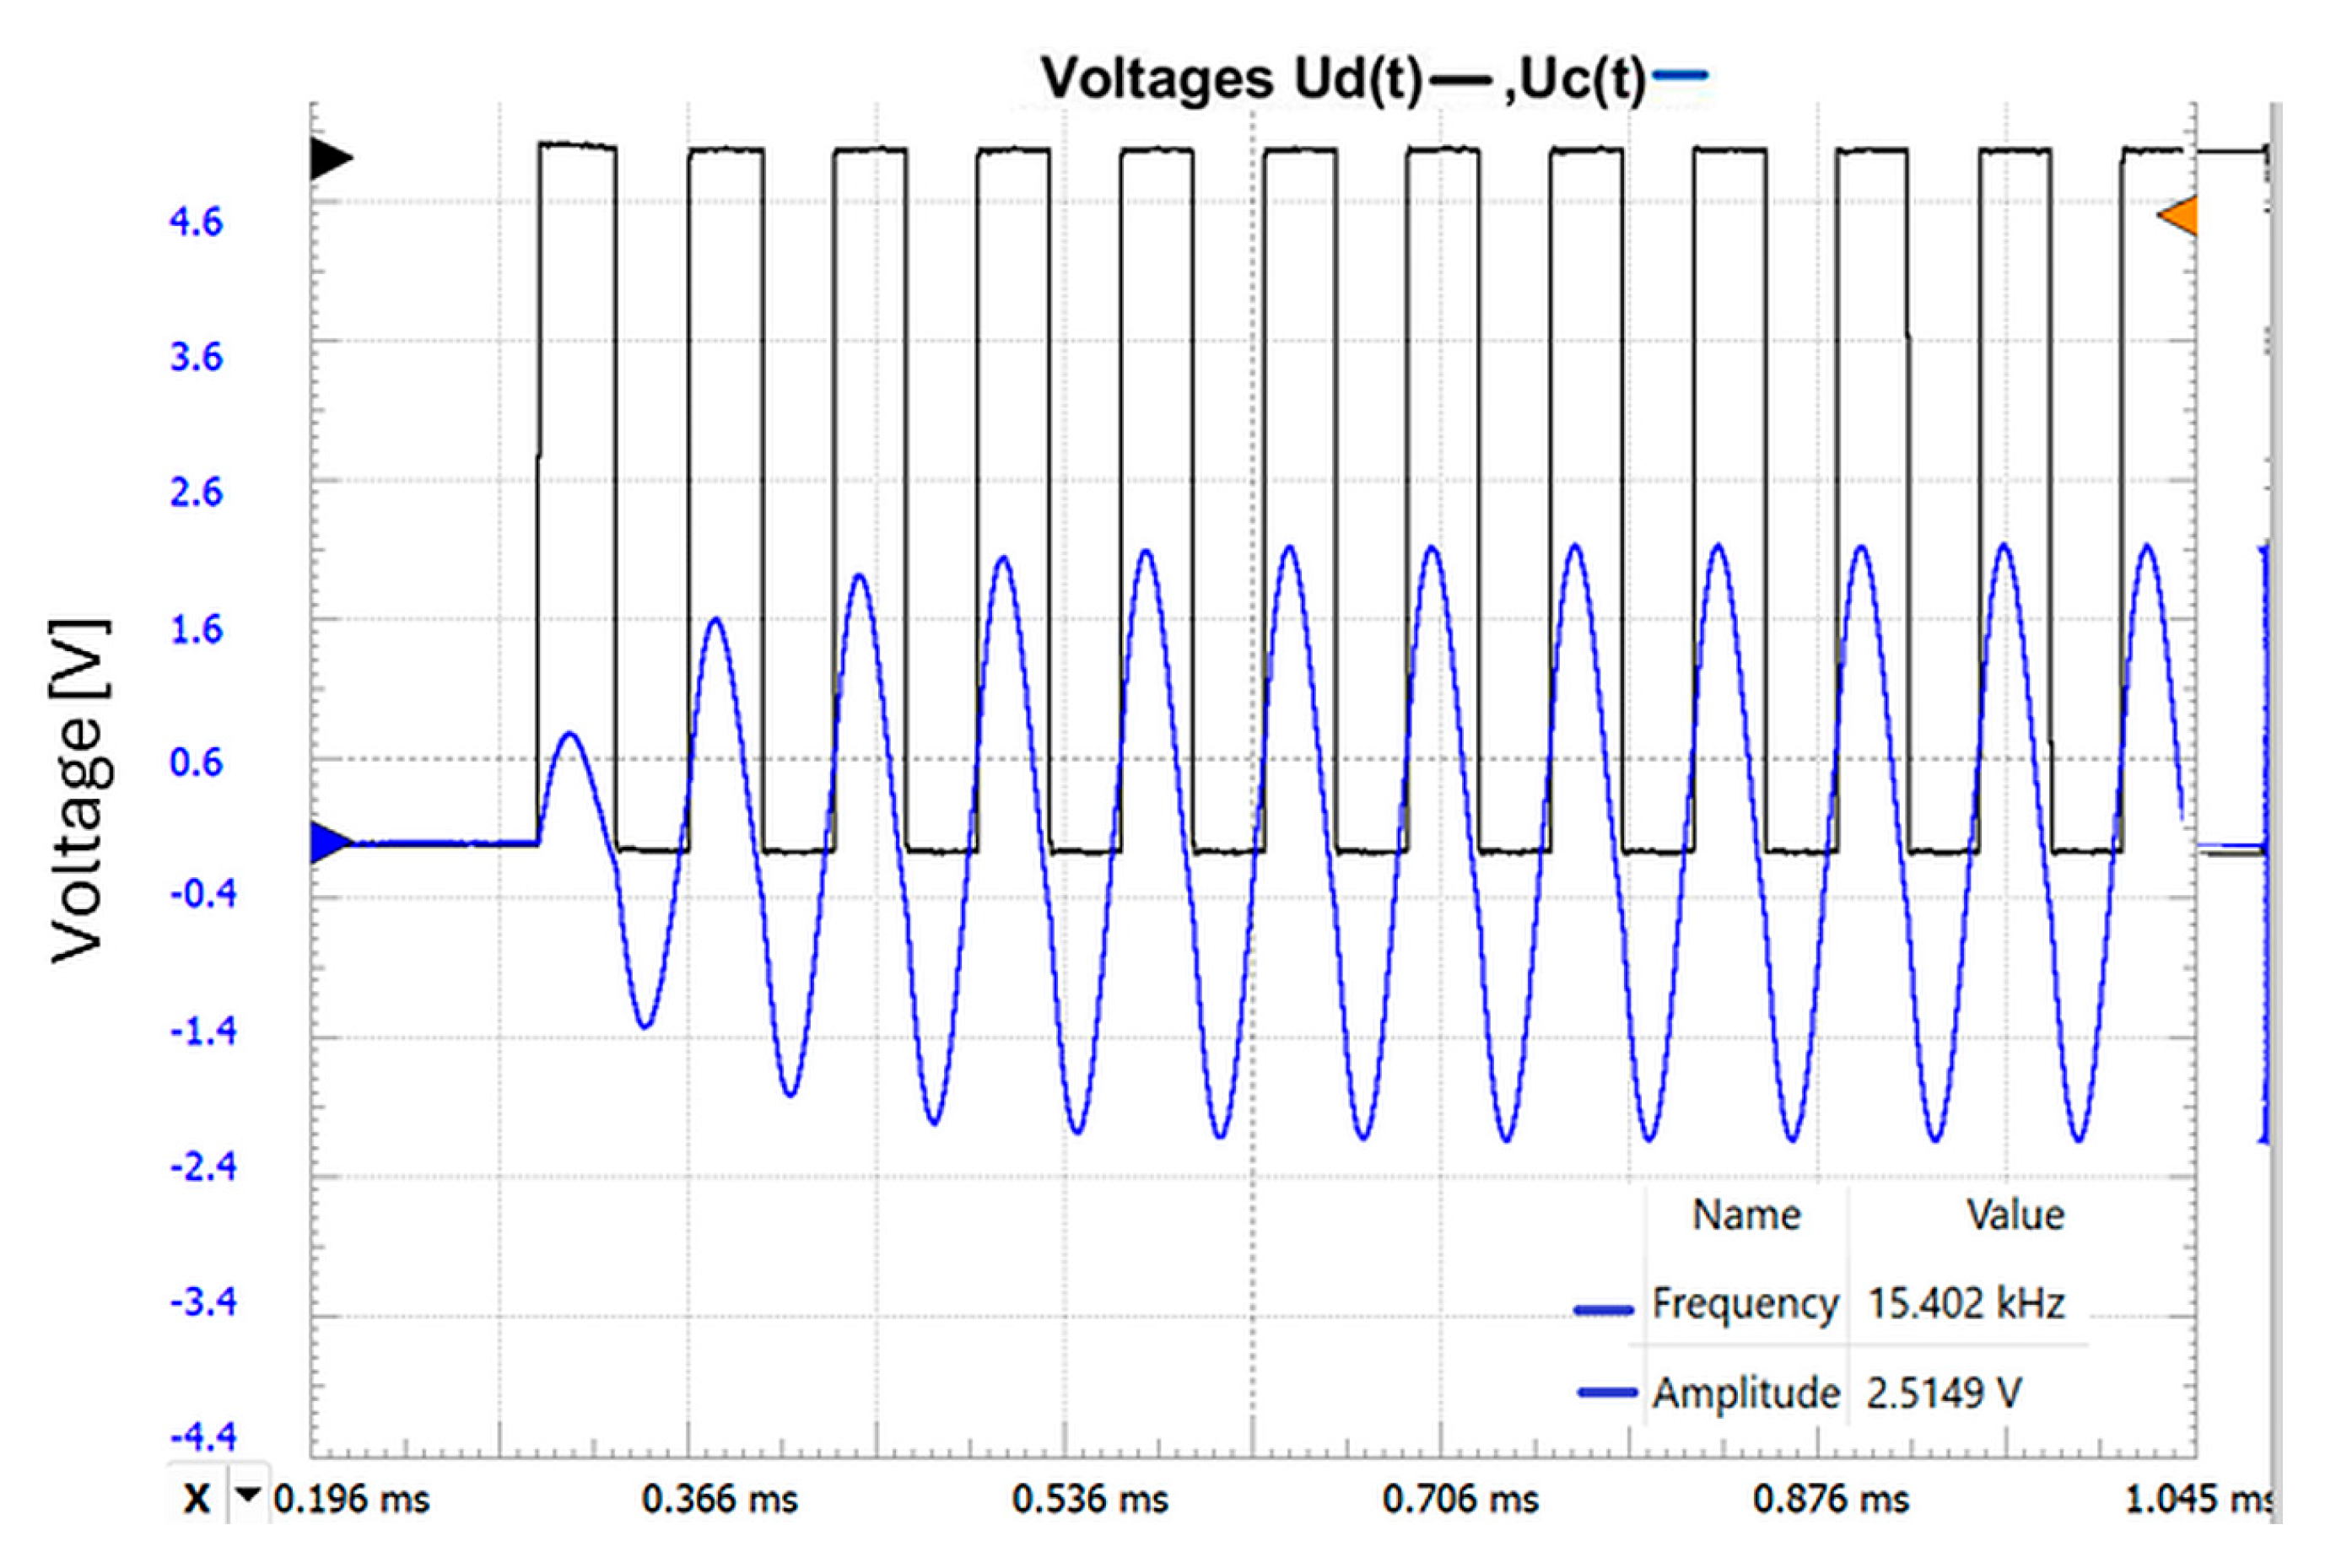
The real waveforms of the actual circuit are presented in
Figure 7.
The two graphs above show that the amplitude, transient response, and oscillation frequencies are similar, which demonstrates the correct approach of the developed theoretical model. The values for the components are Lo = 4.7 mH, ro =16 Ω, Cp = 22 nF, and R = 1 k.
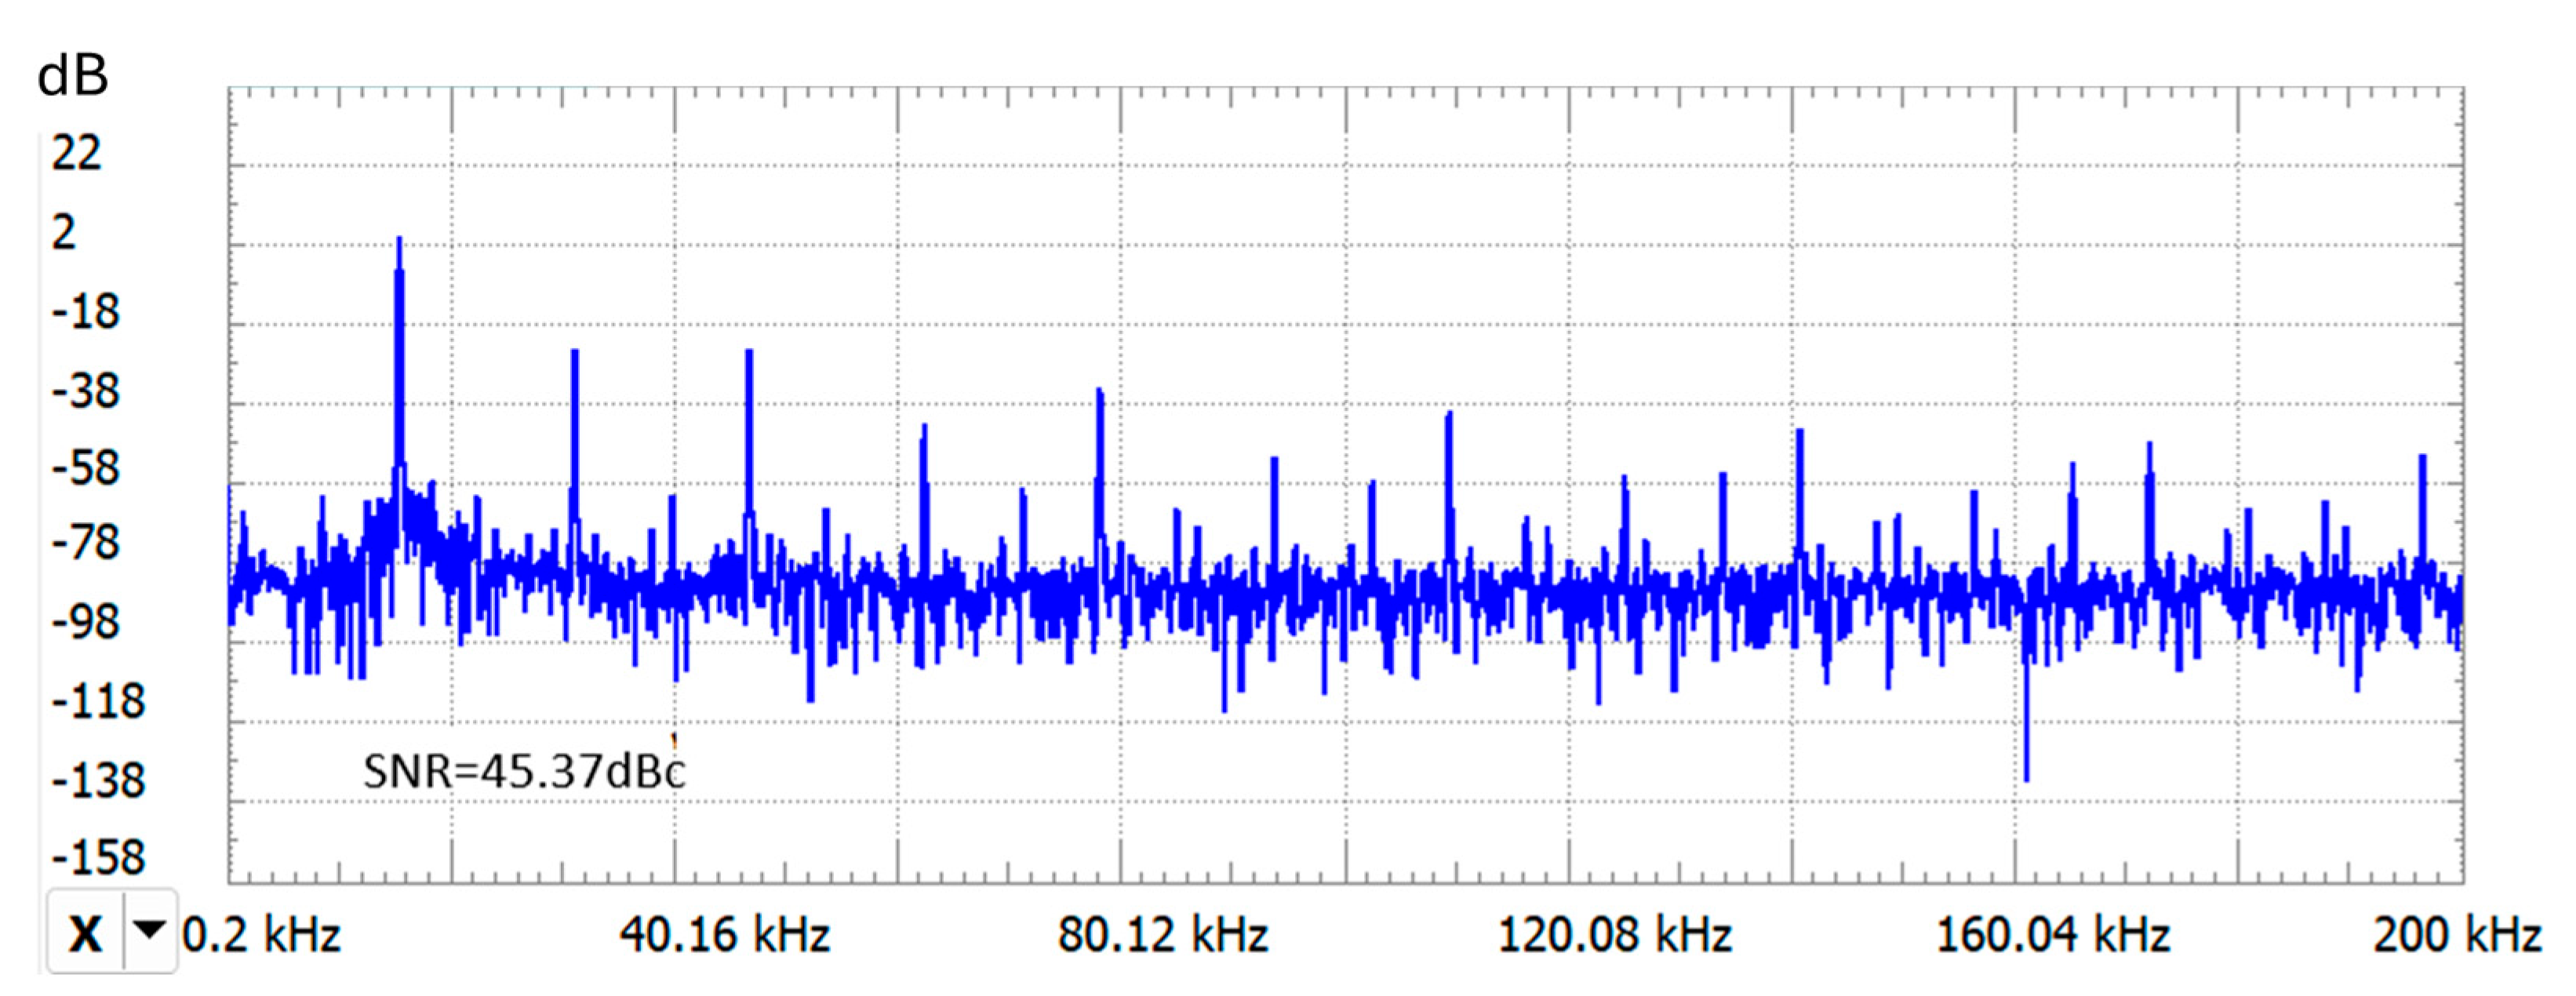
The spectral representation of the real oscillator output signal u
c(t) indicates a low-noise sinusoidal waveform with good frequency stability. The measured signal-to-noise ratio (SNR) exceeded 40 dBc relative to the carrier, which is considered excellent [
23], as seen in the spectral plot in
Figure 8. Since frequency noise directly limits the smallest detectable variations in the oscillation frequency, a high SNR is desirable, as it influences the resolution of the sensor.
According to Equations (8) and (24), the respective TON and TOFF periods are unequal. If R ≫ ro, then R + ro ≈ R. The oscillation period is T = TON + TOFF = . The oscillation frequency depends nonlinearly on the inductance of the coil Lo, .
2.2. Modelling of the IPS Using Eddy Current Principle
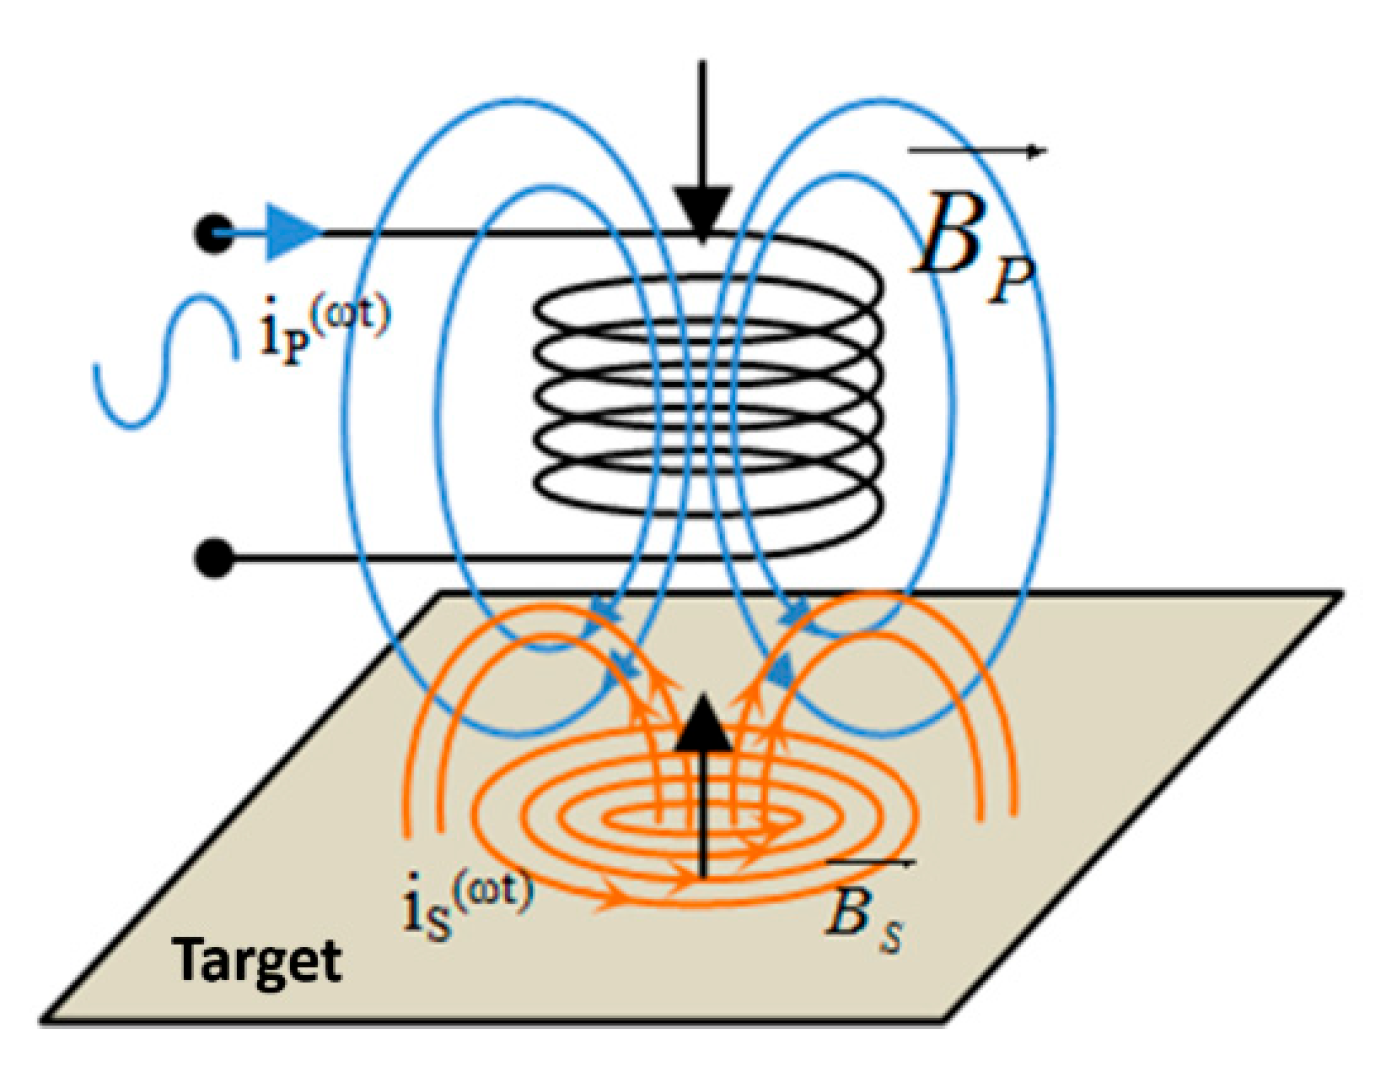
If excited with an alternating signal, the sensor coil creates a magnetic field. The presence of metal objects in the vicinity of the coil influences the magnetic field and implicitly the value of the coil inductance. An induced electromotive force will be created in the conductive material in a variable magnetic field, which will produce a current. The principle illustrated in
Figure 9 is based on the local induction currents (eddy currents or Foucault currents [
24]) that appear in metal parts when they are subjected to a variable magnetic flux (ωt), being a consequence of Faraday’s law.
According to Lenz’s Law, the primary magnetic field produced by the coil
and the secondary one produced by the induced current (eddy current) in the conductive material
are interdependent and opposed. The total magnetic field
in the coil is the vector sum of the inductions of the magnetic fields produced by each current (ip, is):
If we consider the direction as well, then Equation (34) becomes the following:
Since the two vector quantities are in opposition, the resulting field inside the coil will be weakened, the effect being described below. The induced currents are not surface currents; they penetrate the material under test. The penetration depth of the eddy currents is given by the following relationship:
where
is the resistivity of the material under test,
represents the angular frequency, and
is the magnetic permeability of the target material. The inductive sensors based on eddy currents are used in identifying metallic objects, in determining material defects (inhomogeneities), in determining material thicknesses, etc.
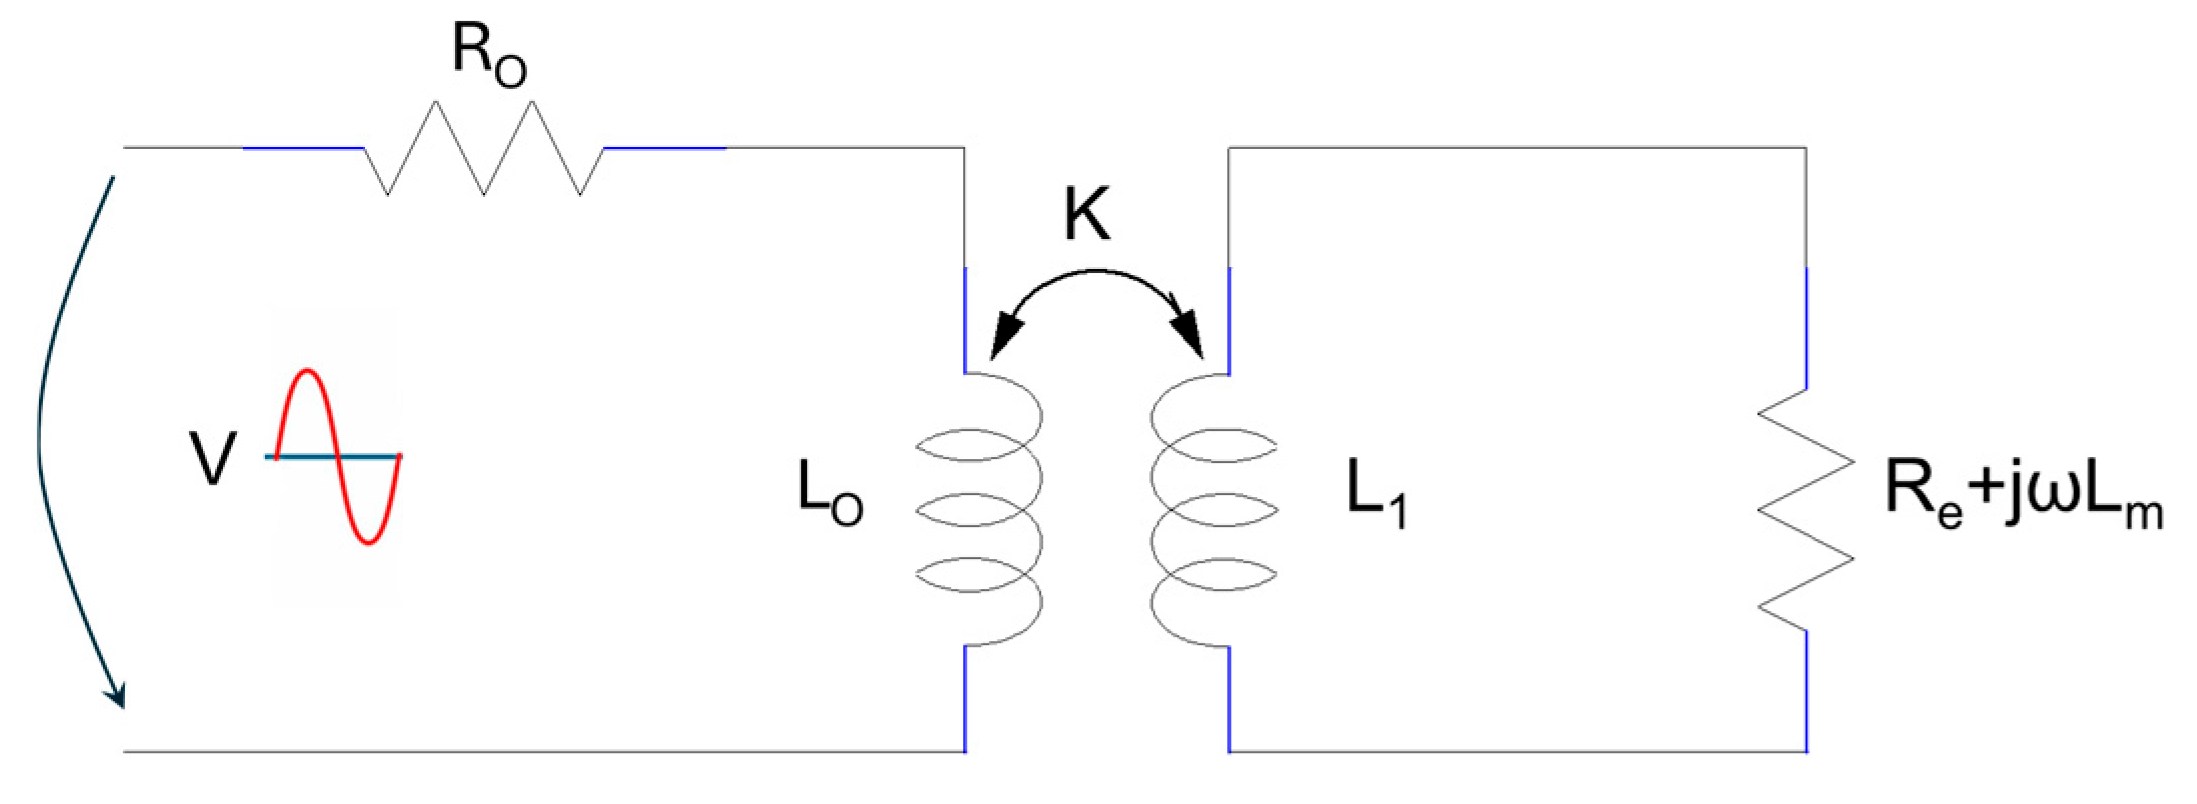
A sensor whose operation is based on the production of eddy currents can be modelled with a transformer whose coupling coefficient depends on the distance between the metallic object and the coil, as seen in
Figure 10.
The proposed model is composed of two circuits: the primary circuit is characterized by the impedance,
, where R
o is the coil resistance, and the complex term,
, represents the inductive reactance of the coil [
20]. When the object under test is far from the coil, the two circuits do not influence each other; the eddy currents do not exist or have a very small value. If a metal object is brought into the vicinity of the sensor coil, eddy currents appear in the metal object, induced by electromagnetic induction. The magnetic fields produced by the two currents interact, and hence the impedance of the primary circuit changes as follows:
,
. The magnetic field created by the eddy currents opposes and weakens the primary magnetic field, as seen in
Figure 9. To determine to what extent the material (sample under test) affects the primary circuit formed by R
o and L
o, Kirchhoff’s second law can be applied to the two circuit loops in
Figure 10.
where
represents the angular frequency of the excitation signal, R
o is the resistance and L
o the inductance of the primary coil (without the metallic object present), and R
e and L
1 are the resistance and inductance, respectively, of the circuit loop where eddy currents are flowing. The inductance L
m is found in the secondary circuit and produces the leakage flux. It also models the magnetic field caused by eddy currents, and it does not reach the L
o value. The mutual inductivity between the two coils is
. The coupling coefficient, k, depends on the distance between the coil and the device under test; it decreases when distance increases and
To highlight the behavior of the sensor coil in the proximity of the metal objects, the impedance of the primary circuit shown in
Figure 10 is analyzed. The aim is to identify the influence of the coefficient k on the impedance. From the current–voltage relationship of the primary circuit
and Equation (37), the following expression is obtained for Z
C:
In the previous equation, if the real and imaginary parts are separated, the influence of the sample on the primary circuit, R
C and L
C, can be determined.
The primary circuit is represented by R
o and L
o, according to Equation (37); in the presence of coupling k, R
C >> R
o, and the equivalent resistance increases. The term R
r represents the ohmic component of the impedance (in the secondary circuit, R
e has the same meaning) reflected in the primary circuit. R
r increases if the coupling coefficient increases. The reactive component L
r, reflected in the primary circuit, has a minus sign, suggesting the second effect of eddy currents, namely that they produce a magnetic field that opposes the primary field (Lenz’s law). Analyzing the evolution of the impedance |Z
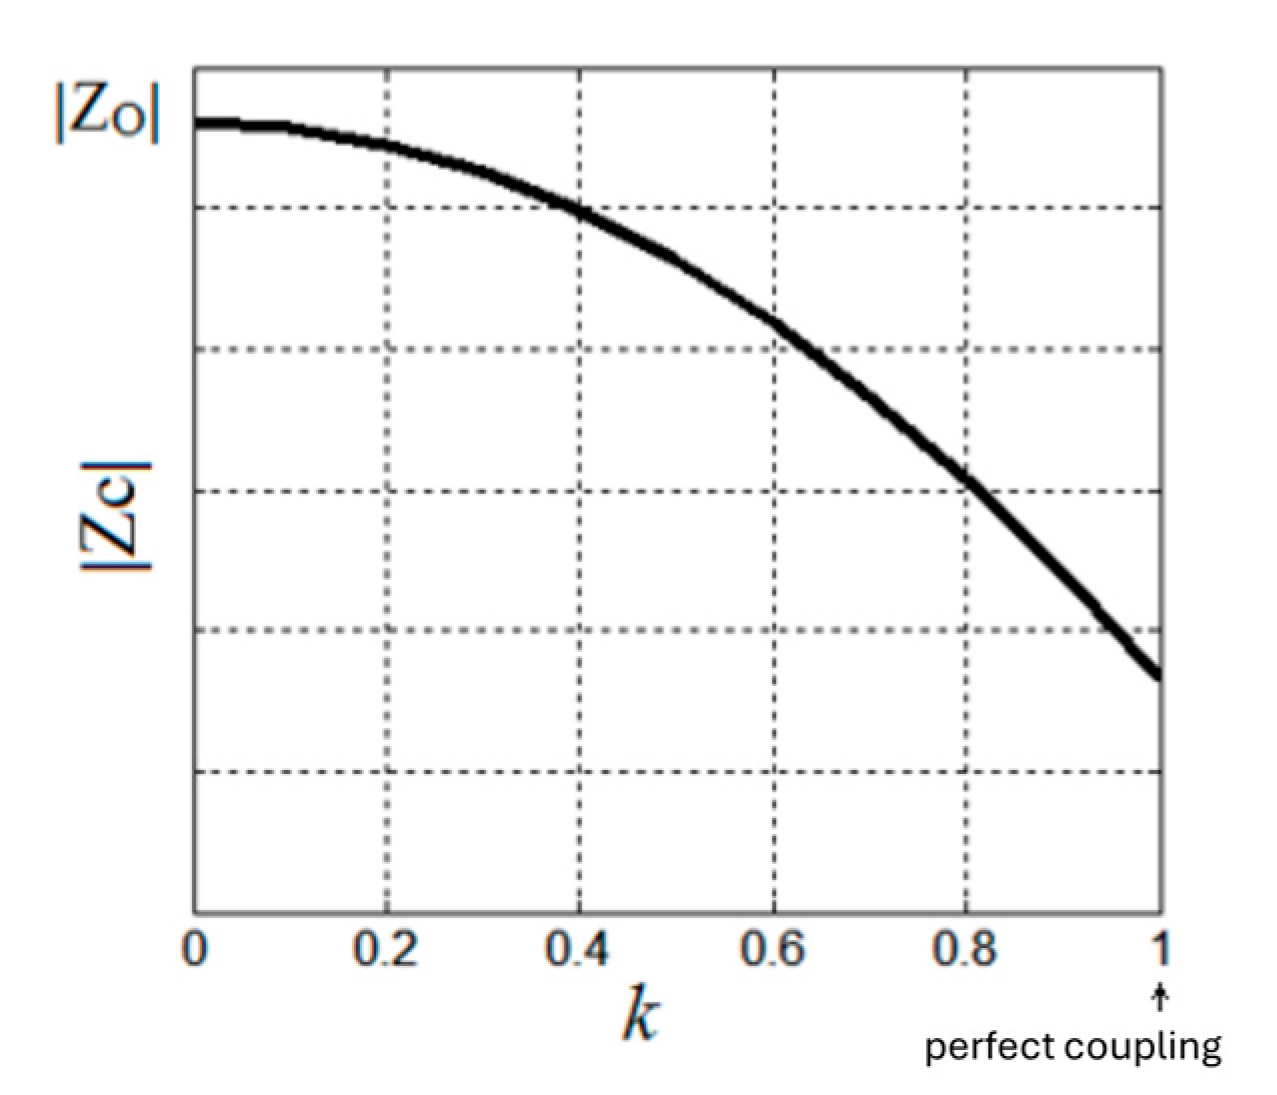
c|, a decrease in the impedance |Z
c| is observed with increasing coupling k, as seen in
Figure 11. However, a decrease in the impedance |Z
c| determines an increase in the current absorbed by the sensor coil, I,
. Once eddy currents appear in the circuit, the electrical power absorbed from the external excitation source increases.
The sensor model based on monitoring the voltage amplitude at the coil terminals, or on monitoring the current absorbed by the oscillating circuit, is addressed in [
8,
25,
26]. In the case of the IPS implemented in [
25], the differential structure with two coils is used, of which one is chosen as a reference. To determine the distance, the amplitude of the differential signal is analyzed. When the coil and the target are close together, losses from eddy currents cause the oscillation amplitude to decrease in the amplitude analysis method, an issue noticed also in our experiments. ADC signal conditioning, however, is not an effective technique, as stressed in [
25]. The ADC resolution affects the detection accuracy, and the dynamic range of signal amplitude variation varies with distance. Only 27% of the ADC’s dynamic range is utilized.
Monitoring the oscillation frequency is the foundation of the sensor model presented in this paper, as previously demonstrated also in [
27,
28]. Equation (39) states that the coil inductance is dependent on the target through the circuit parameters R
e, L
1, and L
m, as well as the position in relation to the target through the coupling coefficient k. Consequently, the oscillation frequency varies with the position of the target relative to the coil through the parameter k,
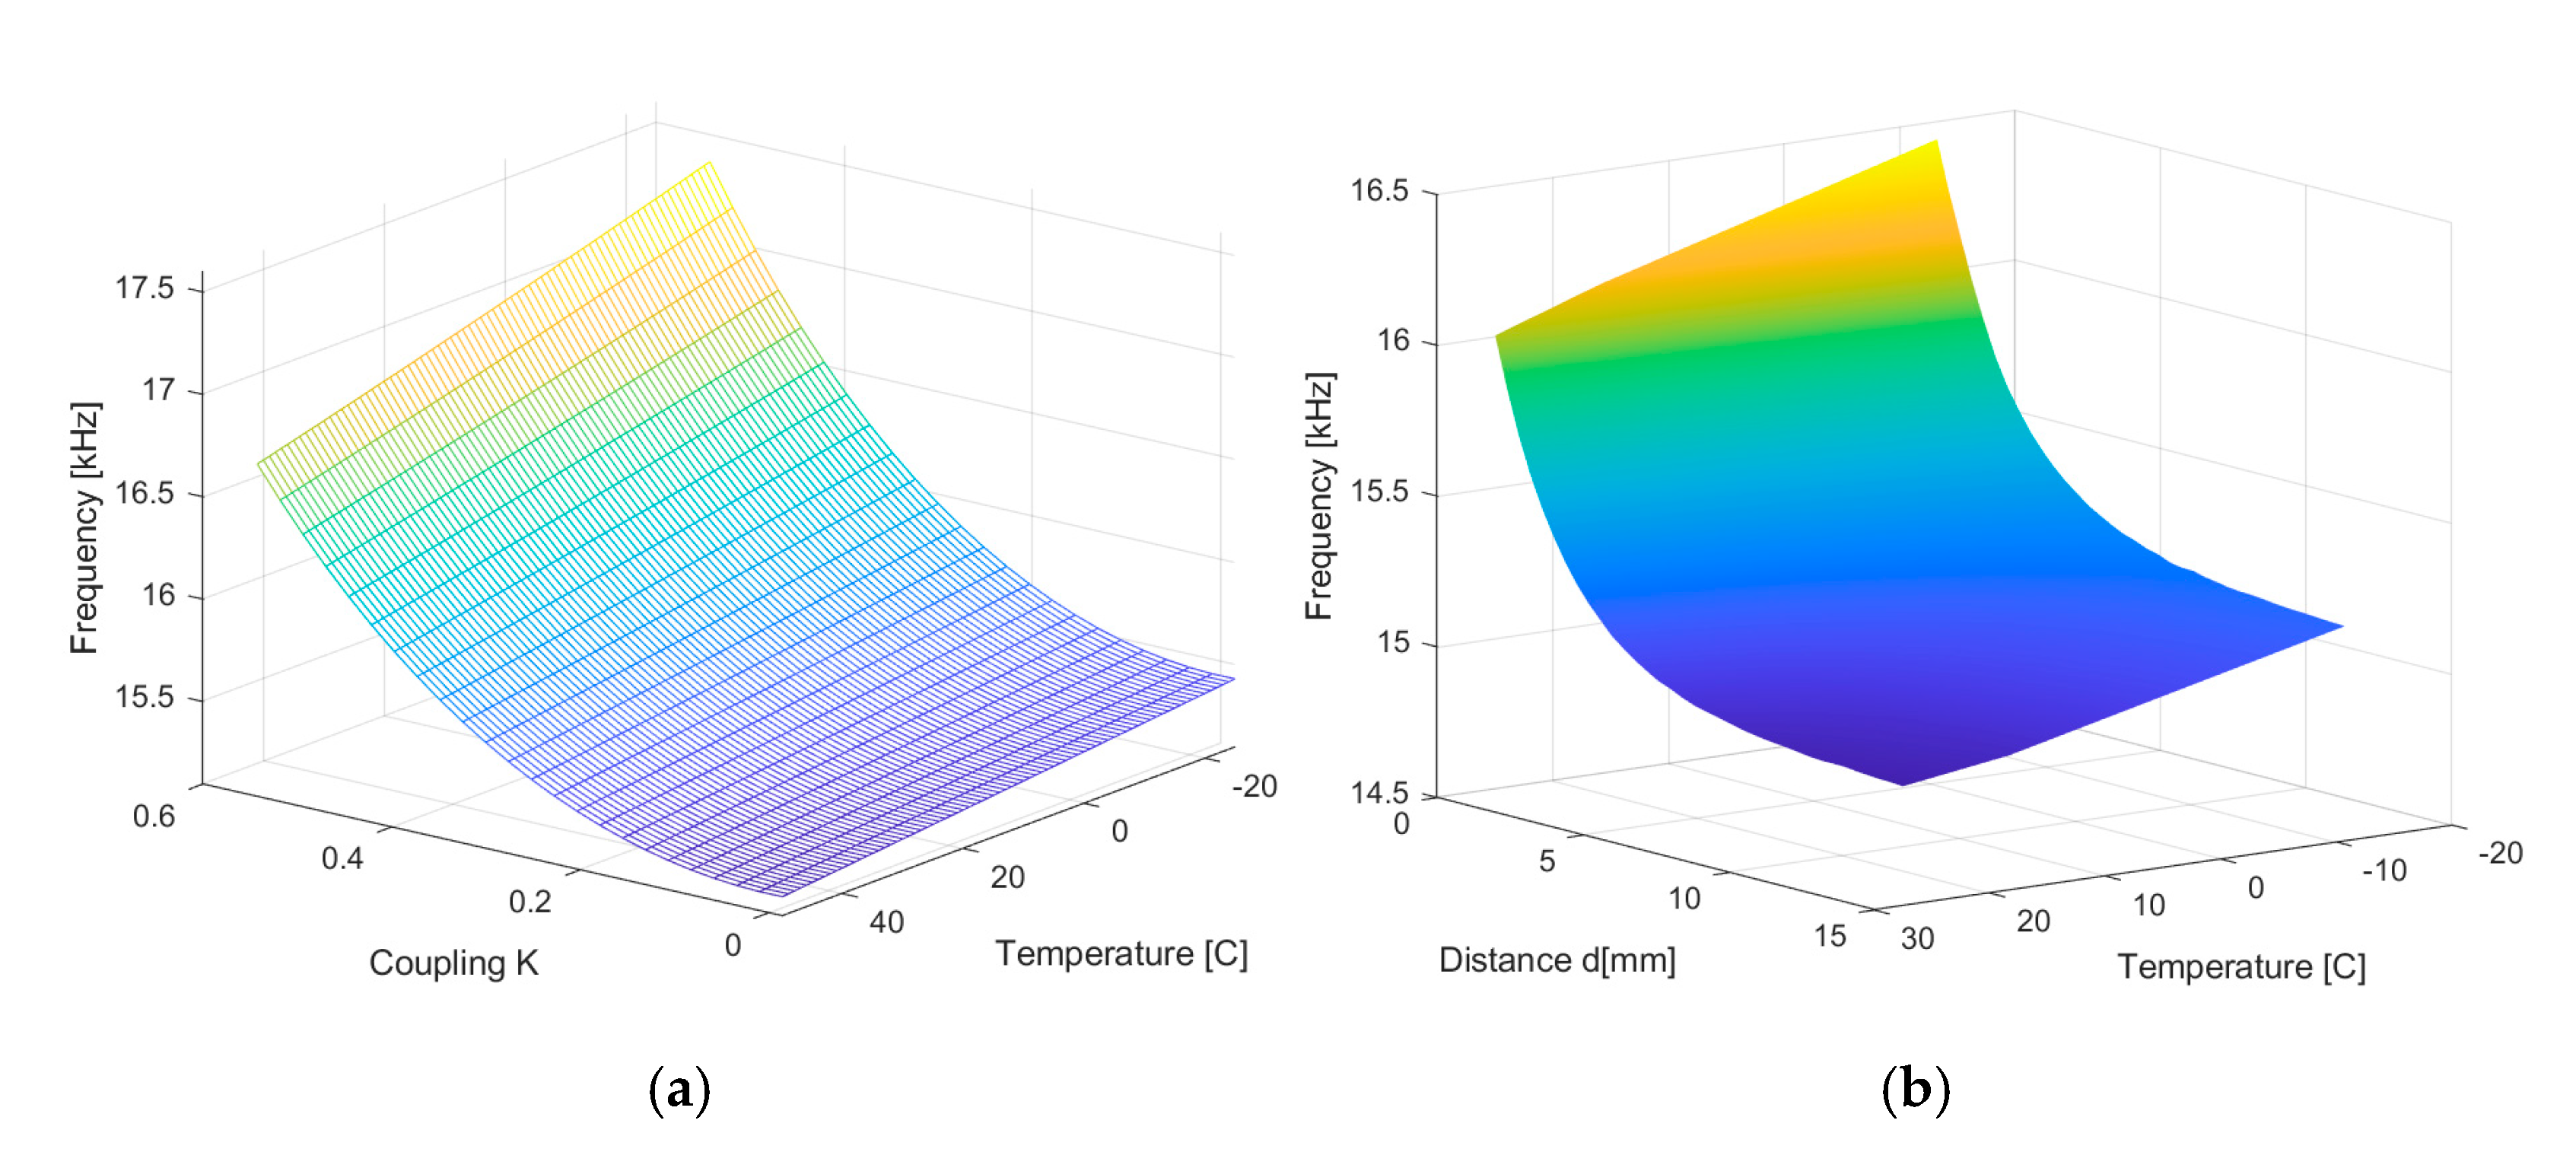
In addition to the primary measure, distance, the oscillation frequency in the suggested sensor model is also influenced by temperature because of variations in the electrical conductivity of the coil resistance R
o and the target’s material. It is challenging to find a mathematical formula that captures the relationship between temperature and oscillation frequency. By simulating the mathematical model that describes the oscillation frequency, however, this dependence can be made clear.
In Equation (40), Lc is the equivalent inductance of the coils in the presence of magnetic coupling, k is the coupling coefficient, and T is the ambient temperature. Under stationary conditions (k = constant) the influence of temperature on the oscillation frequency is shown in the next section. The circuit model has the parameters presented in
Table 1, the target material being copper.
2.3. Embedded Hardware Design and Considerations
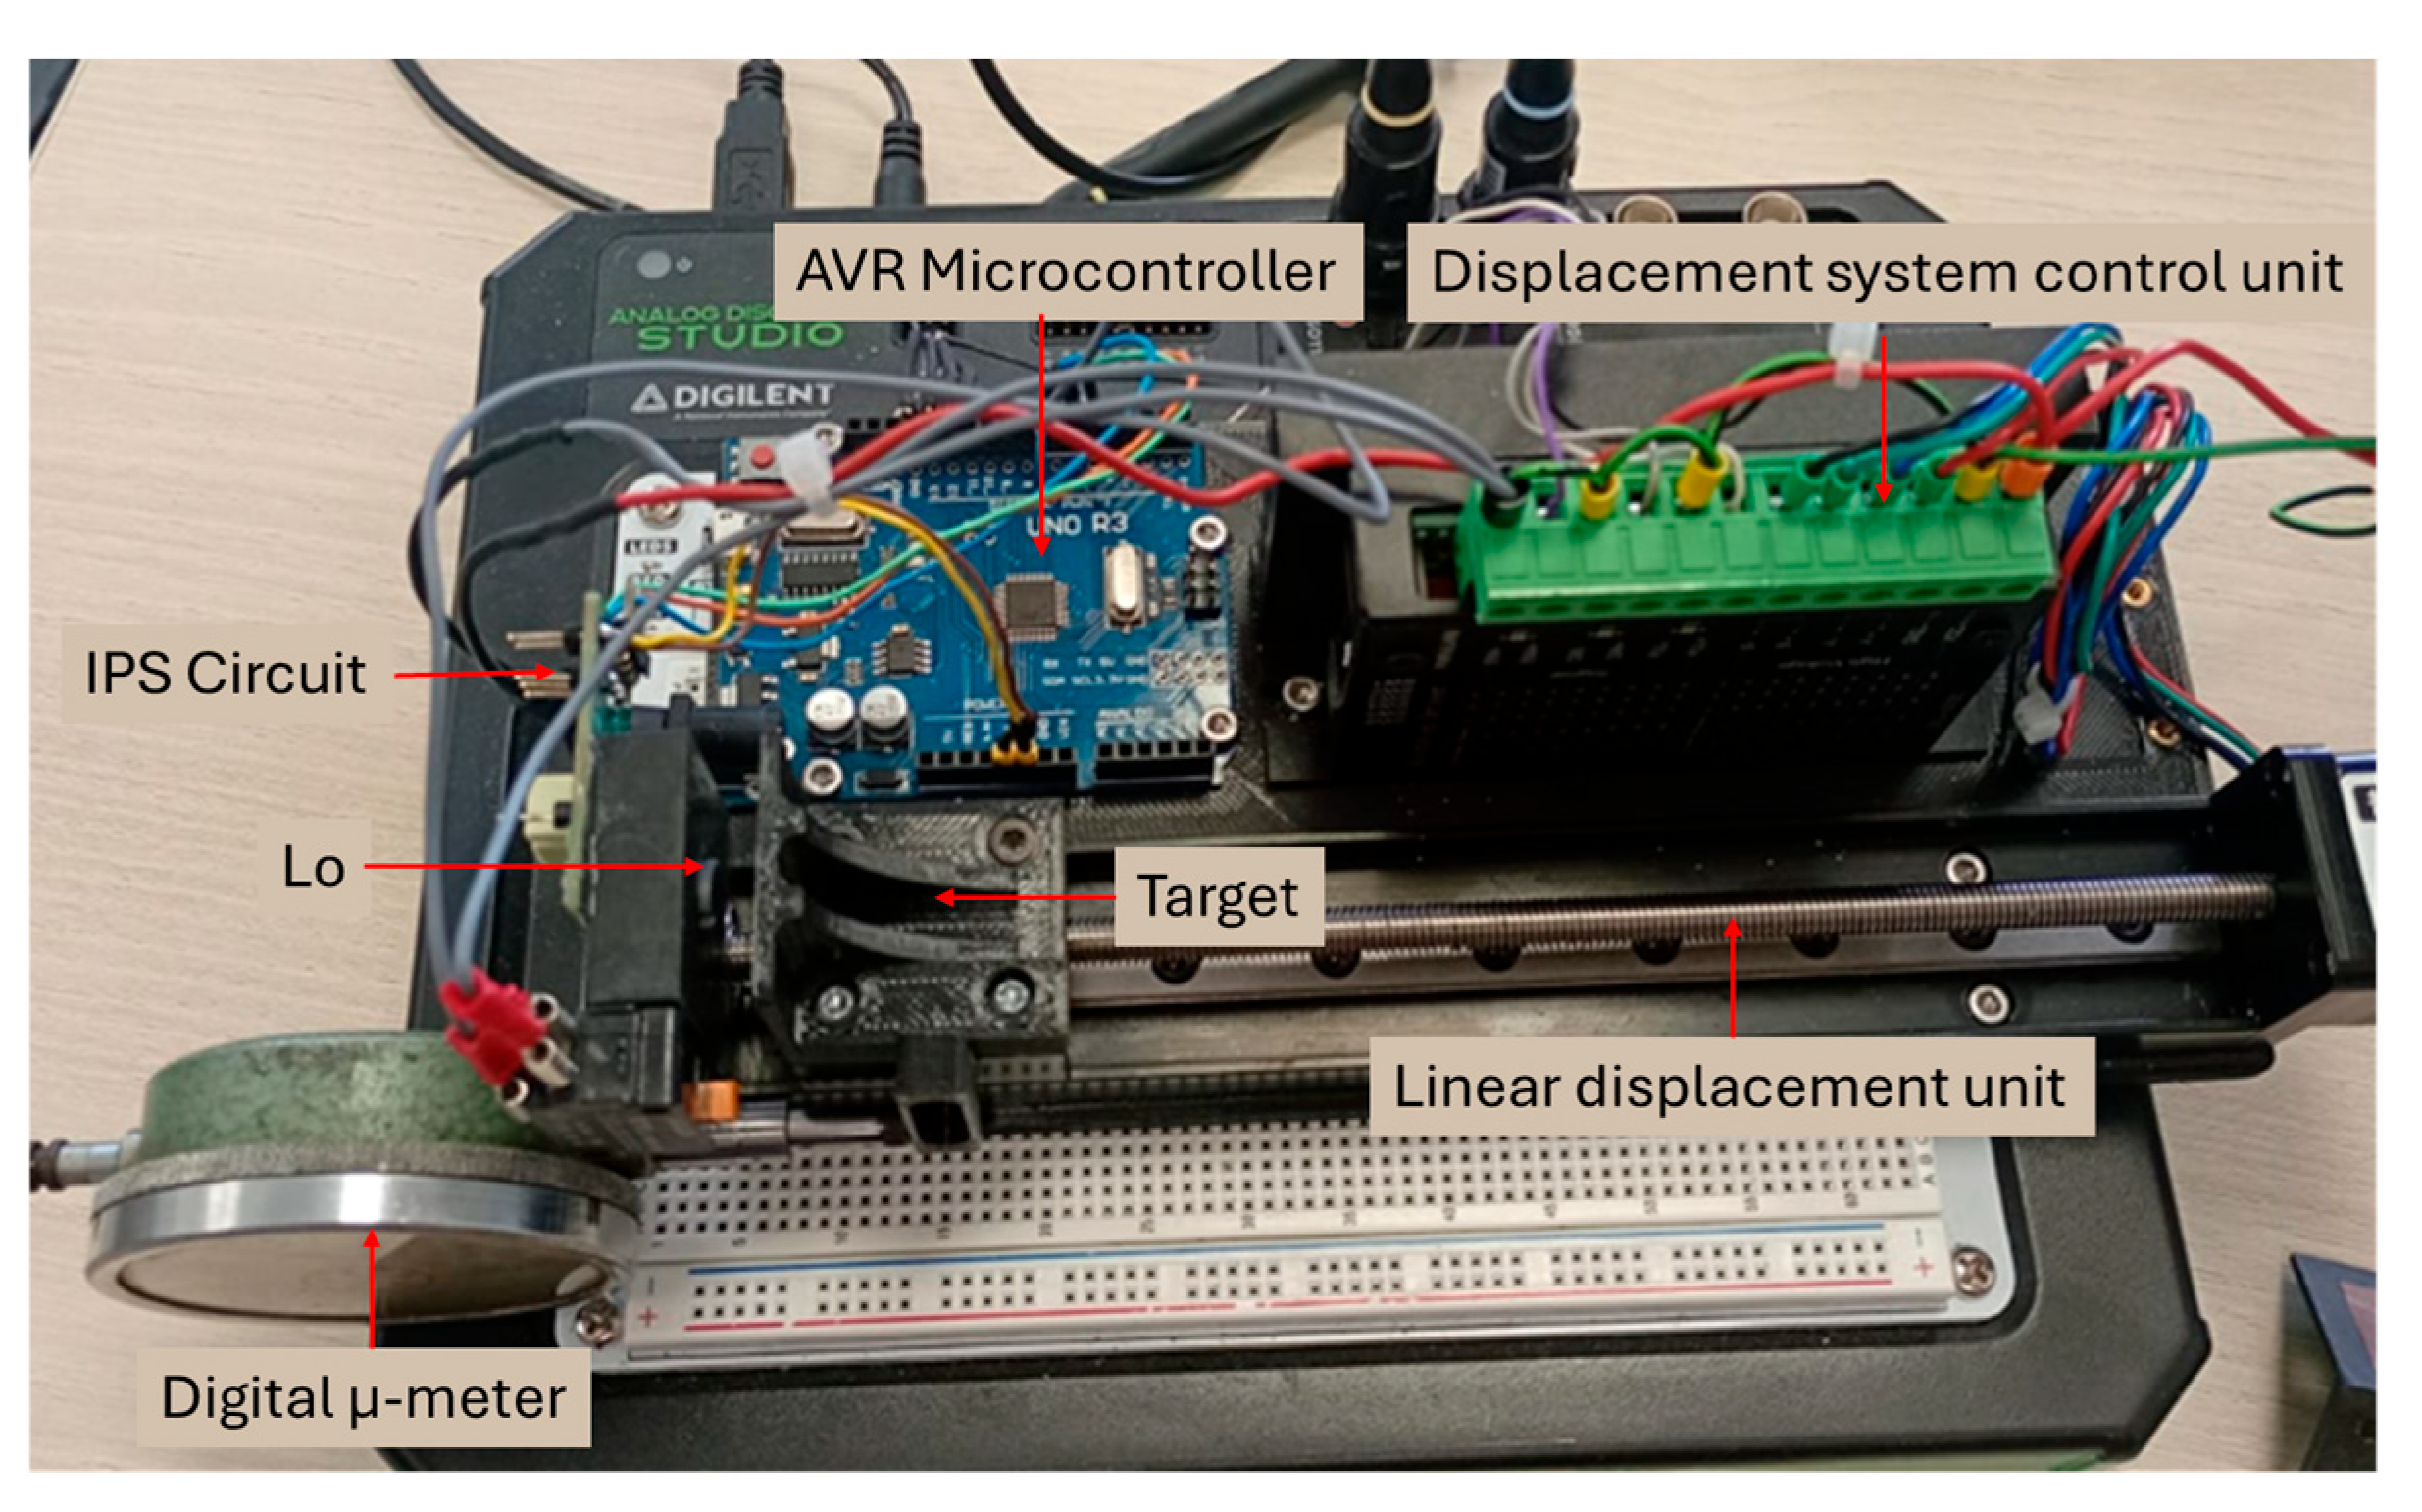
In this study, the IPS model is based on embedded technology, the full system being set up on an Analog Discovery Studio board, presented in
Figure 12. The parallel LC circuit is brought into oscillator mode using a microcontroller. The oscillation frequency depends on the inductance of the magnetic field generator coil (L
o). When a metallic object (a target) comes into the inductive proximity sensor’s field of detection, an eddy current builds up in the incoming metallic object. This eddy current reacts to the source of the magnetic field, and hence it acts to reduce the inductive sensor’s own oscillation field [
29]. As a result, there is a change in the impedance value of the coil, which acts as a magnetic field generator.
The operating model proposed in this paper is based on the variation in the oscillation frequency with distance, using the eddy current. The proposed topology uses embedded technology; the IPS is implemented with a small number of components. The electrical schematic is shown in
Figure 13. Processing the signal provided by the L
oC
p oscillating circuit is performed by a transition detection and focusing circuit with a comparator. The circuit formed by resistors R
3, R
4, and C
1 focuses the signal on Vcc/2, this being the common mode voltage for the transition detection comparator.
To bring the circuit to the maintained oscillator operating mode, the microcontroller algorithm must implement the conditions presented in the previous paragraph. Initially, an energy injection (boost energy) is made in the LoCp circuit by switching the transistor Q1 to the ON state. Subsequently, changes in the output signal are detected with the internal comparator. For the most efficient management process and successive connection/disconnection of the Vcc energy source, comparator interrupts are used. The interrupts are generated by the transitions of the output signal . Since we have chosen the comparator inputs to be the offset voltage, the alternating signal shifted, respectively, by the offset voltage, and the zero crossings of the output signal are detected. Thus, the Vcc energy source can be connected/disconnected in the circuit without distorting the output signal
The main uncertainty sources in time measurement methods with a microcontroller are quantization and trigger noise if reference frequency is stable [
30]. Using crystal oscillators with low temperature drift, the reference frequency uncertainty can be significantly minimized. With a microcontroller from the AVR family—Atmel/Microchip—two frequency measurement methods can be implemented, with similar performances. The first method consists in using a time base of frequency much higher than the unknown signal frequency, f
base >> f
x. This feature is implemented in most 8-bit microcontrollers; the working mode is called Input Capture Pin (ICP) or Input Capture Mode (ICM). The second method uses a time base of frequency much lower than the unknown signal frequency, f
base << f
x. In a fixed interval, the oscillations of the unknown signal are counted and the signal frequency is an integer and a multiple of the signal frequency time base f
x = N · f
base; this method is called the Counter Mode (CM) method. Both methods can generate similar measurement performances from the error’s perspective; the differences are given by the duration of the measurement. For frequency measurement with uncertainty
in both methods, the measurement time is an integer and a multiple of T
base = 1/f
base. The duration of a measurement in both methods can be calculated with the following Equations:
where M is an integer multiple of fixed f
x periods required to measure the output signal with uncertainty
. For an uncertainty of 0.1 Hz when the base frequency is 16 MHz and the maximum frequency of the sensor signal is 16,500 Hz, the duration of a measurement is
and
In terms of measurement duration, the ICP method is more efficient. In practice, the measurement system can provide data almost in real time.
Considering internal operations management, the second method, CM, is more convenient, having approximately 10 s available for handling software operations in the microcontroller. In the case of the ICP method, because some routines and functions cannot be executed in 60 µs (the minimum period of the unknown signal), they are fragmented. Their execution is performed sequentially, synchronous with the alternative output signal, having M = 140 execution intervals available.
