4.3.1. Experiments on the AVA-ActiveSpeaker Dataset
Comparison with Other Methods. The comparison results between the proposed attention-based cross-modal active speaker localization model and other approaches on the AVA-ActiveSpeaker dataset are presented in
Table 1. The experimental results demonstrate that the proposed model outperforms existing mainstream algorithms on the speaker localization task. Compared with the audio–visual fusion model introduced in the previous paper, our method improves localization accuracy (mAP) by
, and achieves a significant improvement of
in the newly introduced mIoU. These results further confirm the effectiveness and superiority of the proposed cross-modal audio–visual fusion method in enhancing speaker localization precision.
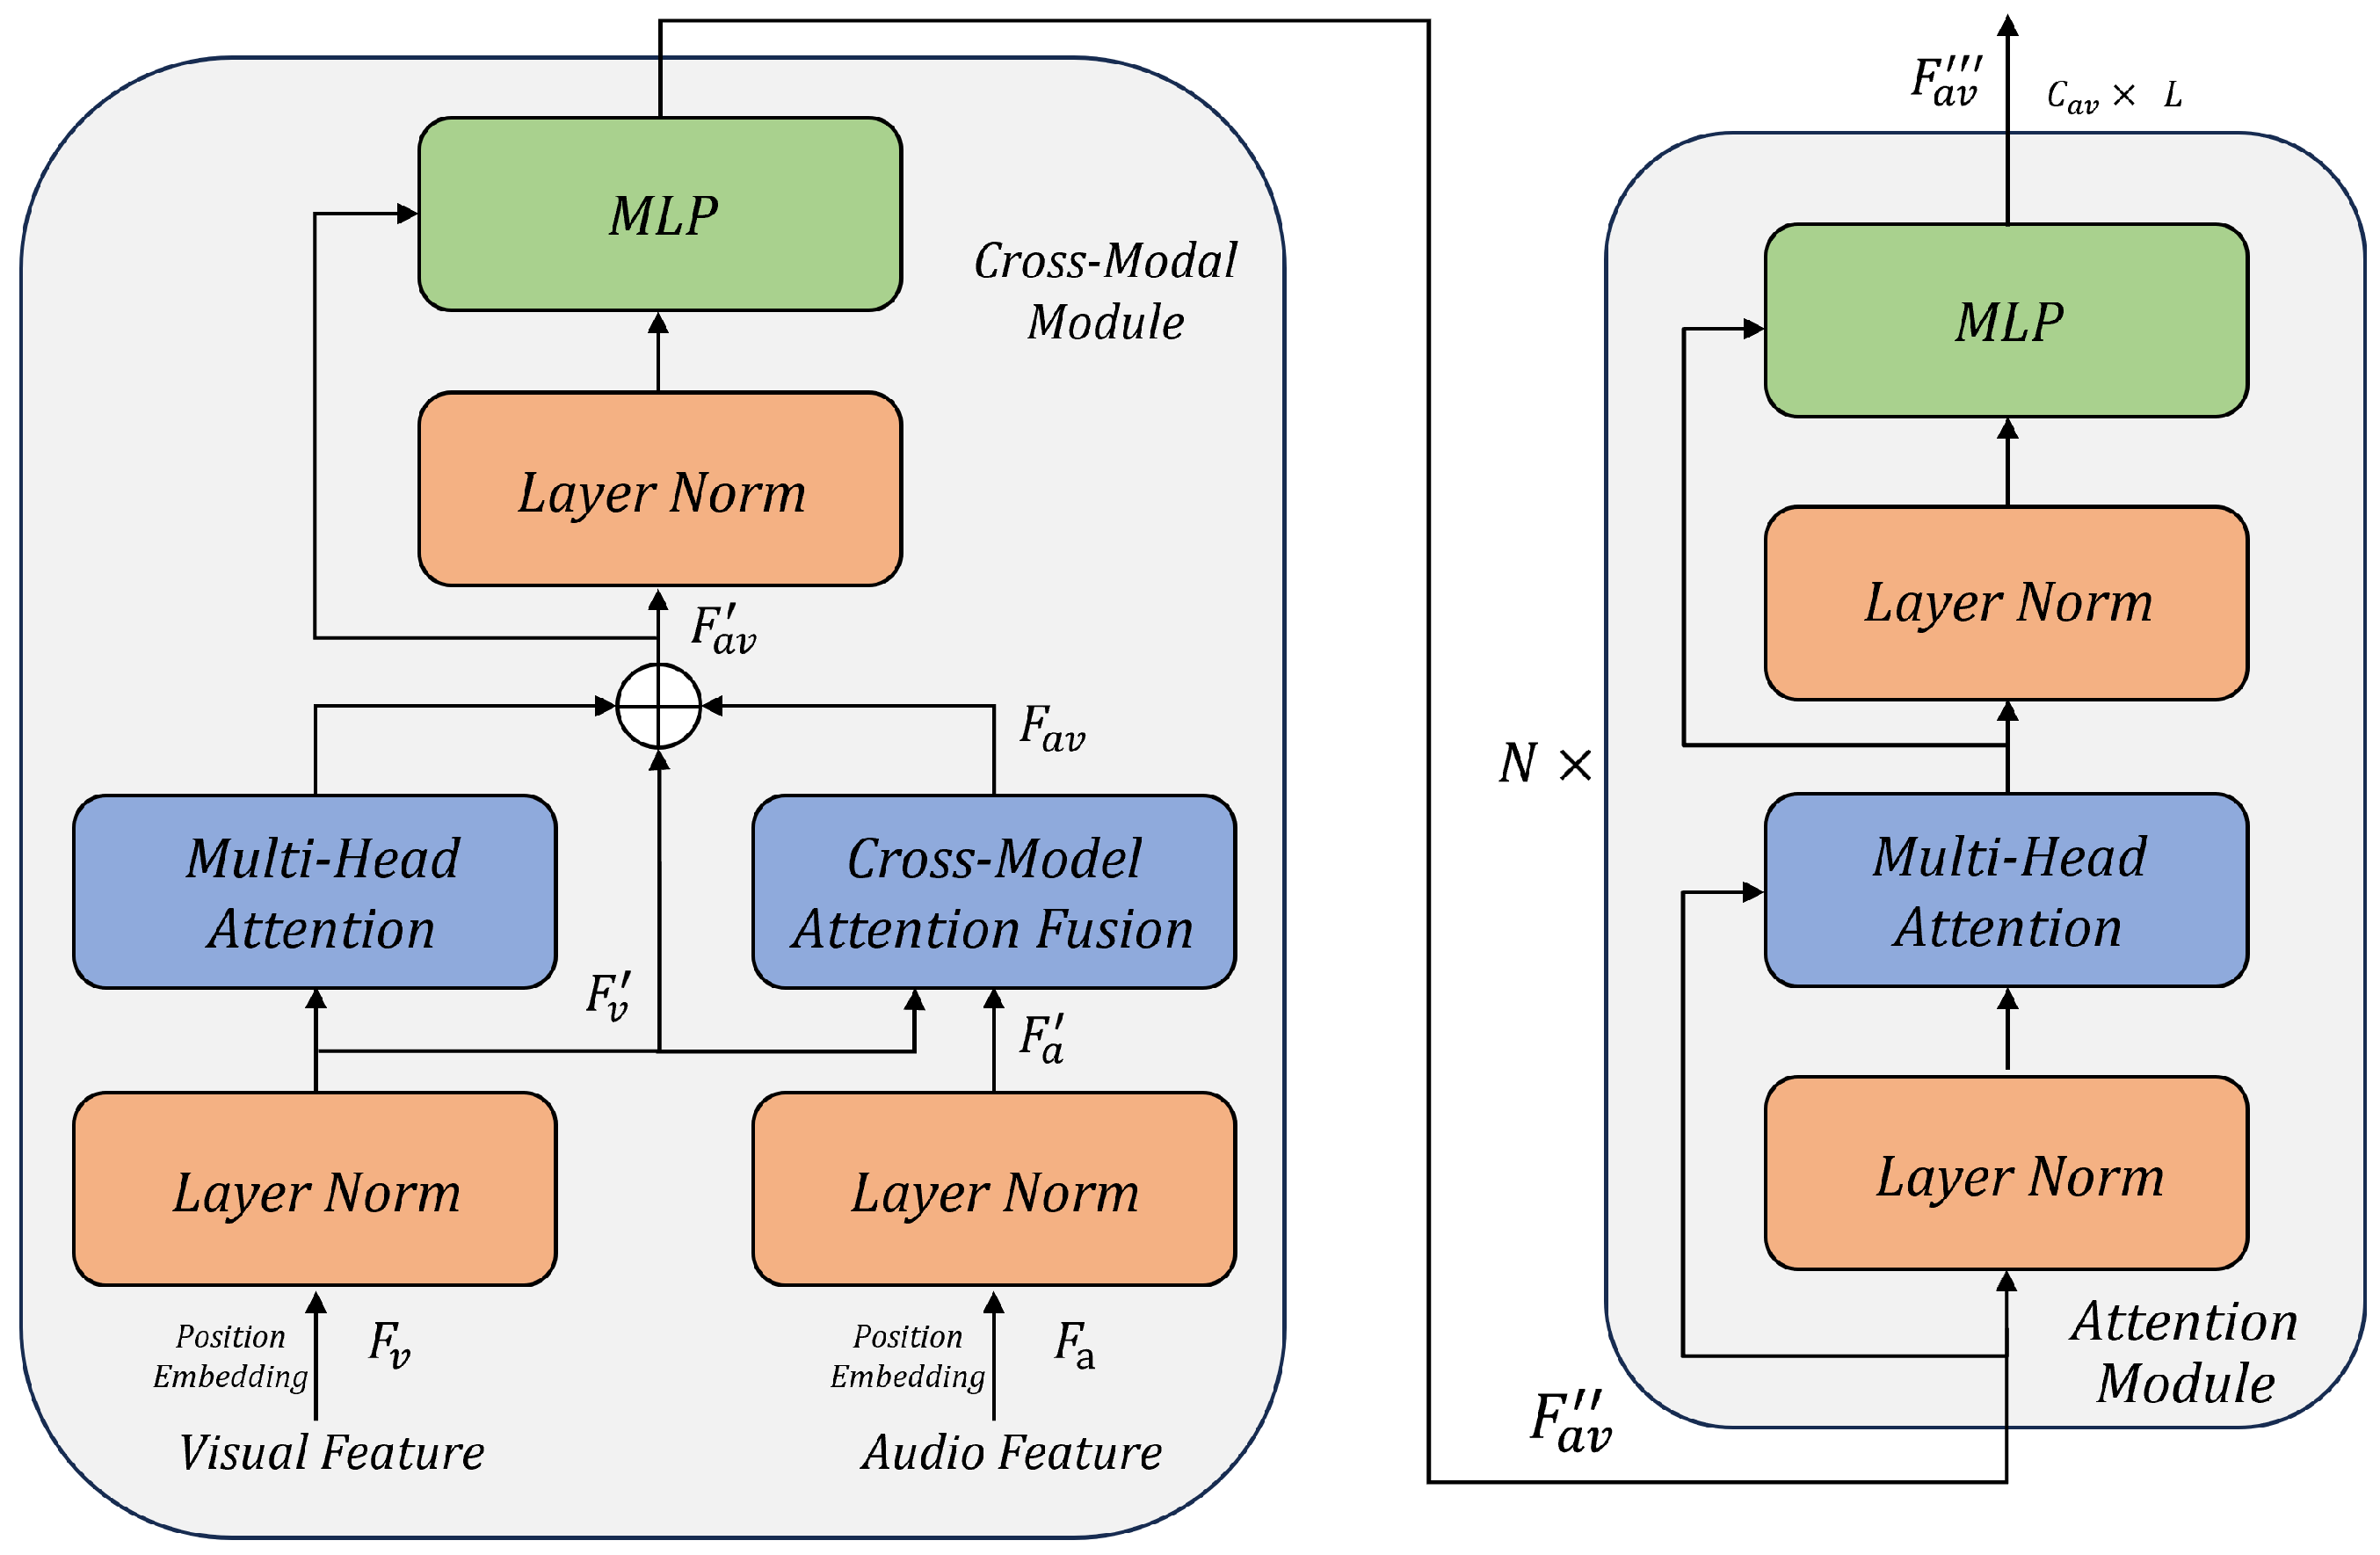
Ablation Study on Feature Fusion Methods. To validate the design of the cross-modal fusion module in the proposed network (as shown in the left half of
Figure 2), we adopt a three-branch structure: visual multi-head attention (
), visual-only branch (
), and audio–visual cross-modal attention (
). In the ablation study, the
branch is first removed, and then the remaining two branches are fused using either concatenation (Cat) or addition (Add). Subsequently, the visual branch is added back to evaluate its contribution. The experimental settings remain the same. Results are shown in
Table 2.
The results indicate that, when only using and , the Add operation outperforms Cat, improving mAP by and mIoU by , while reducing the number of parameters. Furthermore, adding back the visual-only branch yields additional gains (mAP ↑ , mIoU ↑ ), highlighting the importance of visual features in speaker localization.
Ablation Study on Cross-Modal Fusion Direction. To analyze the effect of fusion direction in the cross-modal module, we keep the visual attention (
) and visual branch (
) unchanged, and only vary the direction of cross-modal attention: audio-to-visual (
) vs. visual-to-audio (
). The rest of the experimental setup remains fixed. Results are shown in
Table 3.
Audio-to-visual fusion achieves better performance than visual-to-audio fusion, improving the mAP by and mIoU by . This confirms the dominant role of visual features in localization and the effectiveness of enhancing them with audio cues.
Ablation Study on the Number of Self-Attention Blocks. This section evaluates how the number of self-attention blocks (N) affects performance. The setup uses Add fusion and audio-to-visual cross-modal attention. Only the number of self-attention blocks on the right of
Figure 2 varies. Results are shown in
Table 4.
Performance improves as the number of self-attention blocks increases up to 5, with peak values at Self-5. Beyond this, performance slightly drops, suggesting potential overfitting or computational redundancy.
Ablation Study on Cross-Modal Loss and Hyperparameter . Finally, we assess the effectiveness of the auxiliary cross-modal loss function and hyperparameter
. The base configuration uses Add fusion, audio-to-visual fusion, and
self-attention blocks. Results are shown in
Table 5.
Adding the cross-modal loss consistently improves the model performance. The best results are obtained with , improving the mAP by and the mIoU by over the version without . However, it also increases the parameter count due to the additional prediction module. This validates the auxiliary loss’s role in enhancing feature alignment and boosting localization accuracy.
Ablation Study on Audio–Visual Modalities. To investigate the contribution of audio features in the proposed CMAVFN, which leverages a diffusion-inspired architecture for enhanced feature fusion, we conduct an ablation study comparing a visual-only model against the full audio–visual fusion model. In the visual-only configuration (
Visual), the audio–visual cross-modal attention (
) is replaced with an additional visual self-attention mechanism (
), effectively removing audio input (
). The full model (
Audio + Visual) uses the complete architecture with audio–visual cross-modal attention, as described in
Section 3.2. Results are presented in
Table 6.
The results demonstrate that the visual-only model achieves a competitive mAP of 95.84%, surpassing several baselines in
Table 1 (e.g., MuSED at 95.6%). The full audio–visual model outperforms the visual-only configuration, improving the mAP by
and the mIoU by
, maintaining a robust performance across diverse scenes. The lower mIoU of the visual-only model (71.83% vs. 73.65%) suggests that audio features enhance the localization precision by providing complementary cues, particularly in scenarios with ambiguous visual information (e.g., partial face visibility or low lighting). These findings highlight the critical role of visual features in speaker localization while confirming that audio–visual fusion significantly enhances both accuracy and precision, aligning with the demands of in-flight medical support applications where robust localization is essential.
4.3.2. Experiments on the Easycom Dataset
Comparative experiments and cross-modal loss ablation study on the EasyCom dataset. In addition to the AVA-ActiveSpeaker dataset mentioned above, this paper presents comparative experiment results of the proposed model and an ablation study on the cross-modal loss using a 6-channel audio configuration, which aligns with common aircraft cabin microphone arrays, on the EasyCom dataset. The experimental setup is consistent with the AVA-ActiveSpeaker experiments. Detailed results are shown in
Table 7.
Specifically, compared with the results without the cross-modal loss function (), our method with a 6-channel audio configuration improves the localization accuracy by 0.22% and the localization precision by 0.56%, demonstrating the effectiveness of the proposed algorithm in enhancing the localization precision. This also fully illustrates that the cross-modal attention mechanism can effectively enhance the interaction between different modalities, leveraging the rich spatial cues provided by the 6-channel audio setup. The model performance is optimized with the incorporation of the cross-modal loss function (with ), achieving the best results: a localization accuracy of 95.12% and a localization precision of 56.87%.
Ablation study of the number of audio channels. To verify the impact of multichannel audio on the model proposed in this paper, an ablation experiment on the number of audio channels is conducted on the EasyCom dataset. Other configurations remained unchanged, and the number of audio channels (N-channel) is set to 2, 4, and 6, respectively, to reflect configurations commonly used in aircraft cabin microphone arrays. Experimental results are shown in
Table 8.
The results indicate that on the EasyCom dataset, using 4-channel audio data, outperforms 2-channel audio data, with the mAP improving by 1.44% and the mIoU increasing by 2.51%. Incorporating a 6-channel configuration, which aligns with common aircraft cabin microphone arrays, further enhances the performance, yielding an additional 0.74% improvement in the mAP and 0.94% in the mIoU compared to the 4-channel setup. This validates the effectiveness of multichannel audio data in improving the accuracy and precision of speaker localization, as additional channels provide richer spatial cues for disambiguating speakers in acoustically complex environments.
However, the localization precision (mIoU) on the EasyCom dataset remains significantly lower than that on the AVA-ActiveSpeaker dataset (73.65%). The primary reason for this gap is the extremely small facial area in the EasyCom dataset, where faces typically occupy less than 1% of the image, compared to a much higher proportion in the AVA-ActiveSpeaker dataset. This small facial area, due to the wide field of view in egocentric cabin recordings, makes it challenging for the model to extract precise visual features, leading to difficulties in aligning predicted bounding boxes with ground-truth annotations.
4.3.3. Experiments on the AirCabin-ASL Dataset
To evaluate CMAVFN’s robustness in aircraft cabin environments, we assess models pretrained on AVA-ActiveSpeaker and EasyCom using the AirCabin-ASL dataset without domain-specific fine-tuning. We segment AirCabin-ASL into three noise-level subsets:
Low Noise (e.g., mid-flight check-ins with ambient silence),
Moderate Noise (e.g., near-galley conversations with engine hum), and
High Noise (e.g., turbulence, overhead announcements, or multi-party urgency).
Table 9 summarizes the performance under these varying conditions.
Models pretrained on AVA consistently outperform those trained on EasyCom across all noise categories, achieving an overall mAP of 91.35% and mIoU of 64.77%. The advantage stems from AVA’s broader diversity in visual perspectives and vocal expressions, which generalize better to the constrained and cluttered aircraft cabin setting. The EasyCom-pretrained model, while slightly less effective, still achieves a robust overall mAP of 89.77% and mIoU of 63.81%, benefiting from its egocentric cabin-specific pretraining. As expected, the performance declines under high-noise conditions due to overlapping commands, background announcements, and engine resonance.
Despite these challenges, both models exhibit strong zero-shot generalization, confirming CMAVFN’s capacity to handle non-frontal viewpoints, partial face visibility (e.g., oxygen masks, head tilts), and reverberant in-flight acoustics. These results validate the model’s applicability to real-time speaker localization in in-flight medical scenarios, where clear and timely verbal coordination is critical.
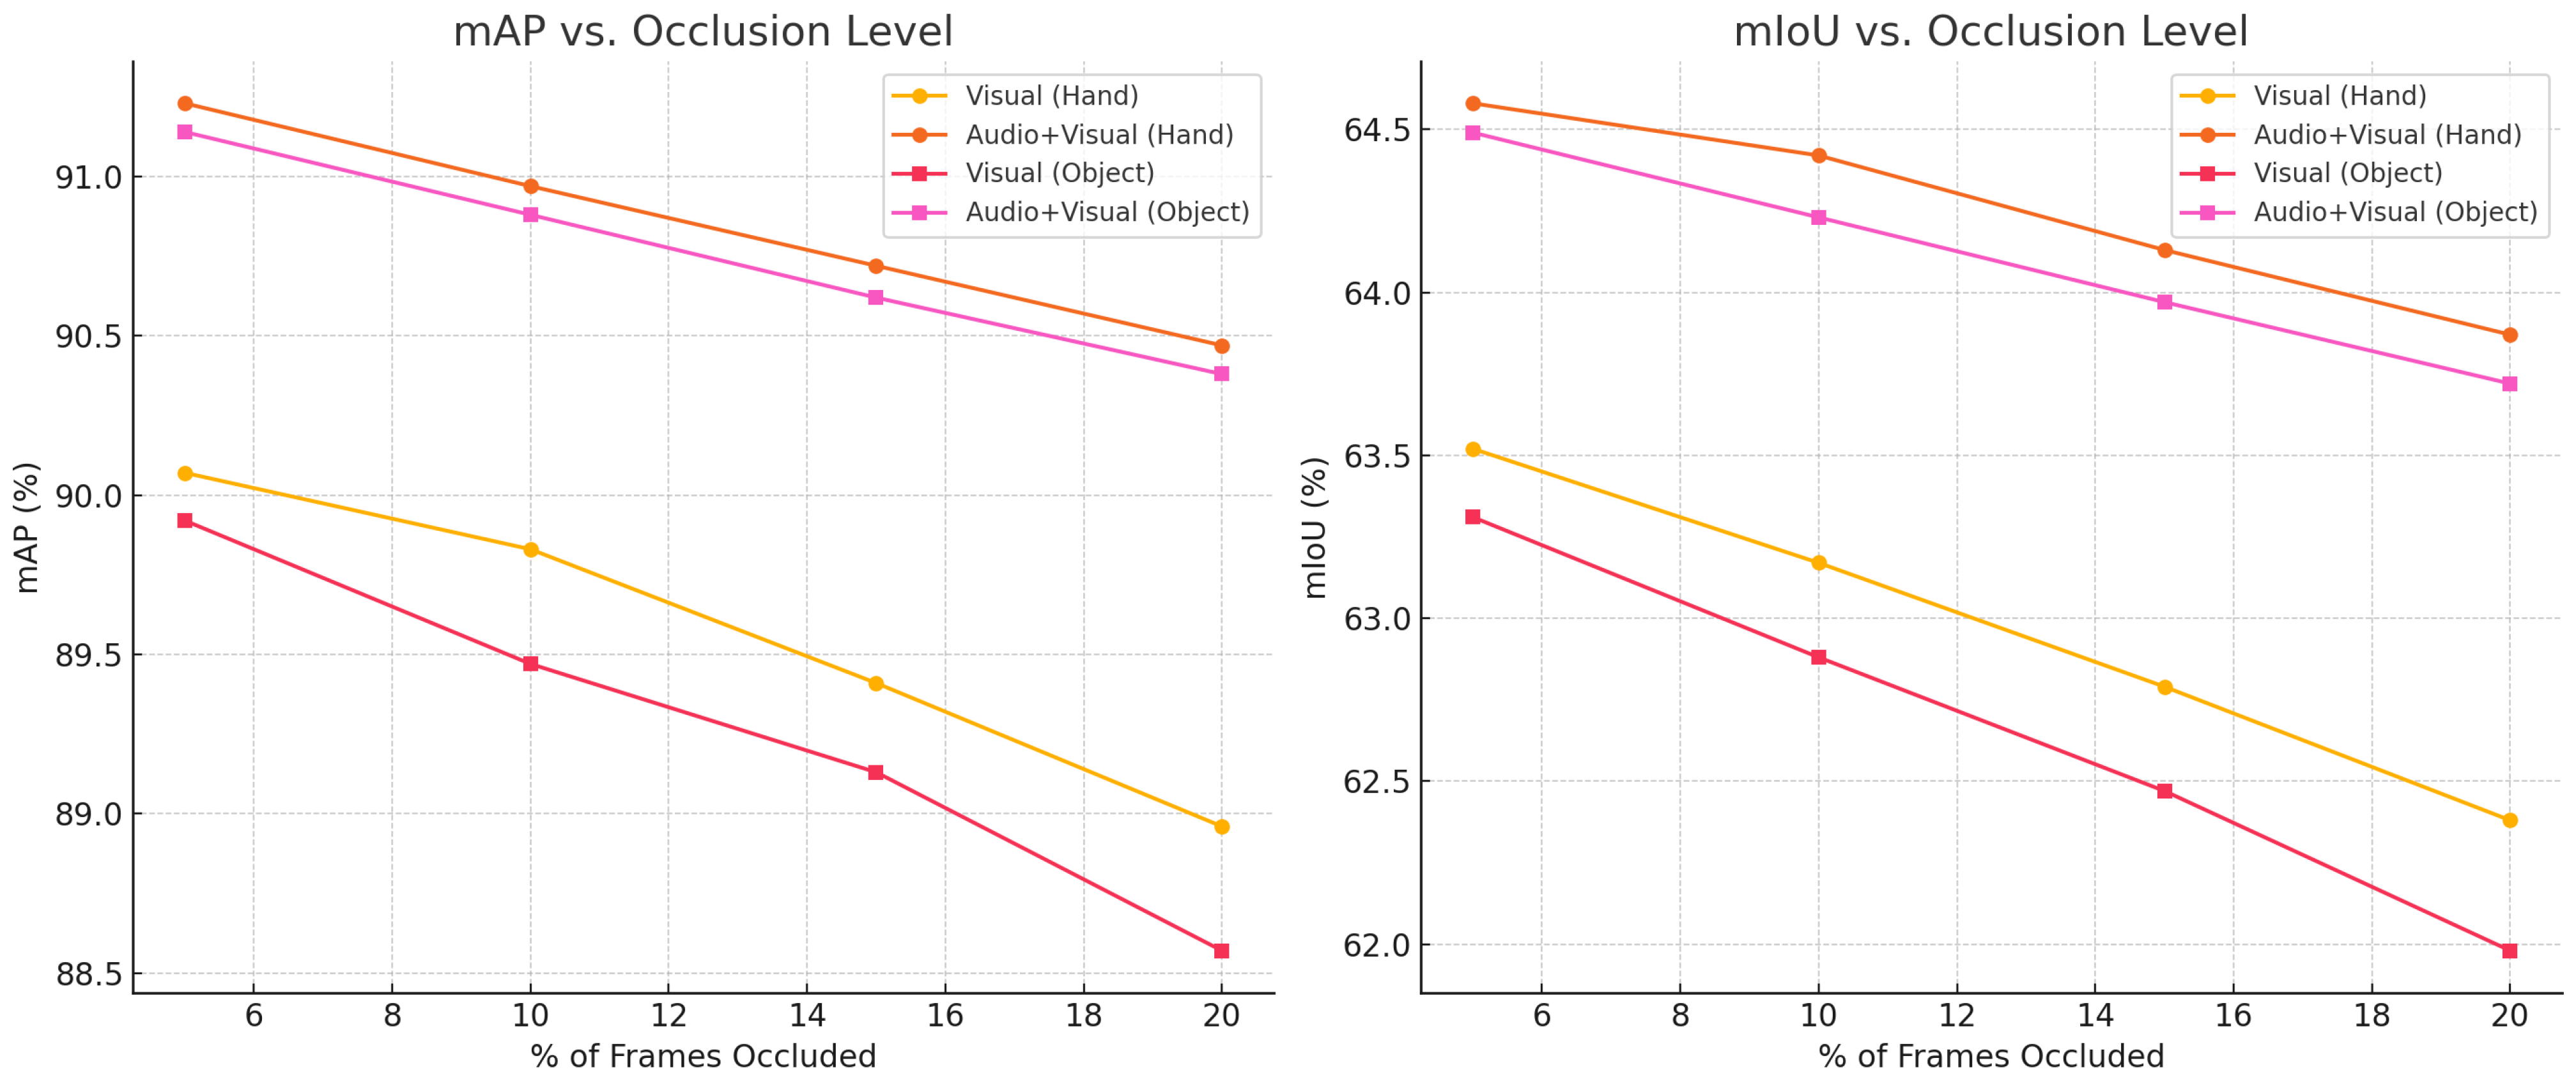
Robustness to Visual Occlusions. To evaluate CMAVFN’s robustness under visual occlusions, which are common in in-flight medical contexts (e.g., hand gestures or medical equipment blocking faces), we synthetically apply occlusions to 5%, 10%, 15%, and 20% of the bounding boxes in the AirCabin-ASL test set. Two occlusion types are examined: hand occlusions (mimicking crew or passenger interactions) and object occlusions (simulating oxygen masks or onboard medical tools). We compare Visual-only and Audio+Visual models pretrained on AVA-ActiveSpeaker, with results shown in
Figure 6.
Across all occlusion levels and types, the Audio+Visual model consistently outperforms the visual-only baseline. Despite some fluctuations across occlusion levels—reflecting the realistic variance of occlusion scenarios—the Audio+Visual model achieves mAP gains generally ranging from 1.10% to 1.70% and mIoU gains from 1.20% to 1.60%. Notably, the performance advantage persists even at the highest occlusion level (20%), where the Audio+Visual model maintains a strong performance (e.g., 90.47% mAP and 63.87% mIoU under hand occlusion), whereas the visual-only model sees a sharper decline (e.g., down to 62.38% mIoU). It is also shown in
Figure 7 that our model can still localize stably when more than 50% of the speaker’s facial region is occluded by the model.
While the results exhibit some non-monotonic behaviour—such as occasional metric rebounds at 10% or 15% occlusion levels—these are consistent with the expected variability in face detection accuracy under partially occluded and dynamically changing scenes. Overall, object occlusions tend to produce slightly more degradation than hand occlusions, likely due to their irregular coverage of key facial regions, aligning with real-world cases where medical devices obscure landmarks critical for visual understanding.
4.3.4. Visualization Examples
Figure 8,
Figure 9 and
Figure 10 present qualitative results of our model on the AVA-ActiveSpeaker, EasyCom, and AirCabin-ASL datasets, respectively. Each example includes the predicted attention heatmap (“Pred Mask”) and the ground-truth (“Speaker Box”).
On AVA-ActiveSpeaker, the model effectively captures speaker cues in diverse visual settings with clear frontal faces and consistent lighting. EasyCom results demonstrate robust performance in reverberant and cluttered indoor environments, with accurate speaker localization even under occlusion and multi-speaker interactions.
In the AirCabin-ASL dataset, which features constrained viewpoints and aviation-specific challenges (e.g., occlusion from seatbacks, masks, and non-frontal angles), the model maintains a strong localization performance. Notably, despite elevated background noise and partial visibility, predicted speaker regions remain well-aligned with ground truth annotations. These visualizations highlight the model’s generalization capability across domains, and underscore its effectiveness in high-stakes environments, such as in-flight medical response.


