1. Introduction
Microelectromechanical system (MEMS) [
1] resonators have emerged as pivotal components in biosensing, mass detection, and core resonant elements of integrated circuits, leveraging their high sensitivity and miniaturisation capabilities [
2]. Resonant sensors based on the inherent vibration characteristics of mechanical resonant-sensitive elements can use vibration frequency, phase, and amplitude as sensitive information parameters to achieve a variety of physical quantity measurements, with excellent repeatability, resolving power, and stability [
3]. The basic structure of resonant sensors comprises a sensitive element, excitation unit, pick-up unit, and control circuit. The sensitive element, as the core of the resonant sensor, is directly linked to the physical quantity to be measured, and its vibration characteristics affect the performance of the resonant sensor [
4]; the excitation unit and pick-up unit act as electromechanical conversion elements, and the coupling mode and degree between them affect the energy transfer efficiency; and the control circuit is used to maintain the interrelationships between the sensitive element and the excitation and pick-up units, and to provide the parameter output.
The selection of the excitation unit and pick-up unit and the coordination with the resonance-sensitive element are an important part of the structural design of the resonant sensor, which determines the relative position distribution between the three elements and the energy transfer loss of this structure [
5]. The electromagnetic induction principle is applied in electromagnetic excitation and magnetoelectric detection, providing a non-contact way to achieve both energy supply to the resonant-sensitive element and vibration frequency acquisition from it, thus minimising possible adverse effects on the resonant-sensitive element [
6].
Resonant density sensors exploit changes in the resonant frequency of a vibrating system to reflect variations in the density of the fluid within the sensitive element, thereby offering significant potential for high-precision density measurements [
7]. In 1969, Austrian physicist Otto Kratky published a seminal paper that first introduced the concept of the resonant density sensor, laying the foundation for research in this field over the following decades [
8]. His sensor employed a relatively rudimentary design, consisting of inlet and outlet tubes and a liquid reservoir sphere, and did not account for environmental influences on density measurements. In 1974, Patrick Picker and colleagues at the University of Sherbrooke in Canada extended the application of resonant densitometers to the field of process control. They used a stainless-steel V-shaped resonator as the sensing element and demonstrated that, for liquids with viscosities below 10 cp, viscosity had minimal impact on density measurements [
9]. In 1980, Alfred P. Wenger of the Straumann Institute in Switzerland proposed a viscosity correction theory to address the issue of reduced accuracy of resonant densitometers in high-viscosity-liquid applications [
10]. In 1984, Henry J. Albert and colleagues at the University of Delaware in the United States developed a single U-shaped resonant densitometer structure, enabling operation under extreme conditions of 700 K temperature and 40 MPa pressure [
11]. In 1986, T. Retsina and colleagues at Imperial College London established a comprehensive mathematical model for vibrating-tube resonators, overcoming the prevalent reliance on empirical design approaches and providing a theoretical framework for sensor development [
12]. In 2007, Edwin Krasser and colleagues at Graz University of Technology in Austria proposed a circuit architecture that integrates closed-loop self-excited oscillation with a digital phase-locked loop, thereby achieving the precise capture of the resonant frequency [
13]. In 2019, Andreas Rechberger and colleagues at Anton Paar proposed the use of a pulse excitation method to determine the natural frequency and quality factor of the resonator, introducing a new paradigm into resonant density measurement [
14]. More recently, in 2022, Olga Prokopová and colleagues focused on vibrating-tube densitometers operating at atmospheric pressure, employing single U-shaped glass resonators, and proposed an improved temperature calibration method along with an uncertainty evaluation strategy [
15].
However, research on resonant density sensors based on electromagnetic excitation and magnetoelectric detection remains limited, with a lack of systematic theoretical analysis and experimental validation. In particular, the coupling characteristics between the mechanical structure and closed-loop circuitry have not been sufficiently explored, which restricts performance optimisation and hinders broader practical applications. Specifically, (1) early studies primarily focused on conceptual proposals and feasibility demonstrations, without providing systematic analyses of sensor performance [
8]; (2) although some works introduced viscosity correction, temperature compensation, or circuit improvement strategies, their performance characterisation largely remained qualitative or only partially quantitative. For example, precision was vaguely described as “ppm-level accuracy” or as “approximately 0.1% within the ranges of
= 0.2 g/cm
3 × 500 cp or 0.5 g/cm
3 × 200 cp,” where
denotes density and
denotes dynamic viscosity, while comprehensive evaluations of sensitivity, resolution, and measurement uncertainty were lacking [
9,
10,
11]; and (3) more recently, a pulsed excitation method was reported to achieve a quality factor of 2000 and a standard deviation of oscillation period measurements below 0.5 × 10
−9 s. Nevertheless, its complex principle makes it more suitable for benchtop density meters, rendering it less applicable to portable devices, and further research is still required before practical deployment can be realised [
14].
To address these issues, this study utilises a hyperbolic U-shaped resonant tube as the sensitive element, combined with a closed-loop self-excited oscillation circuit, to design and realise a portable resonant density sensor suitable for the high-precision measurement of small-volume liquids. Through the systematic analysis of the amplitude–frequency characteristics of the resonant network in open-loop mode, the quality factor of the mechanical structure was obtained. Furthermore, under closed-loop operation, the sensor’s measurement stability and density sensitivity were validated across four different fluids. The results not only enrich the theoretical framework of electromagnetic excitation and magnetoelectric detection resonant density sensors, but also provide essential theoretical support and technical guidance for their application in fluid density measurement.
3. Structural Design and Comparative Analysis
Resonant density sensors operate on the resonance principle, where fluid density changes shift the resonance frequency [
22]. Excessively low frequencies increase susceptibility to external vibration noise, reducing the signal-to-noise ratio [
23]; excessively high frequencies introduce parasitic circuit parameters and processing accuracy limitations, degrading the quality factor and measurement stability [
24]. Therefore, optimal resonance frequency selection enhances density sensitivity, measurement resolution, and noise immunity while ensuring accuracy and reliability.
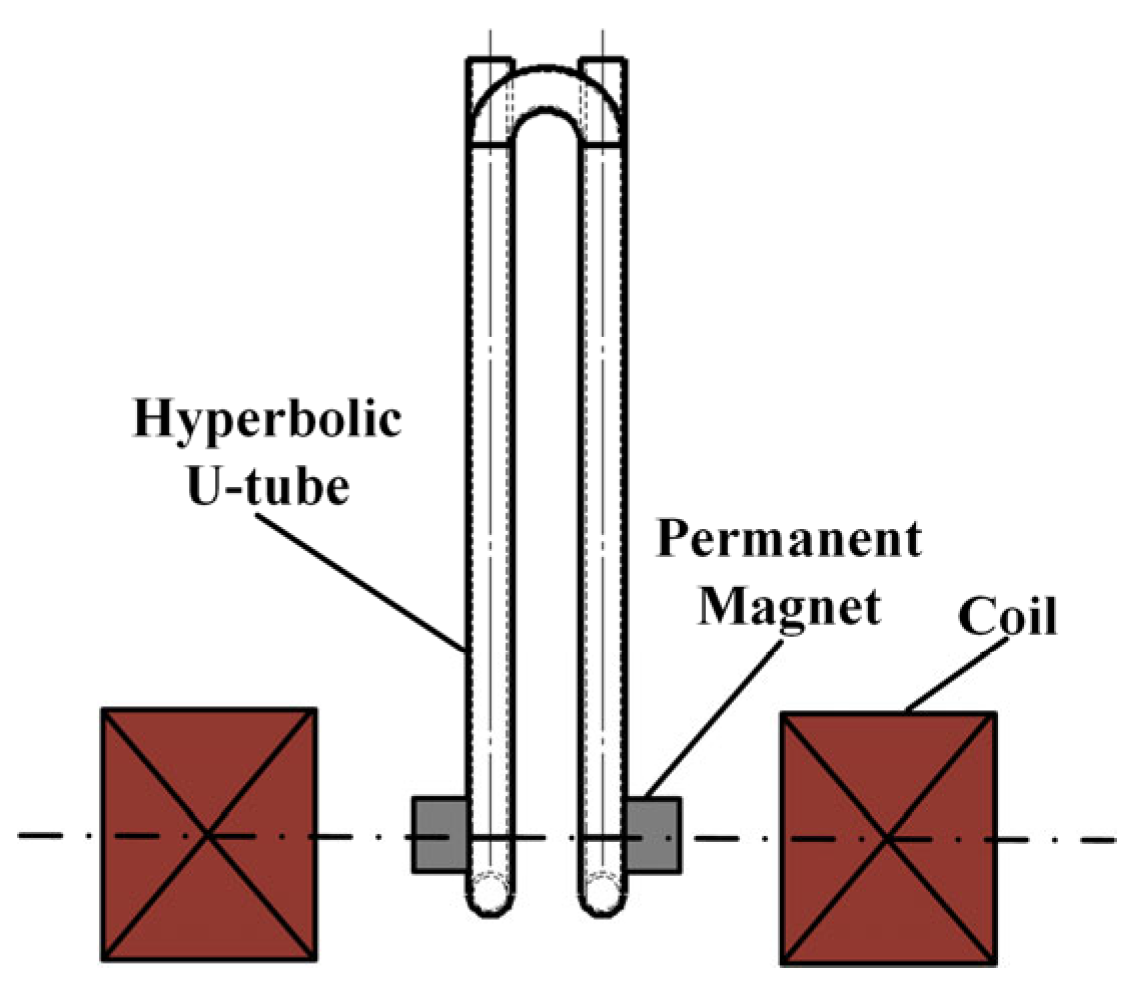
This study employs a hyperbolic U-tube resonant sensor structure (side view:
Figure 4). ANSYS Workbench modal simulations analyse how geometric parameters—inner radius
r, wall thickness
h, effective length
l, and outer radius
R—affect the resonance frequency of the U-tube.
The typical resonator parameters of the hyperbolic U-tube are inner radius
r1, wall thickness
h1, effective length
l1, and outer radius
R1. Based on these parameters, we employ ANSYS finite element analysis to investigate how geometric parameters affect resonance frequency and select optimal values meeting design requirements. The parametric influence is shown in
Figure 5.
Figure 5 shows the resonant frequencies of the first six modes for hyperbolic U-tubes as functions of inner radius (
r), wall thickness (
h), effective length (
l), and outer radius (
R). The dimensional parameters
r1–
r6,
h1–
h7,
l1–
l7, and
R1–
R7 represent incremental variations, with resonant frequencies of modes 1–6 exhibiting an overall increasing trend. Specifically,
Modes 1–3 demonstrate smooth variations (<100 Hz);
Modes 4–5 show distinct monotonic trends with reduced modal interference;
Mode 6 exhibits a significant frequency increase.
Curve analysis reveals the following:
Increased r or h enhances sectional stiffness and optimises mass distribution, strengthening the stiffness–frequency correlation. Conversely, increased l reduces axial stiffness and introduces additional mass, while larger R alters geometric configuration, weakening bend-region stiffness and extending the vibration path length. These effects collectively amplify inertial forces, reducing resonant frequencies. Rational dimensional design confines resonance frequencies within target operational ranges while maintaining structural stability.
4. Experimental Design and Analysis
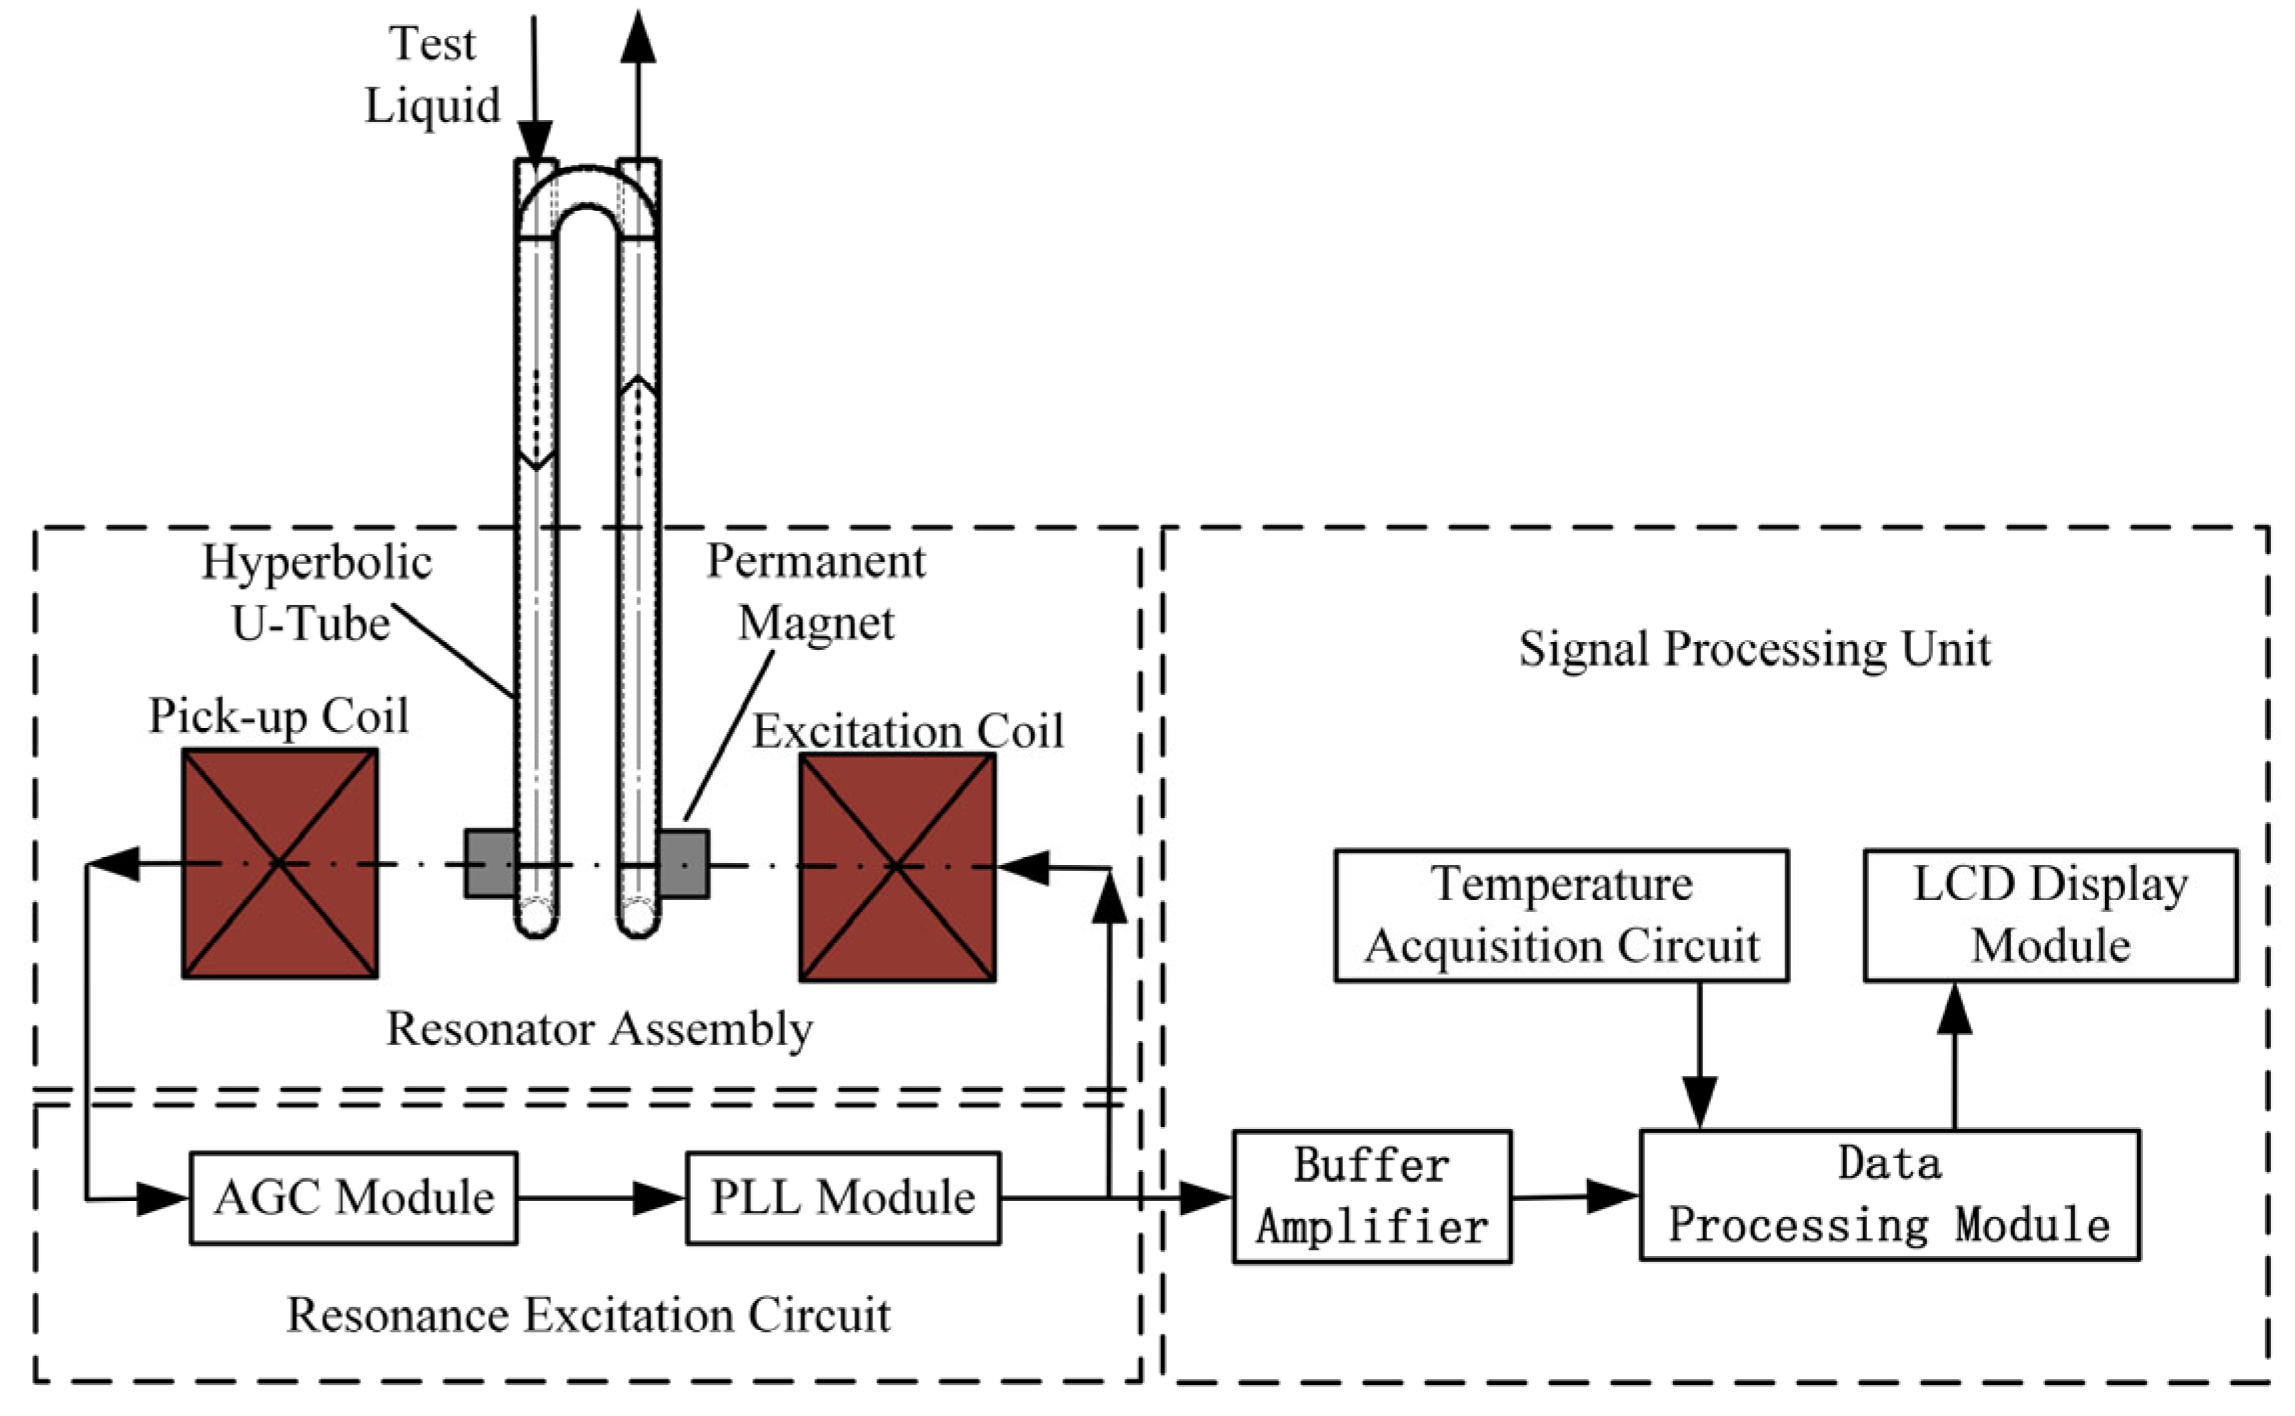
Figure 6 shows the system architecture of the resonant liquid density sensor. The design integrates three functional modules: the resonator assembly, which governs core performance parameters; the resonance excitation circuit, which sustains mechanical oscillation; and the signal processing unit for outputting quantified measurements. Key performance indicators including quality factor (Q), density sensitivity, and measurement stability collectively define sensor efficacy [
25]. The quantitative evaluation of these characteristics is provided through experimental validation in
Section 3.
To ensure seamless integration between the mechanical resonant structure and its control circuitry for sustaining the continuous self-excitation of the sensing element in a stable first-order symmetrical mode, the closed-loop system must satisfy the Barkhausen criterion [
26]:
where
denotes the frequency transfer function of the mechanical resonant structure;
represents the frequency transfer function of the resonant control circuitry; and
.
When the loop system, comprising the mechanical resonant structure and the control circuit, is powered on, weak noise signals are generated within the loop. These noise signals can be regarded as the superposition of numerous sinusoidal waves of different frequencies. After passing through the resonant sensing element, their amplitudes are attenuated and their phases are shifted according to the frequency response of the sensing element.
It is noteworthy that within the noise spectrum, there exists a specific frequency exactly matching the first-order symmetric resonant frequency of the sensing element. At this frequency, the amplitude attenuation of the noise signal is minimal, and the phase remains unchanged. When the gain of the control circuit is adjusted to precisely compensate for the attenuation at this frequency, while omitting phase adjustment, the noise signal at this frequency is amplified after passing through the closed-loop path, with its phase remaining constant.
For other frequency components, however, the amplitudes experience further attenuation and the phases undergo shifts. As the noise signals circulate repeatedly within the loop, the sinusoidal component that coincides with the first-order symmetric resonant frequency is gradually reinforced and eventually emerges from the noise, whereas all other frequency components continue to decay and remain as background noise. This mechanism, through positive feedback, continually amplifies the signal at the resonant frequency, ultimately sustaining the resonant state. Consequently, the resonant density sensor can stably output the first-order symmetric resonant frequency, which is directly related to the measured density.
4.1. Amplitude–Frequency Characteristic Testing Experiment
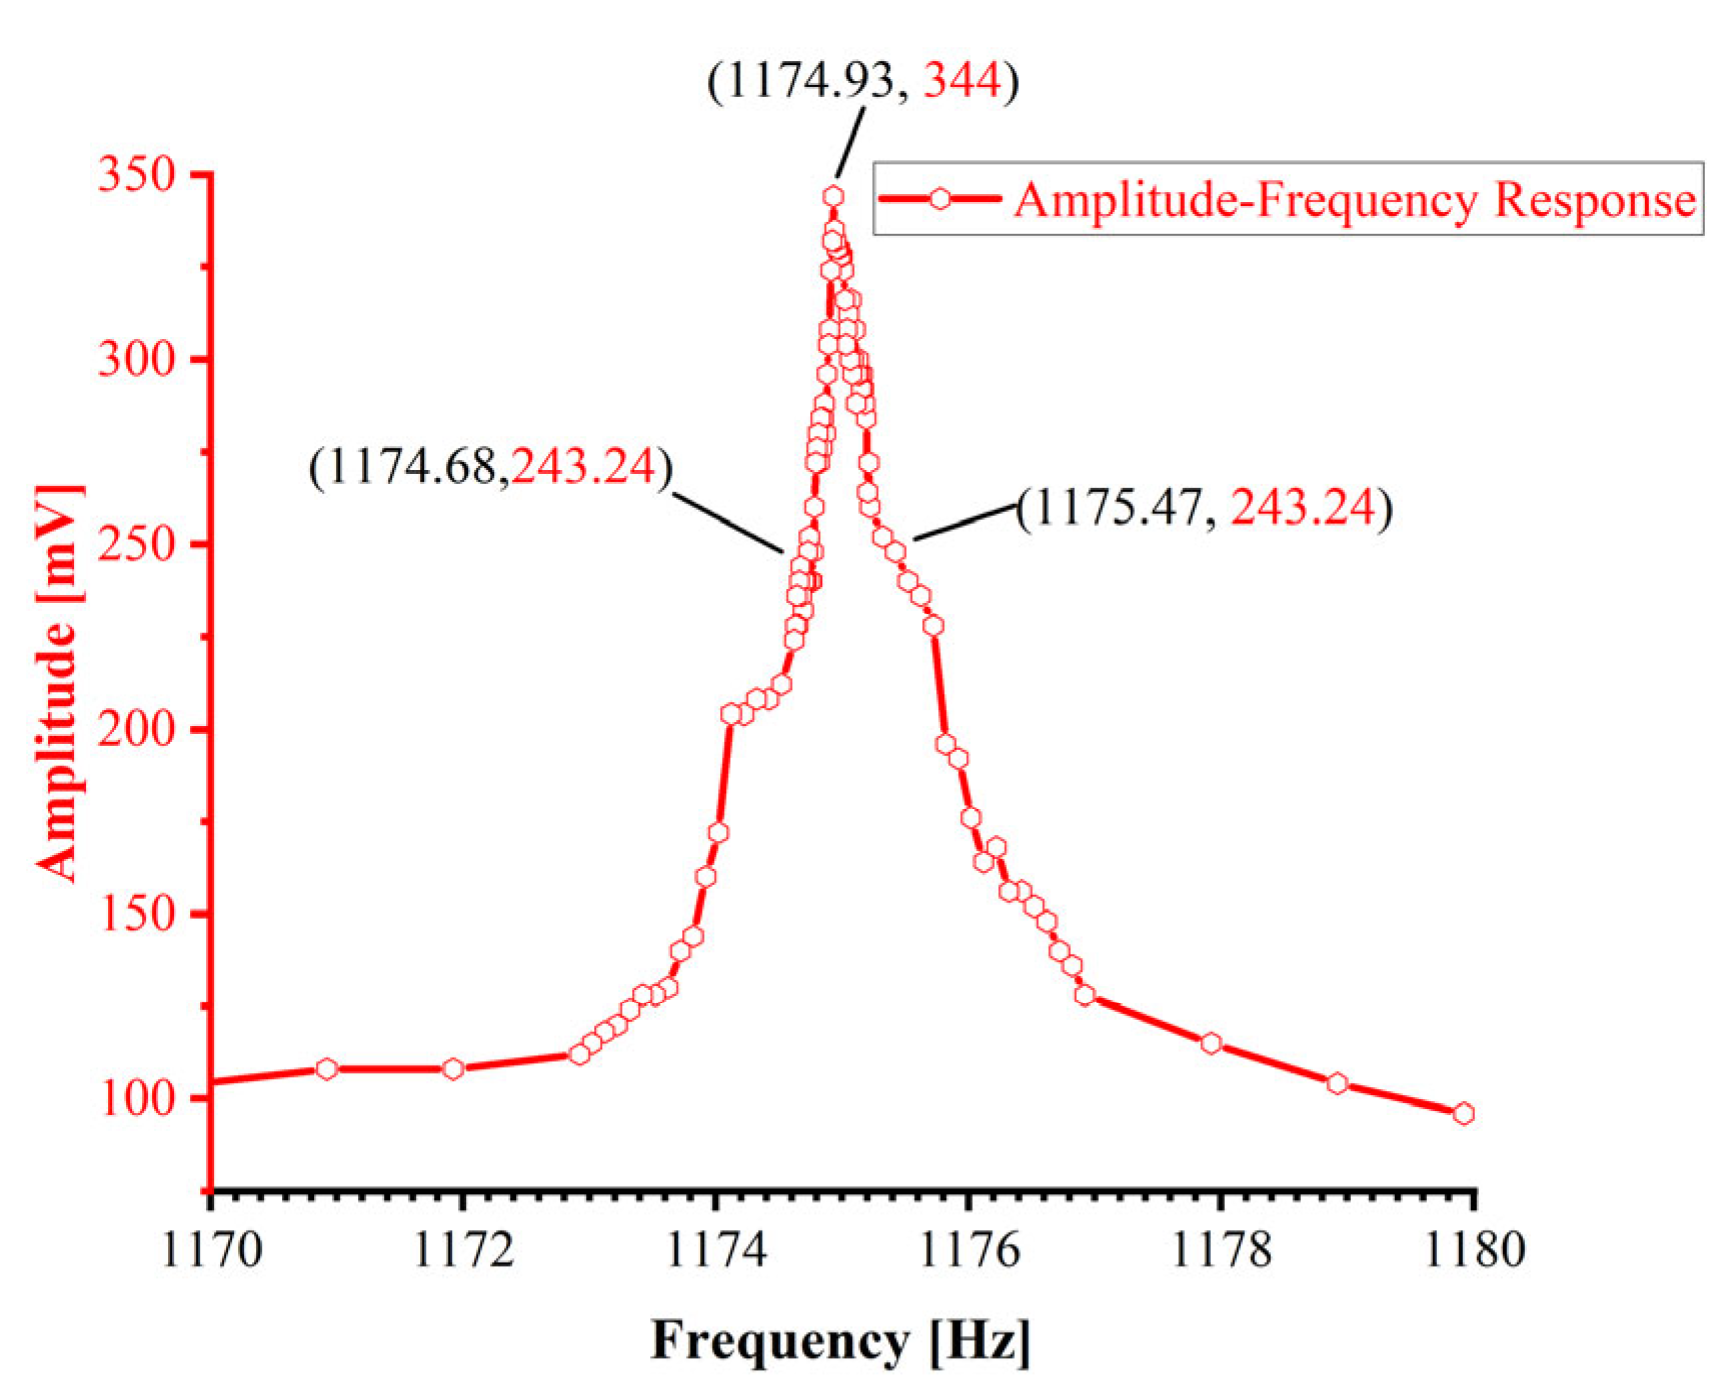
To eliminate interference from closed-loop control circuits during the dynamic characteristic evaluation of mechanical structures, open-loop frequency sweeps (1170–1180 Hz) characterise the amplitude–frequency response of the resonator assembly [
27]. A 3 Vpp constant-amplitude AC excitation signal from a signal generator (SDG1022X, SIGLENT Technologies, Shenzhen, China) drives the sensitive mechanical element. The pick-up coil output is synchronously recorded by an oscilloscope (TBS1104, Tectronix, Beaverton, OR, USA) to acquire raw amplitude–frequency response data.
Figure 7 depicts the amplitude–frequency response curve measured in air, showing a resonant frequency of 1174.93 Hz with an operational bandwidth of 1174.68–1175.47 Hz.
In sensor characterisation, the quality factor (
Q) constitutes a critical parameter governing measurement precision, interference immunity, and operational stability. The quality factor
Q is defined as 2π multiplied by the ratio of total stored energy to energy dissipated per oscillation cycle in a resonant system [
28]. Practical
Q values are conventionally acquired via indirect experimental methods. The bandwidth method represents one of the most established techniques for
Q-factor quantification, derived from the frequency-to-bandwidth ratio at the half-power point of the sensitive element. This approach demonstrates robust reliability for systems where
Q < 10
6. The quality factor can be derived from the amplitude–frequency characteristics of resonant networks as follows:
In resonant sensors, the resonating element constitutes a weakly damped system, where the quality factor
Q relates to the damping ratio
ξ through the following expression [
29]:
4.2. Basic Calibration Experiments
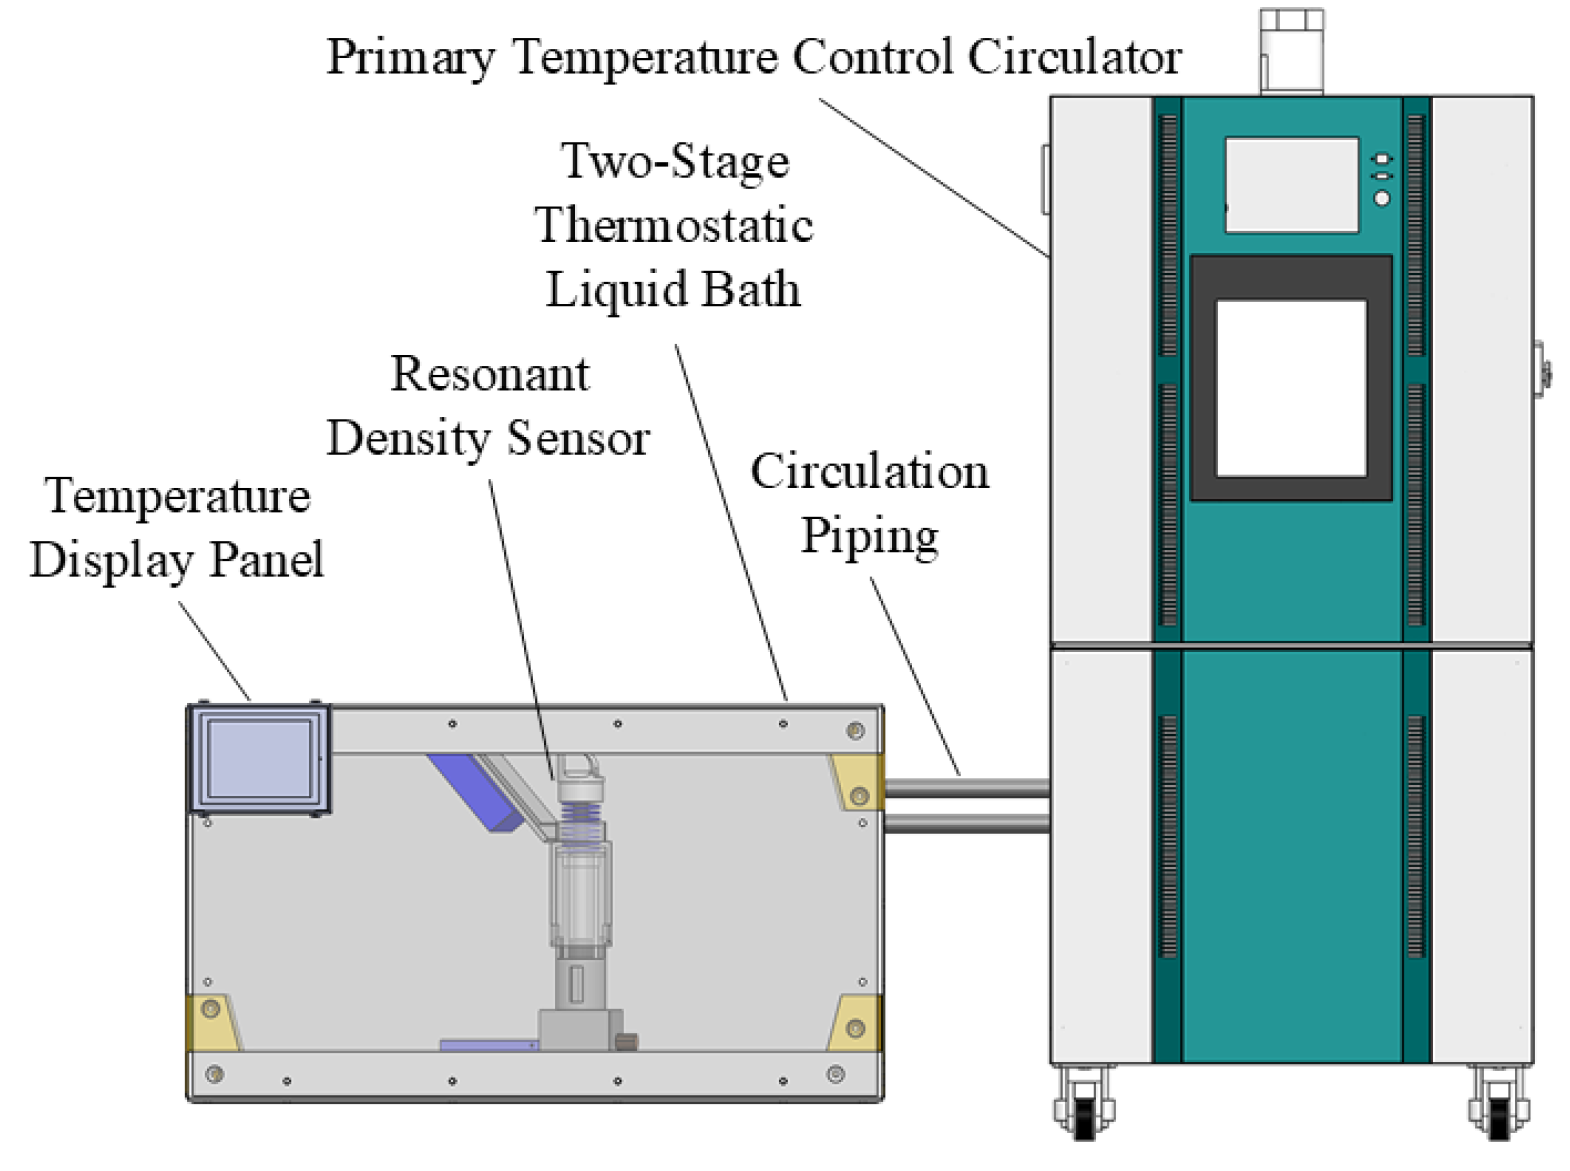
The calibration experiment of the resonant density sensor needs to be conducted under a controlled temperature of 20 °C. Therefore, this study implements a two-stage water bath temperature control system, with the experimental setup shown in
Figure 8.
As shown in
Figure 8, the uncalibrated resonant density sensor is placed inside the two-stage constant-temperature water bath, and the real-time temperature inside the water bath is displayed on the temperature monitor. The temperature within the two-stage water bath is regulated in two ways: firstly, through a primary temperature control circulator connected via circulation piping, and secondly, by the water bath itself maintaining temperature stability. This two-stage control ensures stable temperature conditions within the water bath during the experiments. Moreover, both the basic calibration experiment and the temperature compensation experiment of the resonant density sensor are carried out using this two-stage water bath temperature control setup.
Resonant density sensors utilise mechanical resonance principles for high-precision density measurements, constituting an indirect metrological approach [
30]. Density (
) serves as the target measurand, while resonance period (
T) functions as the intermediate variable. Consequently, establishing the functional relationship between T and
is essential. As demonstrated in
Section 1, the theoretical correlation between density and period follows Equation (6). To enhance fitting accuracy, a linear correction term is incorporated, yielding the final liquid density–resonance period relationship:
where
denotes the liquid density measured by the resonant sensor [kg/m
3];
Ki represents the calibration coefficients of the resonant density sensor (
i = 0, 1, 2); and
T is the output resonance period of the densitometer [μs].
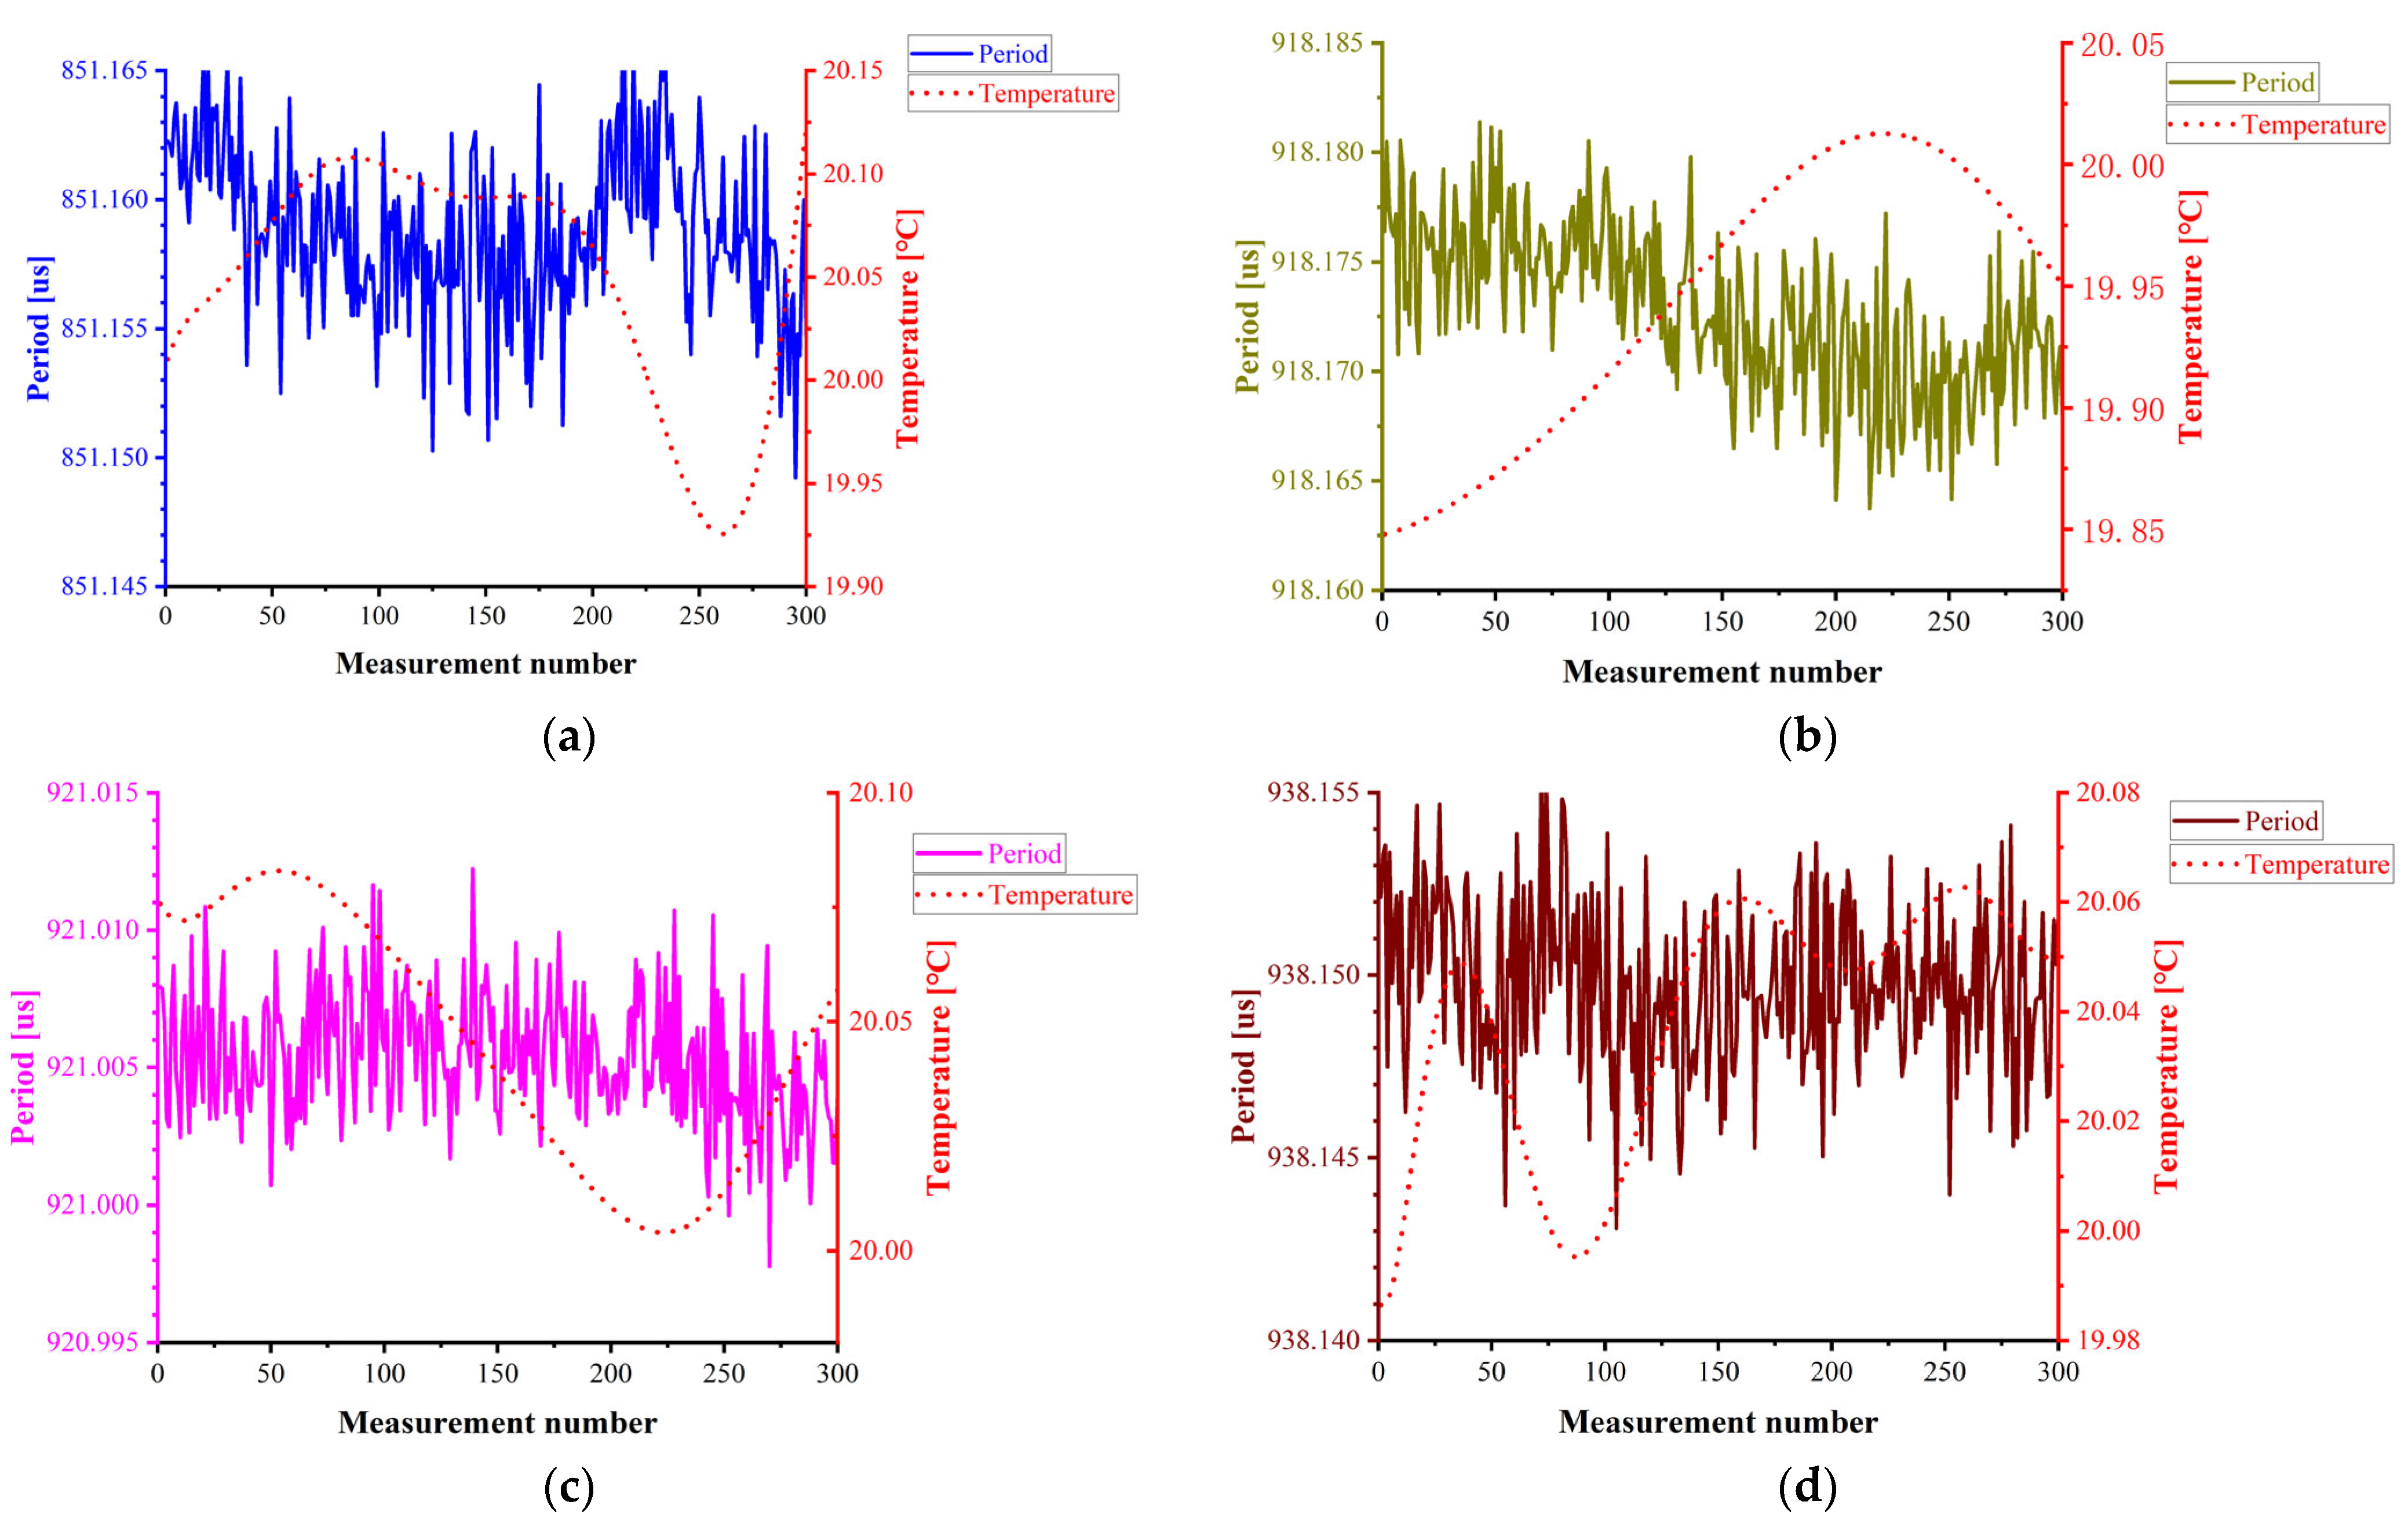
Calibration experiments are conducted under temperature-controlled conditions at 20 °C to eliminate thermal effects on resonant density sensor calibration. In this study, the period–density functional relationship is established by measuring the resonance period variations in air and three calibration liquids (denoted Air and Liquid 1–3) at 20 °C. The period fluctuation data for each fluid are presented in
Figure 9.
The reference density values of the calibration liquids were measured using a DMA5000 benchtop densitometer (Anton Paar, Graz, Austria), achieving a measurement accuracy of 5 × 10
−3 kg/m
3 [
31]. This precision satisfies calibration experimental requirements.
Table 1 presents the period values and corresponding reference densities of all fluids at 20 °C.
The fundamental density equation for the resonant liquid density sensor is derived as follows:
The measured period values are then substituted into the fundamental density Equation (11) to calculate the densities of each calibration fluid, as summarised in
Table 1. The absolute error between the calculated and reference densities remains within ±0.50 kg/m
3, with relative errors consistently below ±1%.
4.3. Temperature Compensation Experiments
In liquid density precision measurement and control, temperature variation exerts a dominant influence on density [
32]. Temperature compensation experiments constitute a critical procedure to prevent ambient temperature from compromising measurement accuracy and stability. While Equation (10) provides the fundamental calibration formula for resonant liquid density sensors, it neglects thermal effects. The implementation of Equation (12) enables temperature compensation for density measurements acquired via resonant sensors, thereby enhancing measurement precision.
In this experiment, three calibration liquids (Liquids 1–3) underwent temperature-controlled testing from 15 °C to 25 °C. The temperature setpoints and corresponding period fluctuations are presented in
Figure 10.
The DMA5000 benchtop densitometer (Anton Paar, Austria) employs advanced temperature-scanning technology, enabling the automatic temperature regulation of samples within preset ranges and real-time recording of corresponding density data. Leveraging this capability, the reference densities of three liquids at specified temperatures were measured.
Table 2 presents the resonance periods and corresponding reference densities of each fluid at temperatures ranging from 15 °C to 25 °C. The modified density equation for the resonant liquid density sensor is derived as follows:
The integrated model combining Equations (11) and (13) provides comprehensive density correction for the resonant liquid density sensor. Substituting measured period values into Equation (11) and subsequently applying Equation (13) yields calculated and corrected densities for each liquid (
Table 2). The absolute error between corrected and reference densities remains within ±1.0 kg/m
3, with relative errors below ±0.2%.
4.4. Density Measurement Sensitivity Analysis
Density measurement sensitivity constitutes a critical performance indicator for resonant density sensors, governing achievable measurement range and resolution. Higher sensitivity correlates with enhanced measurement resolution. Defined as the shift magnitude in resonant frequency per unit density change of the fluid within the resonance tube [
33], this parameter ensures practical detectability: sufficient sensitivity amplifies frequency responses to minute density variations, while inadequate sensitivity may obscure density drifts due to inherent limitations in frequency measurement accuracy. The formal definition is provided in Equation (14).
Using predicted modal resonant frequencies in each medium as a reference, density measurement sensitivities were quantified across three transition ranges: (I) Air to Liquid 1, (II) Liquid 1 to Liquid 2, and (III) Liquid 2 to Liquid 3. This analysis utilised measured resonant frequency deviations and corresponding density differentials within each interval. The resulting sensitivities are compiled in
Table 3.
As the liquid density increases, the density measurement sensitivity decreases. Theoretical analysis reveals two underlying mechanisms. First, increased liquid density augments the inertial load on the sensor’s resonant element (hyperbolic U-tube), elevating the equivalent mass of the resonant system. This mass gain compromises the operational efficiency of mechanical structures designed for non-extreme conditions. Second, higher-density liquids often exhibit increased viscosity, intensifying energy dissipation through boundary layer vibrations, consequently reducing frequency detection resolution.
5. Conclusions
This study focuses on liquid density measurement based on the resonance principle, utilising a hyperbolic U-shaped resonant tube with an electromechanical transduction method combining electromagnetic excitation and magnetoelectric detection to successfully establish a closed-loop measurement system. The system performance was comprehensively evaluated through metrics including the mechanical structure’s quality factor, density measurement sensitivity, and measurement stability. Experimental results demonstrate that the designed mechanical structure achieves a quality factor exceeding 1000, indicating excellent vibration energy retention. The density measurement sensitivity is approximately −0.1 Hz·kg−1·m3, which approaches that of some mature commercial products but still exhibits a noticeable gap, suggesting significant potential for further optimisation, particularly through adjusting the size and geometry of the hyperbolic U-shaped resonant tube. Within the temperature range of 15 to 25 °C, the absolute error between the density compensation values and standard references remains within ±1 kg/m3, confirming the good temperature stability of the sensor.
However, this study did not address viscosity compensation of the resonant density sensor, resulting in considerable measurement errors for high-viscosity fluids and limiting its applicability in complex fluid environments. Future work should focus on developing compensation algorithms for viscosity effects and investigating their impact on measurement accuracy to enhance the sensor’s versatility and practical utility.

