Rainfall-Adaptive Landslide Monitoring Framework Integrating FLAC3D Numerical Simulation and Multi-Sensor Optimization: A Case Study in the Tianshan Mountains
Abstract
1. Introduction
2. Study Area
2.1. Geographical Location
2.2. Meteorological Conditions
3. Formation Conditions and Influencing Factors of Landslides
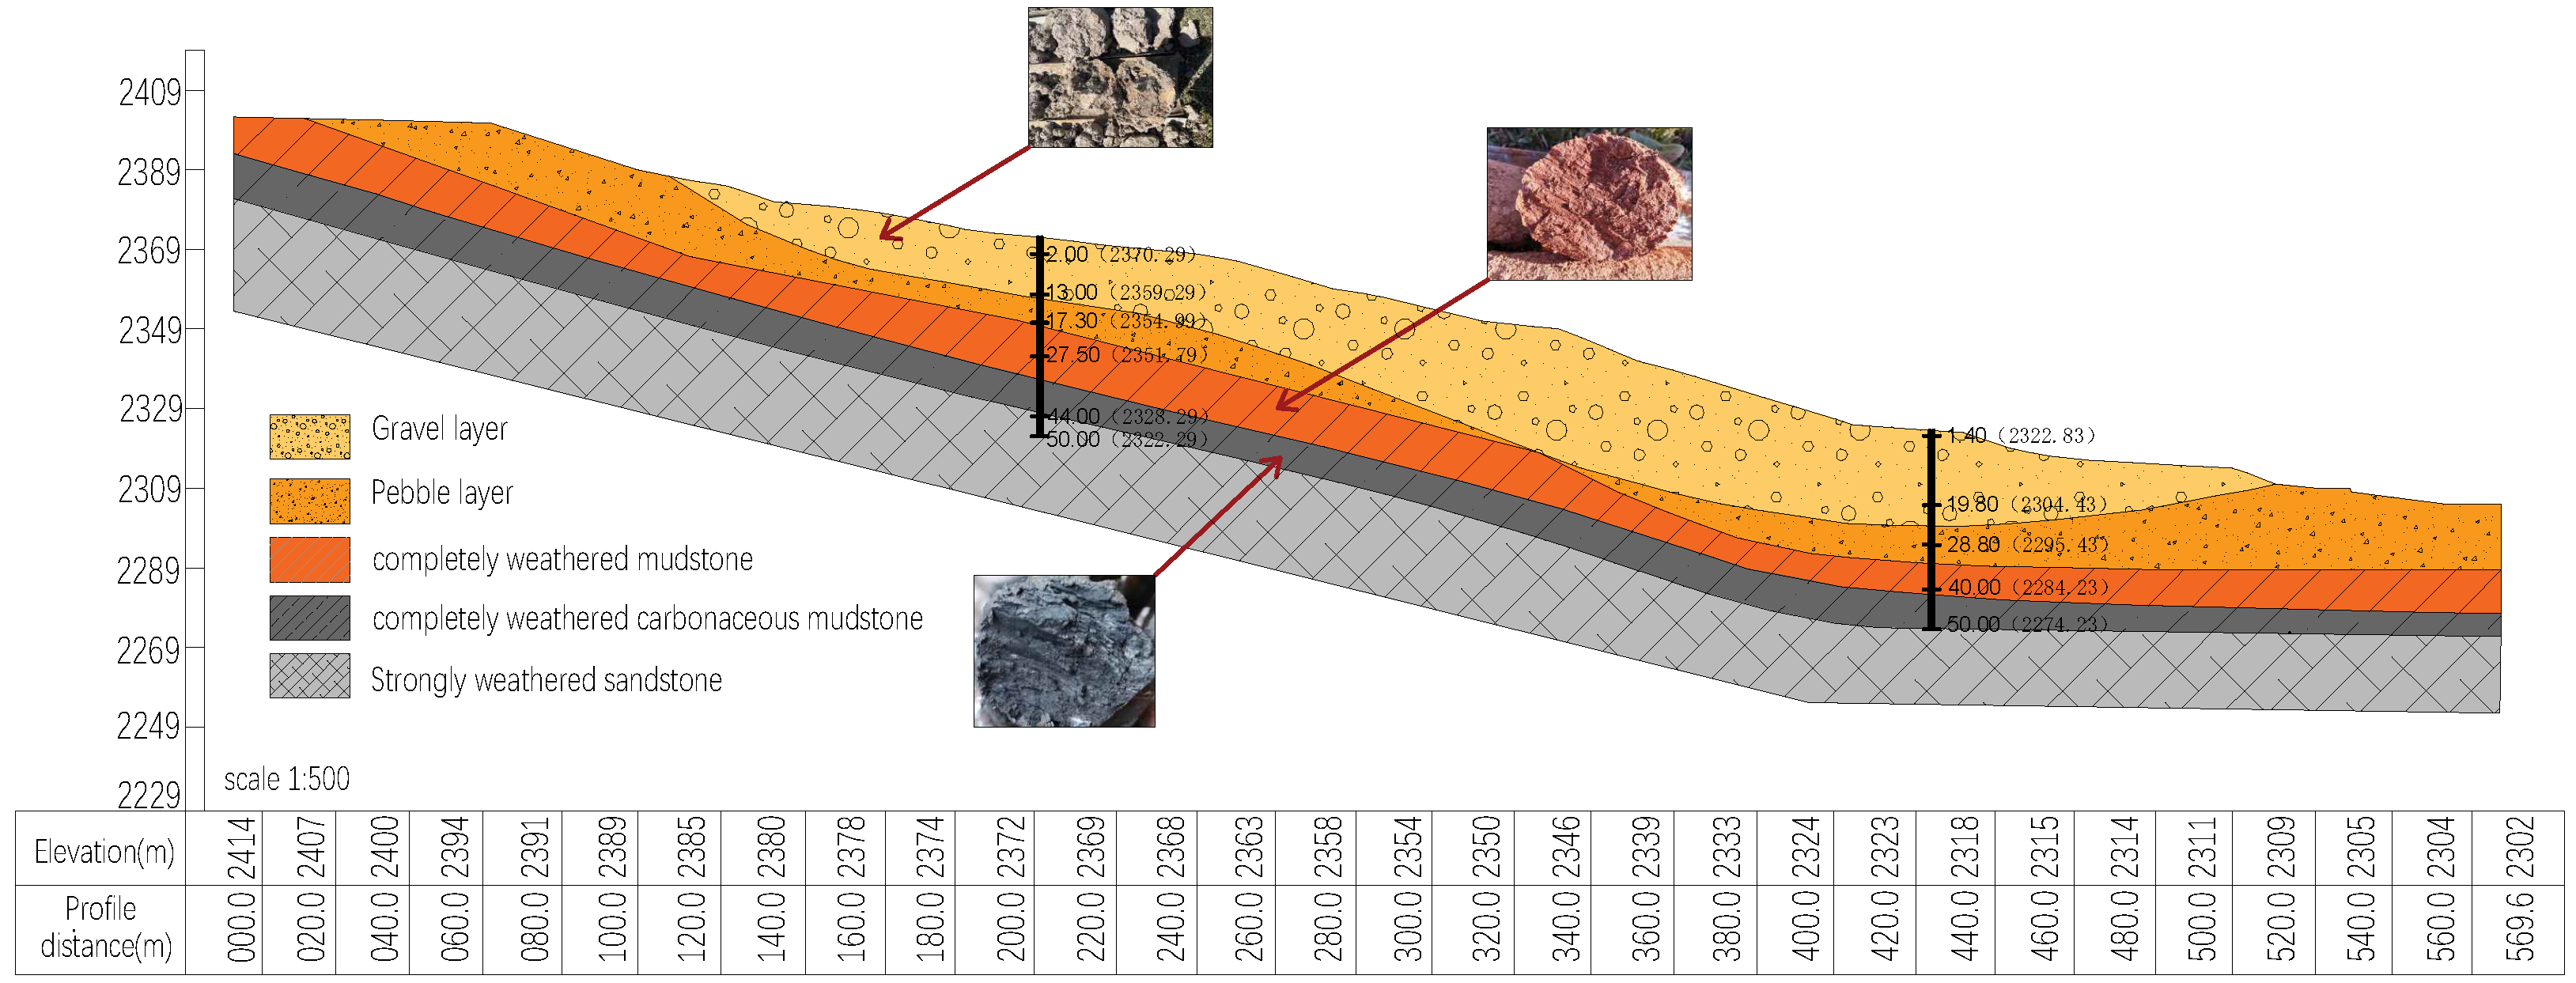
3.1. Geometric Morphology of Landslides
3.2. Structural Characteristics of Landslides
3.3. Signs of Deformation on the Surface
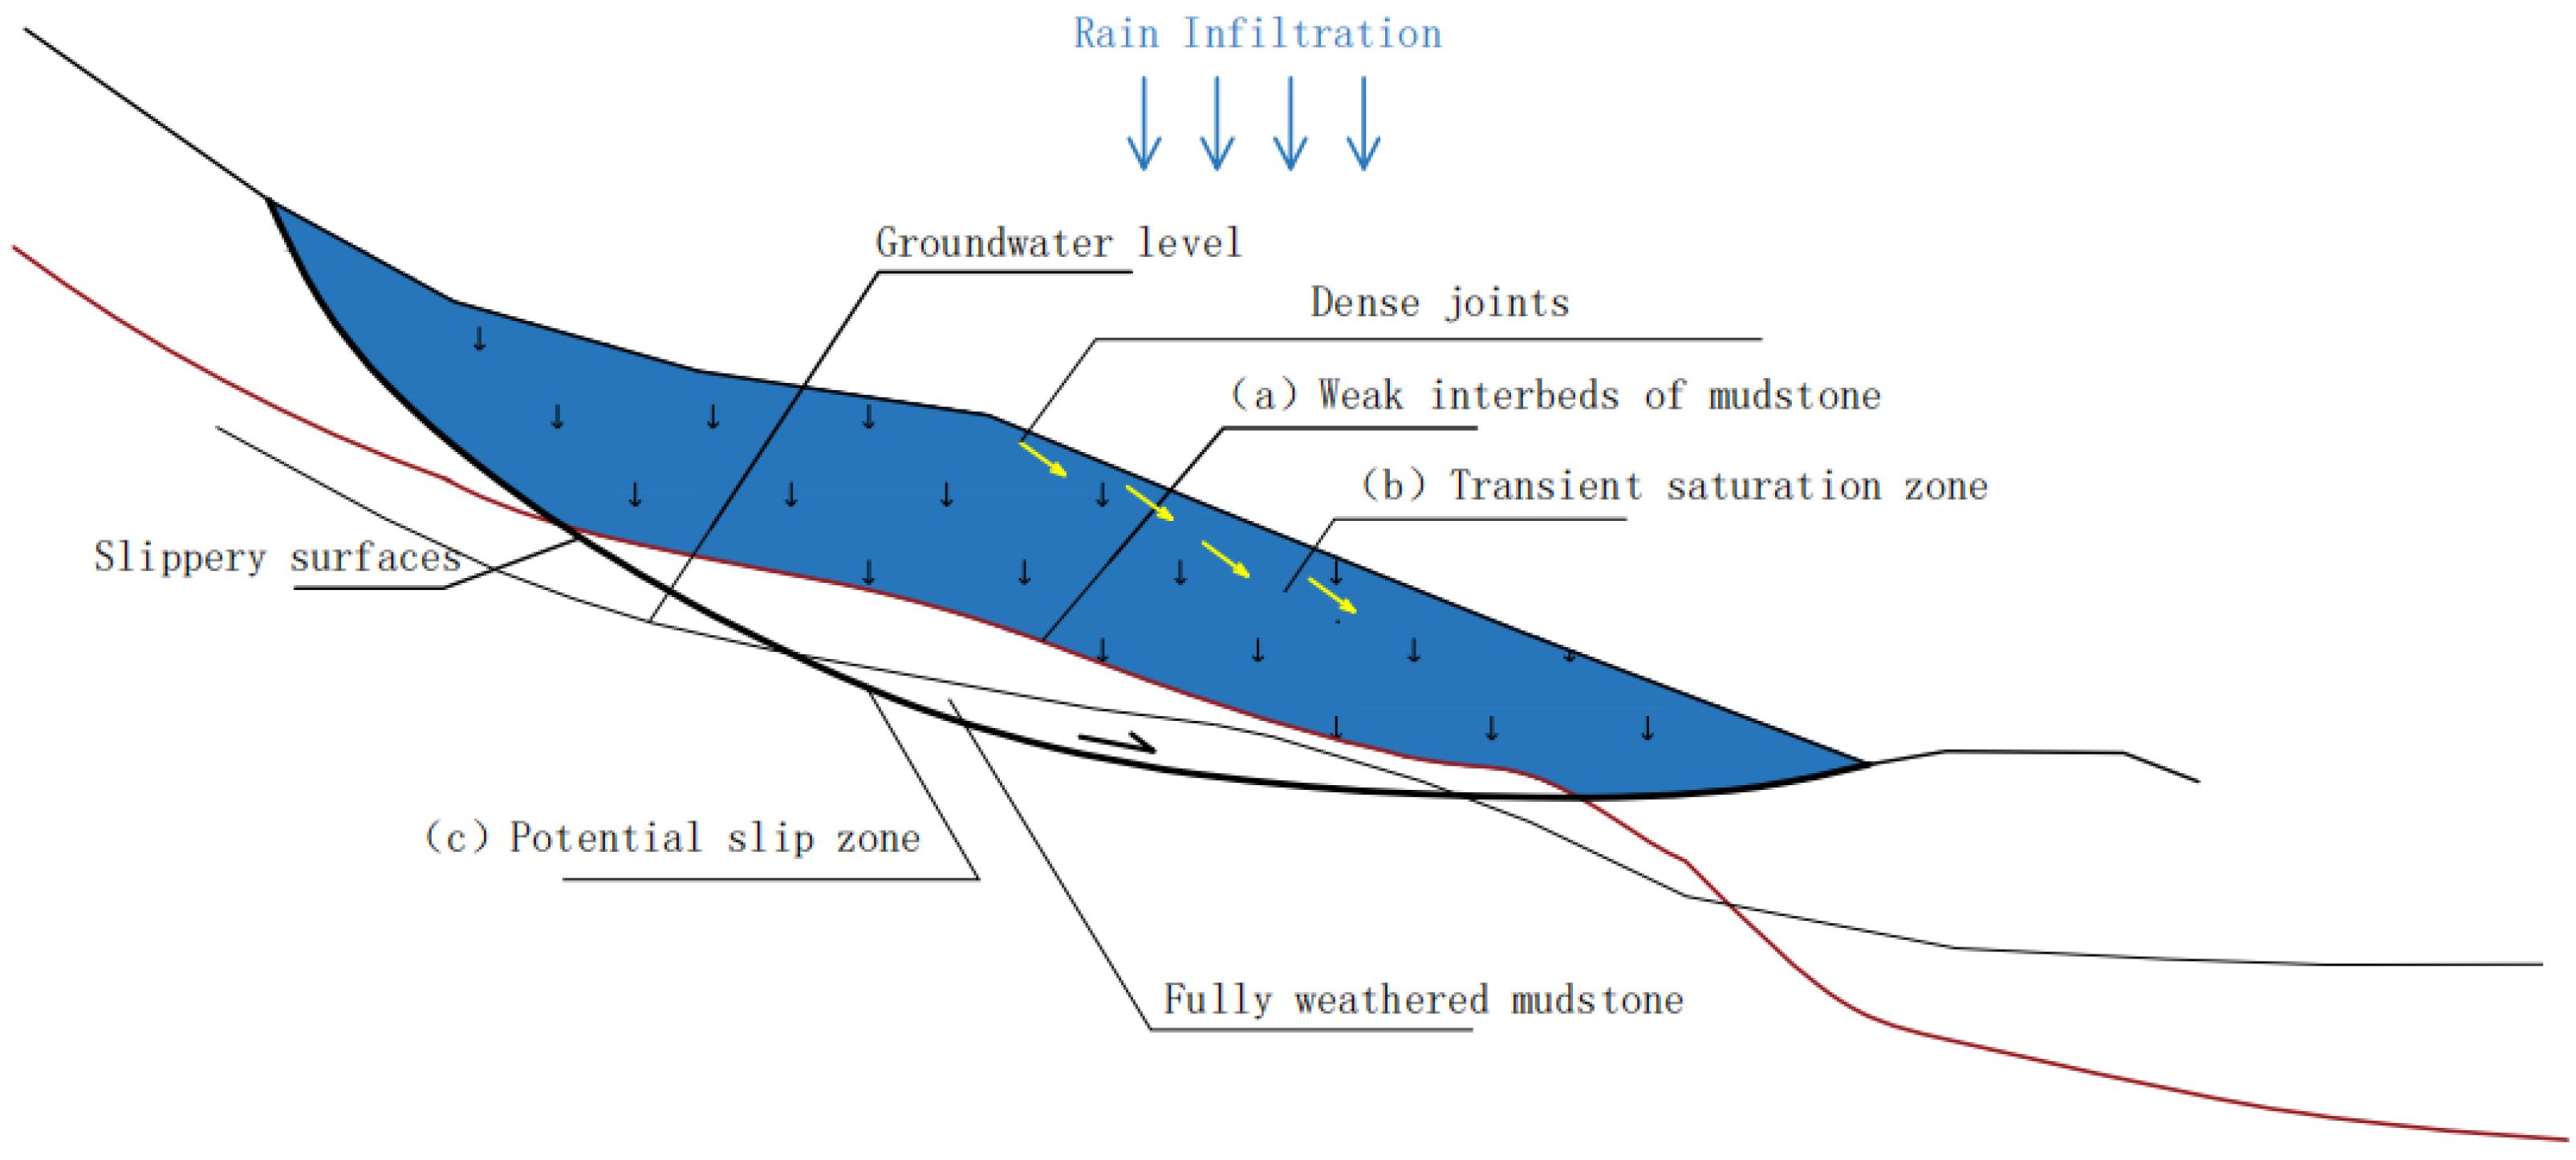
3.4. Hydrogeological Characteristics
3.5. Comprehensive Mechanism and Main Influencing Factors of Landslide
- Geological factors: These include the types of lithology and soil (slick mudstone and highly weathered rock masses), the development of structural planes (such as faults and joints), and the spatial distribution of weak interlayers, all of which significantly influence the mechanical behavior and failure mode of slopes [36];
- Topographic considerations: Steep slopes ranging from 30° to 60°, combined with elevation differences of 10 to 200 m, exacerbate gravity erosion and stress concentration, hence increasing the susceptibility to slope instability [37];
- Hydro-meteorological factors: Strong rainfall leads to soil saturation, causing transient seepage zones that can trigger either progressive or rapid slope failure by reducing effective stress and raising pore water pressure [38];
- Geotechnical parameters: The dynamic deterioration of shear strength, notably the time-dependent drop in cohesion (c) and internal friction angle (), plays a vital role in slope stability. In addition, fluctuations in soil unit weight due to moisture content changes directly alter the driving forces responsible for slope movement [39].
3.6. Analyze the Implications
4. Numerical Simulation of Landslide Dynamic Response Analysis
4.1. Multiphysics Coupling Mechanism and Model Building
Principles of Multiphysics Coupling
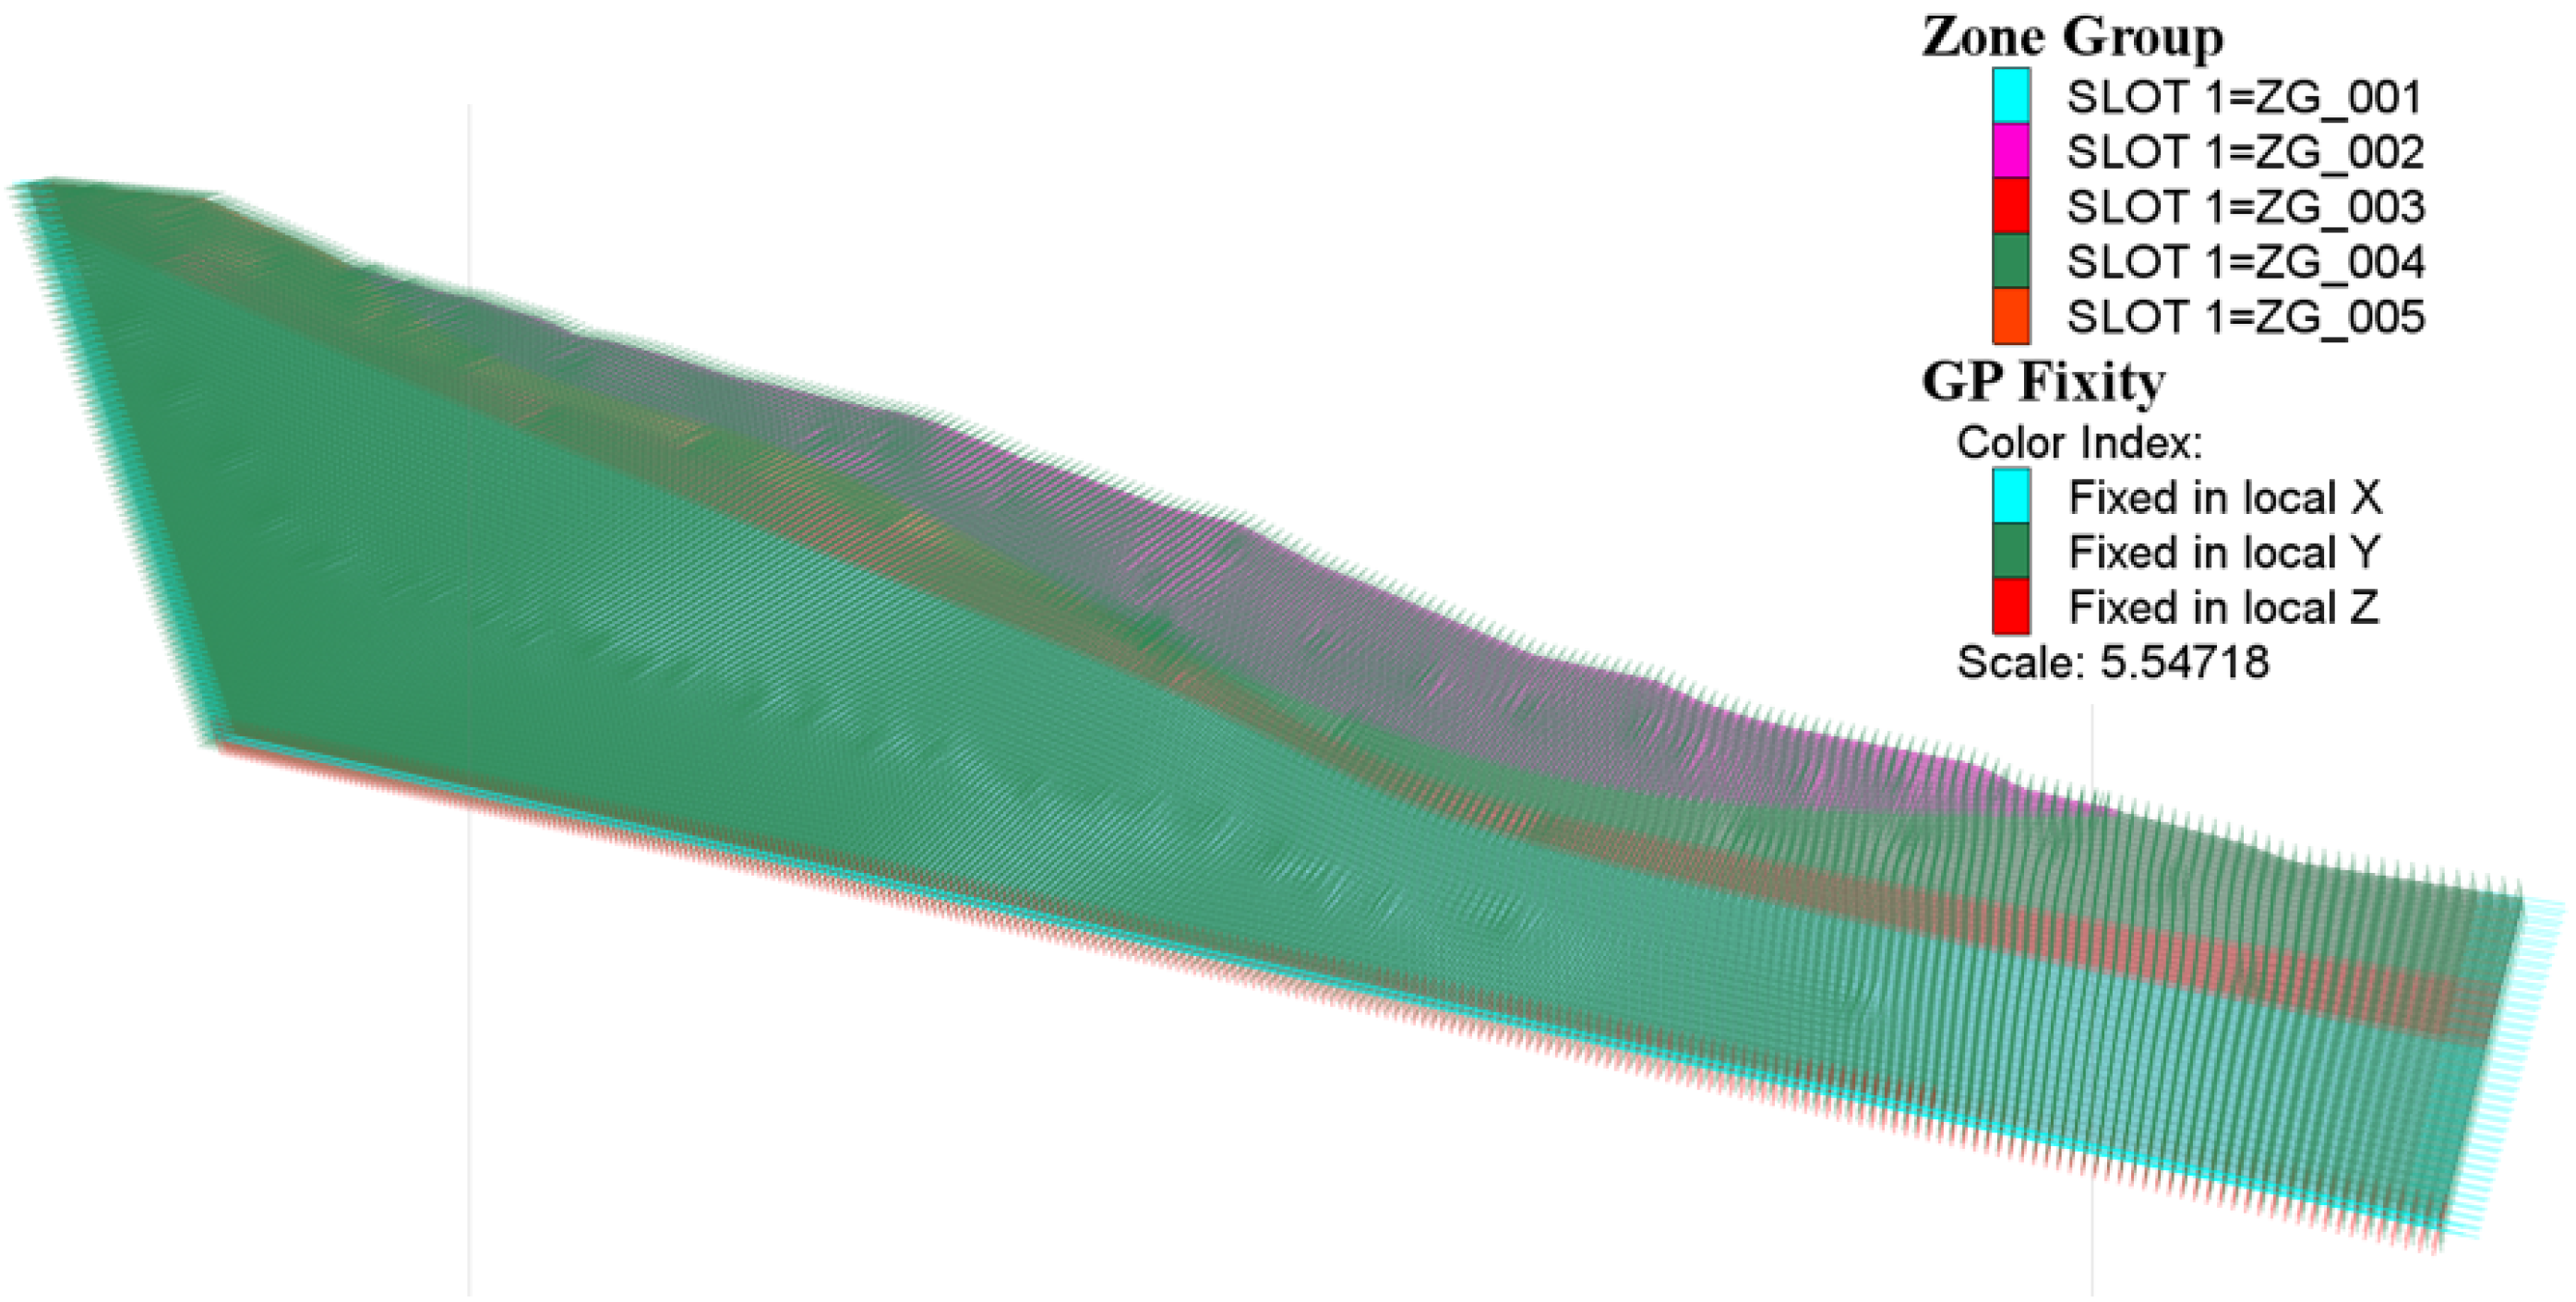
4.2. Model Building
Material Parameters
4.3. Dynamic Evolution of Slip Depth
4.4. The Response Law of Seepage Field
4.4.1. Pore Water Pressure Change Response
4.4.2. Response to Soil Saturation Change
4.5. The Response Law of the Stress Field
4.6. Data Validation Based on Sensitivity Analysis
4.6.1. Sensitivity Analysis Framework
4.6.2. Sensitivity Analysis Results
- -
- 20% decrease in hydraulic conductivity → 20.0% increase in pore water pressure → increase in saturation depth
- -
- 20% decrease in internal friction angle → 25.0% increase in displacement → increase in peak shear strain
- -
- 20% increase in rainfall intensity → 23.3% increase in saturation depth → increase in displacement
5. Optimized Sensor Placement Based on Simulation Results
5.1. Monitoring Equipment Layout and Selection
5.1.1. General Guidelines for Sensor Deployment
5.1.2. Sensor Type Matching Design
5.1.3. Sensor Adaptation Rules Based on Analog Data
5.2. Space-Optimized Layout Strategy
5.2.1. Displacement and Stress Field Monitoring Scheme
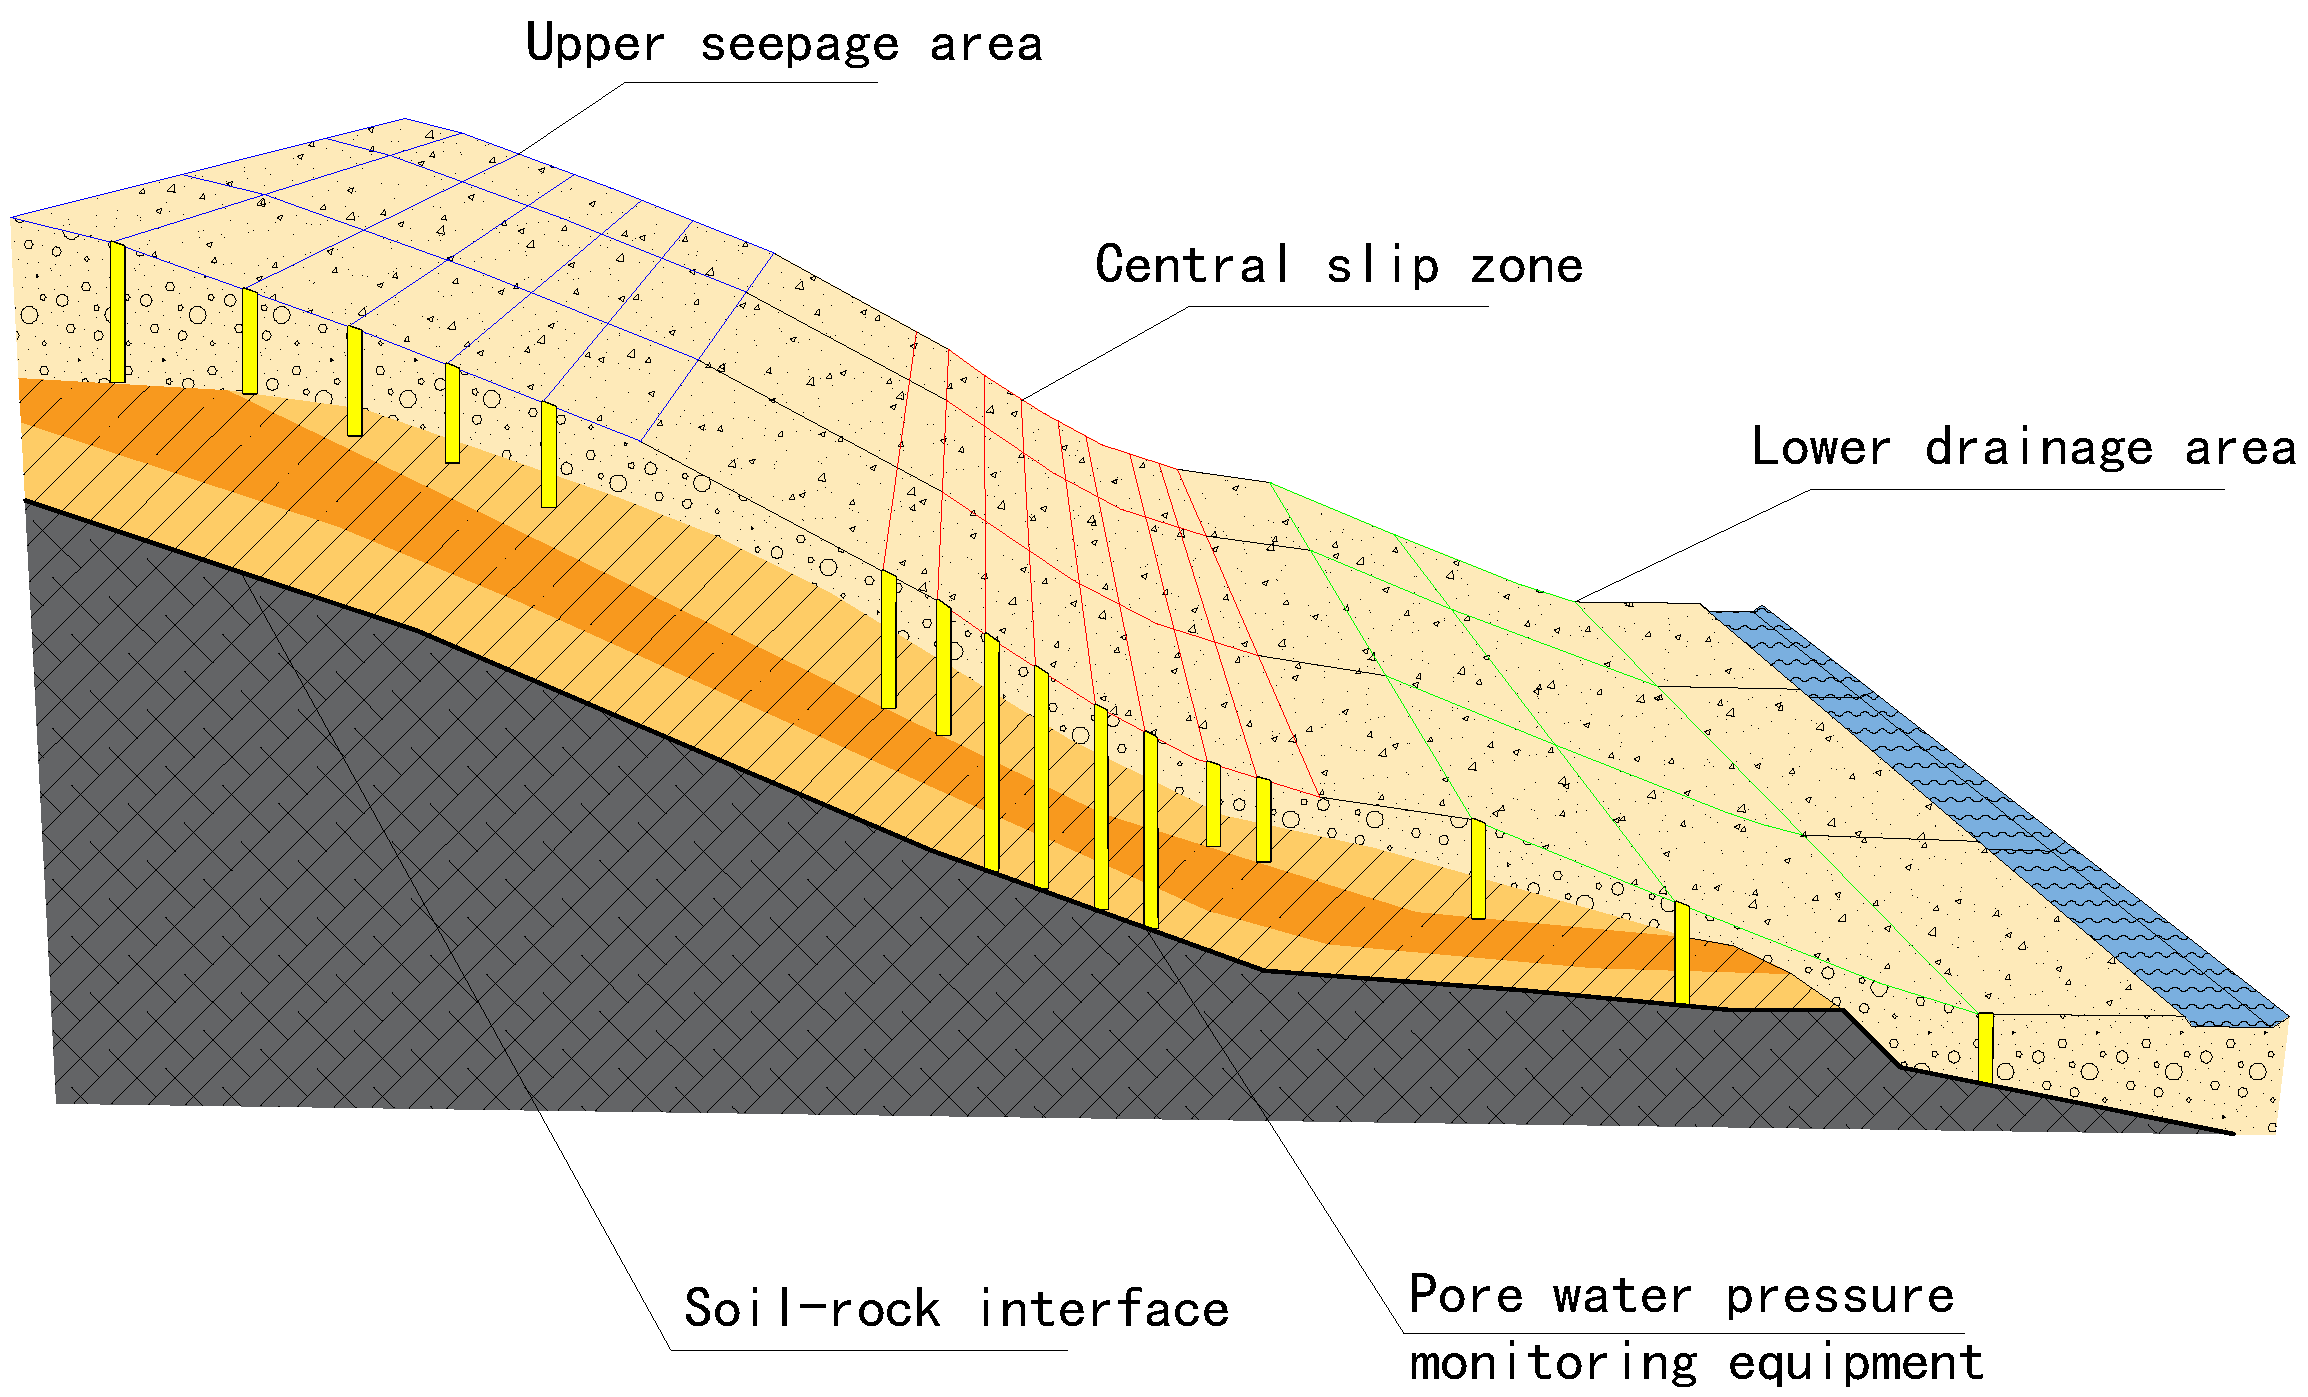
- GNSS Monitoring System:The GNSS reference station should be installed in a stable area outside the landslide influence zone. Monitoring stations should be geographically classified according to geomorphic units as follows:
- -
- At least two monitoring stations should be positioned in the tension-cracked zone at the rear edge to quantify extensional deformation.
- -
- Three to five stations are required in the central-toe sliding zone to record the displacement vectors.
- -
- One to two stations should be established in the bulging zone to monitor uplift deformation.
In the sliding zone, the spacing between neighboring GNSS stations should be maintained within 100 m, whereas in the rear edge and toe regions, the spacing should not exceed 500 m. - InSAR Data Acquisition:The InSAR coverage must entirely include the landslide-prone area to ensure complete visibility without occlusions or shadowing effects. Priority should be given to places where surface deformation is extremely sensitive along the radar line-of-sight (LOS) direction, thereby enhancing detection accuracy and temporal coherence.
- Deep Fiber Bragg Grating (FBG) Stress Inclinometer Deployment:The deep FBG inclinometers should be vertically mounted in the primary sliding path predicted by computer calculations, extending downward through the probable slip zone at depths of 5–15 m. A zigzag trajectory with lateral offsets of 1–2 m should be employed to achieve full-thickness coverage of the shear zone. As shown in Table 7, the arrangement of its quantity is regulatedSensor points should be preferentially situated within the shear strain concentration zones found by FLAC3D 7.0 simulations—particularly within the core region of the major slip surface. Additional auxiliary sensors should be positioned near the interface between the sliding zone and the underlying bedrock to monitor interfacial deformation.The axial spatial resolution of the sensing system should exceed 0.5 m, with one FBG sensor inserted every 0.5 m along the borehole. Within the main slip zone, the horizontal separation between consecutive boreholes should not exceed 5 m, but in peripheral areas, this spacing can be extended to 10 m to reduce redundancy without affecting data quality.
5.2.2. Bore Pressure Gauge Layout Scheme
- Scientific Basis for Sensor Placement
- -
- Core Monitoring Layer:Sensors should be positioned at the top of the low-permeability layer (e.g., the top of the completely weathered mudstone layer) and within ±2 m of the slip surface to monitor the excess pore water pressure accumulation generated by rainwater infiltration and capture dynamic dissipation processes.
- -
- Auxiliary Monitoring Layers:Additional sensors should be placed in the middle of the landslide mass (depth: 3 m to 5 m) and shallow bedrock zone (depth: 15 m to 20 m) to quantify vertical seepage response rates and compare baseline pore water pressure fluctuations in the bedrock.
- Mechanical Constraints for Spatial DensityBased on the geographical heterogeneity of the slope seepage field, the monitoring area was separated into a coupled grid system that blended vertical stratification with horizontal zonation:
- -
- Horizontal Grid Design:A grid spacing of 5 m was used in the core slip zone to capture the high-resolution spatial variability.In marginal zones where deformation and infiltration are less strong, a coarser spacing of 10 m is employed.
- -
- Vertical Stratification Strategy:Upper Unsaturated Zone (depth: 0–5 m):Vibrating-wire pore pressure transducers are deployed at the saturated–unsaturated interface, characterized by abrupt hydraulic gradient changes, to monitor rainfall infiltration front migration. The sensors were set at vertical intervals of 5 m, centered within ±2.5 m of the interface.Middle Slip Zone (depth: 5–15 m):To achieve the correct vertical resolution of the hydraulic gradient, sensors were positioned every 5 m along the probable slip zone, fully covering its thickness.Lower Bedrock Zone (depth: 15–20 m):One to two pore pressure transducers were installed as reference sites for the baseline pore pressure data. Given the expected homogeneity of the bedrock seepage, the vertical spacing was extended to 5–10 m.
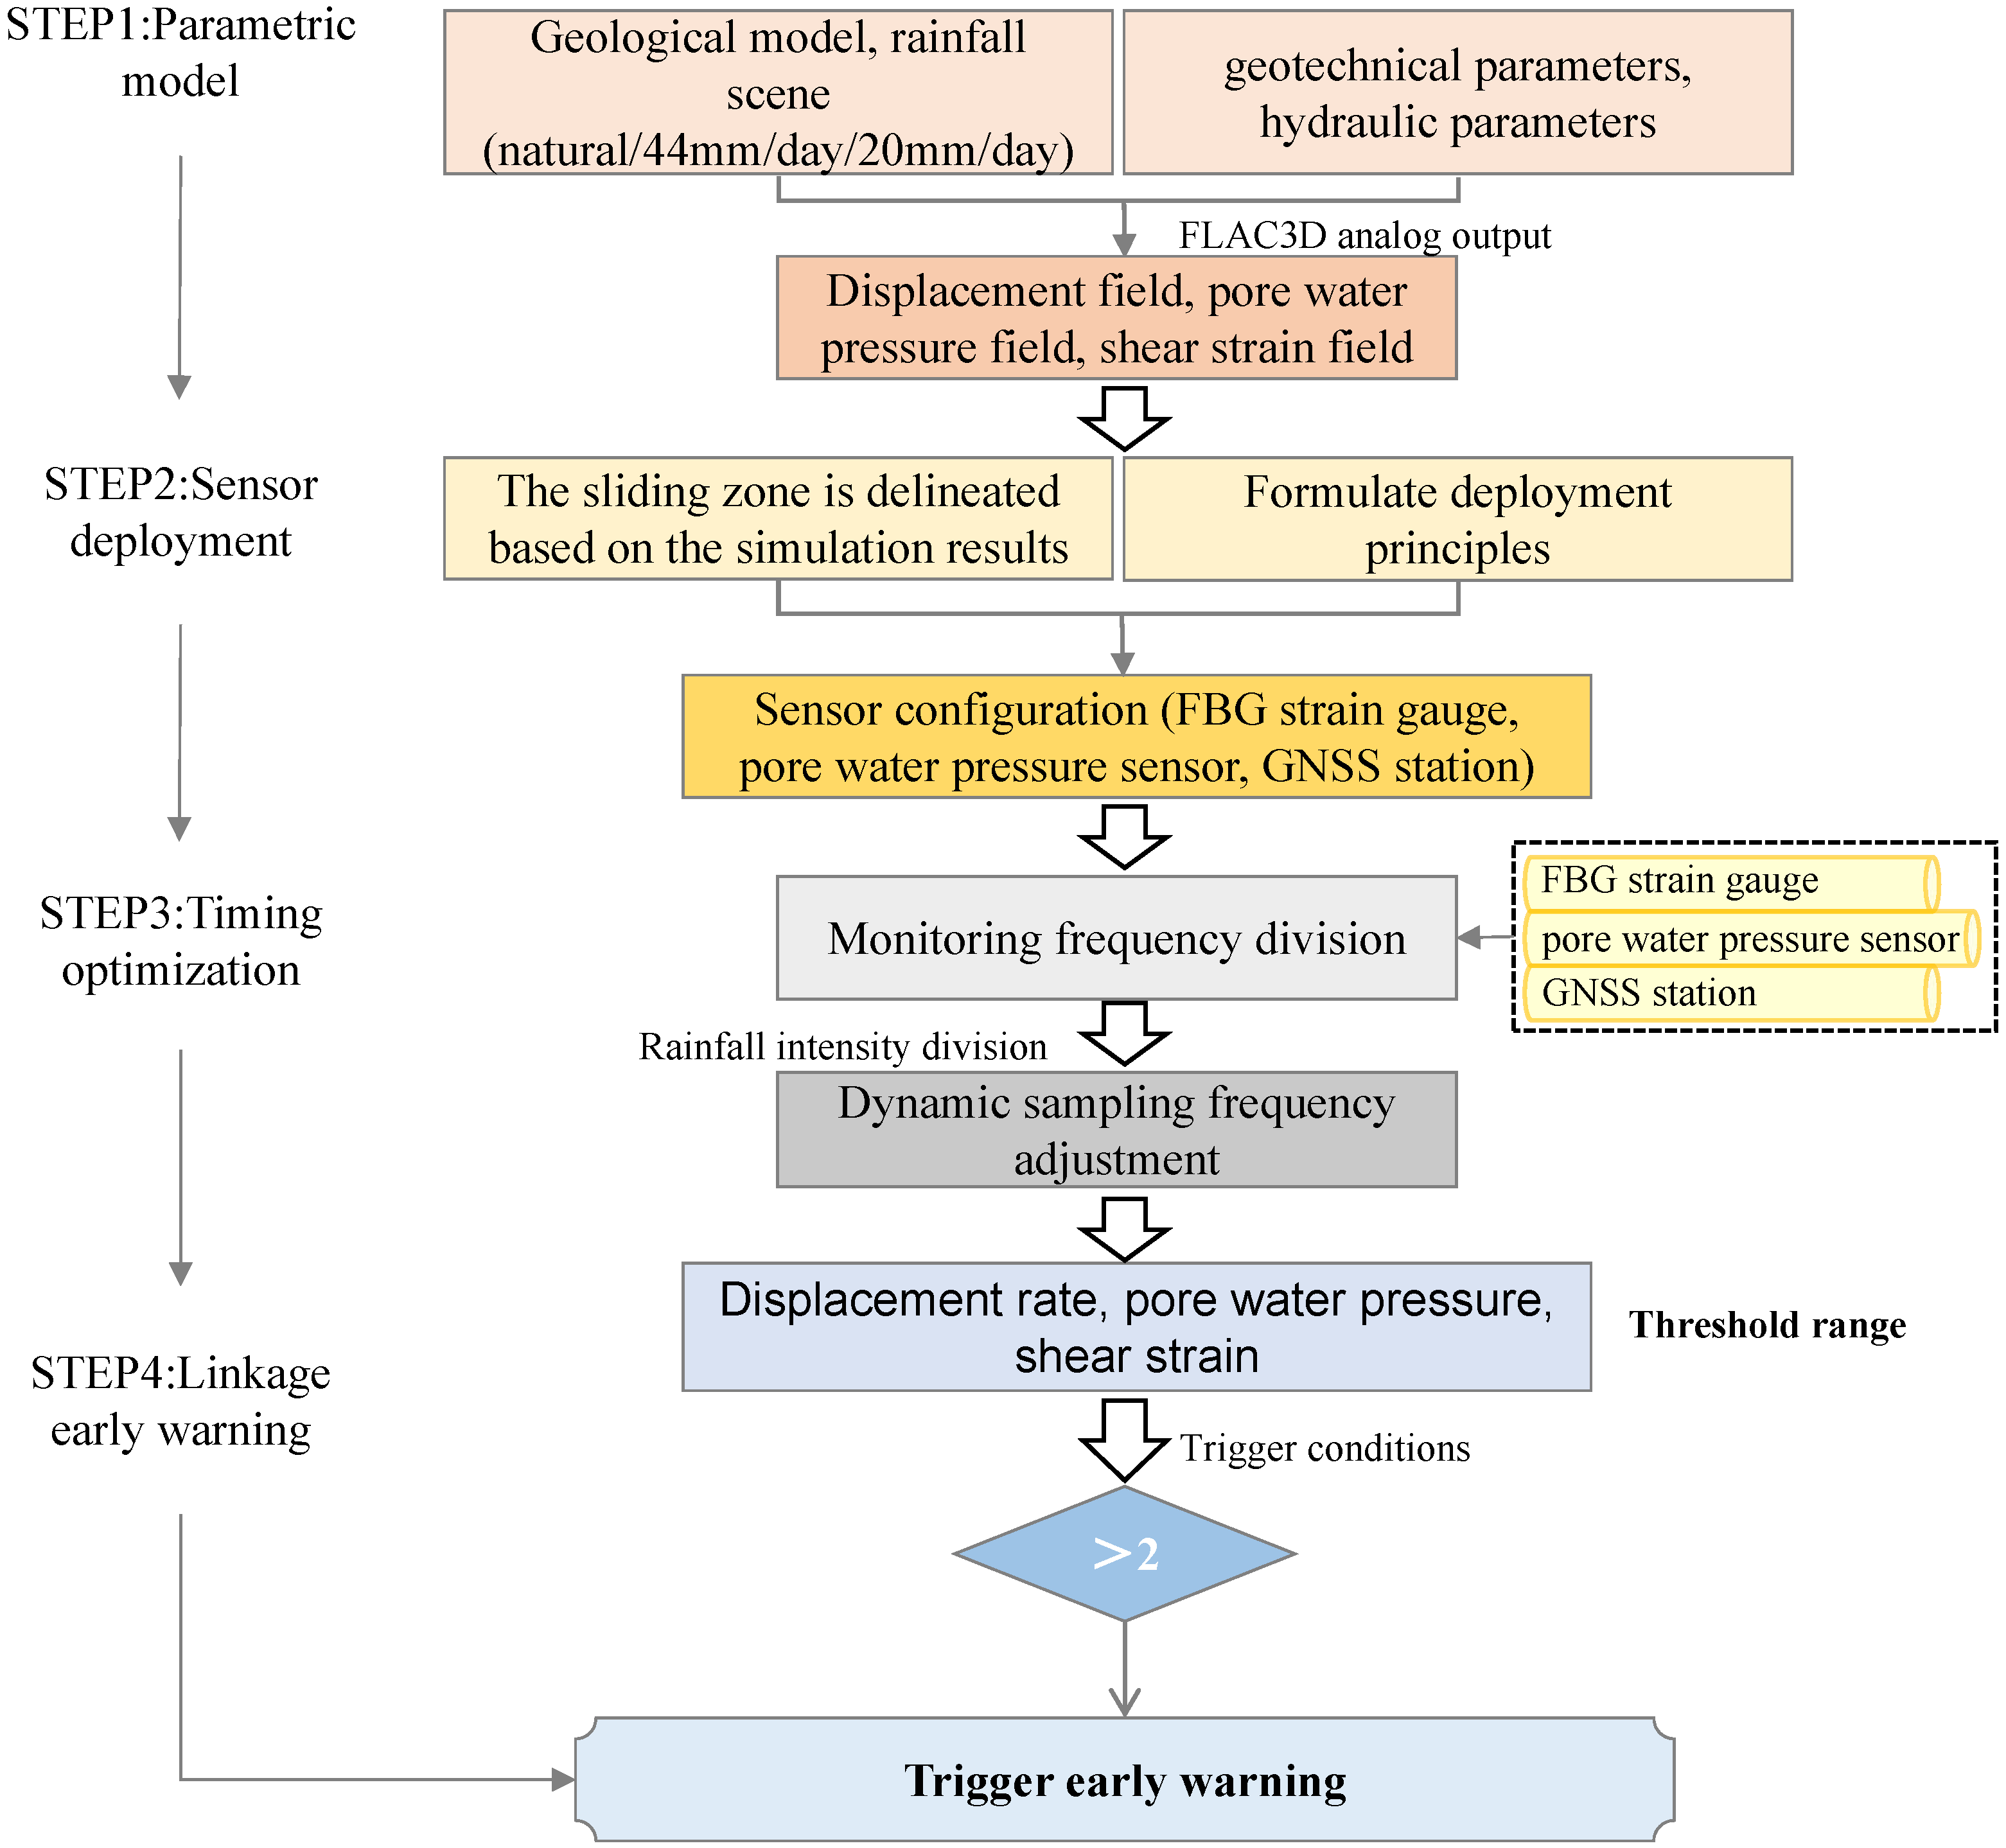
5.3. Dynamic Monitoring Timing Optimization
5.3.1. Adaptive Sampling Strategy
- Baseline ModeApplicable Conditions: Rainfall intensity < 10 mm/day (mimicking natural conditions)Sensor Configuration:
- -
- GNSS/InSAR: 1 sample/day
- -
- FBG Inclinometer: 1 sample/h
- -
- Pore Water Pressure Sensor: 1 sample/2 h
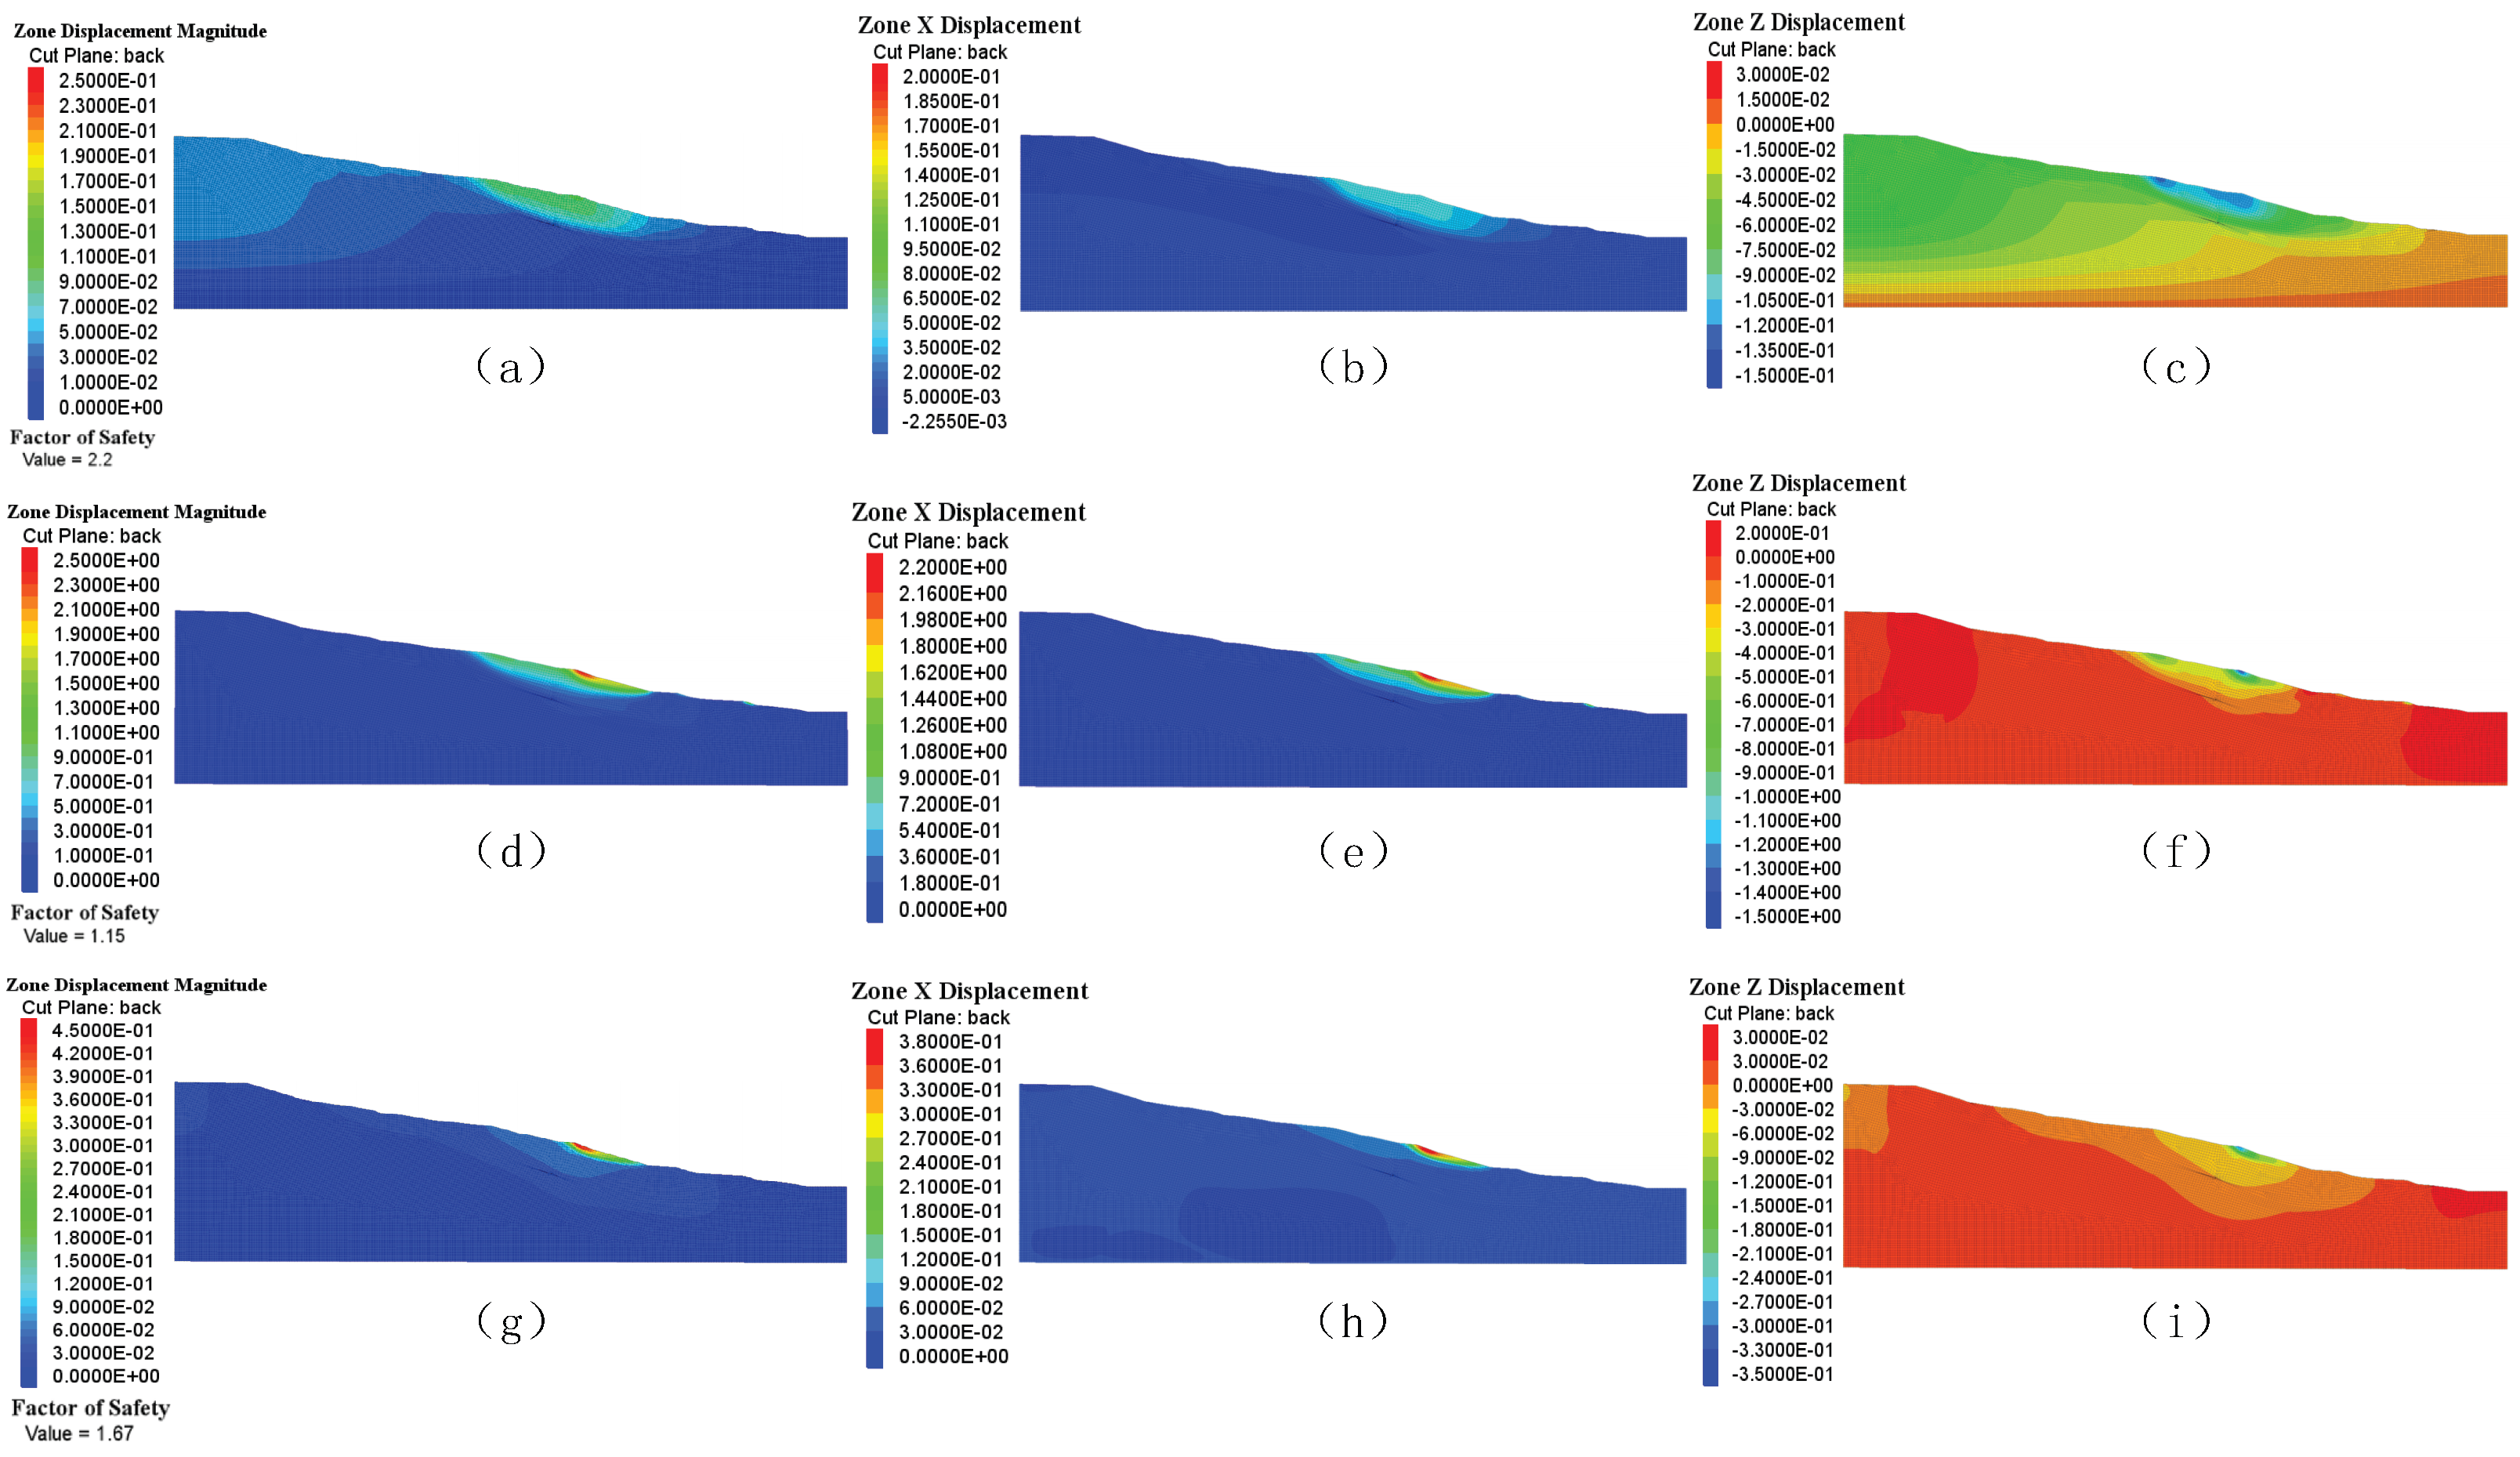
Theoretical Basis: FLAC3D 7.0 simulations (Figure 9) demonstrate that under natural conditions, the maximum slope displacement rate is 14.2 mm/day, with a steady-state pore water pressure field ( MPa/24 h). This mode assures that slow deformation processes can be caught using low-frequency sampling, while minimizing energy usage. - Moderate-Rain ModeApplicable Conditions: Rainfall intensity of 10–30 mm/day (equivalent to Scenario Two)Sensor Configuration:
- -
- GNSS/InSAR: 4 samples/day (6-h interval)
- -
- FBG: 1 sample/15 min
- -
- Pore Water Pressure Sensor: 1 sample/30 min
Theoretical Basis: When rainfall exceeds the intensity of Scenario Two (20 mm/day):Under these conditions, the enhanced FBG sample frequency enables monitoring of the shear strain acceleration along the slip zone (Section 4.5), whereas intensified pore water pressure measurements allow tracking of the downward movement of the saturation front. - Storm ModeApplicable Conditions: Rainfall intensity > 30 mm/day (equivalent to Scenario One)Sensor Configuration:
- -
- GNSS: Continuous sampling at 10 Hz
- -
- FBG: Real-time streaming at 10 Hz (not 50 Hz to reduce redundancy)
- -
- Pore Water Pressure Sensor: 1 sample/min
Theoretical Basis: Simulations under Scenario One (44 mm/day rainfall) revealed the following:- ①
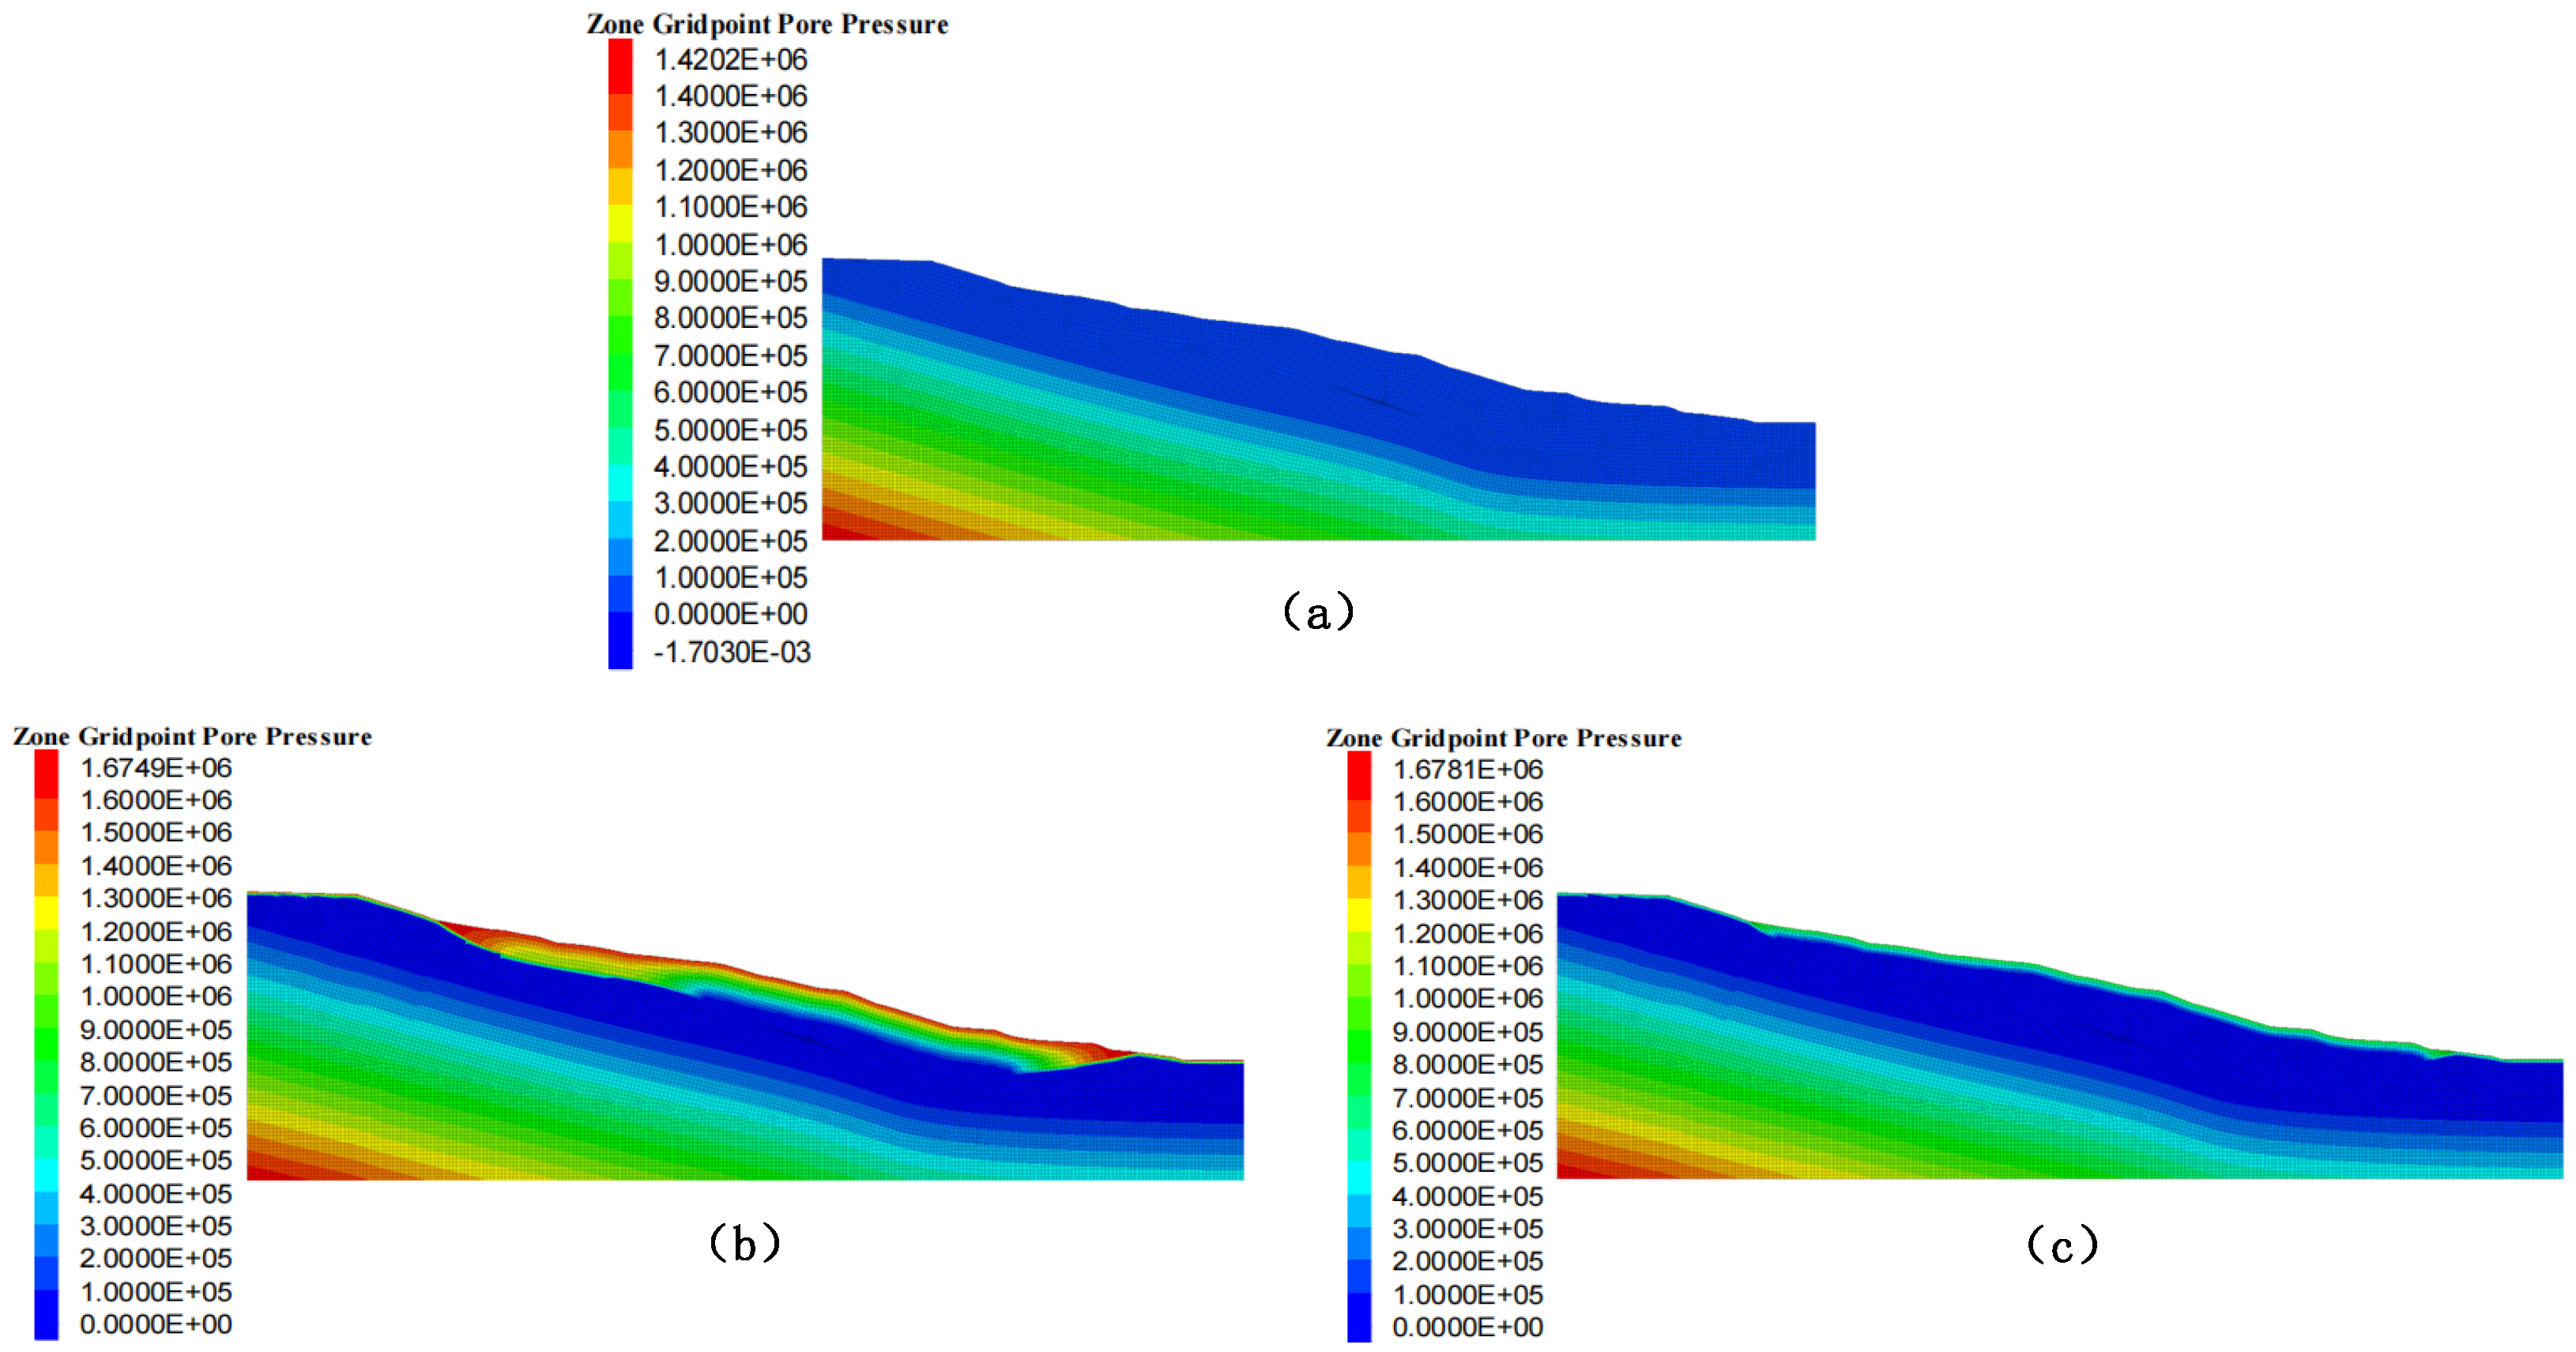
- A rapid increase in shallow pore water pressure by 0.5 MPa within 6 h (Figure 10b), necessitating minute-level monitoring of pressure surges.
- ②
- Ground surface displacement rates surpassing 2 mm/h (Figure 9), where 1 Hz GNSS data can reveal precursory acceleration prior to the failure
- ③
- FBG high-frequency sampling must match the shear strain rate variation. As described in Section 4.5, the corresponding characteristic time scale of the strain variation was approximately 6 min (i.e., 0.1 Hz). According to the Shannon sampling theorem, the sampling rate must be greater than 0.2 Hz to capture the critical transient processes. A sampling rate of 10 Hz was chosen to cover abrupt strain changes, synchronize and fuse with GNSS data, and avoid energy redundancy caused by ultra-high sampling at 50 Hz. Sampling at 1 Hz may miss strain step events induced by heavy rainfall (e.g., plastic strain jumps owing to hydraulic softening in the sliding zone).
5.3.2. Linking the System Response Mechanism to the Early Warning Threshold
- Displacement thresholds: The yellow threshold (5 mm/h) is defined as twice the maximum displacement rate under natural conditions (2.5 mm/h, Figure 9a), marking the beginning of abnormal deformation; the orange threshold (20 mm/h) corresponds to the point where displacement acceleration reaches 60% in Scenario 1; the red alert threshold (50 mm/h) corresponds to 80% of the observed surface peak displacement (2.442 m) in Scenario 1 (44 mm/day rainfall, Figure 9d).
- Pore pressure thresholds: The yellow threshold (0.1 MPa) is set at 150% of the pore pressure fluctuation range under natural conditions (0–0.07 MPa, Figure 10a), used to indicate initial infiltration effects; the orange threshold (0.25 MPa) corresponds to the point where pore pressure increases by 50% at a depth of 30 m in Scenario 2 (Figure 10c); the red alert threshold (0.4 MPa) represents 80% of the maximum transient pore pressure (0.5 MPa) in the shallow layer (0–10 m) in Scenario 1 (Figure 10b).
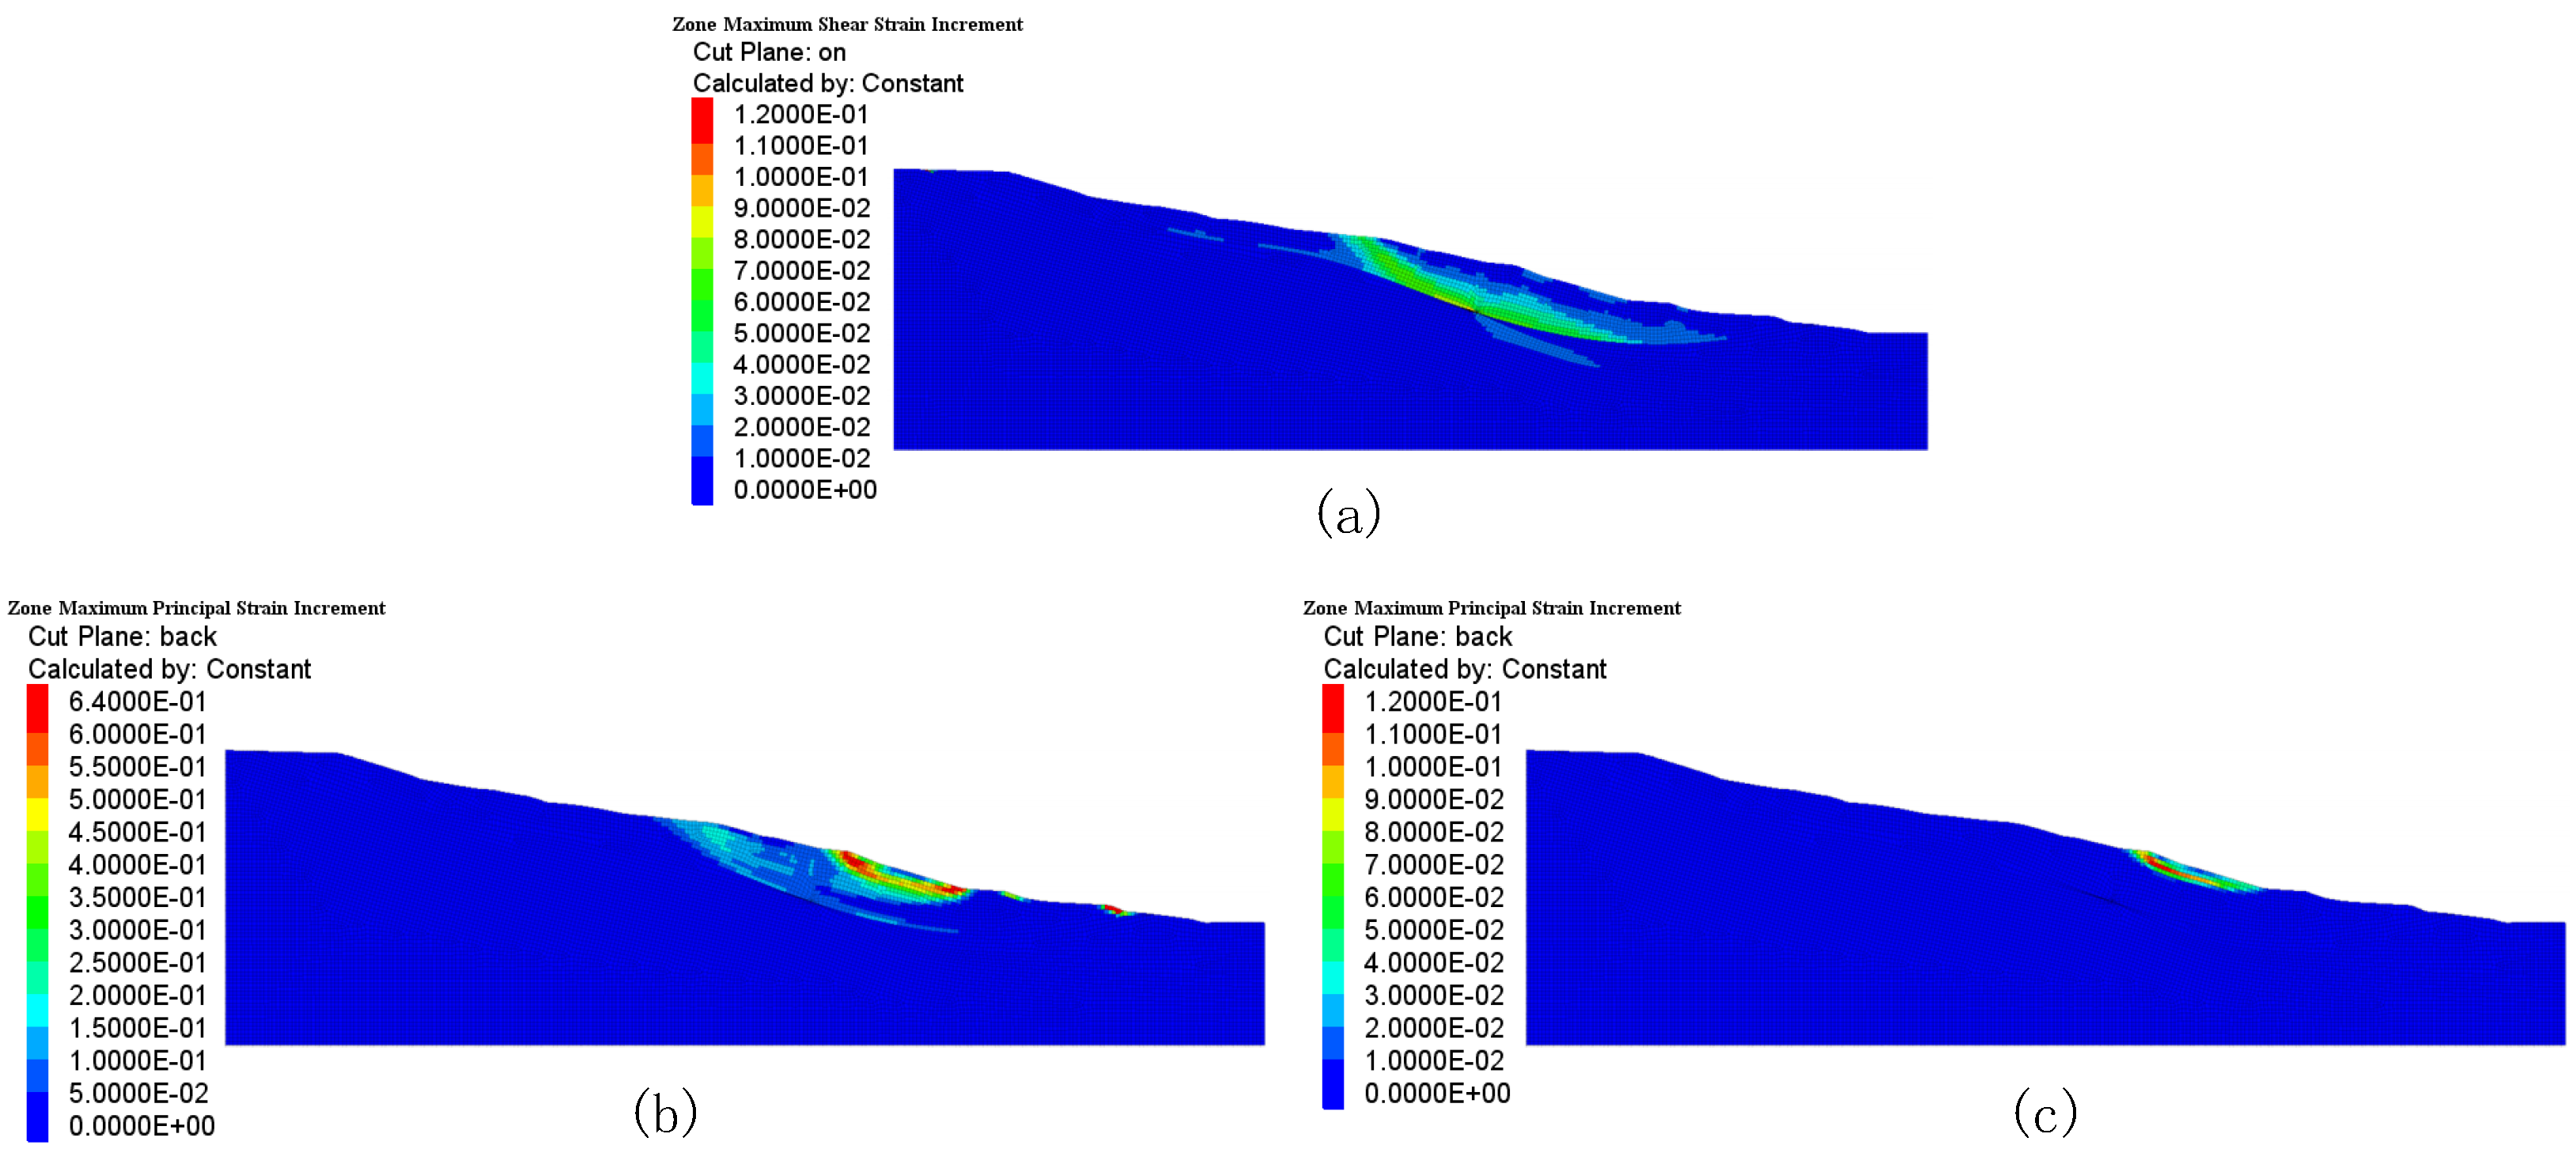
- Strain thresholds: The yellow threshold (300 με) equals three times the baseline shear strain under natural conditions (100 με, Figure 12a), used to detect early strain accumulation; the orange threshold (1500 με) corresponds to the initiation point of strain localization in Scenario 2; the red alert strain (6400 με) references the peak shear strain of 6.4 × 10⁻¹ Pa in Scenario 1 (Figure 12b).
5.4. Practical Deployment Considerations
5.4.1. Energy and Transmission Issues
- Power Supply and Energy Management
- (a)
- Hybrid Power System: GNSS stations and FBG demodulators adopt a solar panel–lithium battery hybrid power supply. Each station is equipped with a 100 W photovoltaic panel and a 200 Ah lithium battery, ensuring continuous operation for at least 7 days during rainy or overcast conditions. Low-power sensors such as pore pressure transducers are powered by long-life lithium-thionyl chloride batteries with a service life of 5 years or more.
- (b)
- Energy Optimization in Heavy Rain Mode: During high-frequency sampling periods (e.g., GNSS at 10 Hz), a dynamic power control mechanism is activated. Non-essential modules (e.g., 4G standby) are disabled, and only critical data are transmitted back via LoRa to conserve energy.
- Remote Data TransmissionA hierarchical networking architecture can be adopted as follows:
- (a)
- Core Zone (High-Risk Area): Dual-mode 4G/LoRa transmission is used to enable real-time backhaul of early warning parameters, such as displacement rates exceeding 20 mm/h or pore pressure surpassing 0.4 MPa.
- (b)
- Peripheral Zone: Data are aggregated via LoRa self-organizing network to core nodes, significantly reducing communication costs.
- (c)
- Satellite Communication Redundancy: In signal-denied areas (e.g., trailing tension fracture zones), BeiDou short message terminals are deployed to ensure the delivery of early warning information under extreme weather conditions.
5.4.2. Cost-Density Trade-Off Strategy
6. Conclusions
6.1. System Limitations and Future Perspectives
- Soil Homogenization: The assumption of homogeneous stratigraphic layers neglects localized heterogeneities (e.g., fractures, preferential flow paths), potentially underestimating pore pressure peaks in fractured zones.
- Rainfall Boundary Simplification: Constant-intensity rainfall scenarios ignore spatiotemporal variability observed in natural storms, affecting transient seepage predictions.
- Lack of Field Validation: The adaptive sampling algorithm relies solely on simulation-driven thresholds without real-time sensor feedback verification.
- Real-time Data Assimilation: Field sensor data (displacement, pore pressure) dynamically update FLAC3D 7.0 model parameters (e.g., permeability, cohesion) via inverse analysis.
- Predictive Simulation Engine: Updated models forecast short-term stability under evolving rainfall, adjusting sensor sampling rates and warning thresholds.
- Adaptive Control Module: Optimized thresholds trigger tiered alerts while guiding further data acquisition priorities.
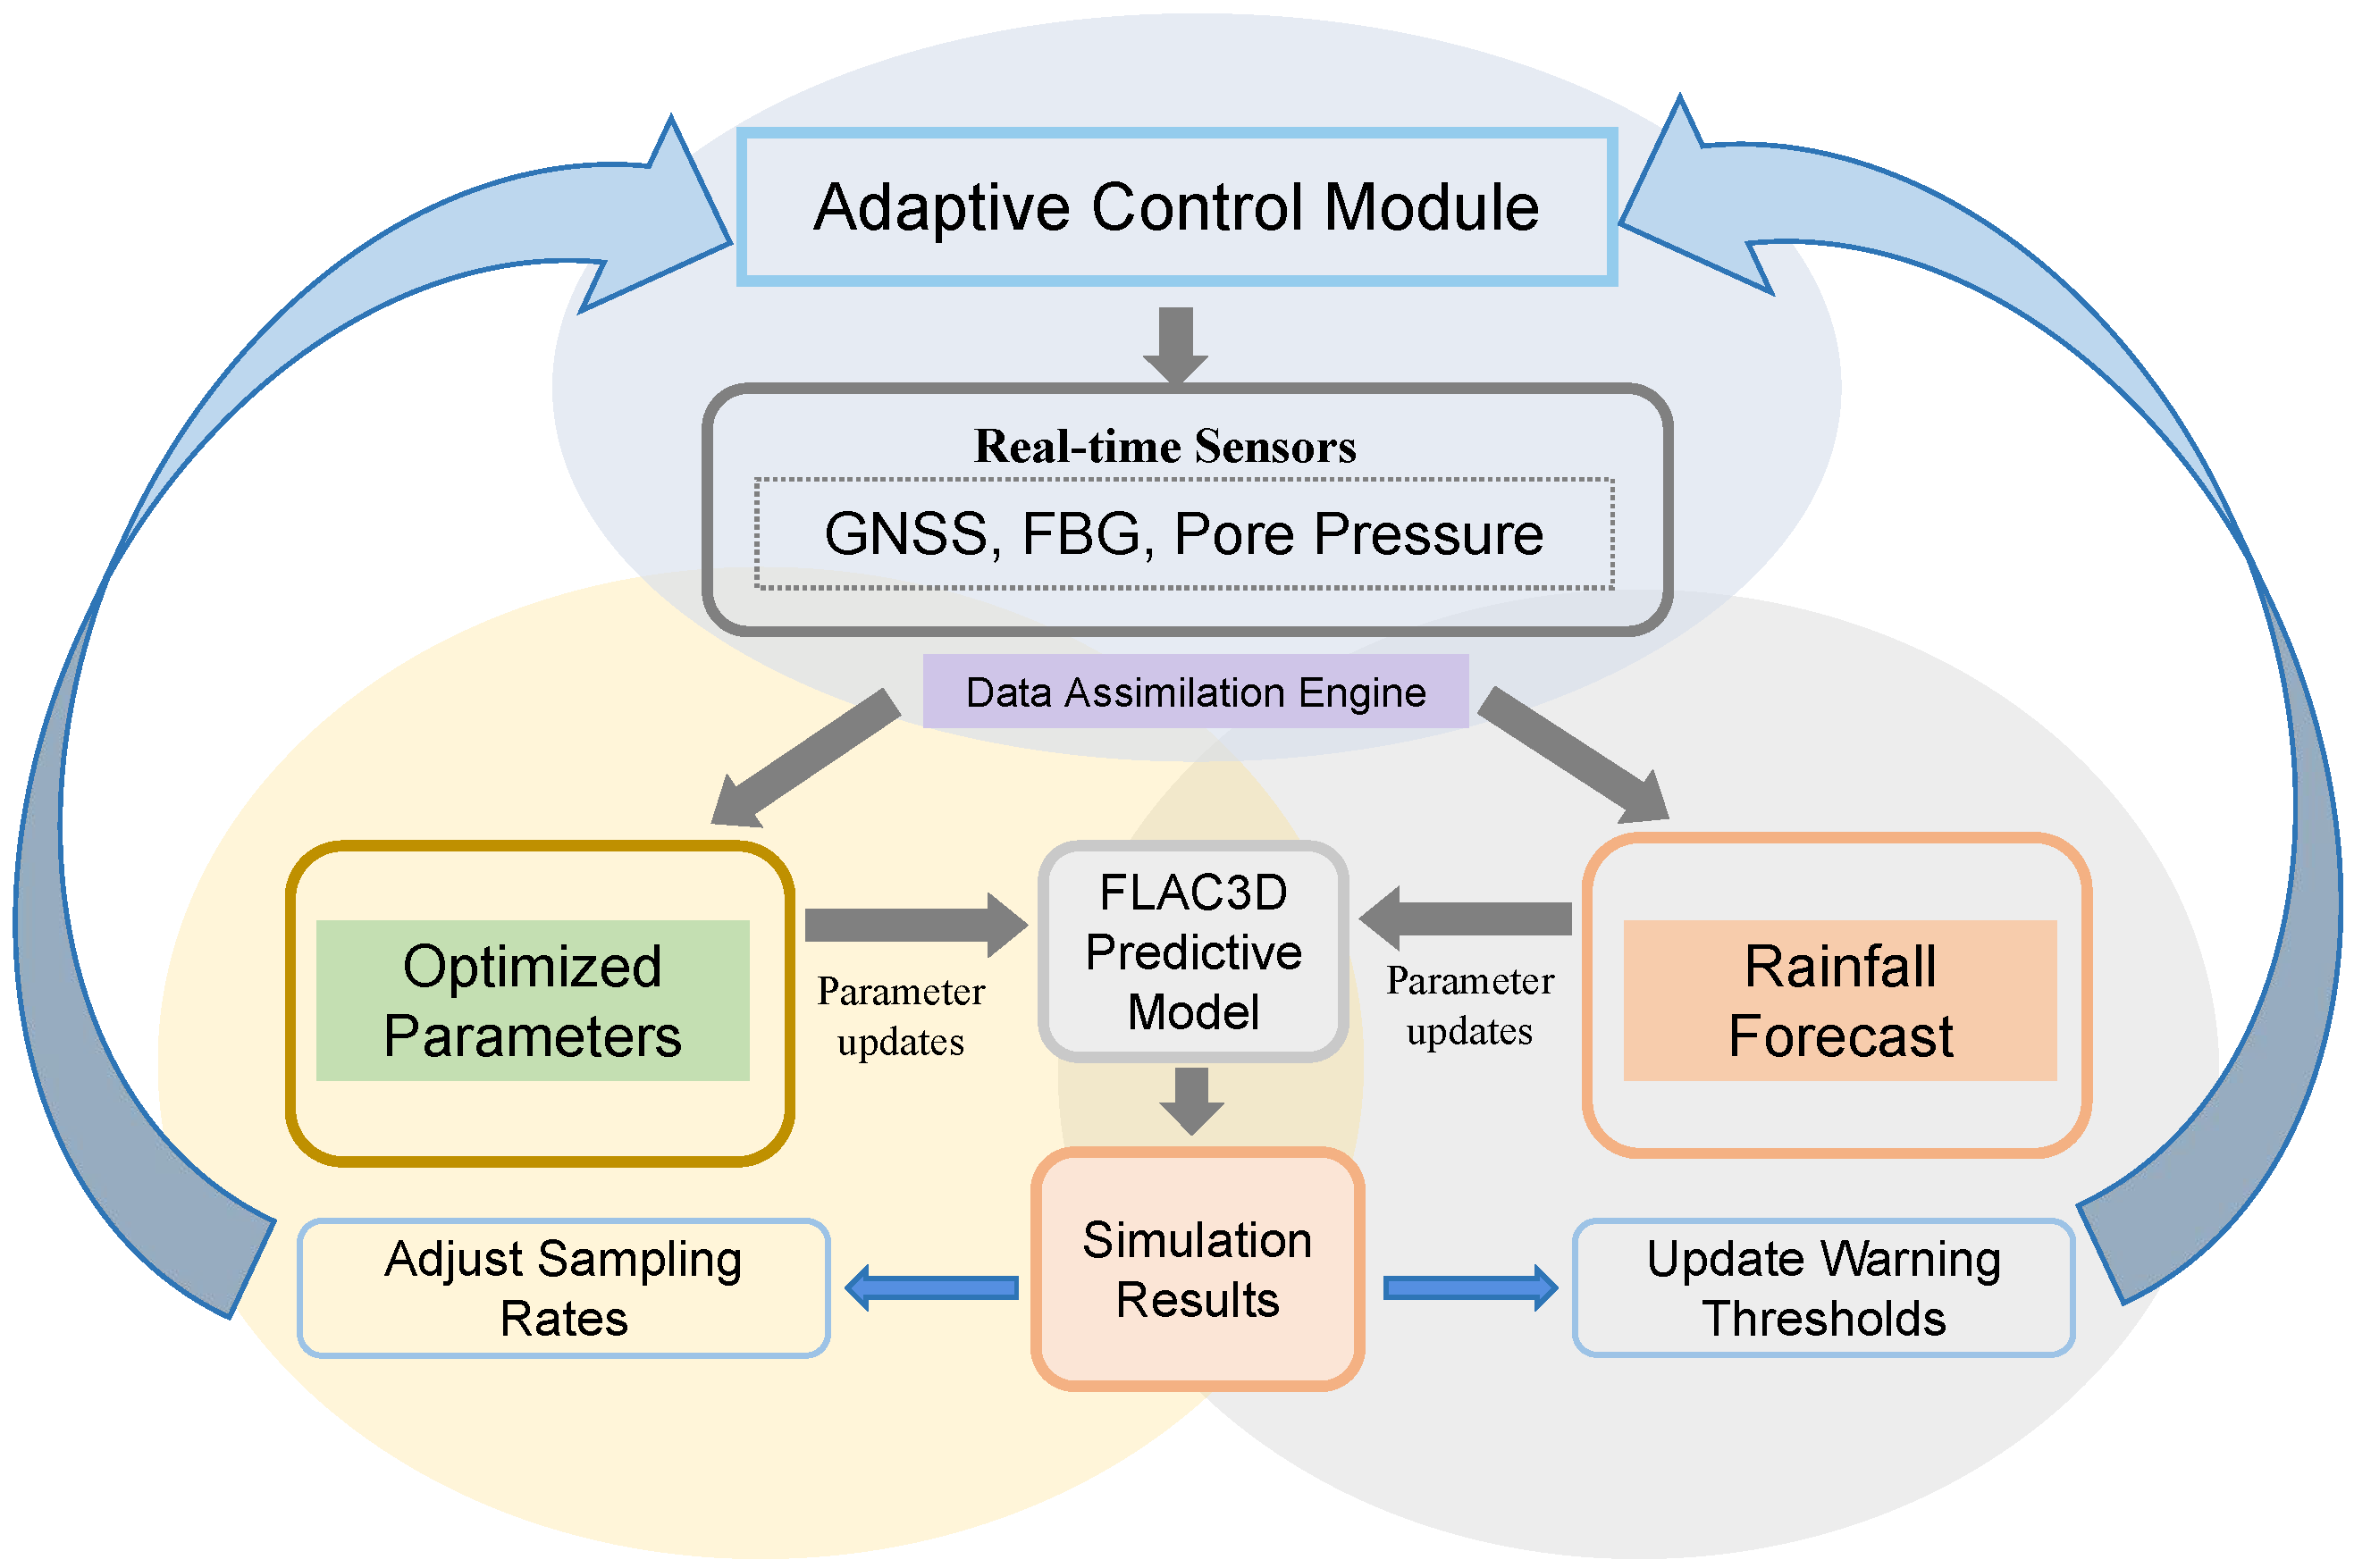
6.2. Research Conclusions
- Simulation-Driven Monitoring Optimization: FLAC3D 7.0 simulations accurately identified shallow shear strain concentration zones (5–15 m) and points of abrupt pore water pressure change, guiding a 30% increase in sensor spatial deployment density and enabling the effective capture of critical slip signals.
- Effectiveness of Adaptive Sampling: In heavy rainfall scenarios, the GNSS sampling rate was increased to 10 Hz. Combined with real-time FBG data streaming (10 Hz), this successfully captured displacement acceleration precursors (>2 mm/h) and strain step events induced by hydraulic softening.
- Reliability of Multi-Parameter Warning: A red alert is triggered when two parameters—displacement (>50 mm/h), pore water pressure (>0.4 MPa), or strain (>6400 με)—simultaneously exceed their thresholds, resulting in a 40% reduction in the false alarm rate.
- Value for Engineering Application: The framework provides a monitoring solution for high-risk slopes that is low-redundancy (through a tiered cost strategy) and highly robust (with protection for extreme environments). It promotes a paradigm shift in landslide hazard prevention and control from “phenomenon observation” to “mechanism-based early warning.”
Author Contributions
Funding
Institutional Review Board Statement
Informed Consent Statement
Data Availability Statement
Acknowledgments
Conflicts of Interest
References
- Lin, Q.; Steger, S.; Pittore, M.; Zhang, J.; Wang, L.; Jiang, T.; Wang, Y. Evaluation of potential changes in landslide susceptibility and landslide occurrence frequency in China under climate change. Sci. Total Environ. 2022, 850, 158049. [Google Scholar] [CrossRef]
- Zhuang, Y.; Hu, X.; He, W.; Shen, D.; Zhy, Y. Stability analysis of a rocky slope with a weak interbedded layer under rainfall infiltration conditions. Water 2024, 16, 604. [Google Scholar] [CrossRef]
- Kalantar, B.; Ueda, N.; Saeidi, V.; Ahmadi, K.; Halin, A.A.; Shabani, F. Landslide susceptibility mapping: Machine and ensemble learning based on remote sensing big data. Remote Sens. 2020, 12, 1737. [Google Scholar] [CrossRef]
- Sattler, K.; Elwood, D.; Hendry, M.; Huntley, D.; Holmes, J.; Wilkinson, P.; Chambers, J.; Donohue, S.; Meldrum, P.; Macciotta, R.; et al. Quantifying the contribution of matric suction on changes in stability and displacement rate of a translational landslide in glaciolacustrine clay. Landslides 2021, 18, 1675–1689. [Google Scholar] [CrossRef]
- Sestras, P.; Badea, G.; Badea, A.C.; Salagean, T.; Oniga, V.E.; Roșca, S.; Bilașco, S.; Bruma, S.; Spalević, V.; Kader, S.; et al. A novel method for landslide deformation monitoring by fusing UAV photogrammetry and LiDAR data based on each sensor’s mapping advantage in regards to terrain feature. Eng. Geol. 2025, 346, 107890. [Google Scholar] [CrossRef]
- Ebrahim, K.M.; Gomaa, S.M.; Zayed, T.; Alfalah, G. Recent phenomenal and investigational subsurface landslide monitoring techniques: A mixed review. Remote Sens. 2024, 16, 385. [Google Scholar] [CrossRef]
- Ceccato, F.; Yerro, A.; Di Carluccio, G. Simulating landslides with the material point method: Best practices, potentialities, and challenges. Eng. Geol. 2024, 338, 107614. [Google Scholar] [CrossRef]
- Basharat, M.; Riaz, M.T.; Jan, M.Q.; Xu, C.; Riaz, S. A review of landslides related to the 2005 Kashmir Earthquake: Implication and future challenges. Nat. Hazards 2021, 108, 1–30. [Google Scholar] [CrossRef]
- Xu, W.J.; Xu, Q.; Liu, G.Y.; Xu, H.Y. A novel parameter inversion method for an improved DEM simulation of a river damming process by a large-scale landslide. Eng. Geol. 2021, 293, 106282. [Google Scholar] [CrossRef]
- Saresma, M.; White, D.J.; Mohapatra, D.; Mohammadi, S.; Sołowski, W.; Korkiala-Tanttu, L.; Virtasalo, J.J.; Gourvenec, S. Assessment of near-surface undrained shear strength of soft seabeds with free fall cone penetrometer testing in the northern Baltic Sea. Eng. Geol. 2025, 346, 107906. [Google Scholar] [CrossRef]
- Wu, H.; Shi, A.; Ni, W.; Zhao, L.; Cheng, Z.; Zhong, Q. Numerical simulation on potential landslide–induced wave hazards by a novel hybrid method. Eng. Geol. 2024, 331, 107429. [Google Scholar] [CrossRef]
- Li, H.; Du, H.; Bai, R.; Liu, G.; Zhao, M.; Liu, R. The failure mechanism and stability of the end slope of inclined composite coal seam. Math. Probl. Eng. 2021, 2021, 2830717. [Google Scholar] [CrossRef]
- Sun, Y.; Li, D.; Miao, F.; She, X.; Yang, S.; Xie, X. Effects of weak bedding plane, fault, and extreme rainfall on the landslide event of a high cut-slope. Sensors 2022, 22, 6790. [Google Scholar] [CrossRef]
- Yan, Y.; Cui, Y.; Huang, X.; Zhou, J.; Zhang, W.; Yin, S.; Guo, J.; Hu, S. Combining seismic signal dynamic inversion and numerical modeling improves landslide process reconstruction. Earth Surf. Dyn. 2022, 10, 1233–1252. [Google Scholar] [CrossRef]
- Hou, D.; Song, X.; Li, S.; Lu, C.; Ma, K.; Li, J. Remote Real Time Monitoring System of Slope and Its Application in Sustainable Mining of Open Pit Coal Mine. In Proceedings of the 2021 The 3rd International Conference on Power and Energy Technology (ICPET 2021), Chengdu, China, 26–29 March 2021; Journal of Physics: Conference Series. IOP Publishing: Bristol, UK, 2021; Volume 1974, p. 012008. [Google Scholar]
- Meng, W.; Dai, Z.; Luo, Q.; Bai, H.; Xia, T.; Cao, Y. Prediction of potential shear slip surface in locked rock mass of gently inclined counter Tilted rock slope under mining effects. Sci. Rep. 2025, 15, 17790. [Google Scholar] [CrossRef]
- Jia, H.; Yang, M.; Dai, L.; Que, Y.; Wang, D.; Yu, Z.; Zhao, Y.; Hu, W.; Xu, J.; Tang, J. Centrifuge tests on the deformation law of pipelines crossing slopes with different water contents. Sci. Rep. 2024, 14, 19466. [Google Scholar] [CrossRef]
- Ko, D.; Park, J.; Kim, J.; Lee, C.; Yoon, H.; Park, S. Experimental Study for Nondestructive Evaluation of Embedded Tendons in Ground Anchors Using an Elasto-Magnetic Sensor: Verification Through Numerical Finite Element Simulations. IEEE Sensors J. 2023, 23, 26055–26066. [Google Scholar] [CrossRef]
- Bojorque, J.; De Roeck, G.; Maertens, J. The use of finite element analysis in monitoring landslides. In Proceedings of the 7th National Congress on Theoretical and Applied Mechanics NCTAM, Mons, Belgium, 29–30 May 2006. [Google Scholar]
- Cheng, H.; Sui, G.; Wang, G.; Deng, J.; Wei, H.; Xu, R.; He, Y.; Yang, W. Study on the optimization of pile length of micropiles in soil landslides. Appl. Sci. 2023, 13, 9980. [Google Scholar] [CrossRef]
- Zhang, K.; Yang, X.; Cui, X.; Wang, Y.; Tao, Z. Numerical Simulation Analysis of NPR Anchorage Monitoring of Bedding Rock Landslide in Open-Pit Mine. Adv. Civ. Eng. 2020, 2020, 8241509. [Google Scholar] [CrossRef]
- Dai, Y.; Dai, W.; Yu, W.; Bai, D. Determination of landslide displacement warning thresholds by applying DBA-LSTM and numerical simulation algorithms. Appl. Sci. 2022, 12, 6690. [Google Scholar] [CrossRef]
- Feng, C.; Li, S.; Liu, T.; Wang, X.; Zhu, X. Numerical-simulation-based landslide warning system and its application. In Proceedings of the IOP Conference Series: Earth and Environmental Science; IOP Publishing: Bristol, UK, 2021; Volume 861, p. 062025. [Google Scholar]
- Chen, X.; Zhang, L.; Zhang, L.; Zhou, Y.; Ye, G.; Guo, N. Modelling rainfall-induced landslides from initiation of instability to post-failure. Comput. Geotech. 2021, 129, 103877. [Google Scholar] [CrossRef]
- Wang, J.H.; Xu, W.J.; Liu, X.X. A slope stability analysis method considering the rainfall hydrology process. Eng. Geol. 2024, 343, 107775. [Google Scholar] [CrossRef]
- Zheng, Y.; Wu, H.; Luan, X.; McCartney, J.S. Numerical simulation of rainfall-induced deformations of embankments considering the coupled hydro-mechanical behavior of unsaturated soils. Comput. Geotech. 2024, 175, 106714. [Google Scholar] [CrossRef]
- Yang, Y.; Peng, S.; Huang, B.; Xu, D.; Yin, Y.; Li, T.; Zhang, R. Multi-scale analysis of the susceptibility of different landslide types and identification of the main controlling factors. Ecol. Indic. 2024, 168, 112797. [Google Scholar] [CrossRef]
- Nguyen, H.S.; Khau, T.L.; Huynh, T.T. Investigation of Natural and Human-Induced Landslides in Red Basaltic Soils. Water 2025, 17, 1320. [Google Scholar] [CrossRef]
- Dille, A.; Dewitte, O.; Handwerger, A.L.; d’Oreye, N.; Derauw, D.; Ganza Bamulezi, G.; Ilombe Mawe, G.; Michellier, C.; Moeyersons, J.; Monsieurs, E.; et al. Acceleration of a large deep-seated tropical landslide due to urbanization feedbacks. Nat. Geosci. 2022, 15, 1048–1055. [Google Scholar] [CrossRef]
- Zhang, Y.; Li, J.; Liu, J.; Xie, W.; Duan, P. Extraction of landslide morphology based on Topographic Profile along the Direction of Slope Movement using UAV images. Geomat. Nat. Hazards Risk 2023, 14, 2278276. [Google Scholar] [CrossRef]
- Jaboyedoff, M.; Carrea, D.; Derron, M.H.; Oppikofer, T.; Penna, I.M.; Rudaz, B. A review of methods used to estimate initial landslide failure surface depths and volumes. Eng. Geol. 2020, 267, 105478. [Google Scholar] [CrossRef]
- Wang, L.; Zhang, K.; Chen, Y.; Wang, S.; Tian, D.; Li, X.; He, Y. Progressive deformation mechanism of colluvial landslides induced by rainfall: Insights from long-term field monitoring and numerical study. Landslides 2024, 21, 3069–3086. [Google Scholar] [CrossRef]
- Huang, J.; Wang, H.; Zhou, L.; Zhu, Z.; Deng, Z.; Wang, Z. Theoretical analysis of two cracks in sandstone under the simultaneous action of pressure and shear stress. Fatigue Fract. Eng. Mater. Struct. 2023, 46, 2585–2602. [Google Scholar] [CrossRef]
- D’Ippolito, A.; Lupiano, V.; Rago, V.; Terranova, O.G.; Iovine, G. Triggering of rain-induced landslides, with applications in southern Italy. Water 2023, 15, 277. [Google Scholar] [CrossRef]
- Zhang, T.; Zhang, Z.; Xu, C.; Hao, R.; Lv, Q.; Jia, J.; Liang, S.; Zhu, H. Destabilization Mechanism of Rainfall-Induced Loess Landslides in the Kara Haisu Gully, Xinyuan County, Ili River Valley, China: Physical Simulation. Water 2023, 15, 3775. [Google Scholar] [CrossRef]
- Zhang, M.; Wang, W.; Hao, Y.; Liu, X.; Zhang, R.; Tian, Z.; Huang, M.; Zhang, J. Study on the formation mechanisms and stability of a gently inclined and shallow accumulative landslide. Sci. Rep. 2025, 15, 15246. [Google Scholar] [CrossRef]
- Zhang, W.; Meng, X.; Wang, L.; Meng, F. Stability analysis of the reservoir bank landslide with weak interlayer considering the influence of multiple factors. Geomat. Nat. Hazards Risk 2022, 13, 2911–2924. [Google Scholar] [CrossRef]
- Ren, G.M.; Xia, M.; Lv, S.M. Stability analysis of a landslide influenced by rainfall. Soil Mech. Found. Eng. 2023, 60, 55–62. [Google Scholar] [CrossRef]
- Chen, C.; Xie, M.w.; Jiang, Y.j.; Jia, B.n.; Du, Y. A new method for quantitative identification of potential landslide. Soils Found. 2021, 61, 1475–1479. [Google Scholar] [CrossRef]
- Trefry, M.G.; Muffels, C. FEFLOW: A finite-element ground water flow and transport modeling tool. Groundwater 2007, 45, 525–528. [Google Scholar] [CrossRef]
- Jalali, M.; Dusseault, M. Coupled fluid-flow and geomechanics in naturally fractured reservoirs. In Proceedings of the ISRM International Symposium-Asian Rock Mechanics Symposium, Tehran, Iran, 24–26 November 2008; ISRM: Salzburg, Austria, 2008; p. ISRM-ARMS5-2008-153. [Google Scholar]
- Liu, Y.; Wang, G.; Ji, Y.; Jin, S.; Wan, T. Dynamic response of twin parallel tunnels in unsaturated soil under metro train loadings. Sci. Rep. 2025, 15, 16117. [Google Scholar] [CrossRef] [PubMed]
- Zhang, S.; Zhao, L.; Delgado-Tellez, R.; Bao, H. A physics-based probabilistic forecasting model for rainfall-induced shallow landslides at regional scale. Nat. Hazards Earth Syst. Sci. 2018, 18, 969–982. [Google Scholar] [CrossRef]
- ISO 18674; Geotechnical Investigation and Testing—Testing of Geotechnical Structures. International Organization for Standardizatio: Geneva, Switzerland, 2020.
- ASTM D6429-23; Standard Guide for Selecting Test Methods to Determine Susceptibility of Soils to Erosion by Hydraulic Forces. ASTM International: West Conshohocken, PA, USA, 2023.
- Cheng, Y.; Pang, H.; Li, Y.; Fan, L.; Wei, S.; Yuan, Z.; Fang, Y. Applications and advancements of spaceborne InSAR in landslide monitoring and susceptibility mapping: A systematic review. Remote Sens. 2025, 17, 999. [Google Scholar] [CrossRef]
- Guo, Y.; Xiong, L.; Wu, H.; Zhou, W.; Zhou, X.; Liu, H. A FBG inclinometer for simultaneous measurement of horizontal deformation and sudden deformation. IEEE Trans. Instrum. Meas. 2021, 70, 9513810. [Google Scholar] [CrossRef]







| Stratigraphic Type | Unit Weight (kN/m3) | Elastic Modulus (Gpa) | Poisson’s Ratio | Cohesion (Kpa) | Friction Angle (°) |
|---|---|---|---|---|---|
| Gravel Layer | 19 | 3.32 | 0.24 | 1 | 41 |
| Pebble Layer | 19.5 | 6.24 | 0.25 | 2 | 43.3 |
| completely Weathered Mudstone | 20 | 6.18 | 0.3 | 20 | 25 |
| completely Weathered Carbonaceous Mudstone | 20 | 6.22 | 0.3 | 17 | 18 |
| Strongly Weathered Sandstone | 20 | 6.73 | 0.35 | 60 | 35 |
| Stratum Type | Saturated Volumetric Water Content (%) | Saturated Hydraulic Conductivity (m/s) |
|---|---|---|
| Gravel layer | 0.36 | 5.36 × 10⁻⁶ |
| Pebble layer | 0.40 | 4.84 × 10⁻⁶ |
| completely weathered mudstone | 0.23 | 2.26 × 10⁻⁶ |
| completely weathered carbonaceous mudstone | 0.26 | 3.24 × 10⁻⁶ |
| Strongly weathered sandstone | 0.12 | 1.13 × 10⁻⁶ |
| Parameter | Standard Value | Fluctuation Value | Output Indicator |
|---|---|---|---|
| Permeability coefficient of sliding zone (k) | m/s | ±20% | Variation rate of shallow pore pressure |
| Internal friction angle of sliding zone () | 25° | ±20% | Maximum displacement variation rate |
| Cohesion of the sliding zone (c) | 20 kpa | ±20% | Maximum displacement variation rate |
| Rainfall intensity (I) | 44 mm/day | ±20% | Variation rate of saturation depth |
| Elastic modulus of mudstone (E) | 6.18 GPa | ±20% | Variation rate of shear strain peak value |
| Parameter | Perturbation Direction | Perturbation Value | Output Indicator | Original Value | Perturbed Value | Change Rate () |
|---|---|---|---|---|---|---|
| k | +20% | 2.71 × 10⁻⁶ m/s | Shallow Pore Water Pressure (MPa) | 0.35 | 0.3 | −14.30% |
| k | −20% | 1.81 × 10⁻⁶ m/s | Shallow Pore Water Pressure (MPa) | 0.35 | 0.42 | 20.00% |
| +20% | 30° | Maximum Displacement (m) | 2.442 | 1.79 | −26.00% | |
| −20% | 20° | Maximum Displacement (m) | 2.442 | 3.25 | 33.00% | |
| c | +20% | 24 kPa | Maximum Displacement (m) | 2.442 | 2.17 | −11.20% |
| c | −20% | 16 kPa | Maximum Displacement (m) | 2.442 | 2.96 | 21.30% |
| I | +20% | 52.8 mm/day | Saturation Depth (m) | 15 | 18.5 | 23.30% |
| I | −20% | 35.2 mm/day | Saturation Depth (m) | 15 | 12 | −20.00% |
| E | +20% | 7.42 GPa | Shear Strain Peak Value (Pa) | 6.4 × 10⁻¹ | 5.44 × 10⁻¹ | −15.40% |
| E | −20% | 4.94 GPa | Shear Strain Peak Value (Pa) | 6.4 × 10⁻¹ | 7.68 × 10⁻¹ | 19.30% |
| Monitoring Objective | Specification Criterion |
|---|---|
| Capture shallow deformation (0–15 m) | Require displacement resolution ≤ 1 mm in high-risk areas |
| Monitor deep gradual deformation (>30 m) | Allow monitoring accuracy to be relaxed to ±5 mm in low-risk areas |
| Detect transient saturated zone water pressure changes | Require sampling frequency ≥ 1/min in regions with hydraulic gradients > 0.5 kPa/m |
| Track cumulative effects of deep seepage flow | Specify vertical spacing between deep monitoring points ≤ 10 m |
| Identify zones of concentrated shear strain change | Require spatial resolution ≤ 0.5 m in regions with strain changes > 5% |
| Monitor weakening of the sliding interface | Specify that sensors need to be bidirectionally deployed at soft/weak interlayer interfaces |
| Monitoring Parameter | Simulation Level/Depth | Data Source | Sensor Deployment Adjustment Rule |
|---|---|---|---|
| Displacement Magnitude | >1.0 m (Shallow) | Figure 9a | GNSS station horizontal spacing ≤ 50 m (core area) |
| 0.2–1.0 m (Middle layer) | Figure 9c | FBG borehole horizontal spacing ≤ 5 m | |
| <0.2 m (Deep layer) | Figure 9f | FBG borehole horizontal spacing ≤ 10 m (peripheral area) | |
| Displacement Depth | 0–15 m (High gradient zone) | Figure 9a–i | FBG vertical density: 0.5 m/point |
| >30 m (Low gradient zone) | Figure 9c | FBG vertical density: 2.0 m/point | |
| Pore Pressure Level | >0.4 MPa (Shallow transient) | Figure 12b | Interlayer pore water pressure vertical spacing ≤ 2 m |
| 0.25–0.4 MPa (Deep cumulative) | Figure 12c | Vertical spacing ≤ 5 m | |
| Saturation Depth | ≤6 m (Heavy rainfall) | Figure 13a | Saturated-unsaturated interface ±2.5 m, deploy ≥ 3 sensors |
| >15 m (Persistent rainfall) | Figure 13b | Deploy 1 sensor every 10 m vertically | |
| Strain Level | >30% (High-risk zone) | Figure 14b | FBG horizontal spacing ≤ 5 m |
| 5–30% (Medium-risk zone) | Figure 14c | Horizontal spacing ≤ 8 m | |
| <5% (Stable zone) | Figure 14a | Horizontal spacing ≤ 10 m | |
| Strain Depth | 5–15 m (Sliding zone) | Figure 14b | FBG vertical density: 0.5 m/point |
| >20 m (Bedrock zone) | Figure 14a | Vertical density: 1.0 m/point |
| Monitoring Objectives | Number of Inclinometer Tubes | Number of FBGs in a Single Tube | Total Number of FBGs | Layout Mode |
|---|---|---|---|---|
| The core area of the main sliding belt | 3–5 roots | 40–50 pcs | 100–250 pcs | Zigzag grid |
| Secondary deformation zone | 1–2 roots | 20–30 pcs | 20–60 pcs | Linear supplemental profile |
| Risk Level | Displacement Threshold | Pore Pressure Threshold | Stress–Strain Threshold |
|---|---|---|---|
| Yellow Alert | >5 mm/h (GNSS) | >0.25 MPa at slip zone | FBG strain >300 με |
| Orange Alert | >20 mm/h (GNSS) | >0.4 MPa at slip zone | FBG strain > 1500 με |
| Red Alert | >50 mm/h or sudden direction change | Pore pressure gradient >1 kPa/m | FBG strain > 6400 με |
| Risk Level | FBG Point Density | GNSS Spacing | Cost Proportion |
|---|---|---|---|
| Core Sliding Belt (5–15 m) | 0.5 m/point (vertical) | ≤50 m | 65% |
| Secondary Deformation Zone | 2 m/point (vertical) | 100–200 m | 25% |
| Stable Bedrock Zone | 5m/point (vertical) | No GNSS Deployment | 10% |
Disclaimer/Publisher’s Note: The statements, opinions and data contained in all publications are solely those of the individual author(s) and contributor(s) and not of MDPI and/or the editor(s). MDPI and/or the editor(s) disclaim responsibility for any injury to people or property resulting from any ideas, methods, instructions or products referred to in the content. |
© 2025 by the authors. Licensee MDPI, Basel, Switzerland. This article is an open access article distributed under the terms and conditions of the Creative Commons Attribution (CC BY) license (https://creativecommons.org/licenses/by/4.0/).
Share and Cite
Dai, X.; Liu, Z.; Liu, Q.; Cheng, L. Rainfall-Adaptive Landslide Monitoring Framework Integrating FLAC3D Numerical Simulation and Multi-Sensor Optimization: A Case Study in the Tianshan Mountains. Sensors 2025, 25, 5433. https://doi.org/10.3390/s25175433
Dai X, Liu Z, Liu Q, Cheng L. Rainfall-Adaptive Landslide Monitoring Framework Integrating FLAC3D Numerical Simulation and Multi-Sensor Optimization: A Case Study in the Tianshan Mountains. Sensors. 2025; 25(17):5433. https://doi.org/10.3390/s25175433
Chicago/Turabian StyleDai, Xiaomin, Ziang Liu, Qihang Liu, and Long Cheng. 2025. "Rainfall-Adaptive Landslide Monitoring Framework Integrating FLAC3D Numerical Simulation and Multi-Sensor Optimization: A Case Study in the Tianshan Mountains" Sensors 25, no. 17: 5433. https://doi.org/10.3390/s25175433
APA StyleDai, X., Liu, Z., Liu, Q., & Cheng, L. (2025). Rainfall-Adaptive Landslide Monitoring Framework Integrating FLAC3D Numerical Simulation and Multi-Sensor Optimization: A Case Study in the Tianshan Mountains. Sensors, 25(17), 5433. https://doi.org/10.3390/s25175433


