1. Introduction
The widespread use of fossil fuels, large-scale deforestation, and various land-use changes have resulted in a continuous rise in atmospheric greenhouse gas (GHG) levels, thereby triggering global climate change [
1]. In 2023, the global average surface concentration of carbon dioxide (CO
2) was 420.0 parts per million (ppm), that of methane was 1934 parts per billion (ppb), and the concentration of nitrous oxide was 336.9 parts per billion, which represent increases of 51%, 165%, and 25%, respectively, compared to pre-industrial values. Furthermore, 2023 marked the 12th consecutive year with an annual carbon dioxide growth exceeding 2 ppm [
2]. To reduce GHGs, China has set a goal to achieve “peak carbon” emissions by 2030 and become “carbon neutral” by 2060 [
3].
Continuous and near-real-time monitoring of greenhouse gases is crucial for achieving Net Zero emissions, ensuring early detection, compliance, accountability, and adaptive management. More specifically, GHG monitoring is vital for investigating the global carbon cycle, evolution trends, regional sources and transport, ecological flux estimates, urban or industrial emissions estimates, validations of chemical transport models (CTMs), and emission inventories [
4]. Given China’s rapid urbanization, with over 60% of its population now living in cities, it is no surprise that urban areas are major sources of carbon emissions [
5] due to energy consumption, transportation, and industrial activities [
6]. Effective GHG monitoring can also help cities adopt sustainable practices such as energy-efficient buildings, green transportation, and renewable energy to balance economic growth with environmental protection. By integrating GHG monitoring with smart city technologies (e.g., IoT sensors, AI, and big data), resource use can be optimized, and emissions can be reduced.
A recent APEC report [
7] identifies critical gaps in current monitoring strategies, including insufficient sensor coverage across vast or difficult-to-access regions, which limits the ability to capture spatially representative emissions data at fine scales. The report also stresses that IoT technologies are essential for environmental sensing, as they enable automated, resilient monitoring across large networks, ensuring accurate data collection and timely emission control, even in harsh conditions. Consequently, there is a growing demand for cost-effective, scalable, and reliable solutions for GHG measurement and monitoring that can operate across diverse geographic and environmental conditions. The authors of [
4] further emphasize that effective monitoring may require the following scales and resolutions: 1. A temporal resolution, in terms of the sensor measurement update rate, ranging from typical intervals of several hours down to minutes or seconds. 2. A spatial resolution, in terms of distance between sensor nodes, ranging from several kilometres down to a few metres. 3. A coverage scale ranging from local, regional, large, to global. These requirements are particularly challenging due to limited sensor network coverage and power sources over large geographical areas, even in urban environments. Providing such services is generally not commercially viable and often requires support from non-profit initiatives. In addition, achieving a high temporal resolution is technologically challenging.
In this context, low-power wide-area networking (LPWAN) technologies such as LoRaWAN [
8] offer a promising solution to the challenges of large-scale, long-term GHG monitoring. Unlike other LPWAN technologies such as NB-IoT, Sigfox, and LTE-M, which operate in the licenced spectrum and are typically controlled by major network operators like China Mobile or China Telecom, LoRaWAN operates in the unlicensed spectrum [
9]. This allows independent stakeholders to deploy and manage networks with greater flexibility and at a lower cost. Its ability to provide long-range, high-penetration wireless connectivity with minimal energy consumption makes it well-suited for powering distributed sensor networks. Moreover, the low power requirements facilitate integration with renewable energy sources, further enhancing the sustainability and scalability of LoRaWAN for environmental sensing applications.
Despite these promising features, LoRaWAN faces several challenges, such as a low data rate, low packet transmission rate, and low packet delivery ratio, especially when the node density or environmental variability is high. A new investigation into the feasibility of this technology for continuous GHG monitoring, as well as into techniques that can be adopted to improve performance, is therefore required.
In this paper, the modelling and performance analysis of a large-scale LoRaWAN network in the context of continuous GHG monitoring in China’s CN470–510 MHz band are presented. It investigates how the node density, sensor update rate, and sensor measurement payload size affect the network’s sensor measurement update delivery ratio (DR) and RF energy consumption (RFEC). The paper also presents the effects of several enhanced adaptive data transmission algorithms on DR and RFEC. The contributions of this work are summarized as follows:
The key requirements for effective continuous GHG monitoring are outlined, and the feasibility of LoRaWAN technology meeting these requirements is evaluated.
Specifically, this paper conducts an in-depth theoretical analysis of sensor measurement uplink capacity by examining the constraints imposed by the LoRaWAN protocol, including limitations on the maximum payload size, time on air (ToA), and regulatory duty cycle restrictions.
A comprehensive simulation model is presented to investigate the effects of node density, sensor update rate (or interval), and sensor payload sizes on the network’s overall sensor update DR and RFEC per successful sensor update in China’s CN470–510 MHz band.
Several statistical enhancements of the conventional uplink adaptive data rate algorithm are proposed.
The results indicate that both DR and RFEC are significantly influenced by the node density, sensor update rate, and payload size, with the effects being particularly noticeable under high-node-density and high-update-rate conditions. The analysis further reveals that the ADR-NODE-KAMA algorithm consistently achieves the best performance across most operating scenarios, providing up to a 2% improvement in DR and a reduction of 10–15 mJ in RFEC per successful sensor update. Additionally, the sensor measurement payload size is shown to have a substantial impact on network performance, with each added sensor measurement contributing to a DR reduction of up to 2.24% and an increase in RFEC of approximately 80 mJ.
LoRaWAN network operators can gain practical insights from these findings to optimize the performance and efficiency of large-scale GHG monitoring deployments. Operators can use this knowledge to fine-tune deployment strategies, such as deciding spatial and temporal resolutions and payload configurations, to reduce congestion and energy waste. The superiority of the ADR-NODE-KAMA algorithm provides a means for improving network reliability and energy efficiency. Additionally, understanding the performance trade-offs associated with adding sensor measurements helps operators make informed decisions about system scalability and sensing resolution, particularly in the context of regulatory constraints such as the 1% duty cycle in the CN470–510 MHz band.
2. Related Works
The application of LoRaWAN for large-scale monitoring systems has been extensively studied in recent years, with research focusing on energy efficiency, network optimization, and performance evaluation. Slabicki et al. [
10] developed an open-source framework called FLoRa for simulating LoRa networks in OMNeT++ and evaluated the adaptive data rate (ADR) mechanism for dense IoT deployments. They proposed an improved ADR algorithm to enhance network performance under variable channel conditions, demonstrating significant improvements in reliability and energy efficiency. The framework and ADR+ are adopted in this work as one of the benchmark algorithms.
Gava et al. [
11] proposed a resource optimization methodology for LoRaWANs, using variable neighbourhood search (VNS) and minimum-cost spanning tree algorithms to reduce implementation and maintenance costs. Their study optimized parameters such as the spreading factor (SF), bandwidth, and transmission power to minimize energy consumption and data collection time. The results demonstrated that optimizing these parameters can significantly enhance network performance, especially in scenarios with varying node densities.
Sherazi et al. [
12] investigated the energy efficiency of LoRaWAN in industrial environments, focusing on battery life, replacement costs, and the potential of energy harvesting to extend device lifetimes and reduce operational costs. Their study highlighted the trade-offs between sensing intervals, battery life, and damage penalties, demonstrating the potential for significant cost savings through optimized energy management.
Griva et al. [
13] assessed the performance of LoRa-based IoT networks in rural and urban scenarios, using different path loss models to simulate various deployment environments. Their study highlighted the impact of key parameters such as the transmission power, spreading factor, and gateway placement on network performance metrics like the data extraction rate (DER) and network energy consumption (NEC). The findings indicated that optimizing these parameters is crucial for efficient network deployment in diverse environments.
Fang et al. [
14] conducted in situ measurements of atmospheric CO
2 at four WMO/GAW stations in China using cavity ring-down spectroscopy instruments. They analysed the diurnal, seasonal, and interannual variations in CO
2 mole fractions, providing insights into the regional carbon cycles and underlying fluxes. Their work emphasized the importance of understanding local sources and sinks for accurate atmospheric CO
2 monitoring, which is crucial for developing reliable GHG monitoring systems.
Eich et al. [
15] presented a proof-of-concept study for environmental monitoring using LoRaWAN, focusing on temperature, humidity, and CO
2 concentration measurements in greenhouse environments. Their work evaluated the reliability of LoRaWAN communication in real-world agricultural settings and highlighted both the challenges and best practices associated with long-term deployment. While the authors focused on proof-of-concept deployments in controlled greenhouse environments, this work extends their investigation by modelling a large-scale urban LoRaWAN network. It emphasizes continuous, near-real-time GHG monitoring and analyses the performance impact of network parameters, such as the node density, sensor update rate, and payload size, within China’s CN470–510 MHz band.
These studies collectively provide a comprehensive understanding of the potential and challenges of deploying LoRaWAN for large-scale monitoring applications. They emphasize the importance of adaptive and optimized network configurations to achieve energy efficiency, extended device lifetimes, and reliable communication, which are essential for near-real-time large-scale GHG monitoring systems. This work extends the above studies by modelling deployment scenarios based on the China CN470 specification [
11] in the context of continuous GHG monitoring. Several enhancements to uplink adaptive data algorithms with a uniform sensor update rate are proposed, and their effectiveness is compared in terms of DR and RFEC.
4. Simulation Results
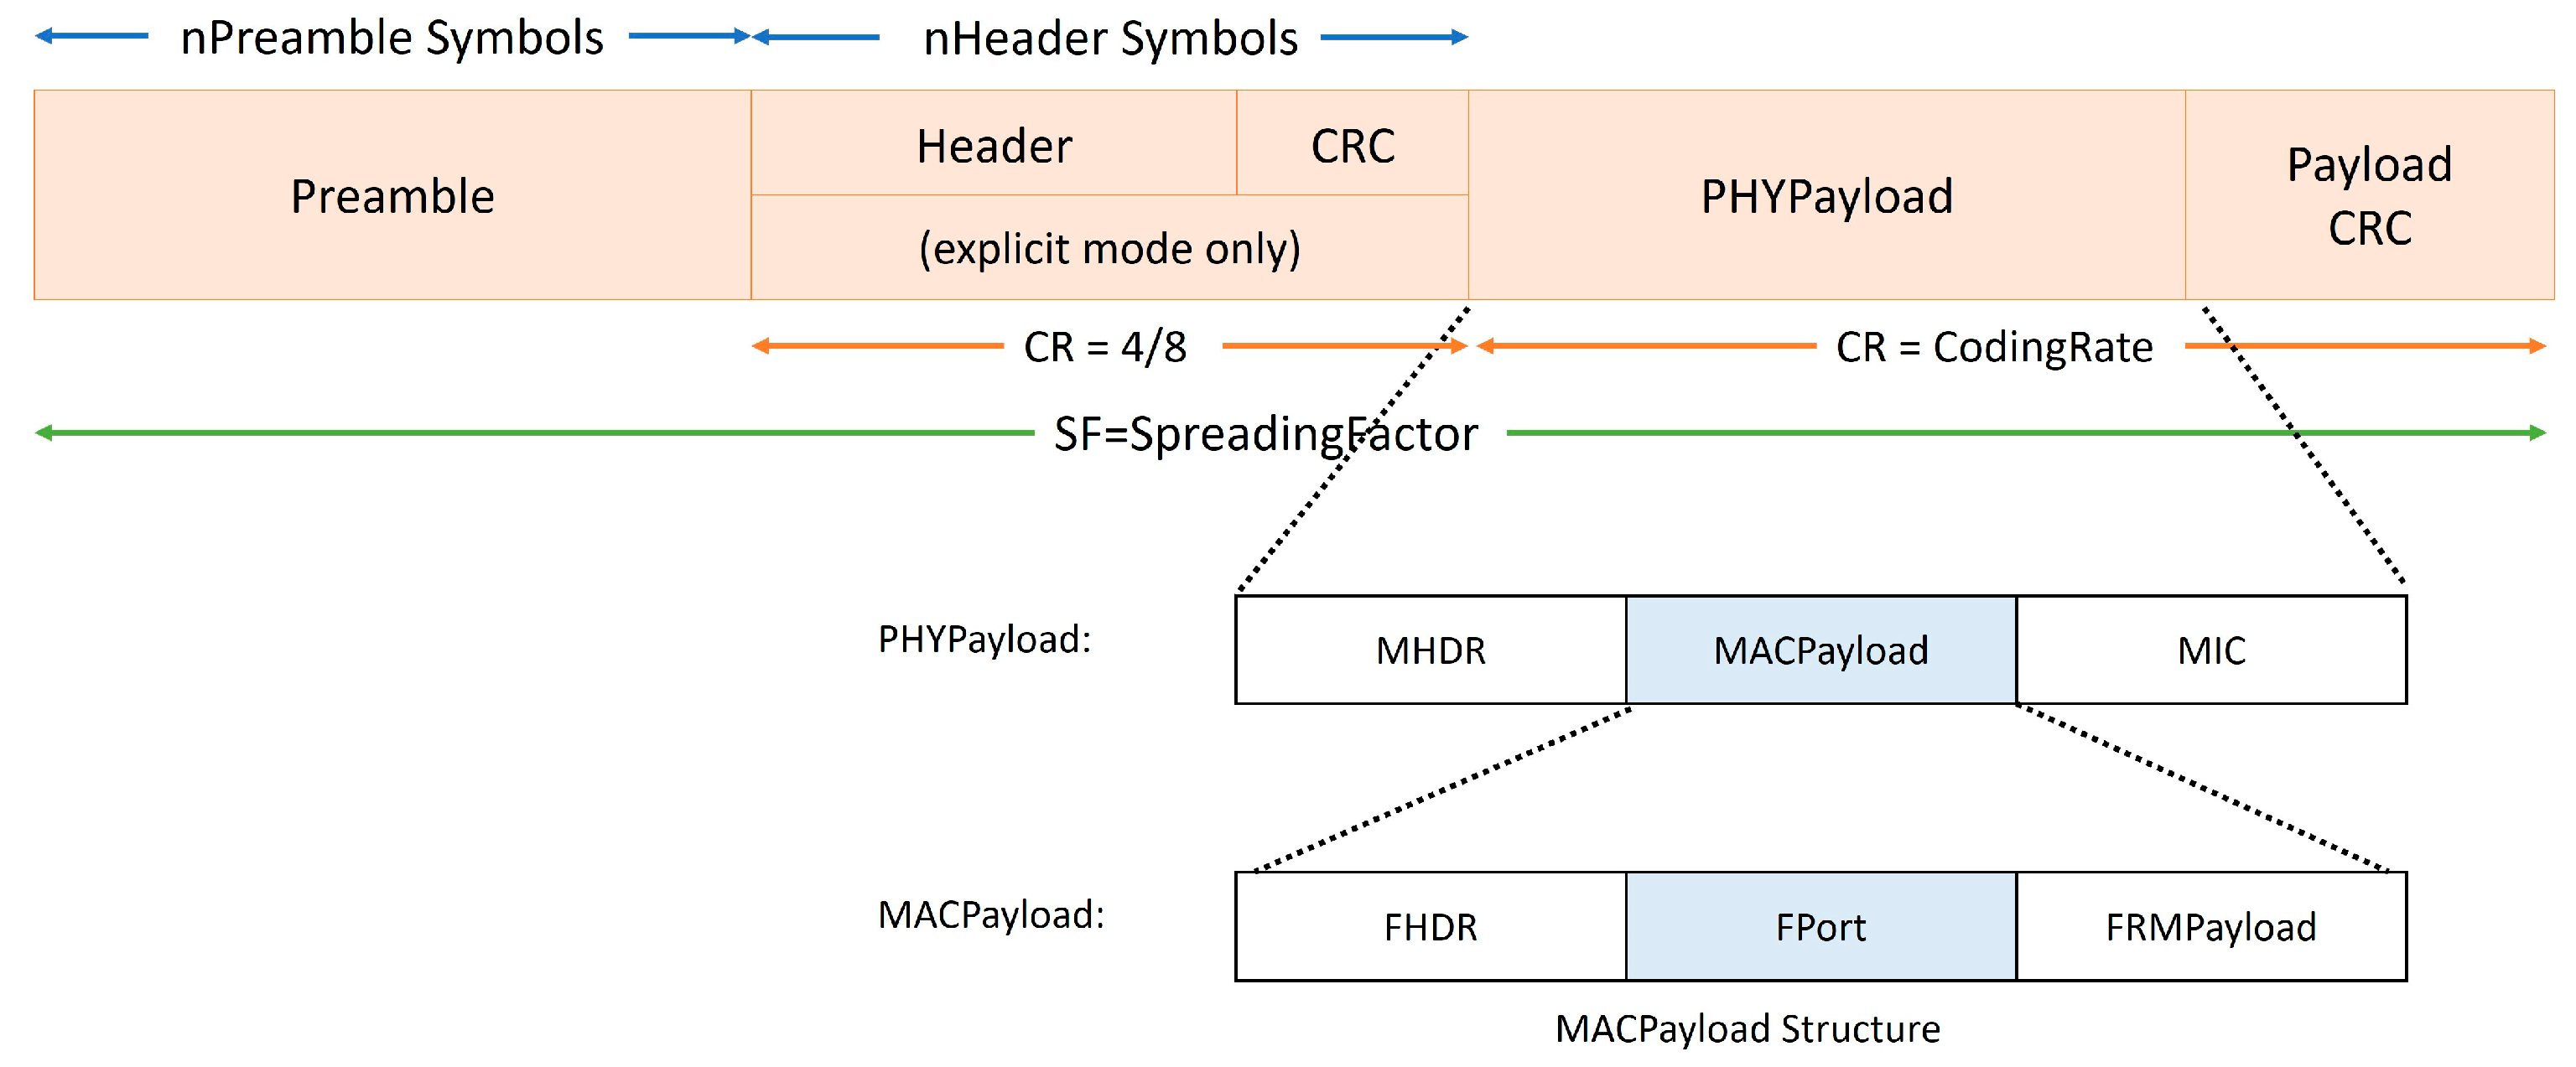
The key LoRa physical layer parameters employed in the subsequent studies are summarized in
Table 1, which are derived from the SEMTECH Corporation datasheet [
18] and the LoRaWAN Alliance specification [
17]. In FloRa, if two packets use the same channel and SF is received by a LoRa receiver, the packet with the higher received signal strength indicator (RSSI) can be decoded, provided that its signal-to-noise and interference ratio (SNIR) exceeds the threshold.
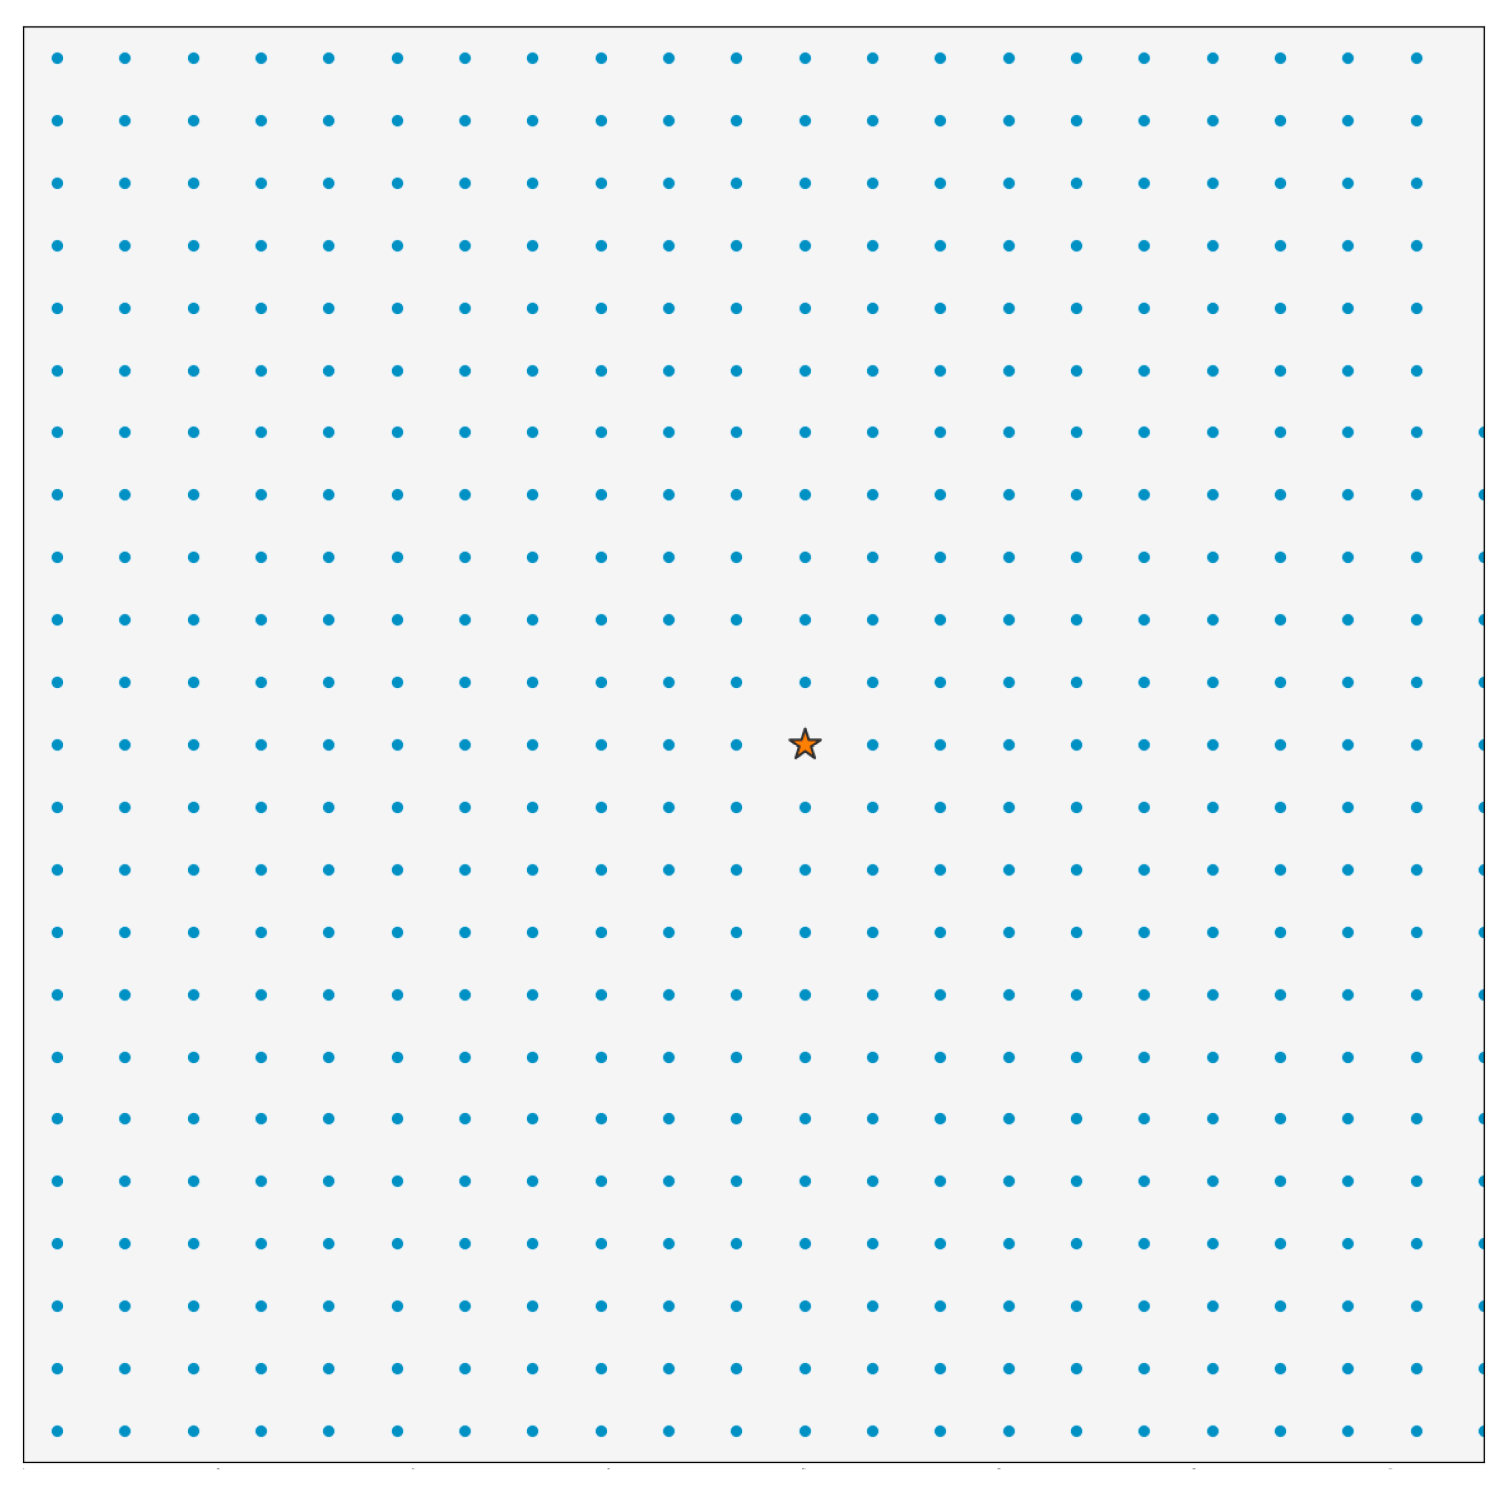
Figure 2 illustrates the topology adopted in this paper. The network model consists of a 16 km
2 (4 × 4 km) coverage area with a single gateway positioned at the centre. As shown in the figure, the sensor nodes are uniformly distributed throughout the area. The evaluation of a representative range of these fixed densities enabled the exploration of performance boundaries and trends that are relevant across a variety of deployment scenarios, including mixed environments.
All simulations were carried out using OMNeT++ (version 6.0.2), together with INET (version 4.4.0) and FLoRa (version 1.1.0) frameworks.
4.1. Verification of Single LoRaWAN Node Model
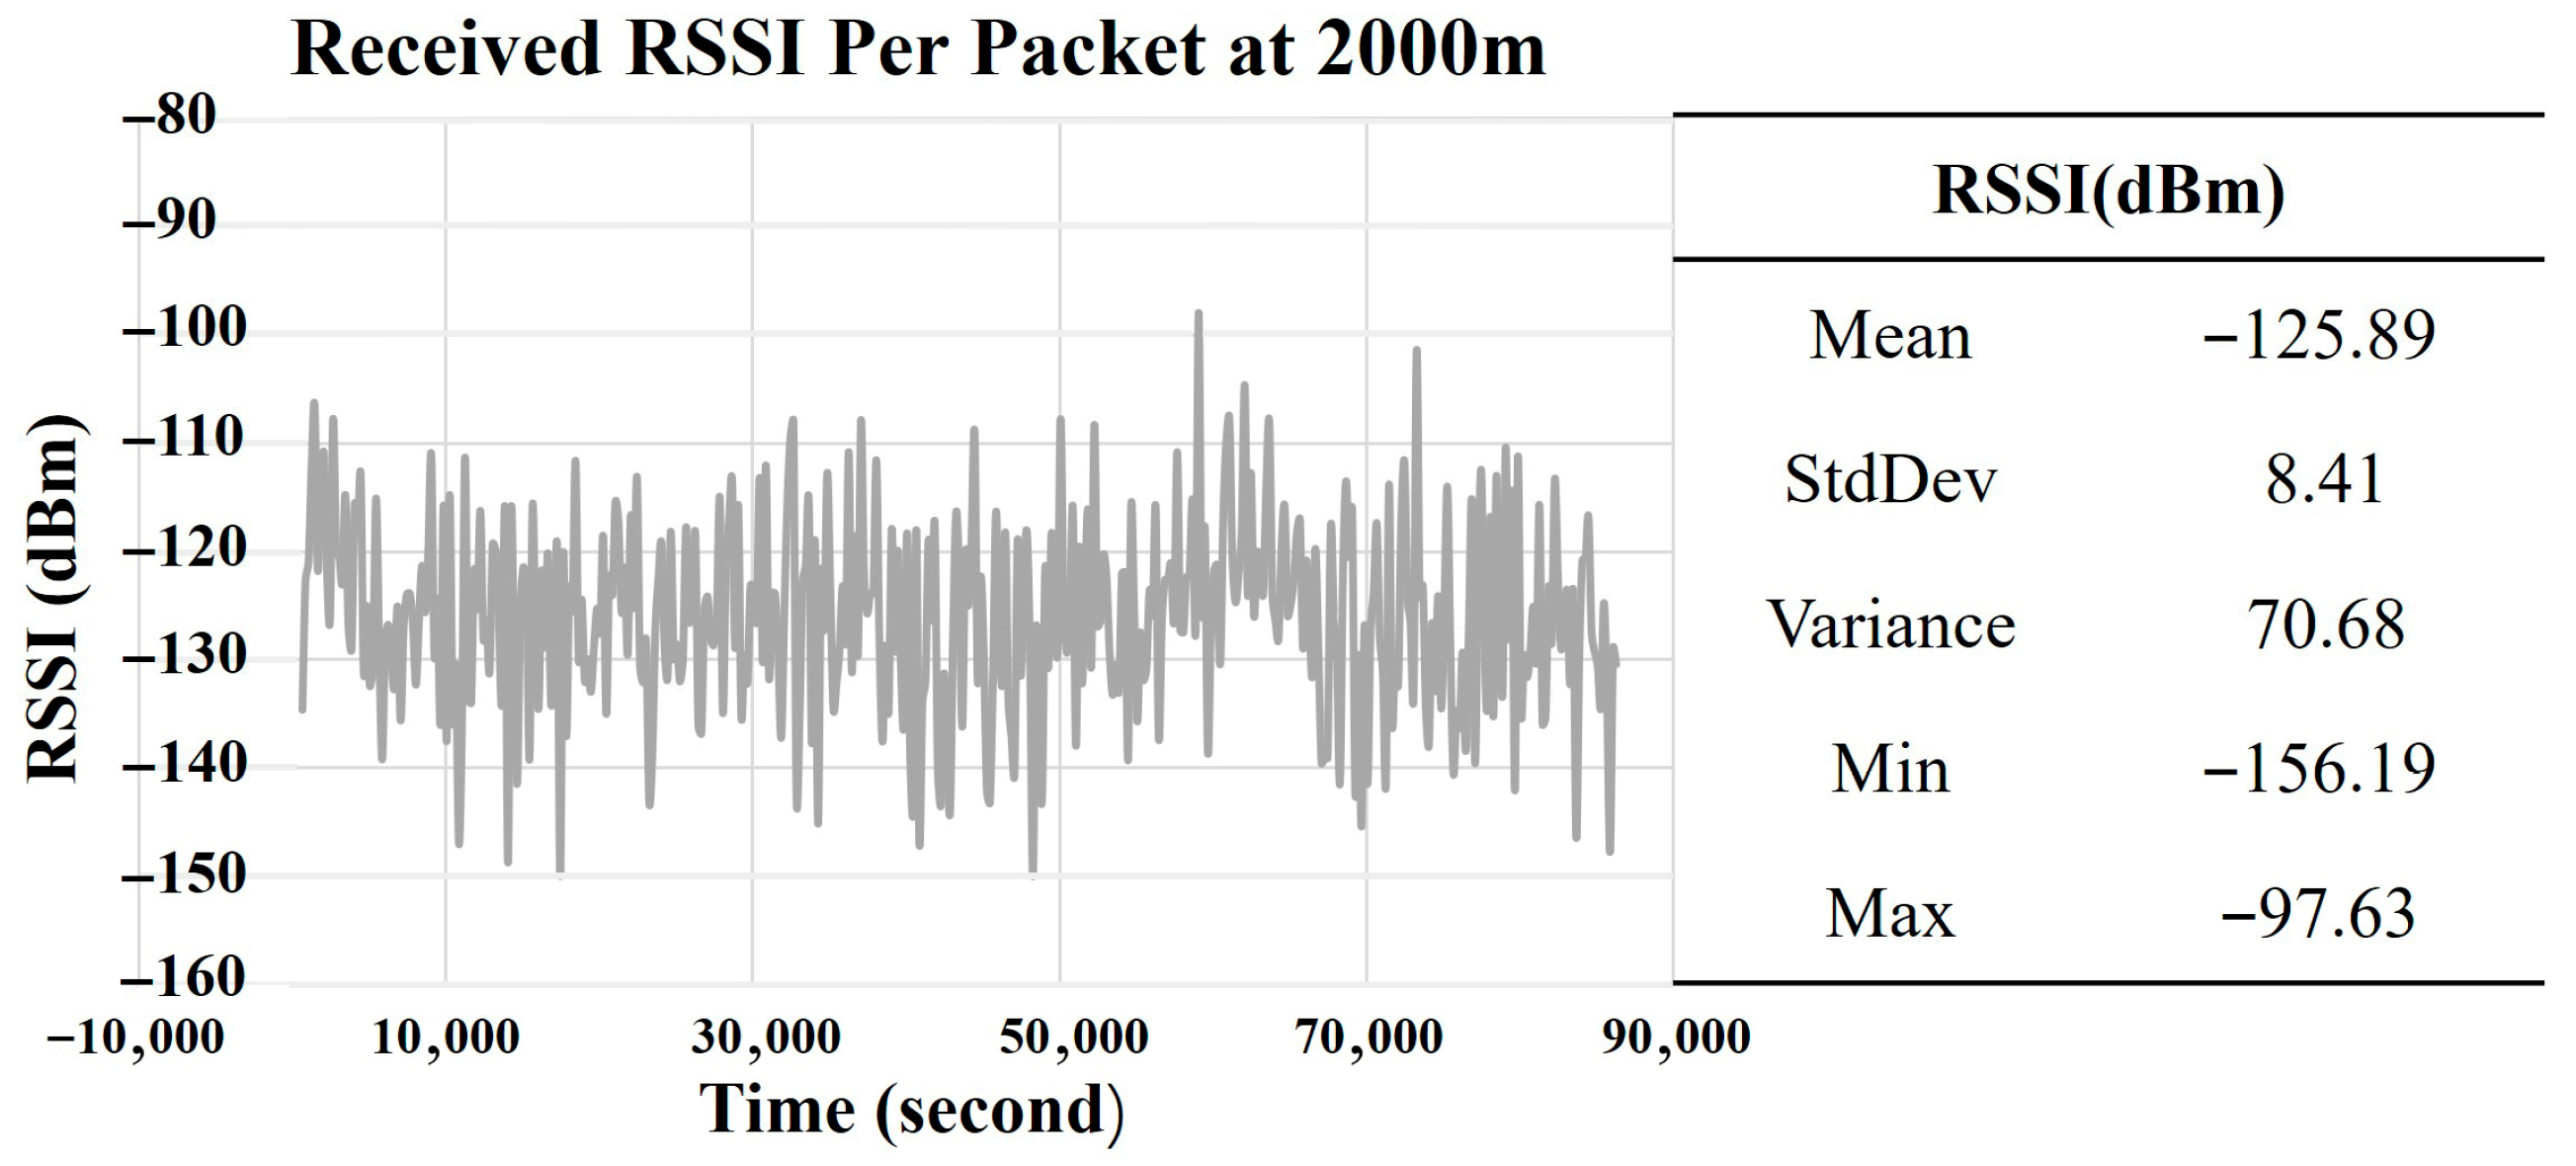
Figure 3 illustrates the RSSI of pre-decoded packets received at the gateway from a node that is 2000 m away from the gateway using the ADR+ algorithm.
As shown, the received RSSI exhibits high variability, with values ranging from −97.63 to −156.19 dBm. This implies that the received RSSIs are capable of supporting transmissions from SF7 to 12 (or DR0 to DR5), which requires a minimum RSSI ranging from −121 to −137 dBm according to [
18].
Table 9 presents the measured DR and RFEC over the one day period.
4.2. Effects of Node Densities
In this section, the total number of nodes per 4 km
2 is increased from 100 to 500 in increments of 100 nodes. This is translated to 25, 50, 75, 100, and 125 nodes per km
2 or average distances between nodes of ~200, 141.42, 115.47, 100, and 89.44 m, respectively. Each simulation is run over a simulation period of 3 days. Initially, all sensor nodes are set to the max TP (14 dBm) and most robust SF (SF12) according to
Table 8 to ensure all nodes are within the coverage of the gateway.
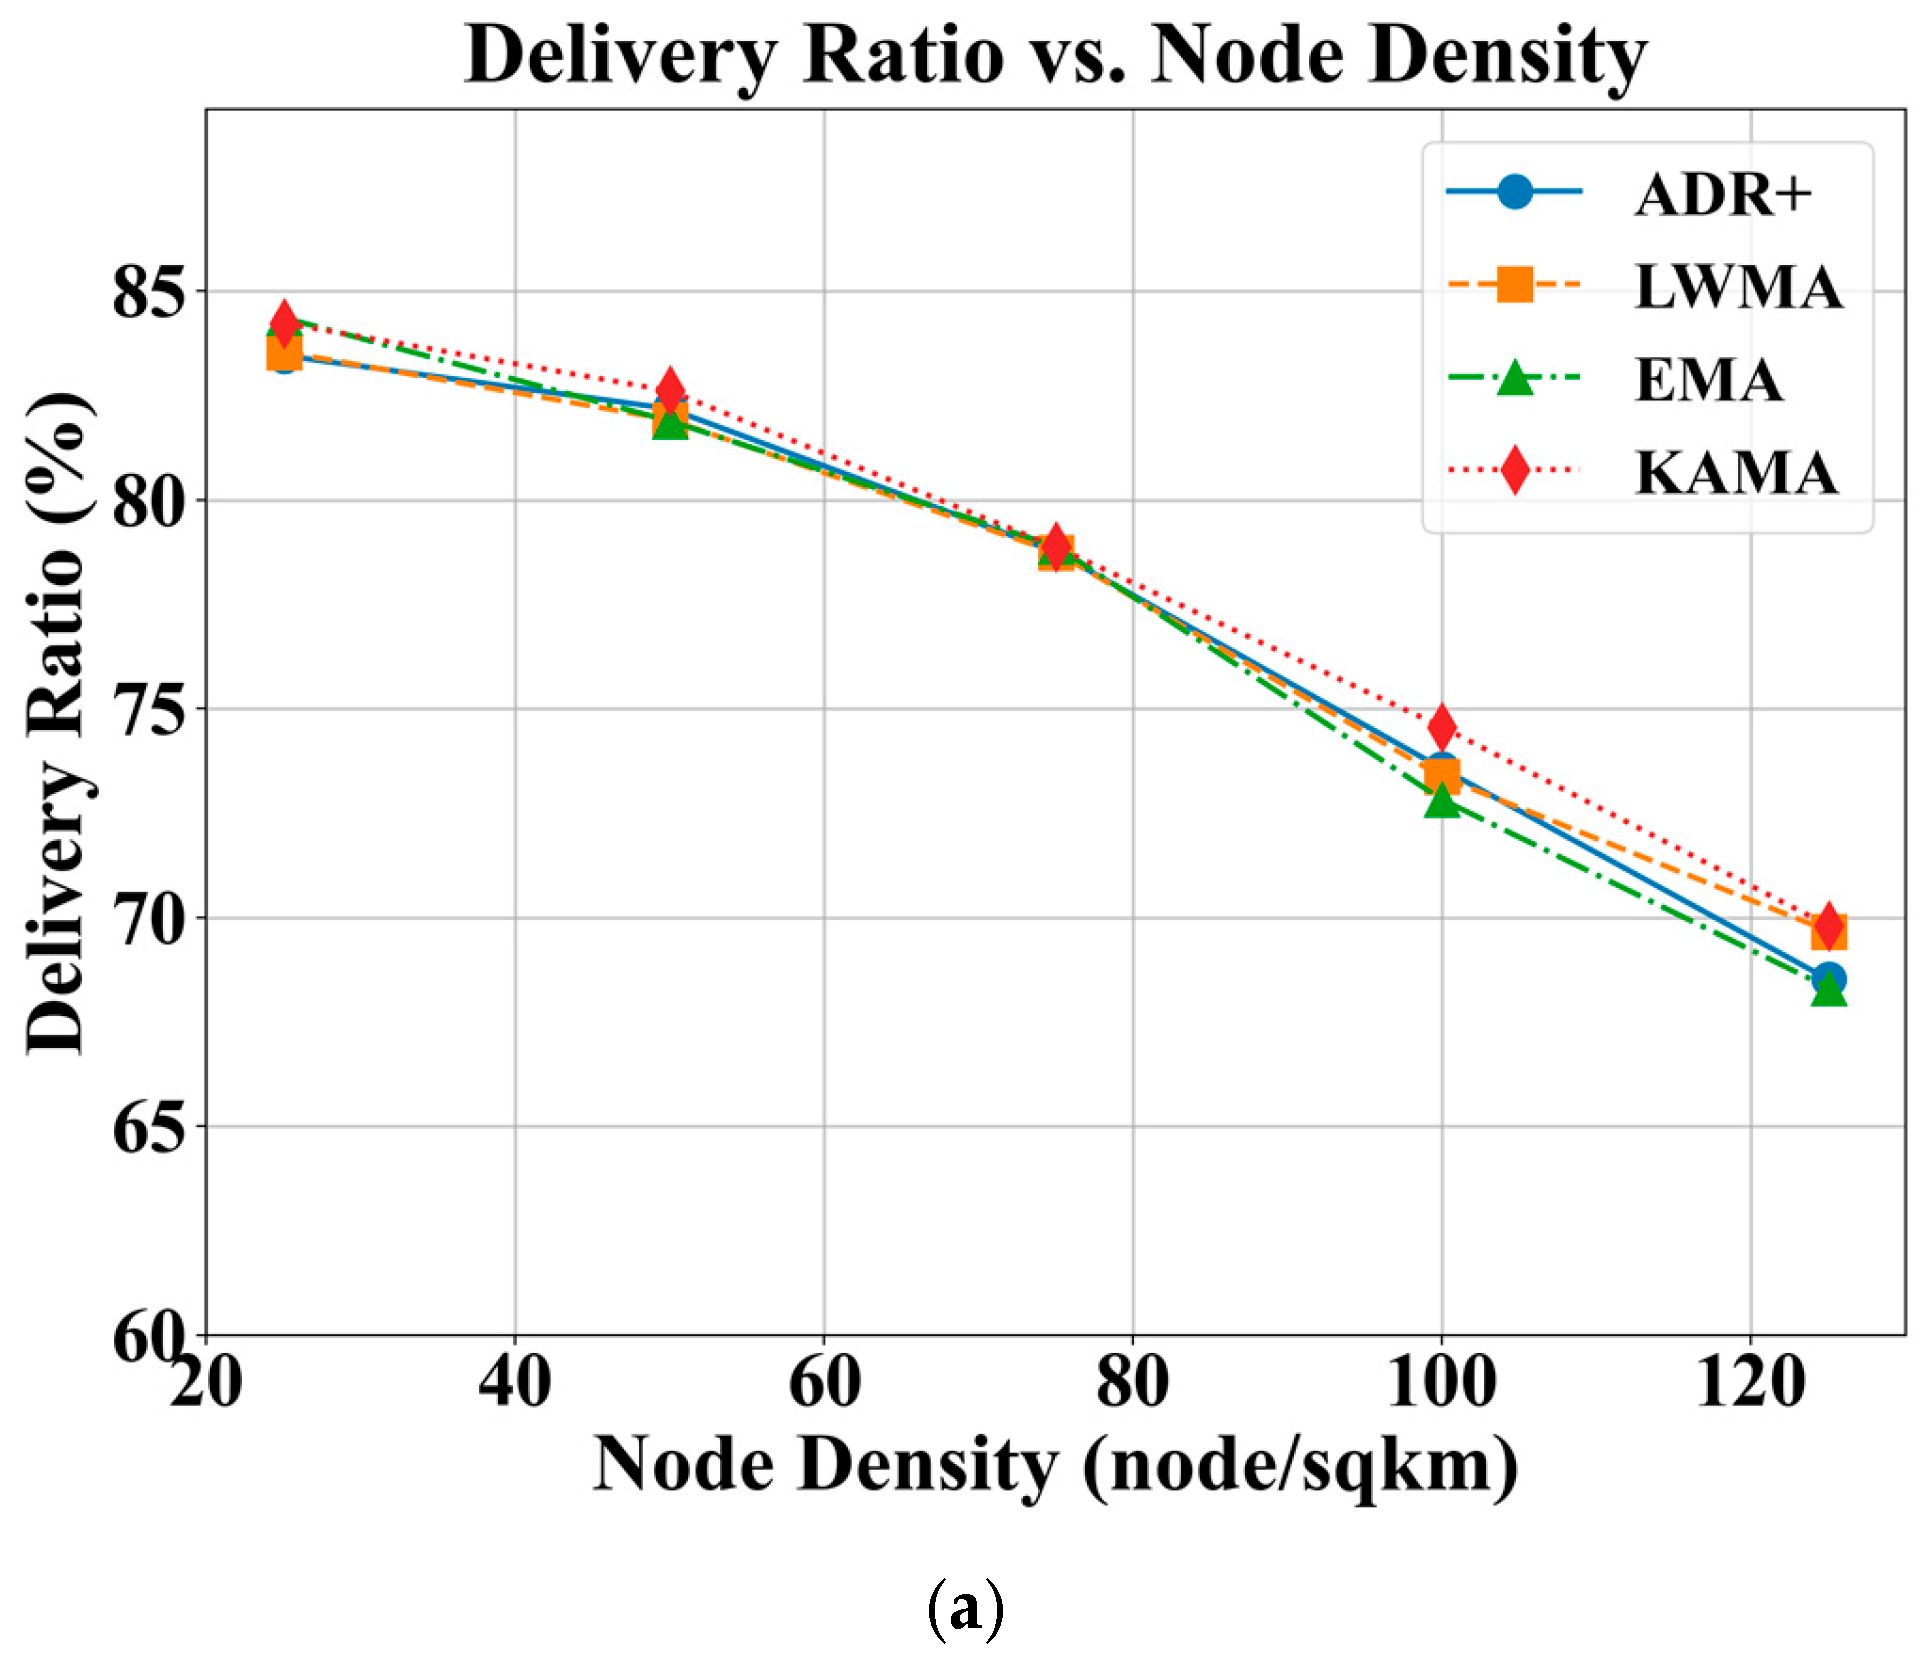
As depicted in
Figure 4, all ADR algorithms achieve DRs exceeding 80% at lower node densities. Generally, a reduction in DR by approximately 15% is observed as the node density increases from 25 to 125, which corresponds to an average reduction of 0.15% per additional node per km
2. The rate of DR reduction becomes more significant at higher node densities for all algorithms. The trend is expected due to higher node densities leading to increased contention and collisions, compounded by a 1% duty cycle constraint. A comparison of the algorithms reveals that KAMA, followed by LWMA, consistently provides a better DR compared to the conventional ADR+ and EMA. The observation is most notable at higher densities, where KAMA achieves a DR that is approximately 2% higher than ADR+ and EMA. Consequently, KAMA is a more suitable choice for large-scale, high-density network deployments.
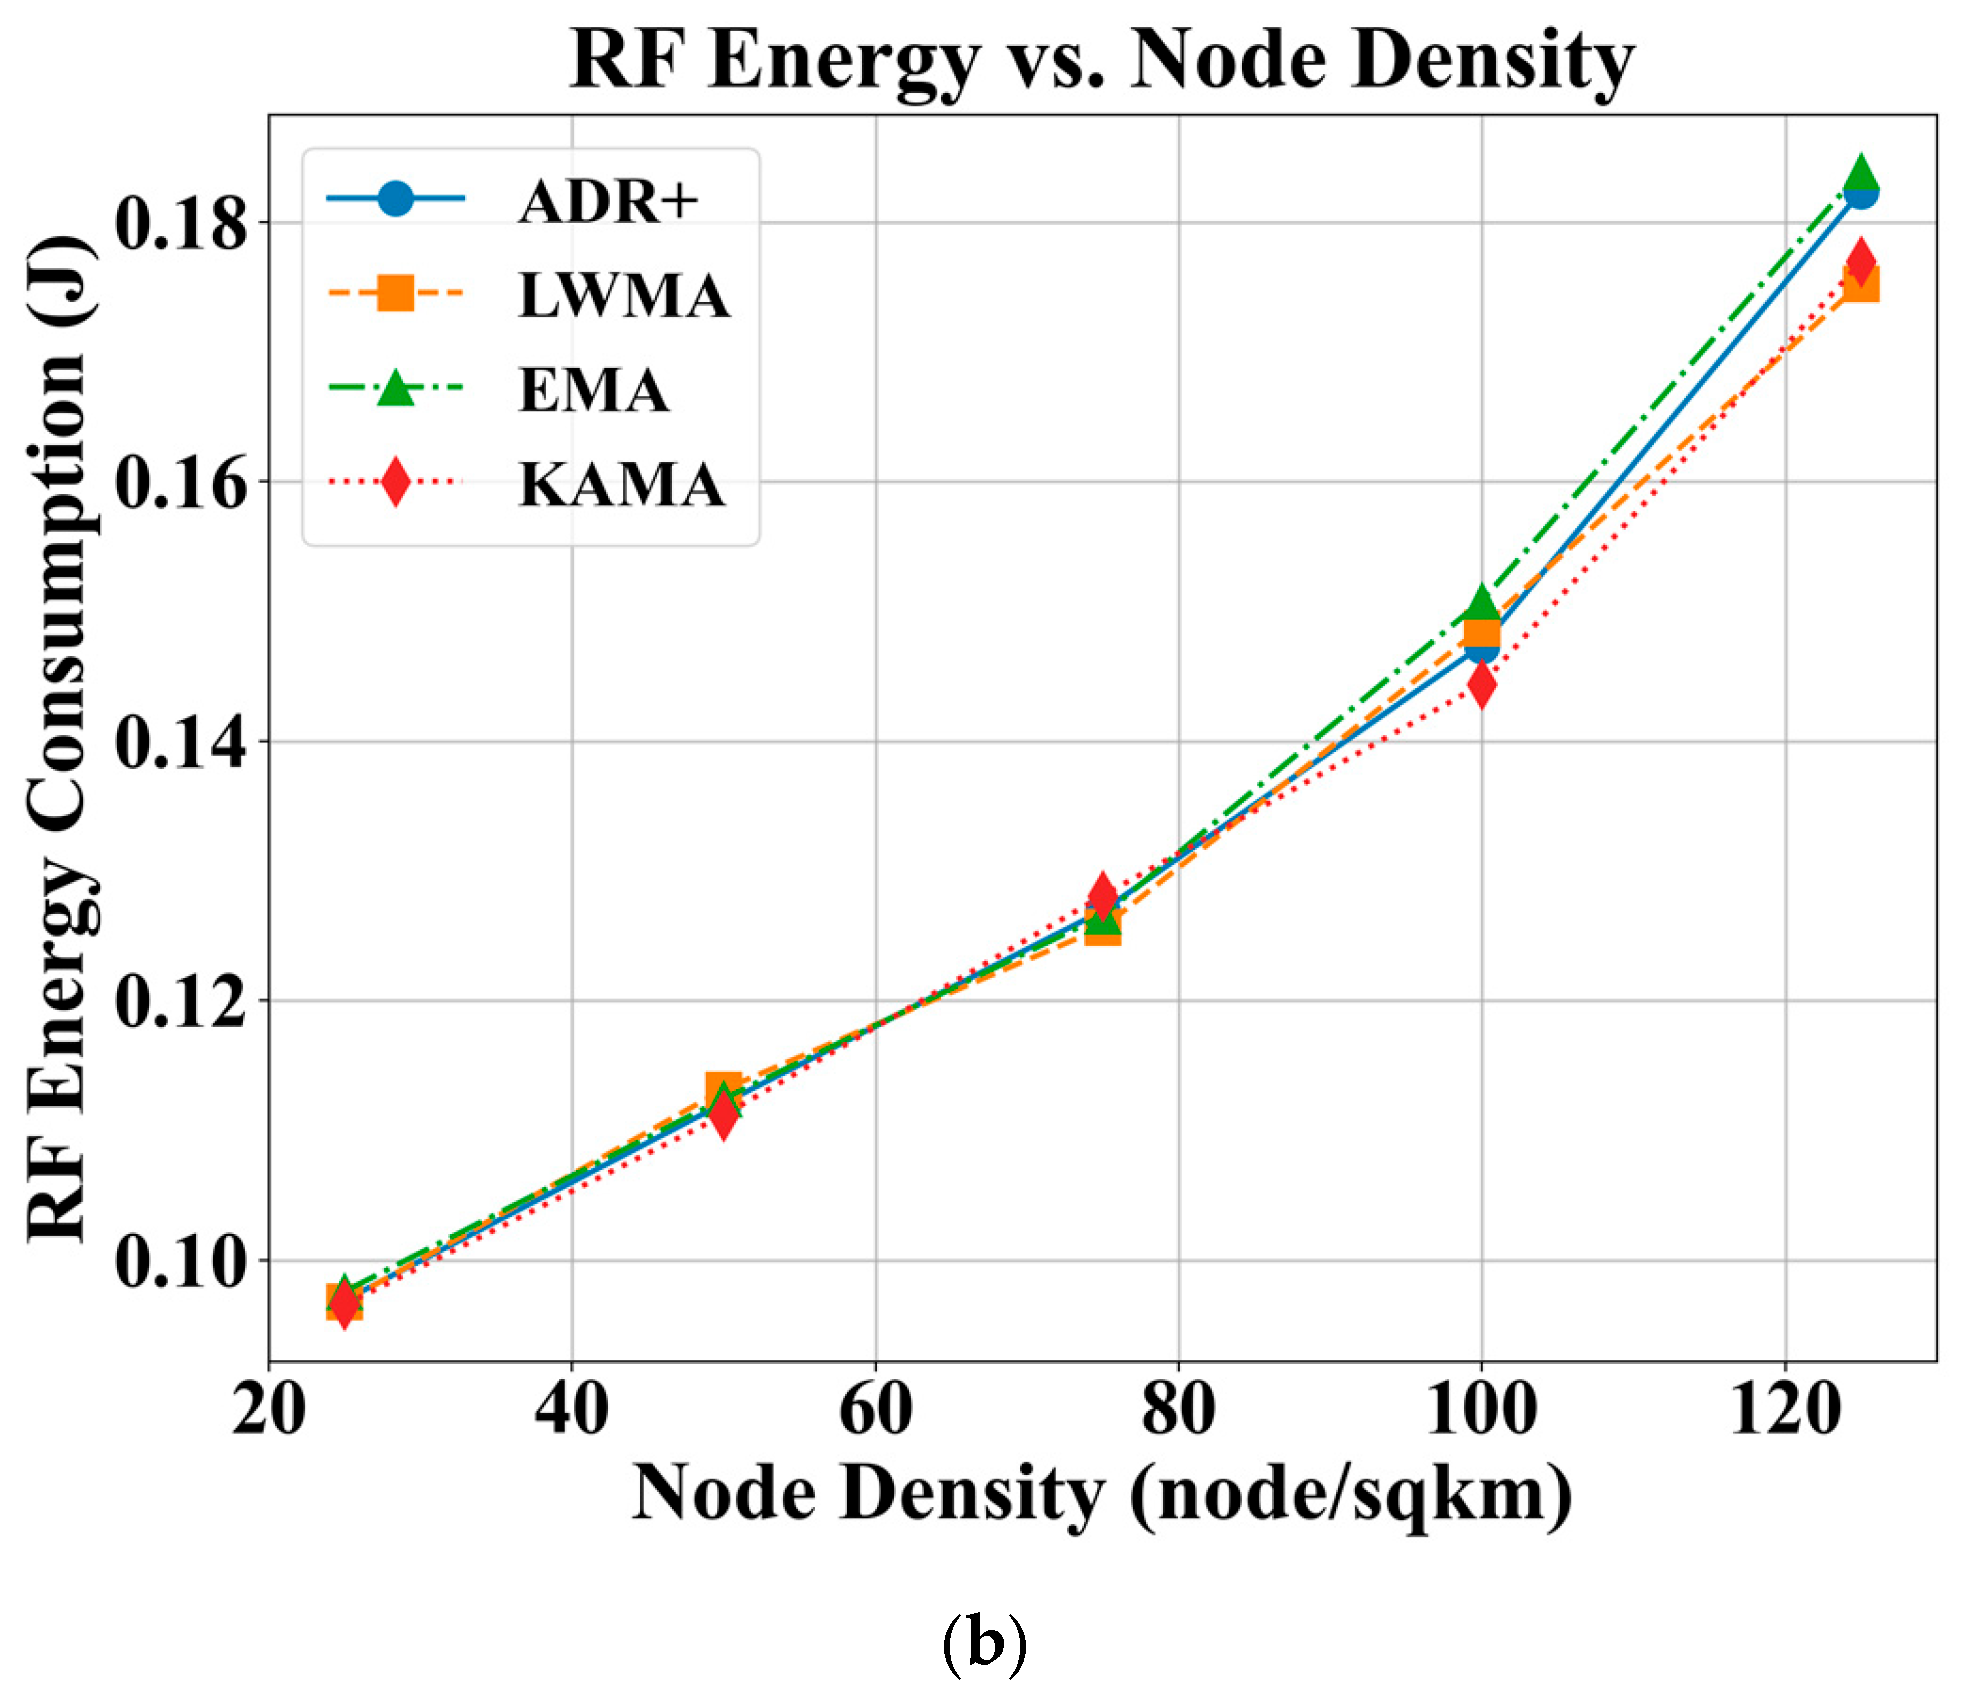
An increase in RFEC is observed across all algorithms as the node density increases, with the effect becoming more pronounced at higher densities, particularly between 100 and 125 nodes per km2. This trend is primarily attributed to a higher rate of sensor update failures, which lead to increased energy waste due to unsuccessful transmissions. On average, the addition of 100 nodes per km2 results in an increase of approximately 80 mJ in RFEC per successful sensor update, which corresponds to an increase of 0.8 mJ per successful sensor update when a new node is added to the network. Among the evaluated algorithms, KAMA consistently demonstrates better energy efficiency, particularly in high-density scenarios, achieving approximately 6–7 mJ lower energy consumption per successful update compared to ADR+ and EMA.
SF Distribution for KAMA
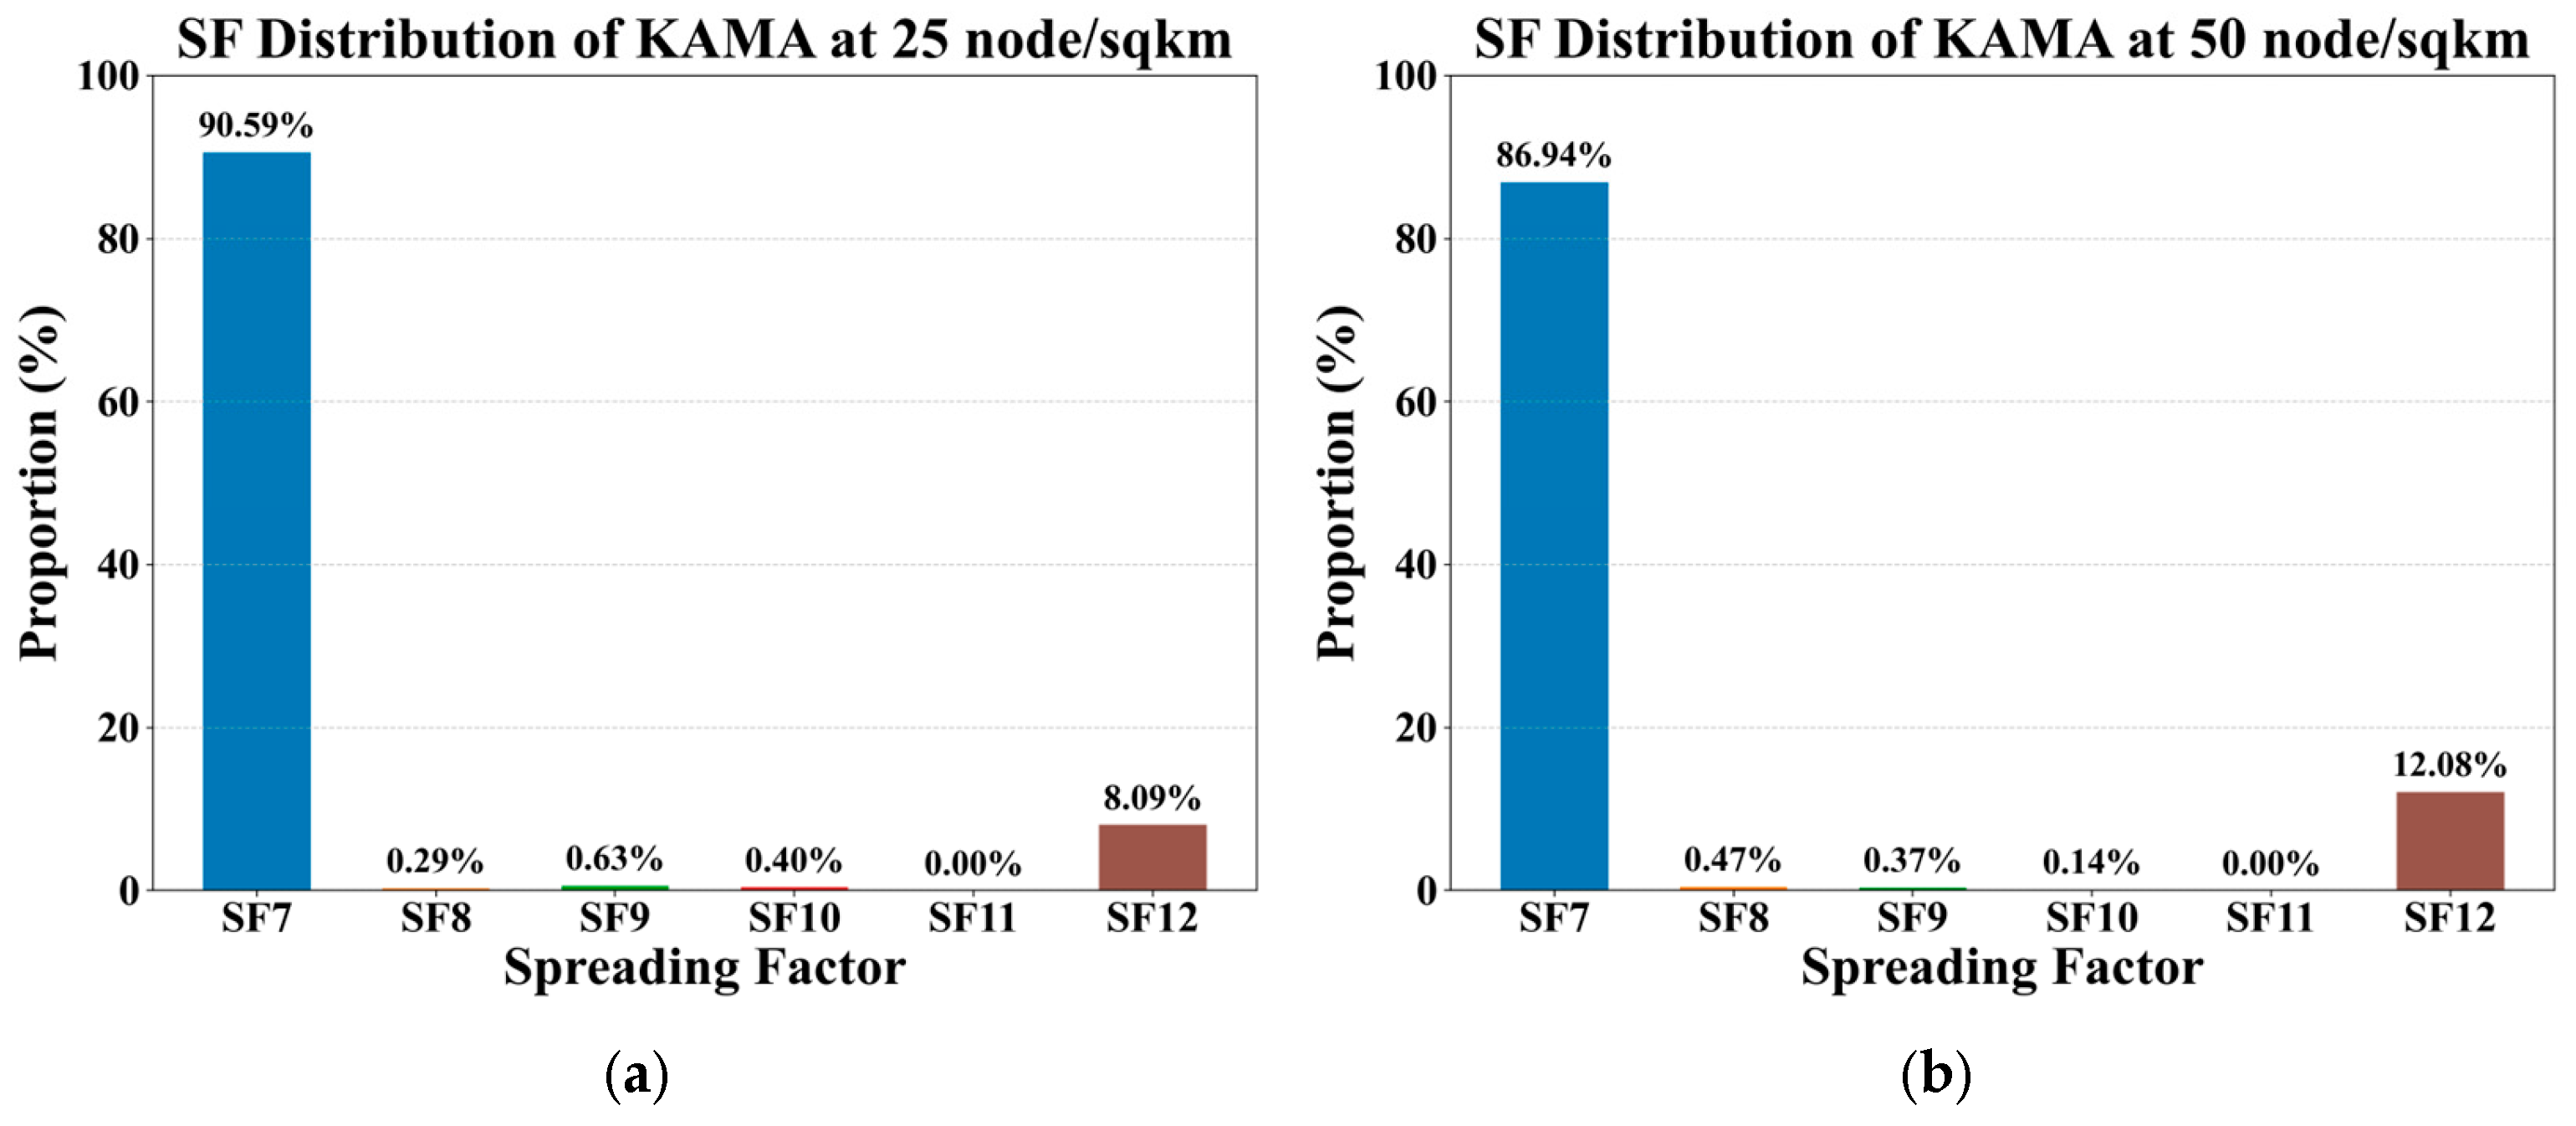
The SF distribution of KAMA algorithm across five node densities is illustrated in
Figure 5. Across all node densities, an SF of 7 is the most utilized, followed by an SF of 12, with an SF of 11 being the least common. This is likely attributable to the relatively short distances in high-density deployments, which allows the majority of packets to successfully reach their destination using an SF of 7. As the node density increases, a corresponding decrease in the proportion of SFs with a value of 7 is observed, while the usage of other spreading factors rises. This trend suggests that the increased variation in distances between the gateway and individual nodes at higher densities requires a more diverse allocation of spreading factors to maintain robust connectivity. While this analysis only highlights KAMA, other ADR algorithms demonstrate a similar overall trend, with an SF of 7 dominating the distribution. However, KAMA exhibits a slightly higher proportion of SFs with a value of 7, which is attributed to its enhanced ability to measure and respond more accurately to SNR trends.
4.3. Effects of Sensor Measurement Update Rate
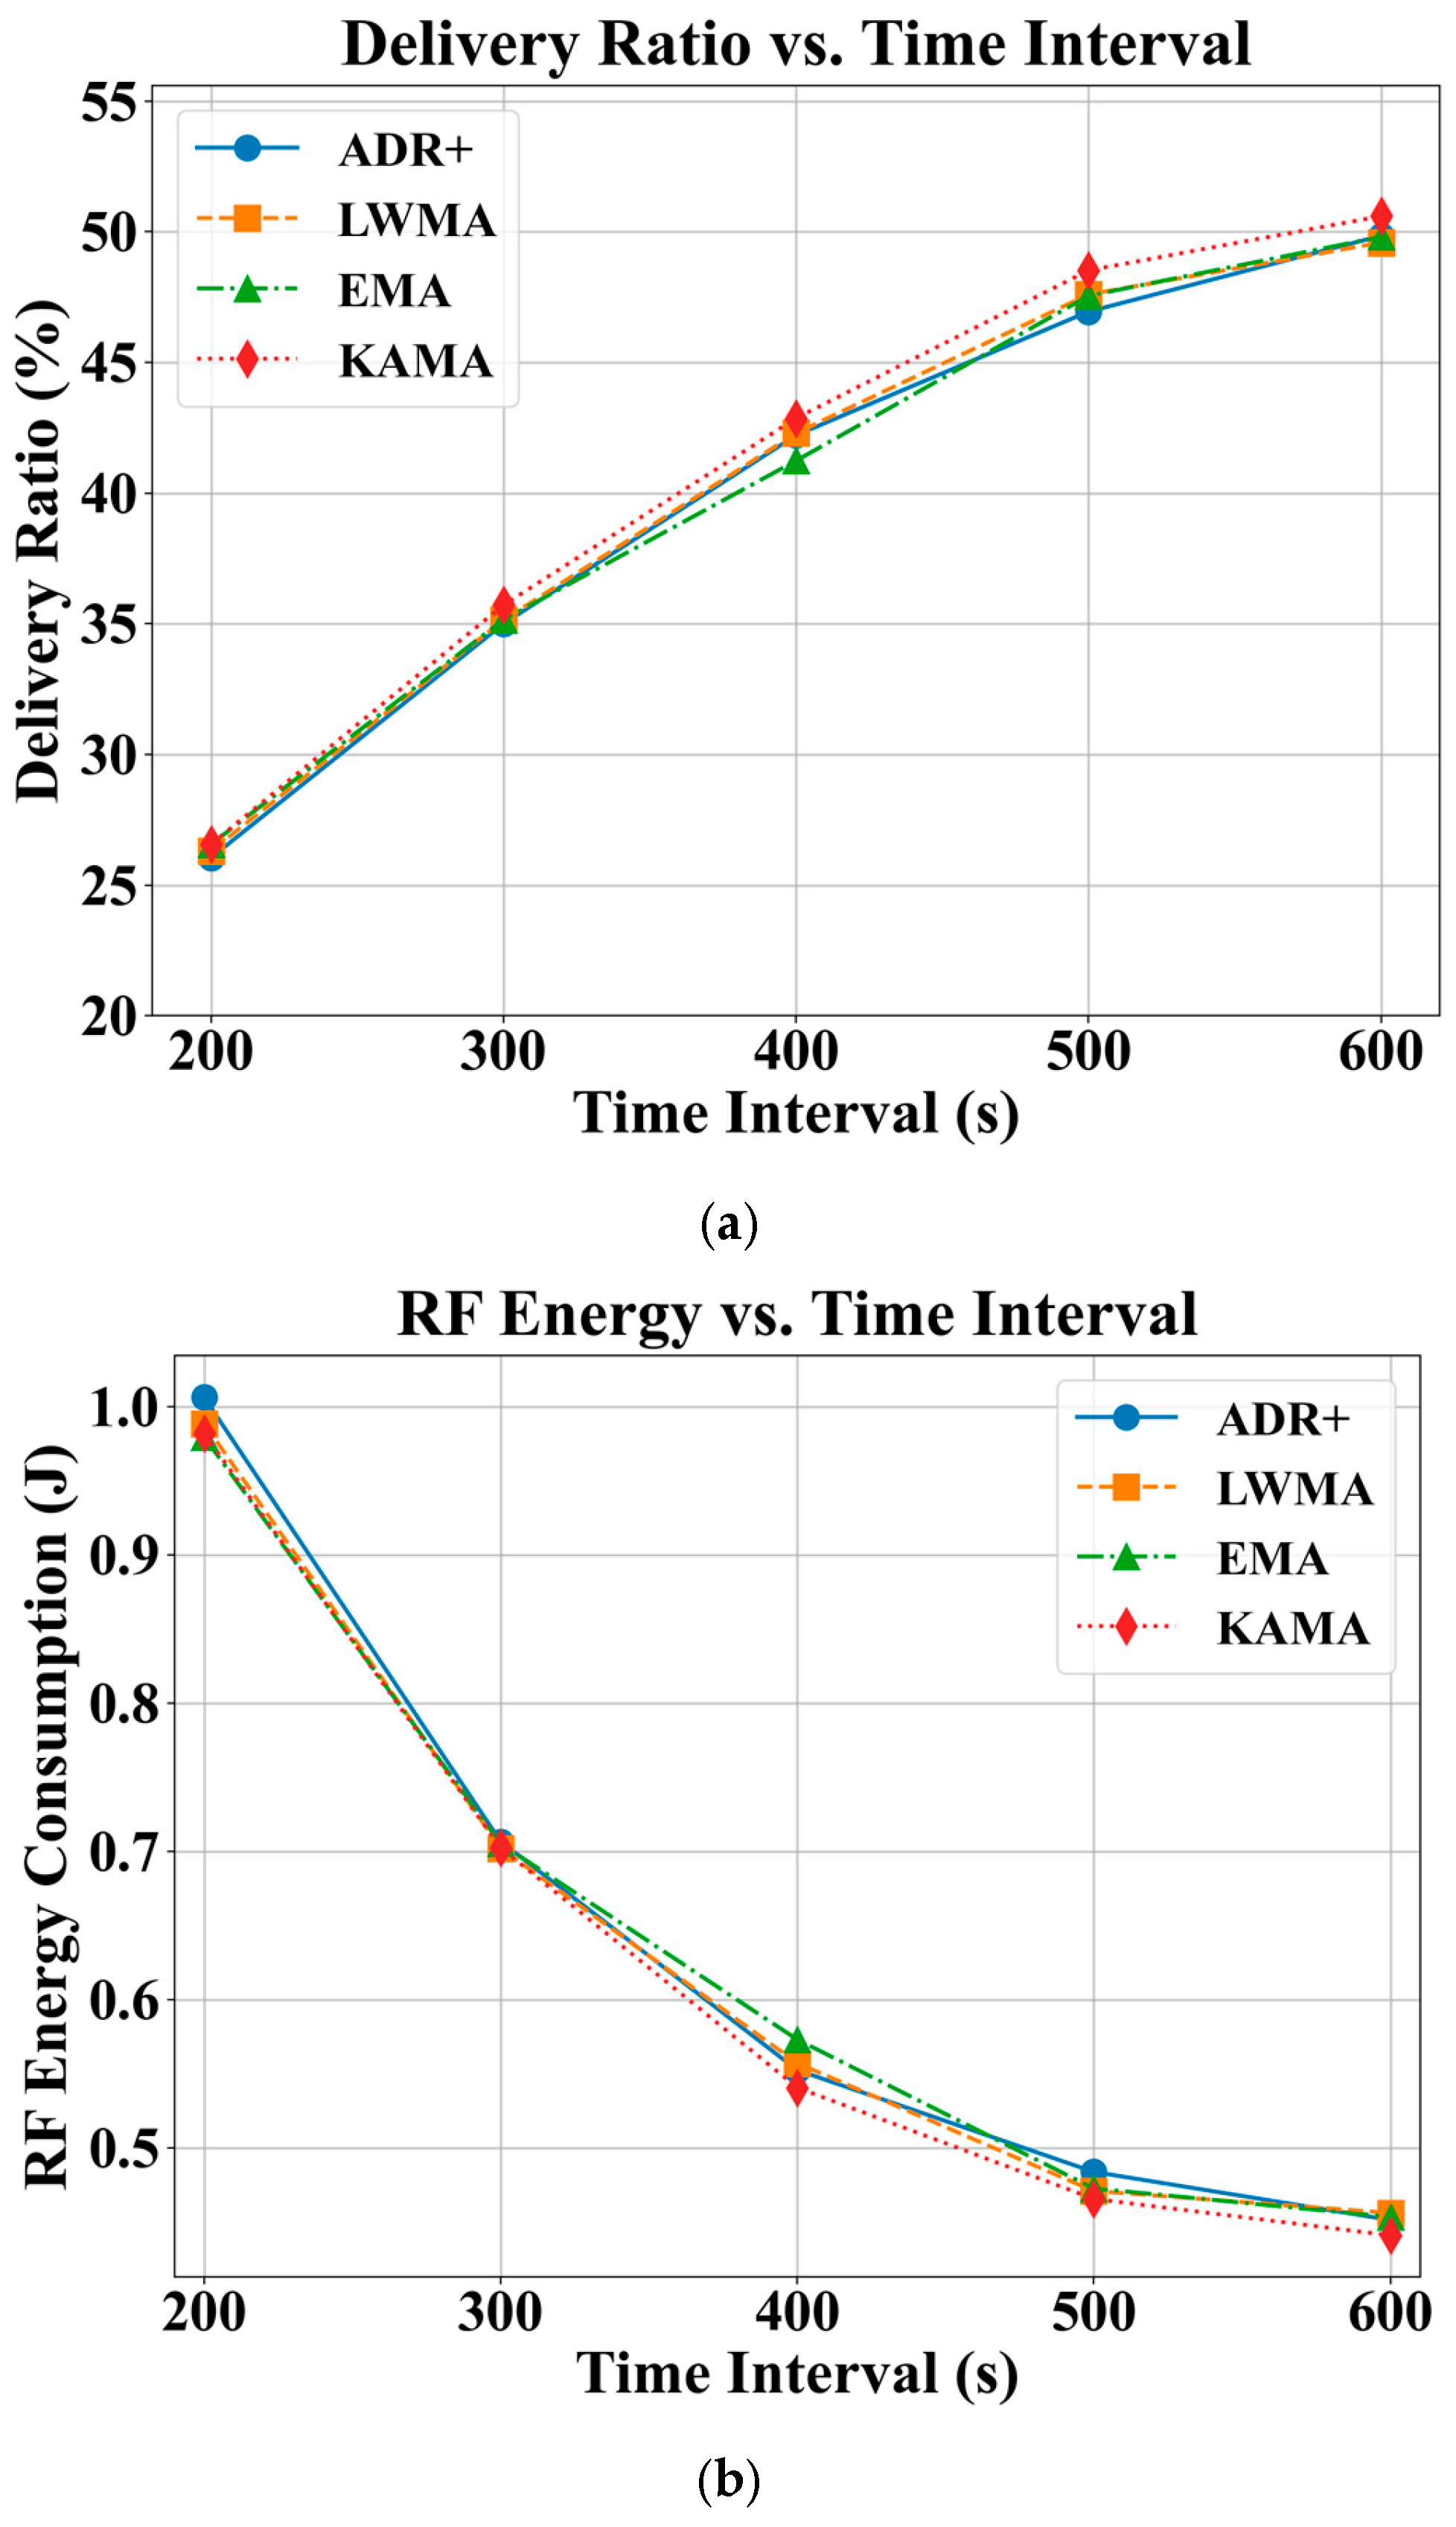
Extending the sensor measurement update interval from 200 s to 600 s resulted in a near-linear improvement in DR across all evaluated algorithms, as shown in
Figure 6a. However, the overall DR remained below 50%, indicating that high-frequency updates in the range of a few hundred seconds are not efficient and are therefore not recommended for high-density deployments. A comparative analysis reveals that KAMA consistently achieves a 1–2% higher DR than the other algorithms. As illustrated in
Figure 6b, sensor updates at a 200 s interval incur an RF energy consumption of approximately 1 J per update, which is considerably high. Notably, increasing the update interval beyond 500 s yields a more than 50% reduction in RFEC. Consistent with its DR performance, KAMA also demonstrates better energy efficiency, with 10–15 mJ lower RFEC compared to the other algorithms.
4.4. Effects of Sensor Measurement Payload Size
To reflect a range of practical use cases, three representative payload levels were simulated: a low load (14 bytes), a medium load (36 bytes, representing five types of unencoded 4-byte sensor measurements, as detailed in
Section 3.4.2), and a maximum load (59 bytes). Although the payload was not varied dynamically to avoid additional complexity, this fixed-load approach provides valuable insights into network performance boundaries under different payload conditions.
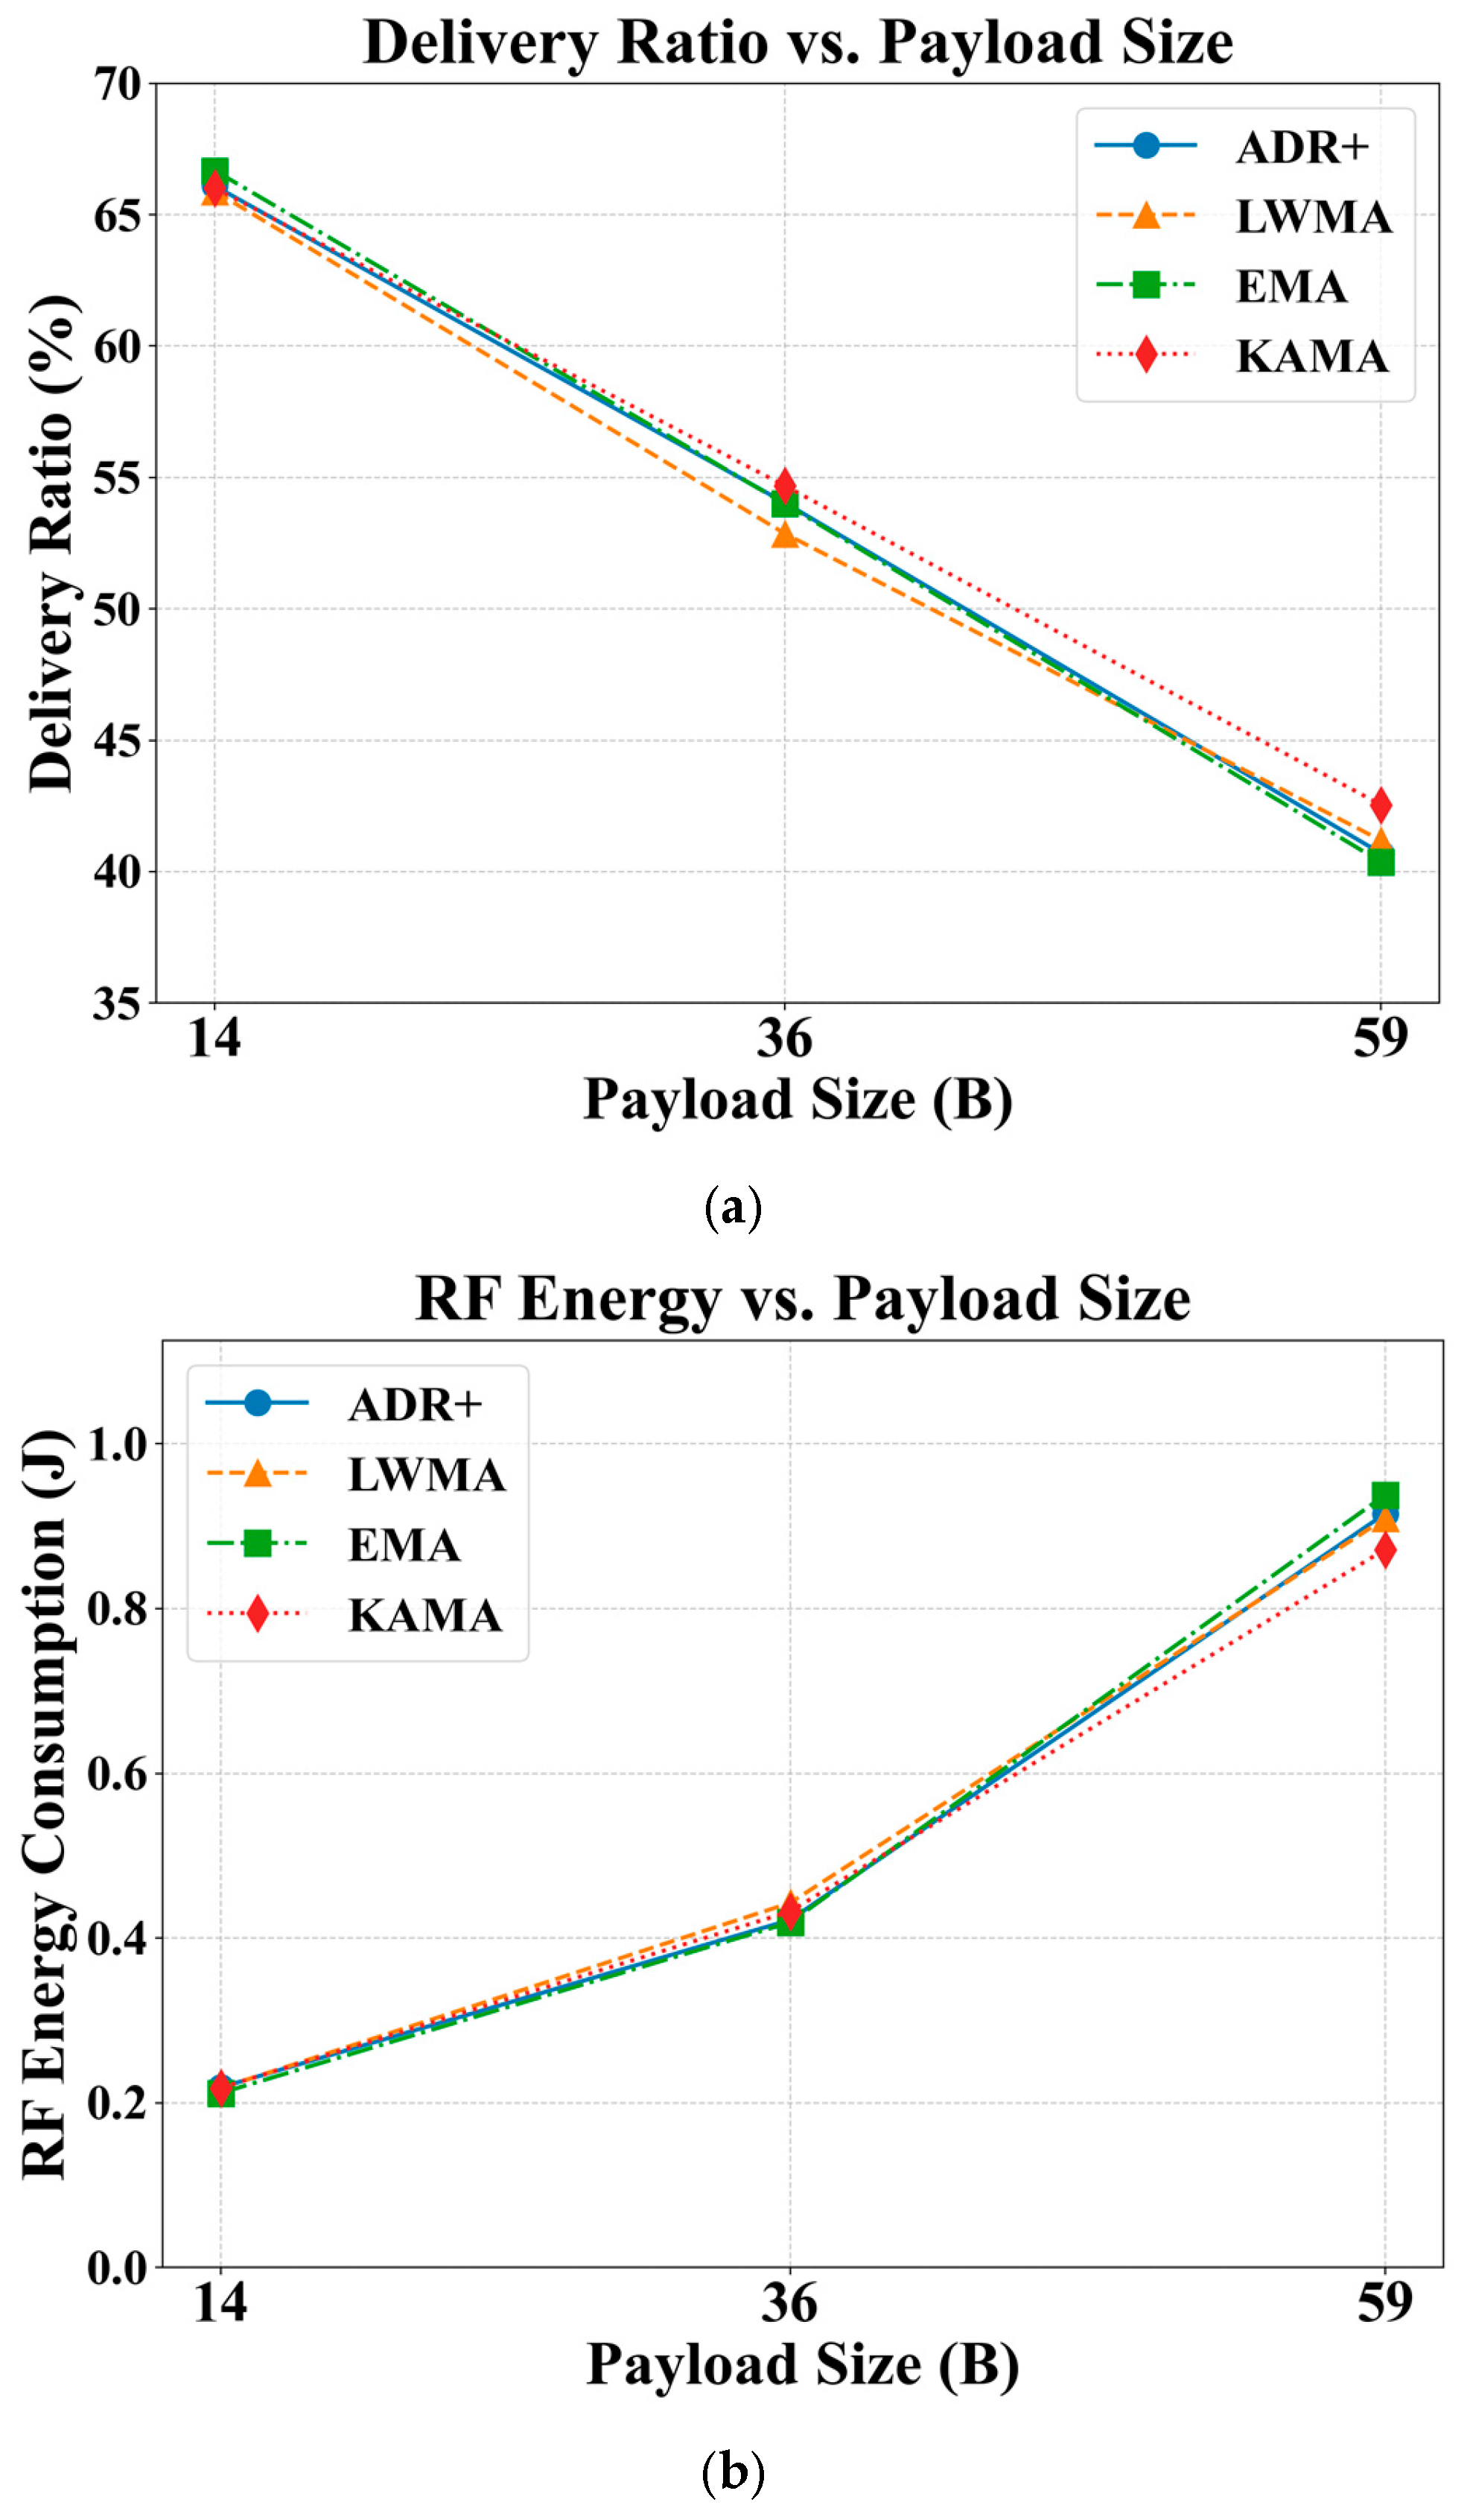
As depicted in
Figure 7, the payload size has a significant effect on both the DR and RFEC. Even with only 14 bytes of payload, the DR is only around 65%. A near-linear decrease in DR of approximately 25% is observed as the payload size increases from 14 to 59 bytes, representing a 2.24% reduction in DR of approximately 0.56% per byte. When translated to typical uncoded sensor measurements, this represents a 2.24% drop in DR when a sensor measurement is added. A comparative analysis across the algorithms shows that KAMA generally offers higher DR, with an improvement of up to 2%.
Figure 7b shows that the RFEC increases with payload size, with this effect becoming more pronounced at higher payloads. Specifically, a consumption of approximately 10 mJ per byte is observed when the payload increases from 14 to 36 bytes, while this rises to approximately 20 mJ per byte for the increase from 36 to 59 bytes. Comparatively, KAMA consistently offers a better RFEC, achieving a reduction in energy consumption of between 40 and 70 mJ as the payload increases from 14 to 59 bytes. Although the findings generally indicate that the payload size has significant adverse effects on both the DR and RFEC, they also demonstrate that KAMA remains a promising algorithm across a wide range of payload conditions.
5. Conclusions and Future Work
This paper has examined the key requirements for effective continuous GHG monitoring from the perspective of LoRaWAN communication technology. A comprehensive evaluation of LoRaWAN’s sensor measurement update capacity was conducted, focusing on the influence of varying sensor update rates and data payload sizes. A simulation-based study was carried out to assess the effects of the node density, update frequency, and payload size on two critical performance metrics: DR and RFEC per successful sensor update. The findings indicate that all three parameters significantly affect both the reliability and energy efficiency. In particular, high-frequency updates in the order of several hundred seconds lead to substantial degradation in DR and are therefore not recommended for high-density deployments. Among the evaluated adaptive data rate strategies, the ADR-NODE-KAMA algorithm consistently demonstrated better performance across a wide range of operating conditions, offering improved delivery reliability and reduced energy consumption.
To better reflect real-world deployment scenarios, future work should investigate non-uniform or adaptive-node-density configurations that capture the spatial variability that is commonly observed in urban environments. From a sensor deployment logistics perspective, mixed-use settings, such as industrial and residential zones, can significantly influence node placement strategies and affect the spatial distribution of sensing nodes, particularly in large-scale urban or semi-rural GHG monitoring applications. Network maintenance costs also need to be considered, as they are influenced by routine requirements such as battery replacement and node/gateway maintenance, including firmware updates, all of which become increasingly significant as the node density grows. Moreover, continuous and high-temporal-resolution GHG monitoring generates substantial volumes of data and may require edge preprocessing and scalable cloud-based analytics pipelines to support decision-making. These highlight the need for future work to incorporate system-level cost modelling and data management frameworks to ensure end-to-end deployment viability.
In addition, the current simulation framework should be extended to include multi-gateway deployments, enabling the investigation of inter-gateway coordination, overlapping coverage, and gateway density on network scalability and reliability. Moreover, hybrid ADR schemes that combine the strengths of multiple ADR strategies could be developed to adapt more flexibly to varying network conditions. Advanced machine learning-based techniques such as XGBoost, Naïve Bayes, and k-NN [
26] can be used to optimize TP and/or SF via classification. Time series models such as LSTM can be used to learn temporal patterns, i.e., predicting sensor measurements in order to decide whether to transmit.
In terms of energy costs, future work should incorporate a more comprehensive node-level energy model that accounts for the effects of sampling intervals, sensor preheating, and measurement energy across different sensor subsystems, such as electrochemical and optical gas sensors. To improve statistical rigour, significance tests such as t-tests or ANOVA should also be employed to further validate the performance differences among ADR algorithms.
