1. Introduction
Amid the accelerating shift toward a decarbonized energy landscape, photovoltaic (PV) arrays have become indispensable pillars of sustainable development and strategic levers for achieving carbon neutrality, renowned for their carbon-free and renewable attributes [
1]. However, as these modules proliferate across deserts, plateaus, and snow belts, they face exposure to extreme climates and topographically complex sites, jeopardizing their long-term reliability [
2]. External contaminants such as avian excreta, mineral dust, and industrial aerosols scatter or absorb incident irradiance, eroding optical transmittance and consequently diminishing conversion efficiency [
3,
4]. Concurrently, latent internal anomalies like hotspot clusters and micro-crack networks reduce active cell area, intensify resistive heating, and heighten the probability of catastrophic thermal runaway [
5,
6]. Seasonal snow further compounds these losses by masking entire panels, curtailing photon capture and precipitating steep declines in electricity yield [
7,
8,
9]. Therefore, confronting these interrelated degradation pathways demands an integrated diagnostic strategy capable of concurrently sensing surface soiling, internal impairment, and snow occlusion. Such a unified monitoring framework is essential to safeguard PV performance, extend asset lifetimes, and maximize energy harvest across diverse operating environments.
Traditional fault detection in PV modules primarily relies on human inspection and basic image analysis techniques. Such methods are characterized by low efficiency, a strong dependence on human experience, and difficulties in scaling up to meet the operational and maintenance requirements of large-scale PV systems [
10,
11]. Amidst the swift advancement of artificial intelligence and visual analytics, intelligent detection methods leveraging visual pattern recognition have progressively established themselves as a significant research focus and have been broadly implemented within the domain of PV anomaly detection. Within the context of stain detection, numerous studies have been dedicated to refining model architectures to enhance detection efficacy and streamline model parameters. A case in point is the research by Liu et al. [
12], who devised an object detection framework centered around deep neural networks that integrates transfer learning, convolutional attention modules, and deformable detection transformers. This model has increased the detection accuracy of small target stains, such as leaves and bird droppings, by 6.6%, but exhibited limitations such as low frame rate (FPS) and high latency. Umair Naeem et al. [
13] developed a customized model that integrates a convolutional block attention module and two specialized detection heads optimized for dust and bird droppings. This model achieved a significant improvement in mean average precision at 50% intersection over union (mAP@50) for bird droppings and dust by 40.2%, while reducing the number of parameters by 24%. Gao et al. [
14] developed a segmentation technique based on multi-channel fusion, which accurately identifies bird droppings on the surface of photovoltaic modules and embeds the segmentation results into the input feature space to augment the performance of traditional mask region convolutional neural networks (R-CNN). This approach achieved an increase of 5.9% in mean average precision (mAP) for object detection.
Recent efforts toward internal defect localization have pursued architectural ingenuity and learning strategy refinement. Wang et al. [
15] embedded a channel-offset transformation (COT) self-attention unit and redesigned the spatial pyramid pooling and cross stage partial channel (SPPCSPC) backbone of YOLOv7, boosting small-target sensitivity in cluttered scenes with a detection accuracy of 98.08%. Feng et al. [
16] introduced a reversible column bottleneck and an efficient multi-scale attention (EMA) mechanism, maintaining prediction fidelity while reducing model complexity. Han et al. [
17] grafted lightweight group shuffle convolution (GSConv) layers and a multi-level feature selective fusion (MLFSF) component into a real-time detection transformer (RT-DETR), achieving a 3.9% accuracy gain alongside an 11.83% parameter reduction. Kang et al. [
18] leveraged weak supervision to train a CNN for PV cell inspection, alleviating annotation burdens and enhancing simultaneous detection and classification of diverse defect morphologies.
In snow-related diagnostics, Baldus-Juersen et al. [
19] devised image analytic routines that quantify snow cover on PV arrays and couple them with energy loss models, attaining 90% detection precision. Mari B. Øgaard et al. [
8] extracted snow specific sig-natures from PV data, enhancing snowfall models, and correctly identifying 97% of recorded snow events. Collectively, these studies advance accuracy, throughput, or model compactness for stains, defects, and snow. However, despite significant progress in individual anomaly detection, current methodologies predominantly address specific types of anomalies in isolation, neglecting the need for a unified framework capable of simultaneously addressing multiple anomalies. This limitation is particularly evident in extensive photovoltaic systems, where diverse anomalies often coexist, thereby necessitating a comprehensive and integrated detection approach.
Among contemporary detection paradigms, the YOLO family has emerged as the de-facto choice for PV fault inspection owing to its fully-convolutional, single-shot formulation that yields end-to-end latency in the millisecond regime and a modest memory footprint [
13,
15,
16]. In contrast, variants of R-CNN, while superior in localization precision [
14,
18], require a two-stage cascade of region proposal and per-region refinement. This results in computational overheads incompatible with edge-grade hardware [
20,
21]. Transformer-based detectors such as real-time detection transformer (RT-DETR) partially alleviate small-object omissions, yet their quadratic attention complexity and large activation maps remain prohibitive for resource-constrained deployments [
12,
17,
22]. Given these limitations, a key research direction is to enhance the YOLO architecture’s feature extraction capabilities for multiple anomaly types while balancing detection accuracy and computational efficiency.
Currently, utility-scale PV plant inspections typically employ drones equipped with collinear RGB and thermal cameras to capture complementary spectral cues [
23,
24]. In practical applications, snow, stains, and defects are all significant causes of reduced power generation efficiency of PV panels, with defects potentially leading to thermal runaway and causing safety accidents such as fires. These faults often occur simultaneously in PV systems, and different types of faults require different treatment methods and resources. Nevertheless, as evidenced by the aforementioned research findings, existing algorithms focus solely on detecting specific defect types, lacking the capability for integrated detection of multiple types of faults. Therefore, we propose an innovative multi-anomaly detection framework, which integrates the YOLOv11 backbone network with the Mix Structure Block and the Outlook Attention mechanism, named YOLOv11-MO. This approach can process RGB and thermal images in parallel to simultaneously segment stains, internal defects, and snow occlusions, and specifically achieve coupled detection of bird droppings and the hotspots they induce.
The key innovations of this manuscript are summarized as follows:
- (1)
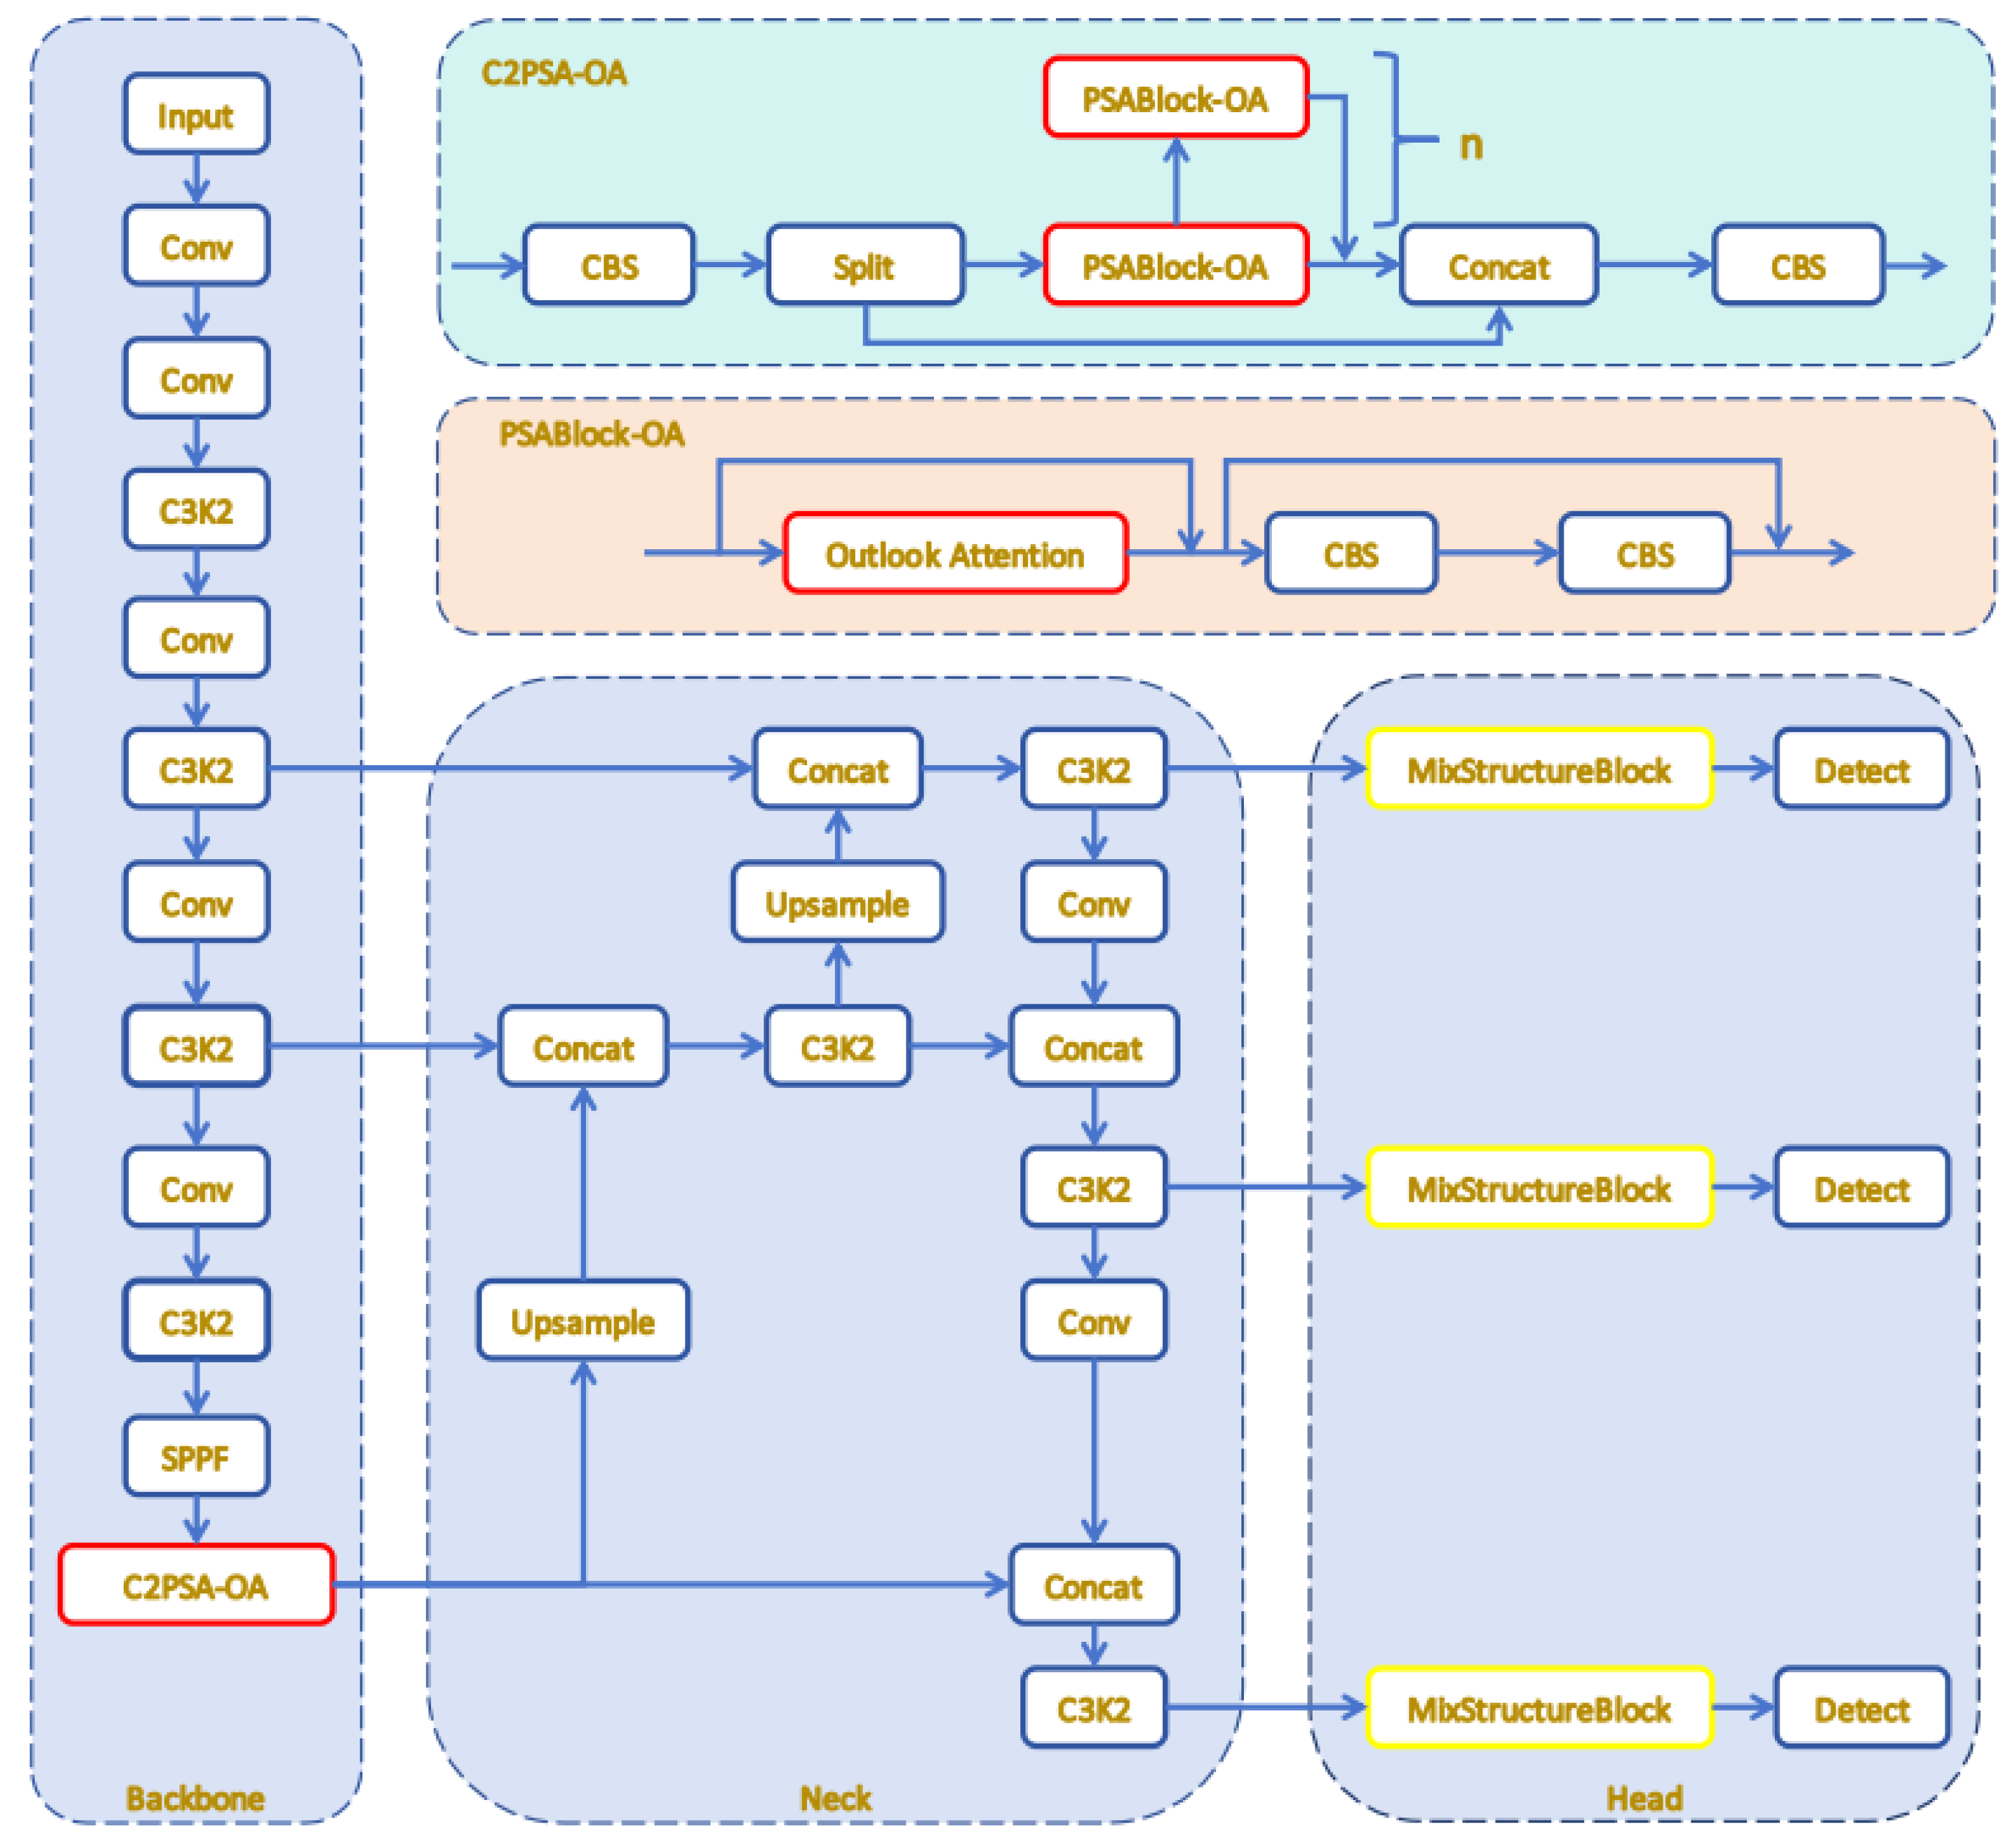
This research meticulously devises an advanced model, YOLOv11-MO, tailored explicitly for photovoltaic multi-fault detection. By incorporating the C2PSA-OutlookAttention (C2PSA-OA) module, it can accurately delineate the contours of micro-defects. Additionally, a mixed structure block (MSB) is embedded between the neck and head of the model, significantly enhancing the detection capability for small and indistinct defects. These optimizations not only markedly improve the model’s detection accuracy and robustness but also adeptly balance detection precision with computational efficiency.
- (2)
A bimodal RGB-thermal imaging dataset comprising 6,128 images captured by UAVs has been constructed, covering a variety of photovoltaic fault types, including stains, internal defects, and snow coverage. To augment data diversity and model generalizability, a suite of data enhancement strategies, including random rotation, translation, and contrast adjustment, has been applied to the images. Moreover, the HSV color space has been utilized to separate luminance from chrominance, thereby effectively enhancing the color features of fault regions and bolstering the model’s adaptability to complex lighting conditions and generalizability across diverse scenarios.
- (3)
YOLOv11-MO has been comprehensively compared with mainstream models, including YOLOv5, YOLOv8, YOLOv10, YOLOv12, and RT-DETR. The experimental results demonstrate that YOLOv11-MO outperforms other models in detection accuracy across all fault categories. Furthermore, the gradient-weighted class activation mapping (Grad-CAM) technique has been employed to visualize the model’s attention distribution, vividly illustrating its ability to precisely focus on fault-prone areas and thereby significantly enhancing the model’s interpretability.
The remainder of this manuscript is organized as follows:
Section 2 provides a detailed exposition of the YOLOv11 detection architecture;
Section 3 delves into the research context and offers a comprehensive description of the proposed model framework;
Section 4 presents the experimental results and analyses, along with comparisons of detection accuracy and model size; and finally,
Section 5 summarizes the manuscript and outlines future research directions.
2. YOLOv11 Detection Framework
Target recognition methodologies have transitioned from traditional two-stage models to streamlined single-stage architectures, with the YOLO framework being a prime example. In the realm of PV fault detection, where swift real-time processing on edge devices is crucial and datasets are often limited, single-stage algorithms offer significant advantages due to their high computational efficiency and minimal risk of overfitting [
25]. Considering these factors, YOLOv11, an advanced object detection framework, has been chosen as the core model for this research. The comparative results detailed in
Section 4.3 illustrate that YOLOv11 demonstrated exceptional performance across the established PV fault detection dataset, surpassing other state-of-the-art algorithms, including YOLOv5 [
26], YOLOv8 [
27], YOLOv10 [
28], YOLOv11 [
25], YOLOv12 [
29], and RT-DETR [
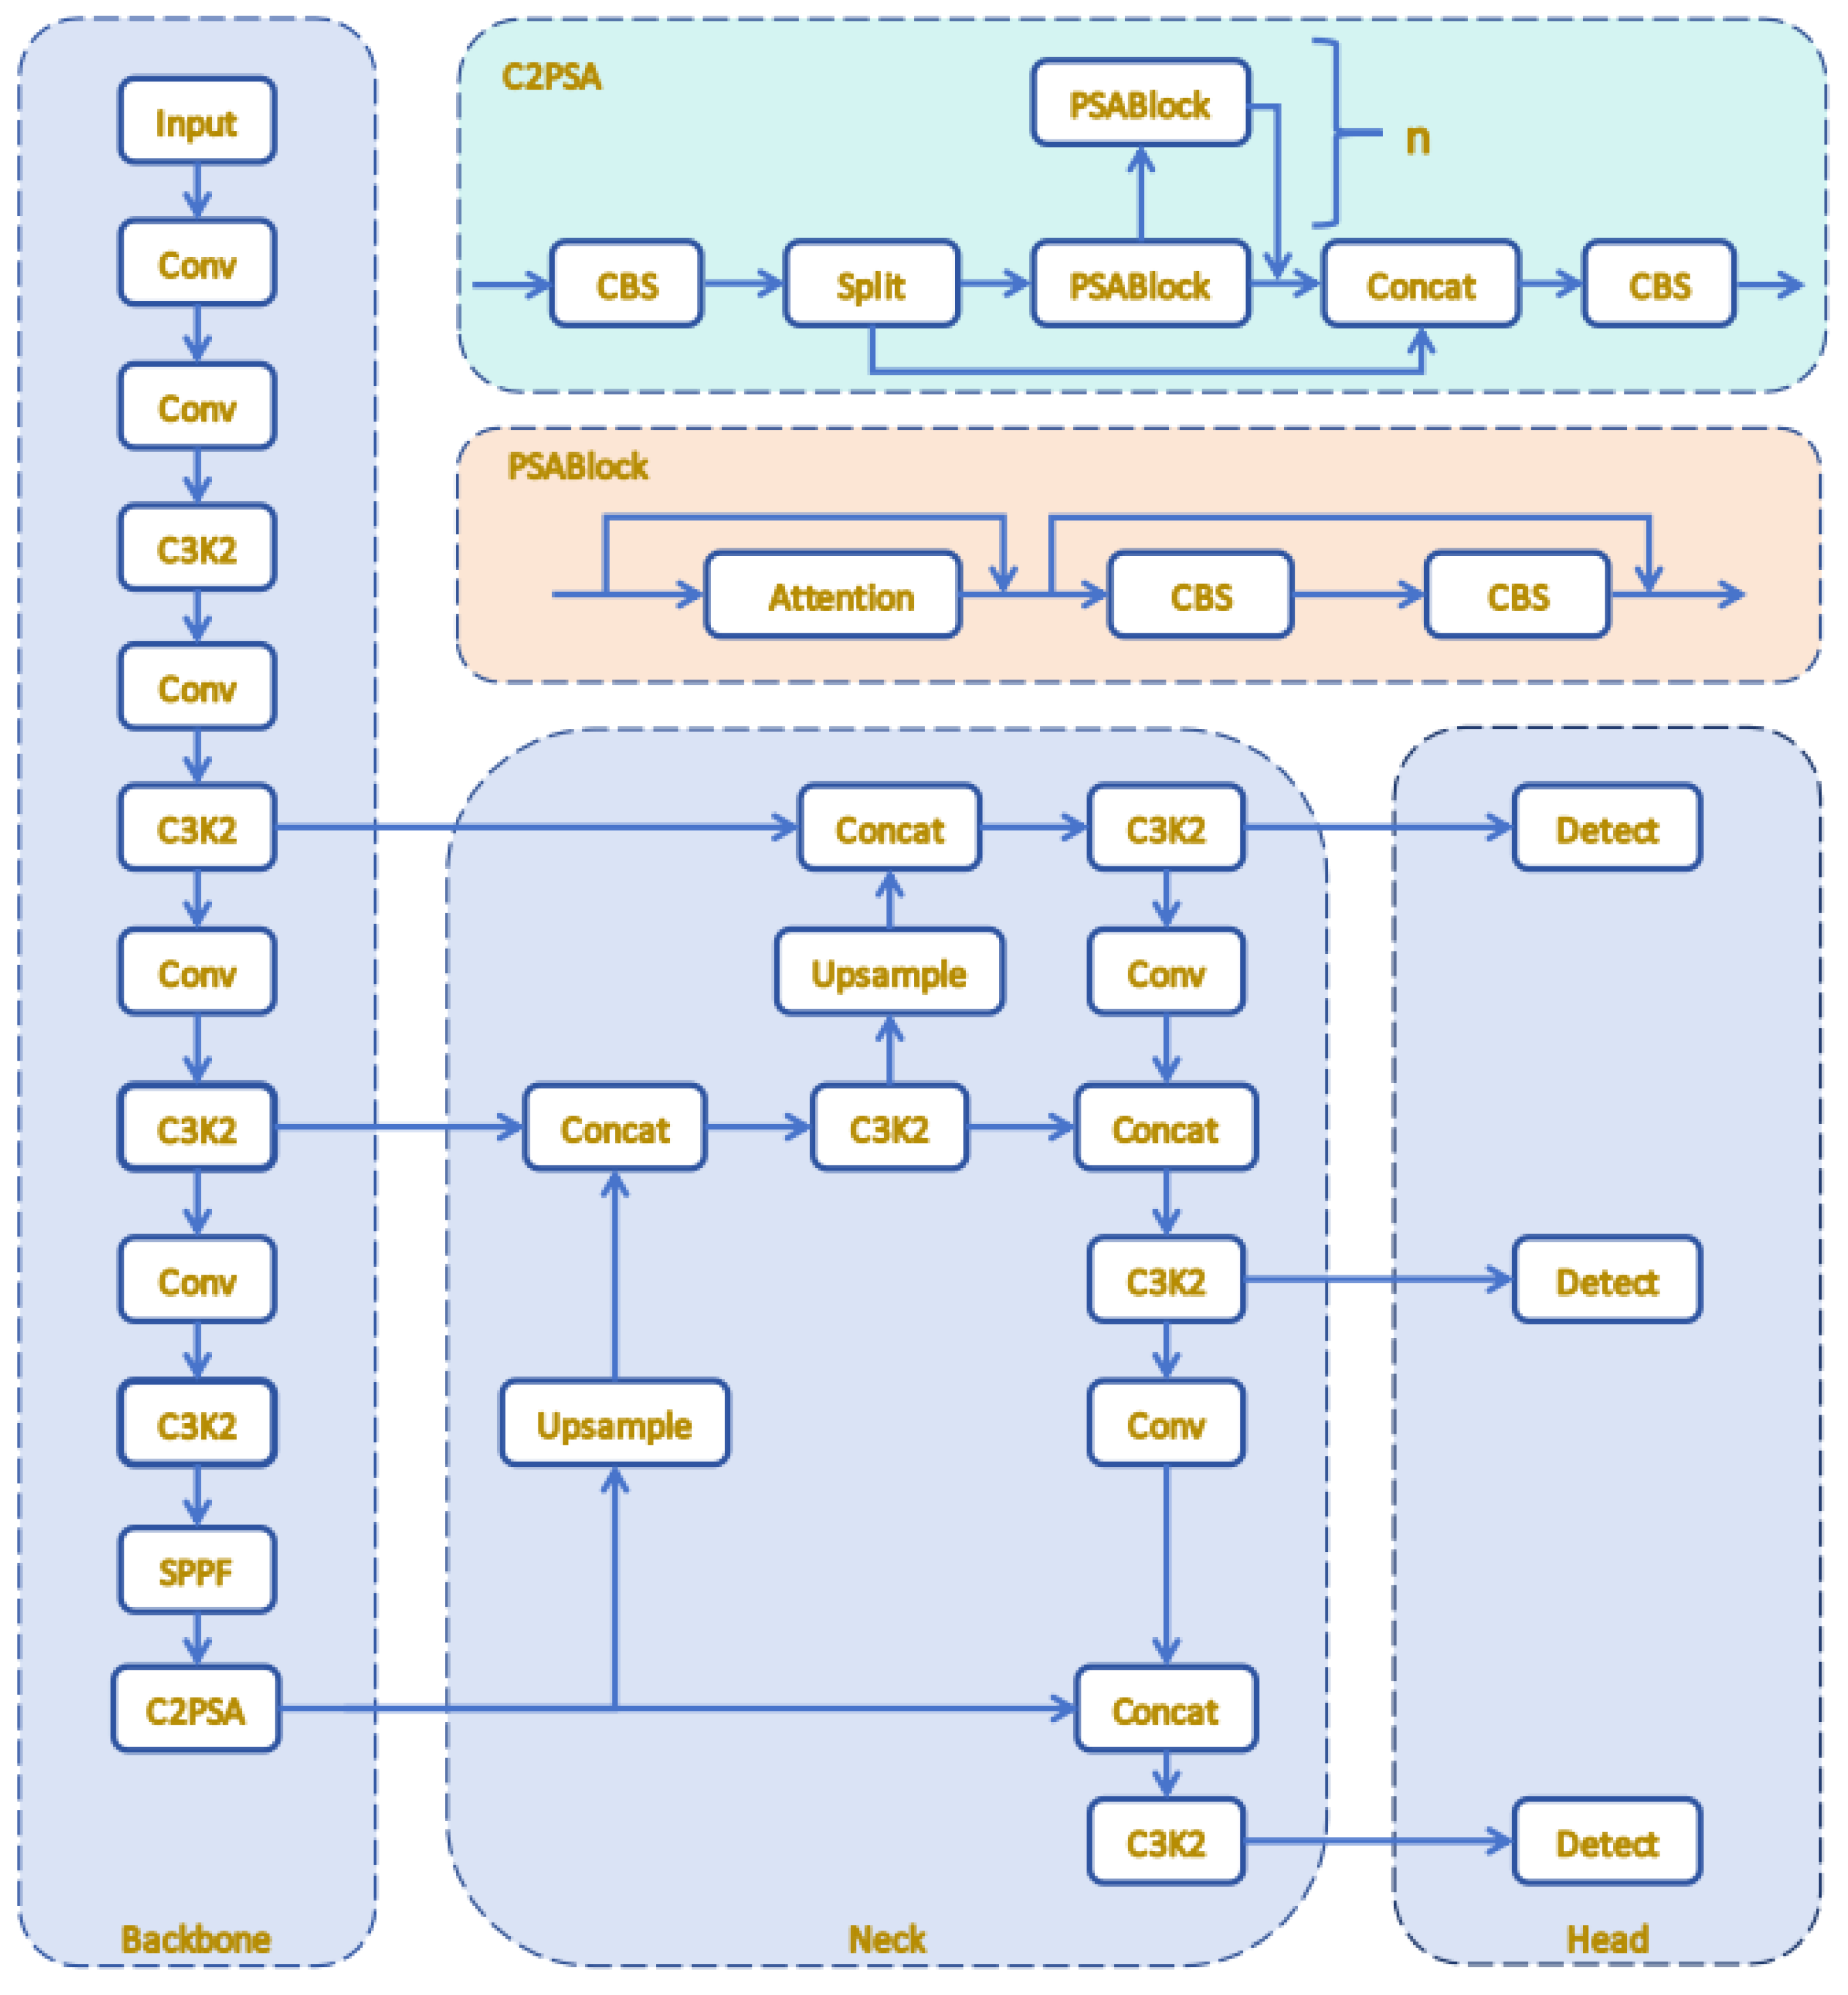
22]. Moreover, YOLOv11 surpassed the latest YOLOv12 in this task. Its advantages lie in the improved dynamic anchor allocation and optimized gradient flow within the C3K2 module, which together enhanced the recall of small, low-contrast defects while maintaining low latency. Compared with previous versions, YOLOv11 continues to utilize its classic three-part architecture, namely the main network, connection module, and detection module. The main network employs C3K2 modules, significantly enhancing feature extraction efficiency through the Bottleneck Block, Spatial Pyramid Pooling Module (SPPF), and C2PSA modules. The connection module is responsible for feature integration and enhancement. The detection module, as the core decision-making unit of YOLOv11, is tasked with generating the final detection results.
Figure 1 presents the holistic architecture of the YOLOv11 detection network. The architecture encompasses a main network for feature extraction, a connection module for feature fusion, and a detection module for object localization and classification. These modules operate in concert to ensure that the network processes input data efficiently and generates accurate detection results.
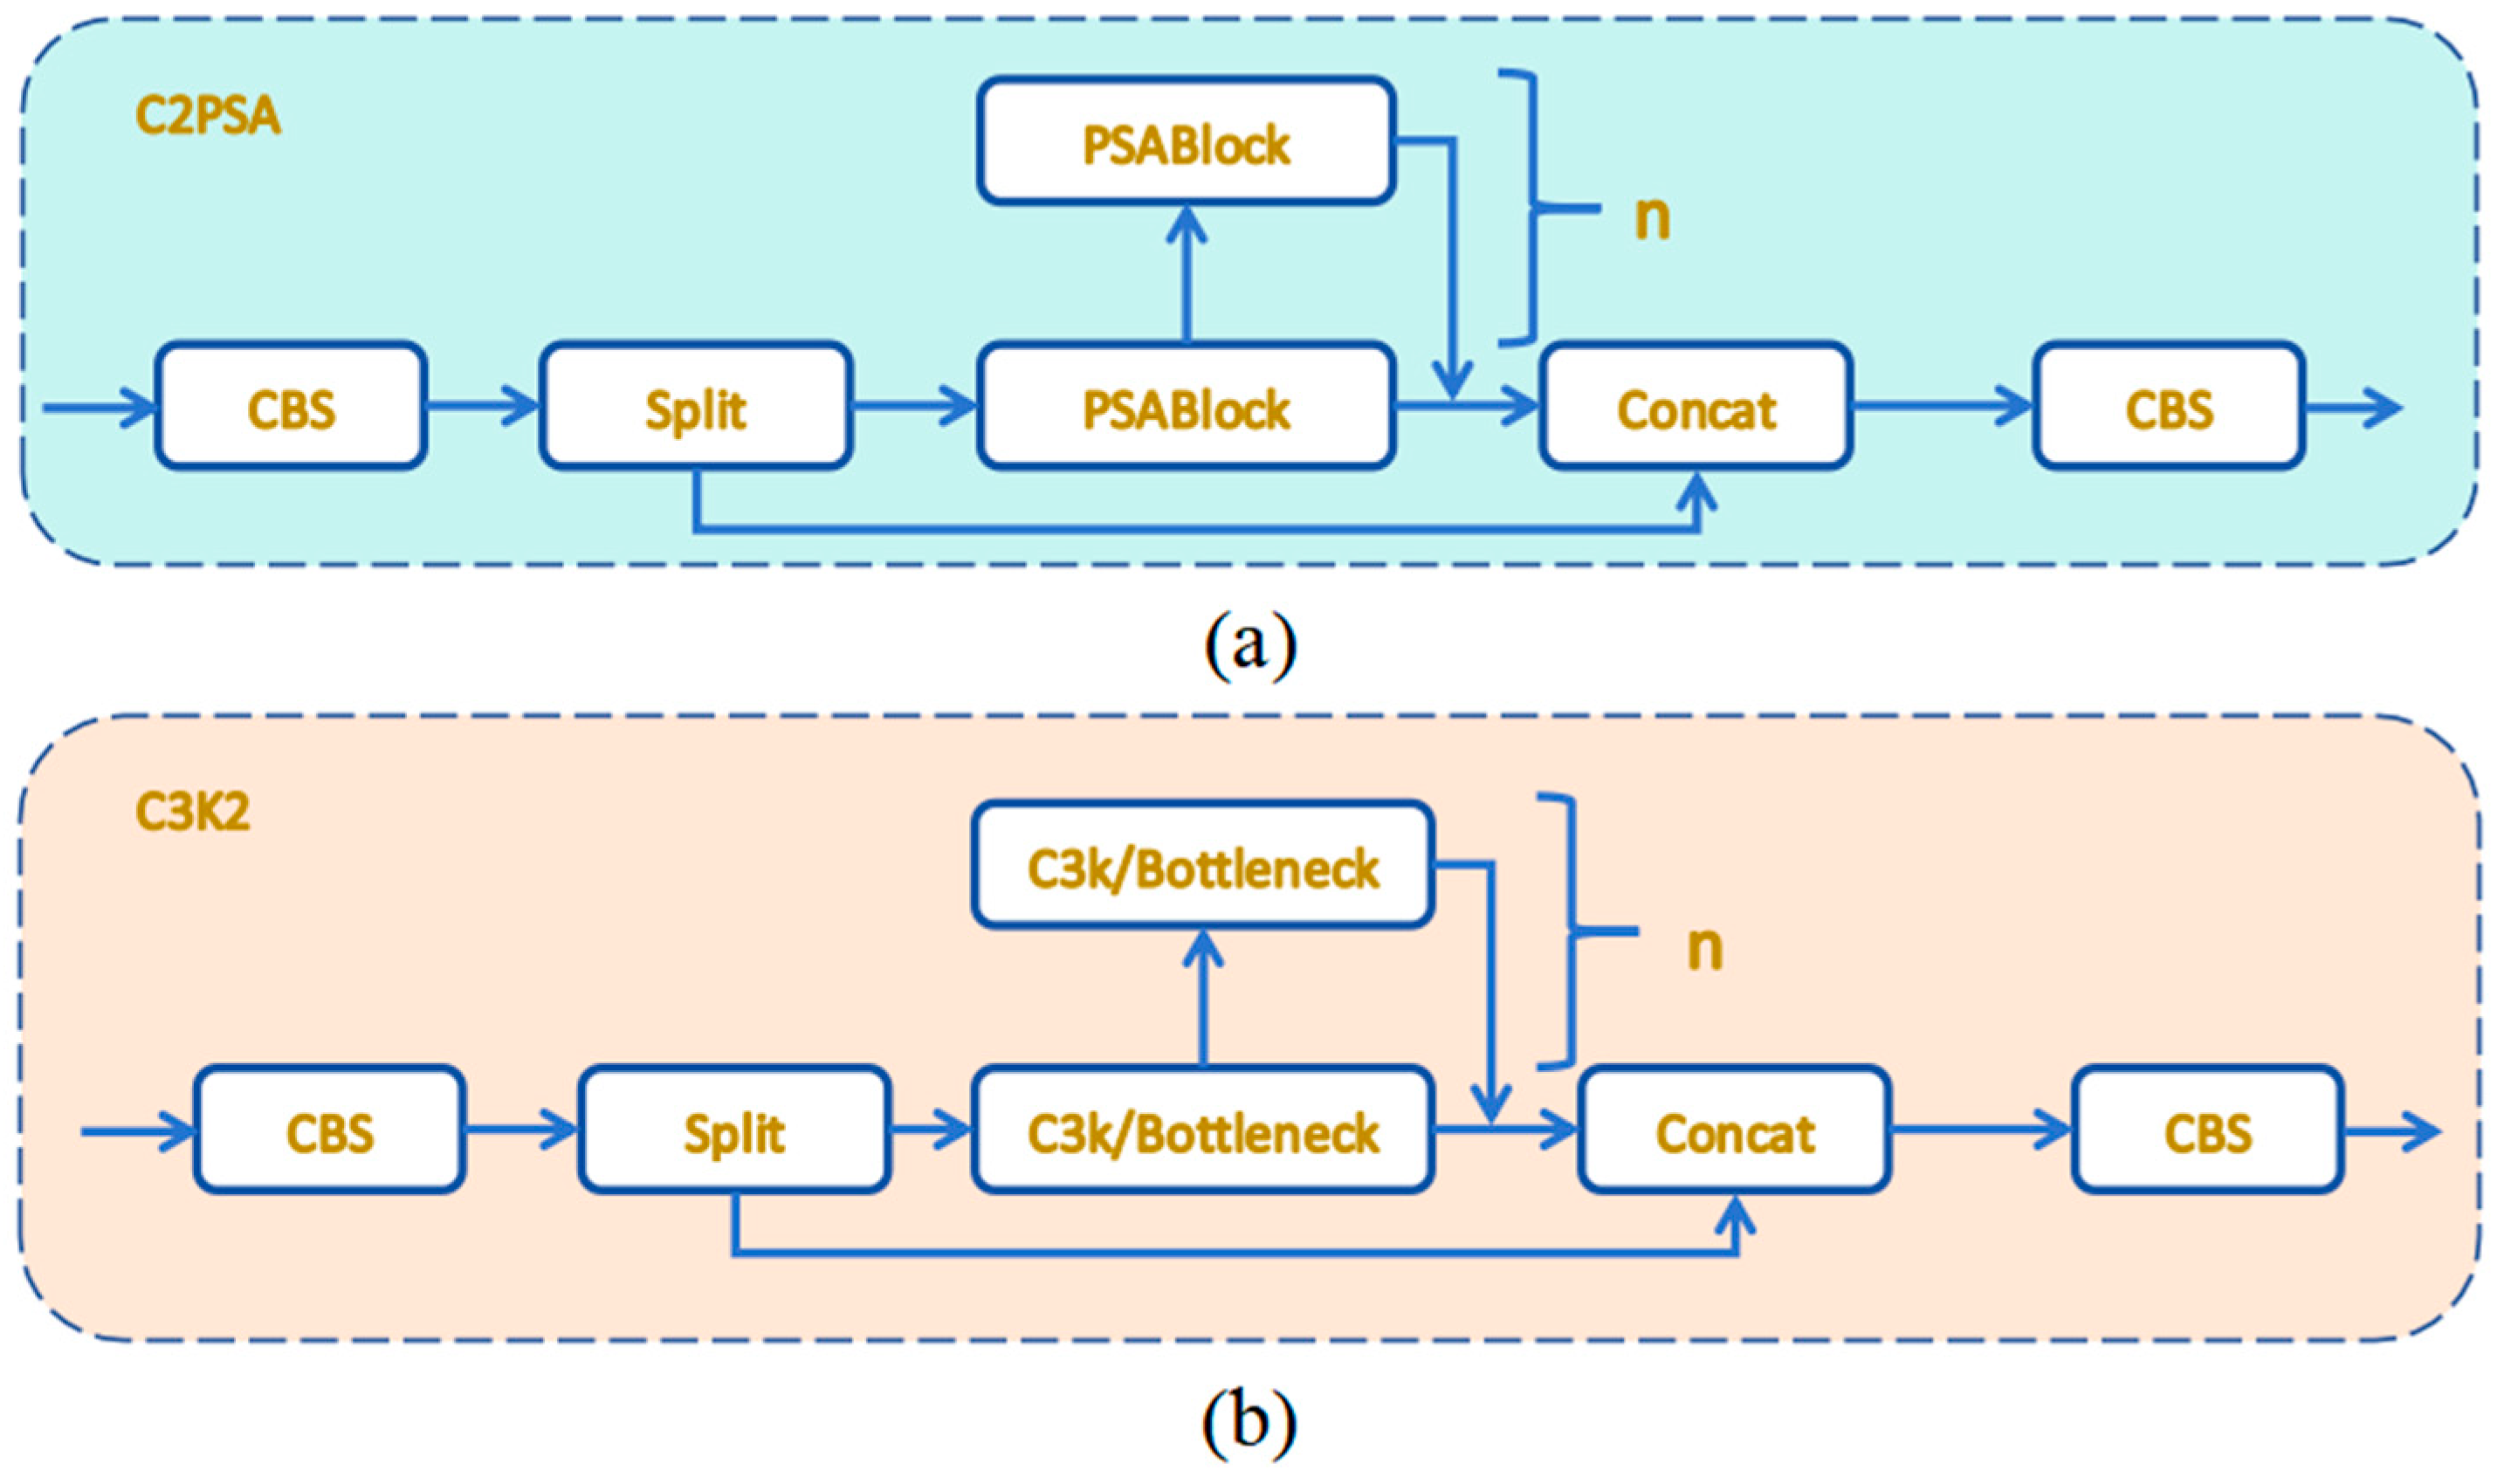
YOLOv11 primarily optimizes the C3k2 and C2PSA modules in its model algorithm, significantly enhancing its feature extraction capabilities and improving the accuracy of multi-scale target recognition. The cross-scale pixel spatial attention (C2PSA) module in YOLOv11 incorporates a novel attention mechanism designed to refine feature representation by integrating cross-scale attention with pixel-level spatial optimization. As depicted in
Figure 2a, the architecture of this module consists of an initial convolutional layer, a sequence of cascaded pixel spatial attention blocks (PSABlocks), a feature concatenation step (Concat), and a concluding convolutional layer dedicated to feature integration [
30,
31]. The initial convolutional layer is tasked with extracting fundamental features from the input data. Subsequently, these features are processed through a series of PSABlocks, each of which refines the feature representation iteratively. Each PSABlock features a pixel spatial attention mechanism paired with a residual connection. This attention mechanism employs a weighting strategy to highlight critical features within target regions, thereby diminishing background noise and enhancing the model’s focus on salient details. Additionally, the residual connections ensure smooth gradient flow. The C2PSA module’s integration of cross-scale attention and pixel-level optimization effectively balances the preservation of fine details with the broader context, rendering it highly effective for detecting complex objects in challenging environments.
The C3K2 module functions as a crucial feature extraction unit in YOLOv11, adeptly balancing feature representation and computational efficiency via a multibranch architecture and residual connections. As depicted in
Figure 2b, the C3K2 module provides two distinct configurations. When the parameter c3k is set to False, the module utilizes a standard bottleneck structure, enhanced by supplementary convolutional and activation layers to extract deeper and more complex features. Conversely, when c3k is set to True, the bottleneck structure is replaced with a C3 module, which significantly reduces computational complexity [
32,
33]. The multibranch architecture of the C3K2 module enables efficient extraction of multi-scale features, enhancing its adaptability to contemporary object detection tasks and ensuring robust performance across various scenarios.
4. Results and Discussion
4.1. Dataset Acquisition and Experimentation
4.1.1. Dataset Arrangement
Following the data acquisition, enhancement, and annotation procedures detailed in
Section 3, a multimodal dataset comprising 6128 images was constructed, partitioned into training (70%), validation (10%), and testing (20%) subsets. This dataset encompasses a variety of common photovoltaic anomalies, including stains, internal defects, snow coverage, panel conditions, and clean states, rendering it suitable for diverse fault detection tasks, with detailed information presented in
Table 2. Additionally, the dataset includes a smaller merged subset with 1289 hotspot labels and 5963 bird-dropping labels.
Figure 9 illustrates representative images of the five categories within the dataset.
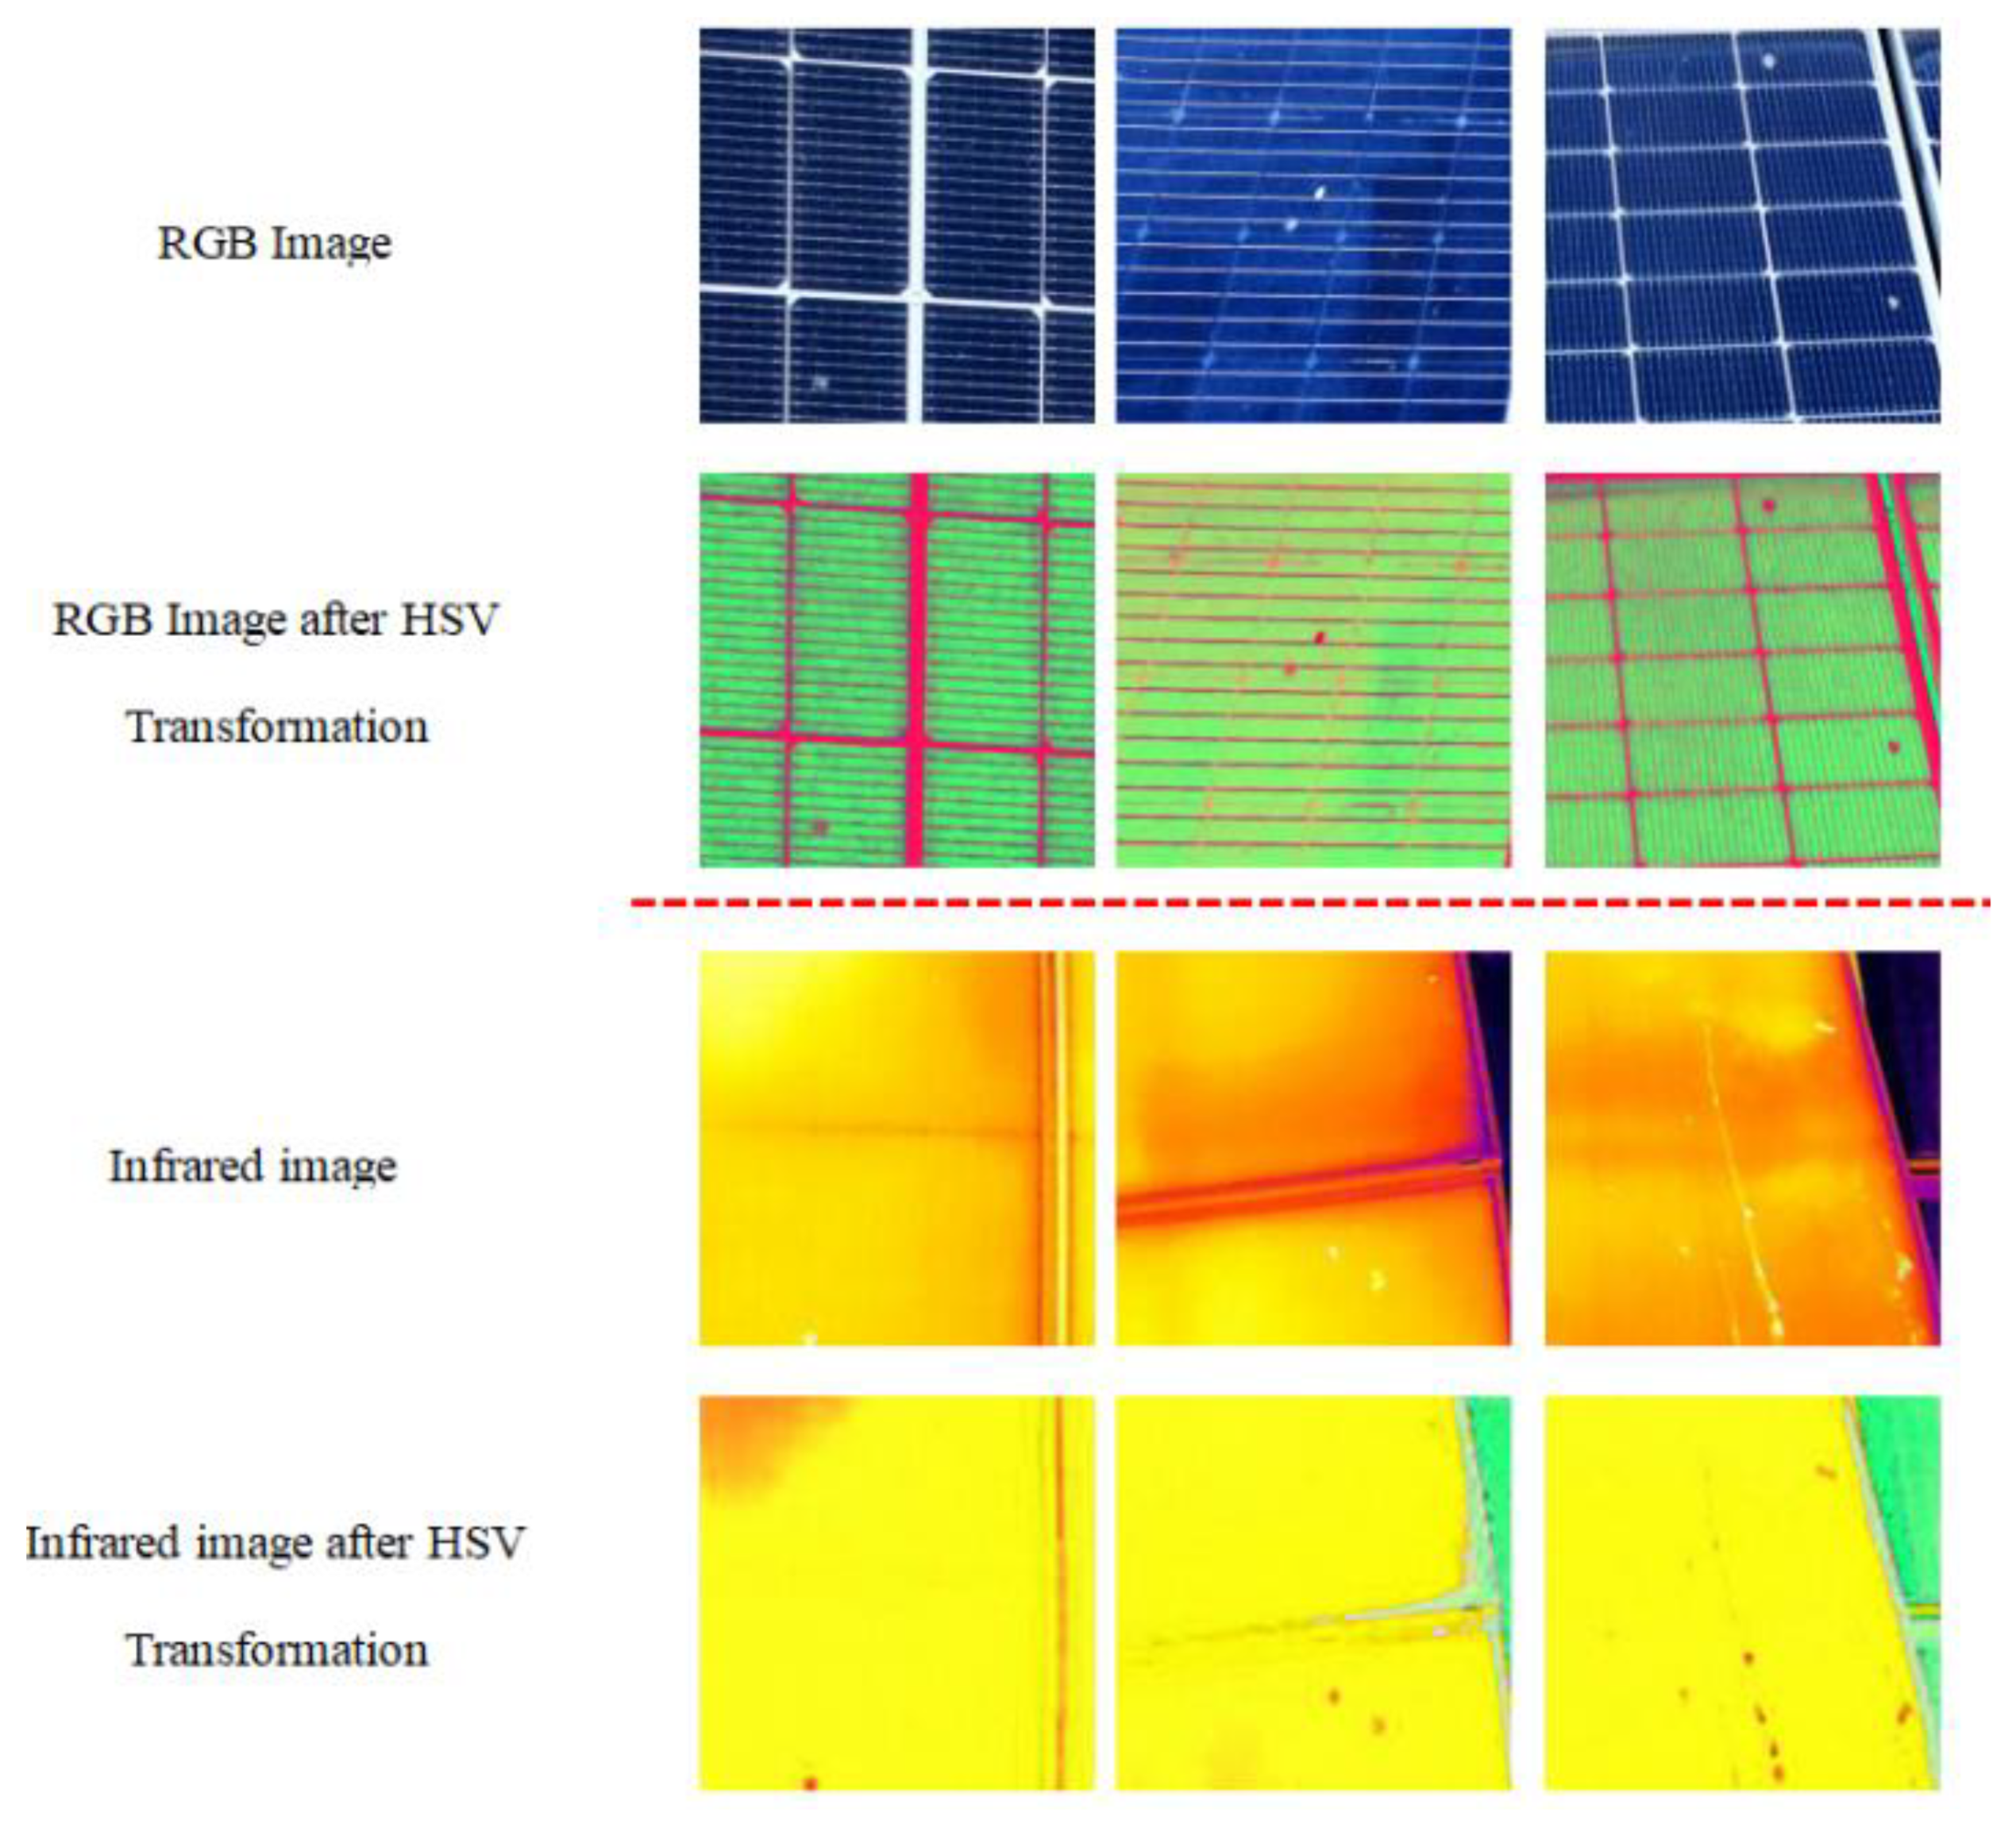
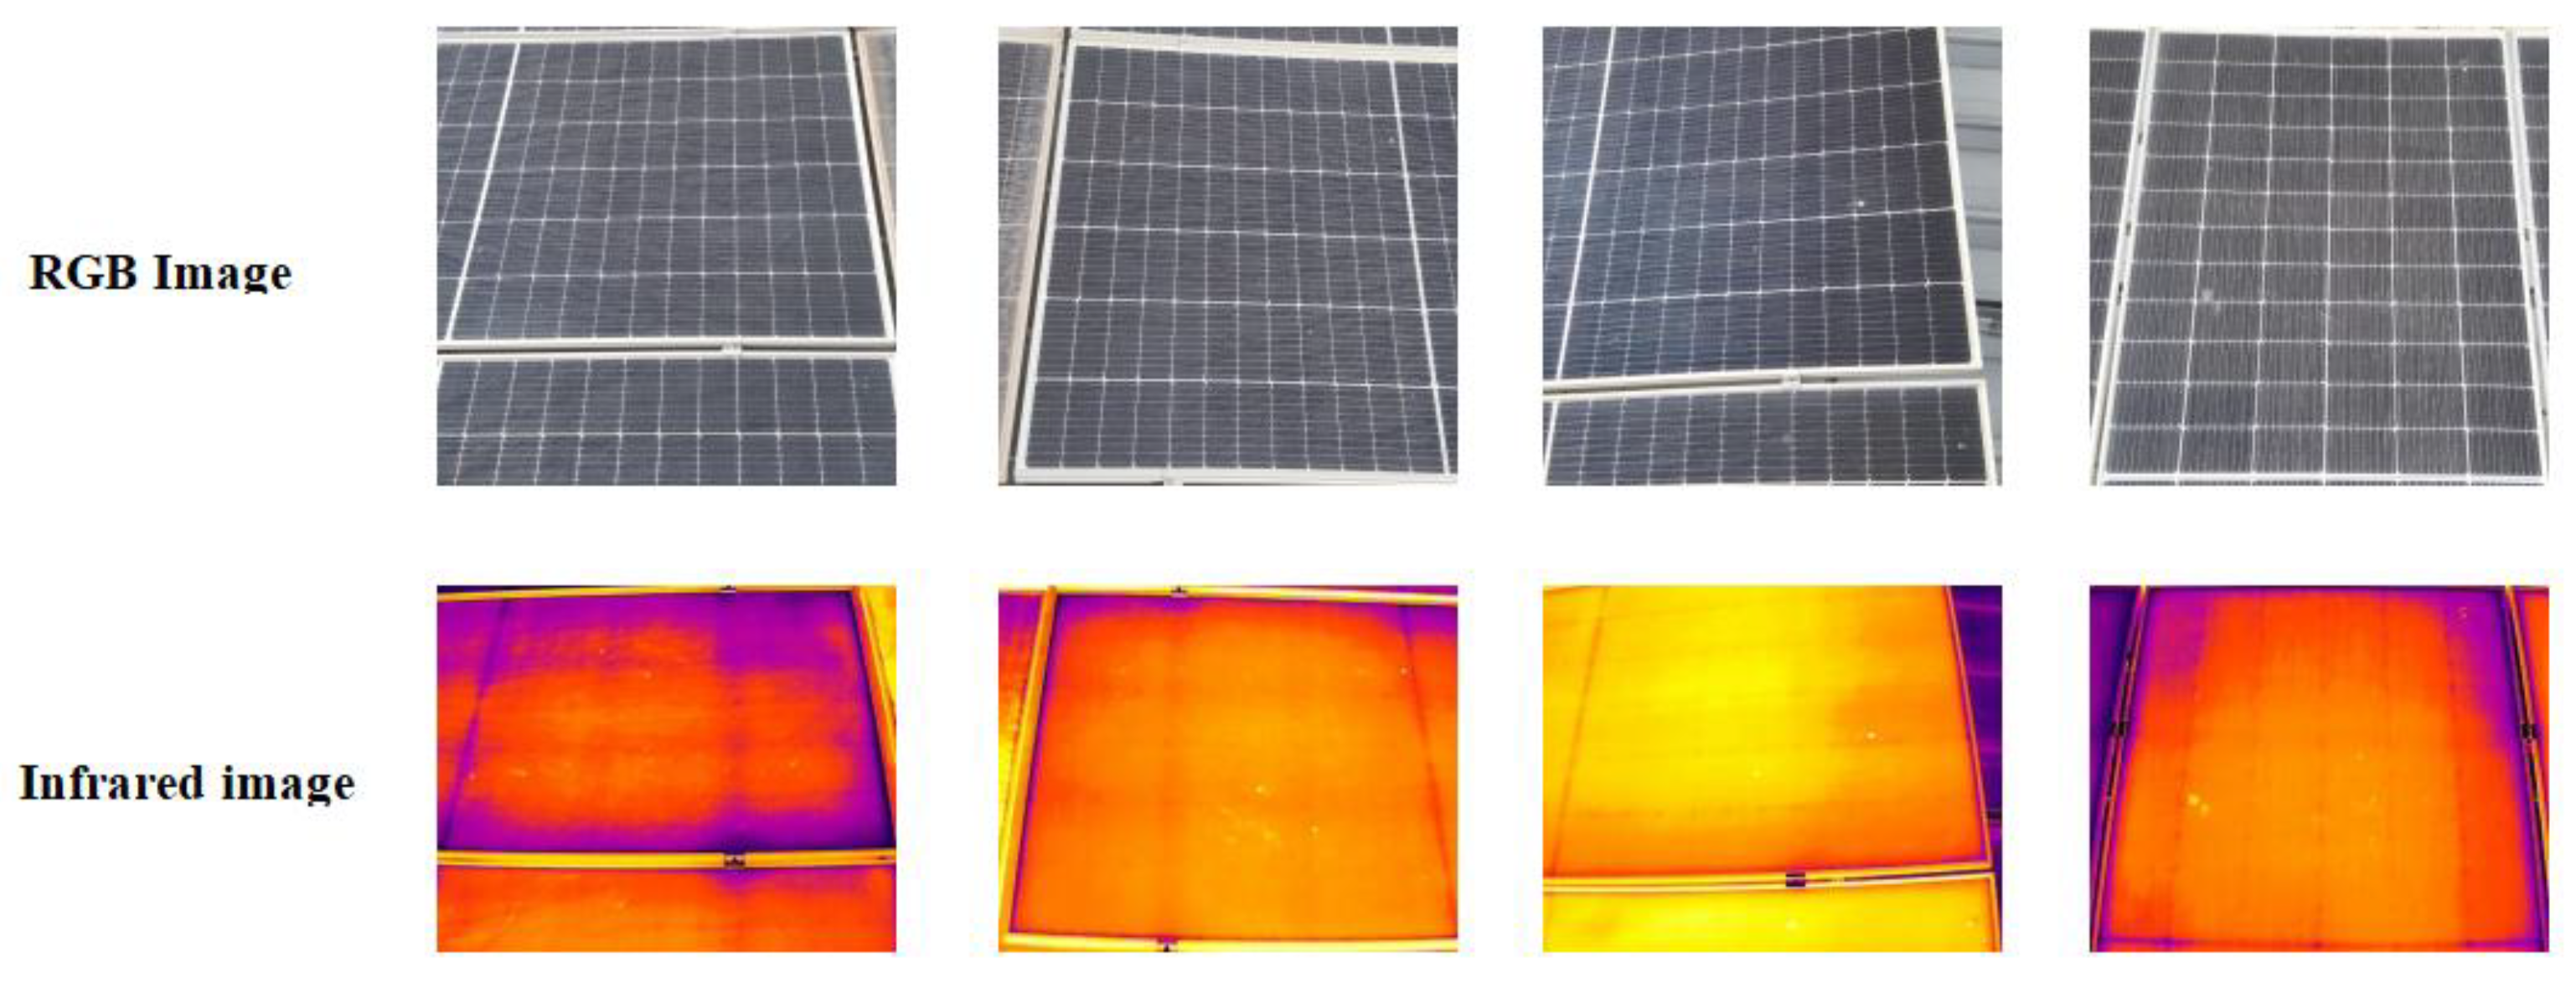
In this study, the small-scale fusion dataset includes RGB images and corresponding infrared images captured by an infrared dual-spectrum drone. Additionally, extra RGB images containing only bird-dropping features (without infrared counterparts) were collected to enhance the model’s ability to recognize bird-dropping colors and shapes. The dataset creation process is as follows. First, using the image center as a reference, RGB images (4000 × 3000 pixels) and infrared images (640 × 512 pixels) are cropped and resized to the same dimensions (640 × 512 pixels) to ensure spatial alignment. Then, bird-dropping and hot-spot regions are annotated. After that, the annotated images are processed with the HSV color model to enhance bird-dropping color features and extract hot-spot temperature features. Finally, the processed RGB and infrared images are integrated into a single dataset. For RGB images with corresponding infrared images, infrared temperature features are introduced. For extra RGB images without infrared counterparts, they are annotated as bird-dropping regions to increase the model’s learning samples of bird-dropping features.
Figure 10 shows the raw data captured by the drone.
4.1.2. Experimental Configuration
In this work, each test was conducted using the same hardware and software setup. Specifically, the experiments were performed on a single RTX A5000 GPU with a software environment comprising CUDA 12.5, Python 3.10, and PyTorch 2.4.0. Based on preliminary experiments, the SGD optimizer with an initial learning rate of 0.01 was employed [
49,
50]. During the training phase, the input images were resized to 640 × 640. The batch size for model training was set to 8. All experiments were trained for 150 epochs to ensure robust convergence across all models.
4.2. Evaluation Metrics
To comprehensively evaluate the detection performance of the YOLOv11-MO model for multiple types of photovoltaic panel faults, a suite of evaluation metrics was employed, including precision, recall, mean average precision (mAP), frames per second (FPS), and the total parameter count of the model [
51]. Among these evaluation metrics, true positives (TP) refer to the correctly predicted positive samples, false positives (FP) refer to the incorrectly predicted positive samples, and true negatives (TN) refer to the correctly predicted negative samples.
Precision is the ratio of TP to the sum of TP and FP, as shown in Equation (11), where TP represents the number of correctly identified positive samples, and (TP + FP) represents all predicted positive samples.
Recall is the ratio of TP to the sum of TP and FN, as shown in Equation (12), where TP represents the number of correctly identified positive samples, and (TP + FN) represents all actual positive samples.
Average precision (AP) amalgamates precision and recall across diverse thresholds, signifying the model’s aptitude in recognizing objects within a specific category. For multi-category datasets, the mean average precision (mAP) is derived by averaging the AP scores across all classes:
FPS denotes the quantity of images that can be processed within a unit of time. Given identical hardware resources, a higher FPS of the object detection algorithm correlates with superior real-time performance.
The forthcoming section details the experimental results, utilizing the aforementioned metrics and parameters.
4.3. Comparative Experiments
In order to meticulously evaluate the effectiveness of the proposed algorithm, comparative experiments were conducted against several state-of-the-art object detection models, employing identical datasets and training protocols. Considering that inspections of photovoltaic panels are often carried out using UAVs, which demand compact models and efficient computational performance, lightweight versions of the YOLO series were selected for benchmarking. The outcomes of the aforementioned experiments are encapsulated in
Table 3 and
Table 4.
As shown in
Table 3, YOLOv11 demonstrates significant superiority in key performance metrics, achieving an mAP@0.5 of 0.798. These metrics not only represent the best performance within the YOLO series but also markedly outperform RT-DETR. The outstanding performance of YOLOv11 is primarily attributed to the introduction of the C2PSA and C3K2 modules. The C2PSA module, through its cross-stage partial attention mechanism, significantly enhances the model’s ability to detect small objects and complex backgrounds. Meanwhile, the C3K2 module further optimizes the feature extraction process, thereby improving the overall performance of the model. In contrast, YOLOv5, YOLOv8, YOLOv10, and YOLOv12 all exhibit lower performance than YOLOv11, indicating that these models still have room for improvement in feature extraction and target detection. Although YOLOv12 shows relatively strong robustness overall, it still lags behind YOLOv11 in certain categories, suggesting that its architecture and feature extraction capabilities warrant further refinement. RT-DETR’s performance is mediocre, with an mAP@0.5 of 0.702. Despite the advantage of RT-DETR’s Transformer structure in handling long-range dependencies, it performs poorly in detecting small objects and processing complex backgrounds, resulting in lower detection accuracy and robustness compared to YOLOv11.
A more in-depth analysis of performance across different categories is provided in
Table 4. YOLOv11 outperforms other models in all categories, particularly in the Clean and Defect categories, where its mAP@0.5 reaches 0.965 and 0.813, respectively. This indicates that YOLOv11 has extremely high accuracy and robustness in detecting clean and defective photovoltaic panels. For the Stain category, mAP@0.5 of YOLOv11 is 0.615; while this represents competent performance, it remains notably lower than other categories. This gap is likely attributable to the complex types and distributions of dirt in the Stain category, which require further optimization of the feature extraction module to enhance detection performance. In the Panel and Snow categories, the mAP@0.5 of YOLOv11 are 0.766 and 0.833, respectively, both significantly higher than other models. These results demonstrate YOLOv11’s high accuracy in detecting the overall photovoltaic panel and snow coverage. further confirming its comprehensive advantages in handling different types of PV faults.
In summary, YOLOv11 performs exceptionally well in photovoltaic fault detection tasks, especially in detecting Clean, Defect, and Snow categories, with high accuracy and robustness. However, there is still room for improvement in the Stain category. Therefore, YOLOv11 was selected as the model for improvement, with the aim of optimizing the model structure and enhancing feature extraction capabilities to further improve detection performance for complex backgrounds and small objects.
4.4. Ablation Experiment
In order to systematically assess the contributions of the individual enhancements proposed for YOLOv11, a series of incremental assessments were conducted. Initially, the efficacy of incorporating the HSV color model was examined. This was followed by ablation studies on the MSB and OA modules, which were integrated into YOLOv11 in conjunction with the HSV model. Finally, the impact of introducing the B-SiLU activation function was assessed. The cumulative results of these evaluations are compiled in
Table 5 and
Table 6.
Table 5 provides detailed results of the ablation study, revealing the significant impact of different module combinations on model performance. When the HSV module is introduced alone, the mAP@0.5 slightly increases to 0.799, while the recall rate slightly decreases to 0.762, and the precision drops to 0.821. The model size remains at 18.3 MB, and the FPS increases from 17.441 to 18.398. This indicates that the HSV module has certain advantages in enhancing color feature extraction, but it has a slight negative impact on recall rate. Meanwhile, the HSV module has a minimal impact on computational resources, with an increase in FPS. After further introducing the Outlook Attention module, the mAP@0.5 increases to 0.801, the recall rate slightly decreases to 0.766, and the precision drops to 0.814. The model size remains at 18.3 MB, and the FPS increases from 17.441 to 18.320. This suggests that the Outlook Attention module significantly enhances the model’s detection capability for small targets and complex backgrounds. When the Hybrid Structure Block module is introduced, the mAP@0.5 increases to 0.804, the recall rate increases to 0.770, and the precision slightly drops to 0.817. The model size increases to 59.3 MB, and the FPS decreases from 17.441 to 14.282. This highlights the significant advantages of the Hybrid Structure Block module in handling complex backgrounds and small targets, although the computational complexity increases. Ultimately, when all modules (HSV, Outlook Attention, Hybrid Structure Block, and B-SiLU) are integrated, the mAP@0.5 reaches 0.816, with a recall rate of 0.773 and precision of 0.835. The model size remains at 59.3 MB, and the FPS is 14.637. This emphasizes the significant overall performance improvement brought by the synergistic effect of these modules, especially in the Defect, Stain, Panel and Snow categories.
As shown in
Table 6, the impact of different modules on performance varies across categories. In the Clean category, the base model’s mAP@0.5 is 0.965, which slightly decreases after the introduction of the HSV module but gradually increases to 0.961 and finally reaches 0.949 with all modules incorporated. This indicates that the Clean category has a relatively low dependence on additional modules, as the base model already achieves high detection accuracy. In contrast, the Defect category is more sensitive to module introduction. The base model’s mAP@0.5 is 0.813, which drops to 0.779 upon the addition of the HSV module but subsequently rises to 0.835. Notably, the introduction of the Outlook Attention and Mix Structure Block modules notably improves detection performance. The Stain category also shows sensitivity to module introduction. The baseline model achieves an mAP@0.5 of 0.615, which fluctuates between 0.615 and 0.651 with different modules and ultimately reaches 0.648 with all modules included. Similarly, the Panel category exhibits sensitivity to module introduction. The baseline model achieves an mAP@0.5 of 0.766, which varies between 0.757 and 0.811 with different modules and finally reaches 0.808 with all modules incorporated. The Snow category is likewise sensitive to module introduction. The baseline model achieves an mAP@0.5 of 0.833, which fluctuates between 0.828 and 0.853 with different modules and ultimately reaches 0.841 with all modules included. These findings indicate that different categories have varying sensitivities to module introduction, with specific modules significantly enhancing detection performance in the Defect, Stain, Panel, and Snow categories.
From the results in the above tables, one may infer that the integration of various modules markedly augments the overall performance of the model, particularly in addressing complex backgrounds and small objects. The synergistic effect of these modules plays a crucial role in performance improvement, particularly in the Defect, Stain, Panel, and Snow categories. However, this performance gain comes at a cost. The introduction of the MSB module, while significantly boosting detection performance, also substantially increases the model’s computational complexity (model size increases from 18.3 MB to 59.3 MB). This suggests that a trade-off between performance enhancement and computational resource consumption needs to be considered in practical applications.
To effectively address the increased computational complexity, this study has adopted a series of strategies. First, the HSV color model was introduced to enhance the model’s capability in extracting color features. Second, the OA module was incorporated, which effectively captures fine-grained details often overlooked by traditional self-attention mechanisms. Lastly, the original activation function of YOLOv11 was replaced with the B-SiLU, introducing complex feature interactions that enable the model to more effectively capture and represent key features in the input data. As shown in
Table 5, these improvements have all led to an increase in the model’s FPS, thereby alleviating the increase in computational complexity to some extent while maintaining high performance. Overall, despite the increase in model size, the decrease in FPS is relatively small, from 17.441 to 14.637, indicating that the impact on real-time performance is within an acceptable range.
Moreover, the varying sensitivity of different categories to module introduction indicates that the selection of module combinations should be tailored to specific task requirements in practical applications. Future research could further explore more efficient module designs to enhance performance without significantly increasing computational complexity. Additionally, employing a broader range of data enhancement methods could bolster the model’s resilience to diverse environmental contexts, thereby significantly augmenting its generalization capacity. Specifically, we plan to introduce advanced multi-modal data augmentation techniques, incorporating spectral and spatiotemporal information, to further optimize the model’s training process. We will also explore hybrid architectures that combine the strengths of different models to achieve more efficient and accurate detection.
4.5. Cross-Technology Evaluation
In modern PV systems, in addition to traditional monocrystalline and polycrystalline silicon PV modules, thin-film and bifacial PV modules are increasingly being utilized. These novel PV modules exhibit significant differences from traditional modules in terms of material properties, optical response, and thermal characteristics. Therefore, to validate the detection performance of the model on these new types of modules, the YOLOv11-MO model was trained and evaluated on the novel PV module fault dataset from Roboflow. The mAP, recall, and precision of the model were calculated for different types of PV modules. The results are shown in
Table 7.
The dataset size varies significantly across different types of PV modules. Monocrystalline silicon modules, which hold a dominant market position and are widely installed, possess the largest dataset, comprising 6128 images. In contrast, thin-film and bifacial modules, which have smaller market shares and are less frequently installed and used, respectively, have smaller datasets, with 203 and 182 images each. These smaller datasets highlight the need for further expansion in the future.
In the evaluation of detection performance across different types of PV modules, we focused on three key metrics: mAP@0.5, recall, and precision. The results indicate that polycrystalline silicon modules achieved the highest mAP@0.5 of 0.867, demonstrating superior detection accuracy. Monocrystalline silicon modules followed with an mAP@0.5 of 0.816, which, although slightly lower than that of polycrystalline silicon, still represents a high level of performance. In contrast, thin-film and bifacial modules had lower mAP@0.5 values of 0.723 and 0.737, respectively. These lower values may be attributed to the uniform surface texture and low color contrast of thin-film modules, as well as the increased detection complexity due to the reflective properties of the rear side of bifacial modules. Regarding recall, polycrystalline silicon modules had the highest rate at 0.838, indicating that the model was able to detect a greater proportion of fault regions with fewer missed detections. Monocrystalline silicon modules had a recall of 0.773, which, while slightly lower, still represents a high detection capability. Thin-film modules had the lowest recall at 0.721, likely due to the challenging identification of fault regions on their surfaces. Bifacial modules had a recall of 0.833, comparable to polycrystalline silicon modules, suggesting good detection performance despite the added complexity of their reflective properties. In terms of precision, polycrystalline silicon modules again had the highest rate at 0.836, indicating the lowest false-positive rate among the fault regions detected. Monocrystalline silicon modules had a precision of 0.835, slightly lower but still high. Thin-film modules had the lowest precision at 0.671, with bifacial modules at 0.664. The lower precision values for thin-film and bifacial modules may be due to the increased detection complexity resulting from their surface characteristics, which can lead to higher false-positive rates.
Overall, the model exhibits notable performance disparities across different types of PV modules. Polycrystalline silicon modules achieve the highest performance in terms of mAP@0.5, recall, and precision, which may be attributed to their stable optical and thermal properties. In contrast, thin-film and bifacial modules demonstrate lower performance metrics, likely due to their surface characteristics and increased detection complexity. The small dataset size of thin-film modules may particularly limit the model’s training efficacy and generalizability. Although bifacial modules show relatively high recall, their precision is lower, possibly because the reflective properties of their rear side complicate detection. Future work should focus on expanding the dataset sizes for thin-film and bifacial modules to gain a more comprehensive understanding of the model’s performance.
4.6. Visual Interpretation via Grad-CAM Analysis
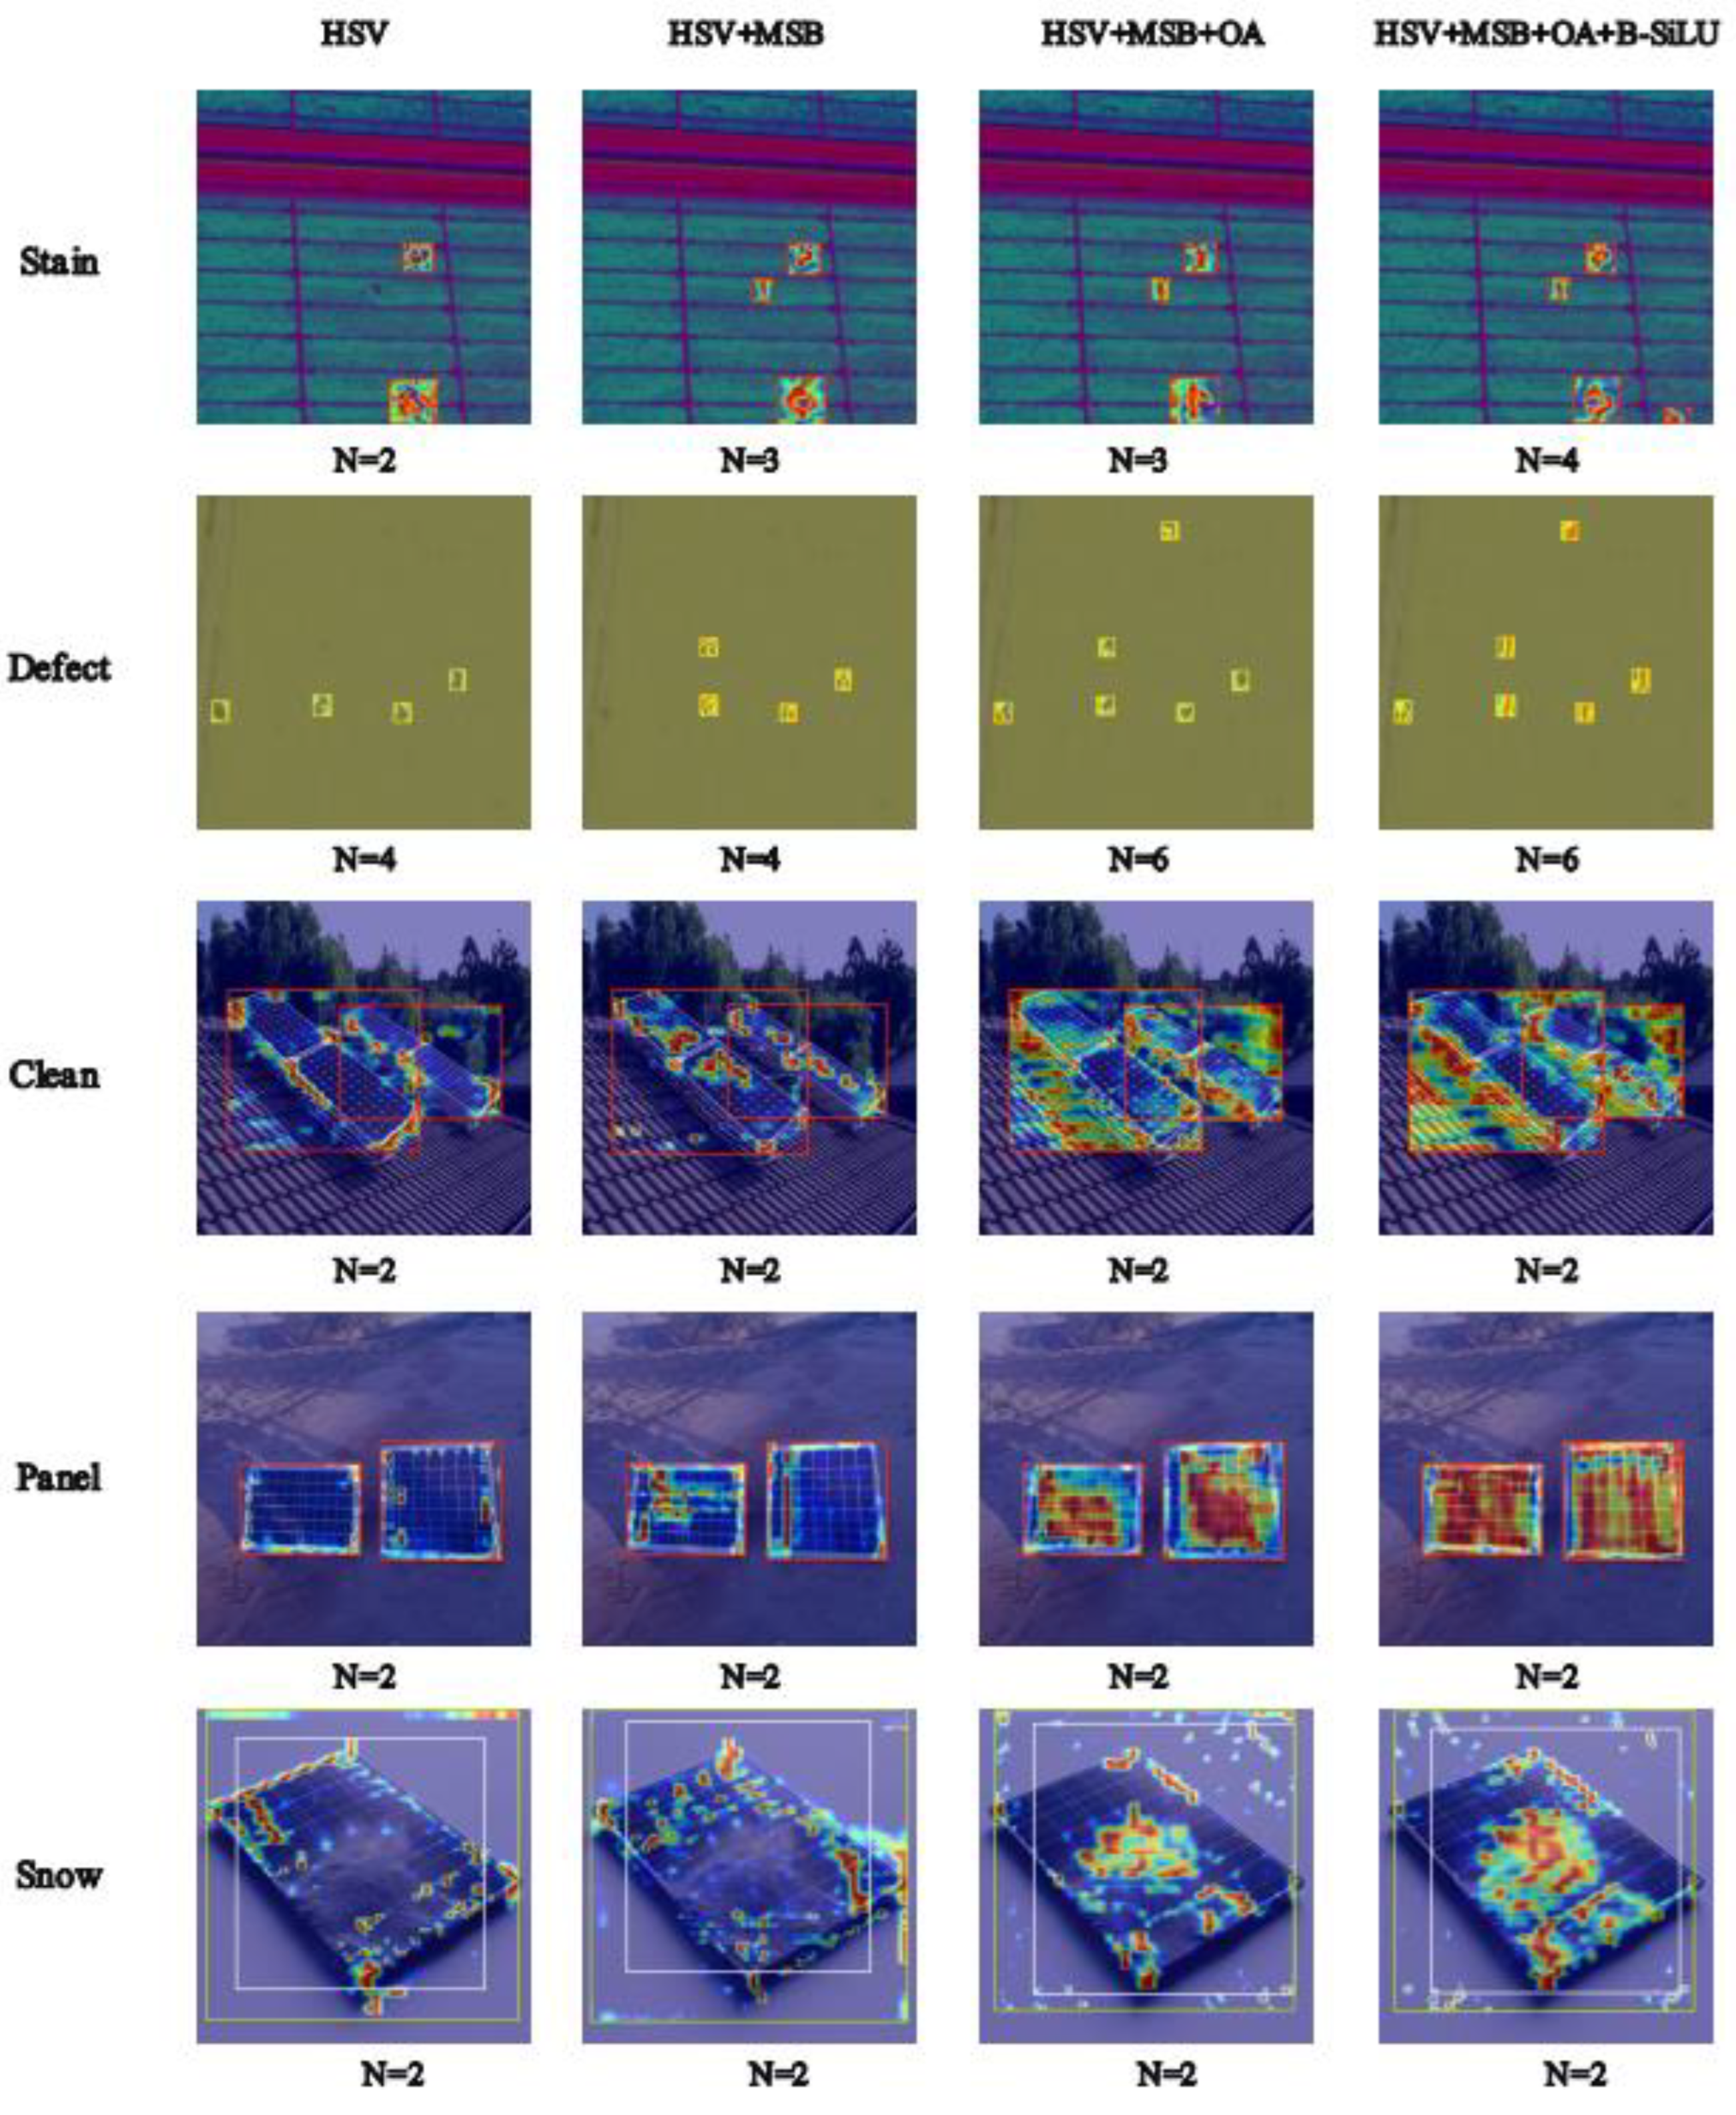
In this study, we utilized the enhanced YOLOv11 model to generate heatmaps corresponding to different combinations of improvements, thereby visualizing the feature responses and attention distribution during the photovoltaic fault detection process.
Figure 11 presents the heatmap outputs for five categories of photovoltaic faults (Dirty, Damaged, Clean, Panel, Snow), each under four distinct processing conditions: HSV, HSV + MSB, HSV + MSB + OA, and HSV + MSB + OA + B-SiLU.
The HSV module, which converts images from the RGB space to the HSV space, enhances sensitivity to color and brightness. In
Figure 11, the heatmaps after HSV processing already demonstrate preliminary attention to target regions, particularly for the Stain and Defect categories, where the model can initially identify fault regions. However, relying solely on the HSV module still has limitations in detection capability, resulting in missed and false detections. To address this, the MSB module introduces a hybrid structural design that integrates feature extraction capabilities across different scales. In the heatmaps after HSV + MSB processing, the number of detection boxes for the Stain category increased from 2 to 3. This improvement indicates that the MSB module, through its synergistic design of multi-dilation-rate convolutions and channel shuffling, significantly enhances the model’s ability to capture cross-scale features and effectively suppresses missed detections caused by target scale differences. Building on these enhancements, the OA module further boosts the attention mechanism. In the heatmaps after HSV+MSB+OA processing, the model exhibits heightened attention to target regions of the Clean, Panel, and Snow categories, with more concentrated color distribution. The OA module achieves a balance between computational efficiency and long-range dependency modeling by integrating fine-grained attention within local windows and neighboring information, thereby enhancing the model’s perception of targets in complex backgrounds. Finally, the B-SiLU activation function, which combines the advantages of ReLU and SiLU, introduces nonlinear characteristics that enhance the model’s feature expression capability. In the heatmaps after HSV + MSB + OA + B-SiLU processing, the detection performance of the model reaches its optimal state, with the number of detection boxes for the Stain category increasing from 3 to 4. This improvement underscores the role of the B-SilU activation function in optimizing gradient flow and feature discrimination.
In conclusion, each improvement module has played a crucial role in enhancing the detection performance of the model. The HSV module provides basic sensitivity to color and brightness; the MSB module strengthens cross-scale feature capture through multi-scale receptive field fusion; the OA module precisely focuses on target regions via fine-grained attention within local windows; and the B-SiLU activation function optimizes gradient flow and feature discrimination through improved nonlinear mapping. These modules work in concert and are integrated into the YOLOv11 model, significantly boosting its performance in photovoltaic fault detection and raising the detection accuracy to 81.6%. The heatmap visualizations further verify the effectiveness of these improvements, providing strong support for future research and applications.
5. Conclusions and Future Work
The YOLOv11-MO framework proposed in this paper integrates MSB and OA modules, demonstrating significant improvements in detecting photovoltaic faults across various categories, including Clean, Damaged, Dirty, Panel, and Snow. The integration of these modules has enhanced the model’s ability to handle complex backgrounds and small objects. Specifically, the MSB has proven effective in capturing multi-scale features, while the OA module has bolstered the model’s attentional mechanisms toward key regions within images. These enhancements have collectively contributed to a more robust and accurate detection system. When compared to other YOLO models and RT-DETR, YOLOv11-MO achieves the highest detection accuracy of 0.816. This represents a notable improvement over the baseline model, with detection accuracies for Stain, Defect, and Snow increasing by 3.3%, 2.2%, and 0.8%, respectively. Despite these advancements, the increased computational complexity associated with the MSB module remains a trade-off that must be carefully managed. The model size has expanded from 18.3 MB to 59.3 MB, necessitating a balance between performance gains and resource consumption. This trade-off underscores the importance of tailored module selection based on specific application requirements. It is worth noting that, although the YOLOv11-MO framework has achieved remarkable progress in improving detection accuracy, the issue of false positives remains a challenge that requires attention. In complex photovoltaic scenarios, such as those involving shadows, reflections, or partial occlusions, the model may generate false positives. To address this issue, we have adopted a variety of strategies, including optimizing the training dataset of the model to increase its diversity and complexity, as well as adjusting the model’s parameters and improving the model structure to reduce the occurrence of false positives. Looking ahead, several promising research directions are worth exploring. First, it is crucial to develop more efficient module designs by leveraging advanced computational theories and optimization techniques. This will enable performance improvements while minimizing computational overhead. Second, integrating advanced multimodal data augmentation techniques, incorporating spectral and spatiotemporal information, can enhance the model’s robustness and ability to generalize across varied environmental settings. Third, exploring hybrid architectures that combine the strengths of different models through multidisciplinary approaches can lead to synergistic improvements in detection accuracy and efficiency. Finally, extending the application of these advancements to other domains, such as natural language processing and time-series analysis, could reveal new opportunities and validate the framework’s versatility and scalability. In summary, while the YOLOv11-MO framework has made substantial strides in PV fault detection, ongoing efforts to refine and extend its capabilities will be crucial in addressing the evolving challenges of this field.
