1. Introduction
Earthquakes are among the most devastating natural disasters, causing significant loss of life, infrastructure damage, and economic disruption globally. The frequency and magnitude of seismic events vary considerably by region, with certain areas experiencing a higher concentration of high-intensity earthquakes due to tectonic activity. Recent studies have emphasized the critical role of local soil characteristics in influencing earthquake-induced damage. For example, near-fault ground motions exhibit different responses depending on the underlying soil type, which can significantly affect the seismic behavior of buildings and infrastructure [
1,
2]. In particular, soft soils have been shown to amplify seismic waves, leading to greater structural damage compared with more stable rocky foundations [
2,
3]. Furthermore, variations in soil suction and overburden thickness directly influence ground motion characteristics, making it essential to account for these factors in seismic hazard assessments [
4]. Understanding the correlation between soil properties and seismic response is crucial for improving building codes and mitigating earthquake risks, particularly in urban areas with complex geological conditions [
5].
Recently, the increasing frequency of earthquake events has highlighted the growing need for seismic studies in South Korea, where geotechnical hazards pose significant threats to structures in ports and urban areas built on loose, saturated sandy soils. Consequently, the evaluation of geotechnical earthquake hazards has gained increasing emphasis in South Korea. Seismic disaster management and mitigation for building structures are required to establish effective and appropriate strategies to reduce earthquake hazards. However, these tasks are complex and require substantial resources and detailed analysis [
6,
7,
8,
9]. Their complexity requires the use of a systematic methodology based on a computer-aided system, such as the geographic information system (GIS) tool [
4]. In addition, establishing a database and estimating the spatial extent of seismic vulnerability necessitate the use of a wireless network system (WNS) connected to seismometers.
The fragility of a structure or component is defined as the conditional frequency of failure given a specific value of the response parameter. The response parameter x can represent forces acting on a component or structure due to wind, earthquake-induced stress, or other external forces. The conditional frequency of failure given is the fragility of the component at that level. In other words, the fragility curve is the cumulative distribution function of the component’s capacity to withstand the imposed stress . In many seismic risk studies, the response parameter is the peak horizontal ground acceleration measured in units of , the gravitational acceleration. Furthermore, the fragility curve usually has a lognormal distribution (other distributions have also been considered, like the truncated lognormal distribution and the normal distribution).
The time-variant reliability problem in broad terms is the problem of computing the probability that a nonlinear system with random properties exposed to random, time-varying actions ceases to satisfy a number of requirements, whose definition is also subject to uncertainty. In seismic reliability analysis, this probability is typically conditioned on an intensity measure of the input ground motion, referred to as the fragility function. To calculate the unconditional probability that a structure will fail at a given site and time, seismic intensity uncertainty is incorporated using the hazard function (the complementary cumulative distribution function (CDF) of intensity). By convolving the hazard function’s derivative with the fragility function, seismic risk is determined.
A large number of methods have been proposed to compute fragility functions in the last 20 years, ranging from expert judgment [
10] to data analysis on observed damages [
11,
12] and fully analytical approaches, such as, for example, in [
13,
14,
15,
16,
17]. General reviews can be found, for example, in [
18,
19]. A feature common to most of the analytical approaches is the use of a reduced number of simulations to compare probabilistically the maximum structural responses with the corresponding capacities. The primary differences lie in how they balance cost and accuracy, particularly in their ability to economically account for all aspects of the reliability problem. These latter include the following:
The possibility of the structure collapsing in more than one failure mode (the system reliability problem), as is common for civil engineering structures such as multistory buildings and bridges;
The dependence among the possible failure modes;
The uncertainty in the capacity of the structure due to the approximate nature of the models and the variability in the system parameters;
The influence on the dynamic response of the variability in the system parameters.
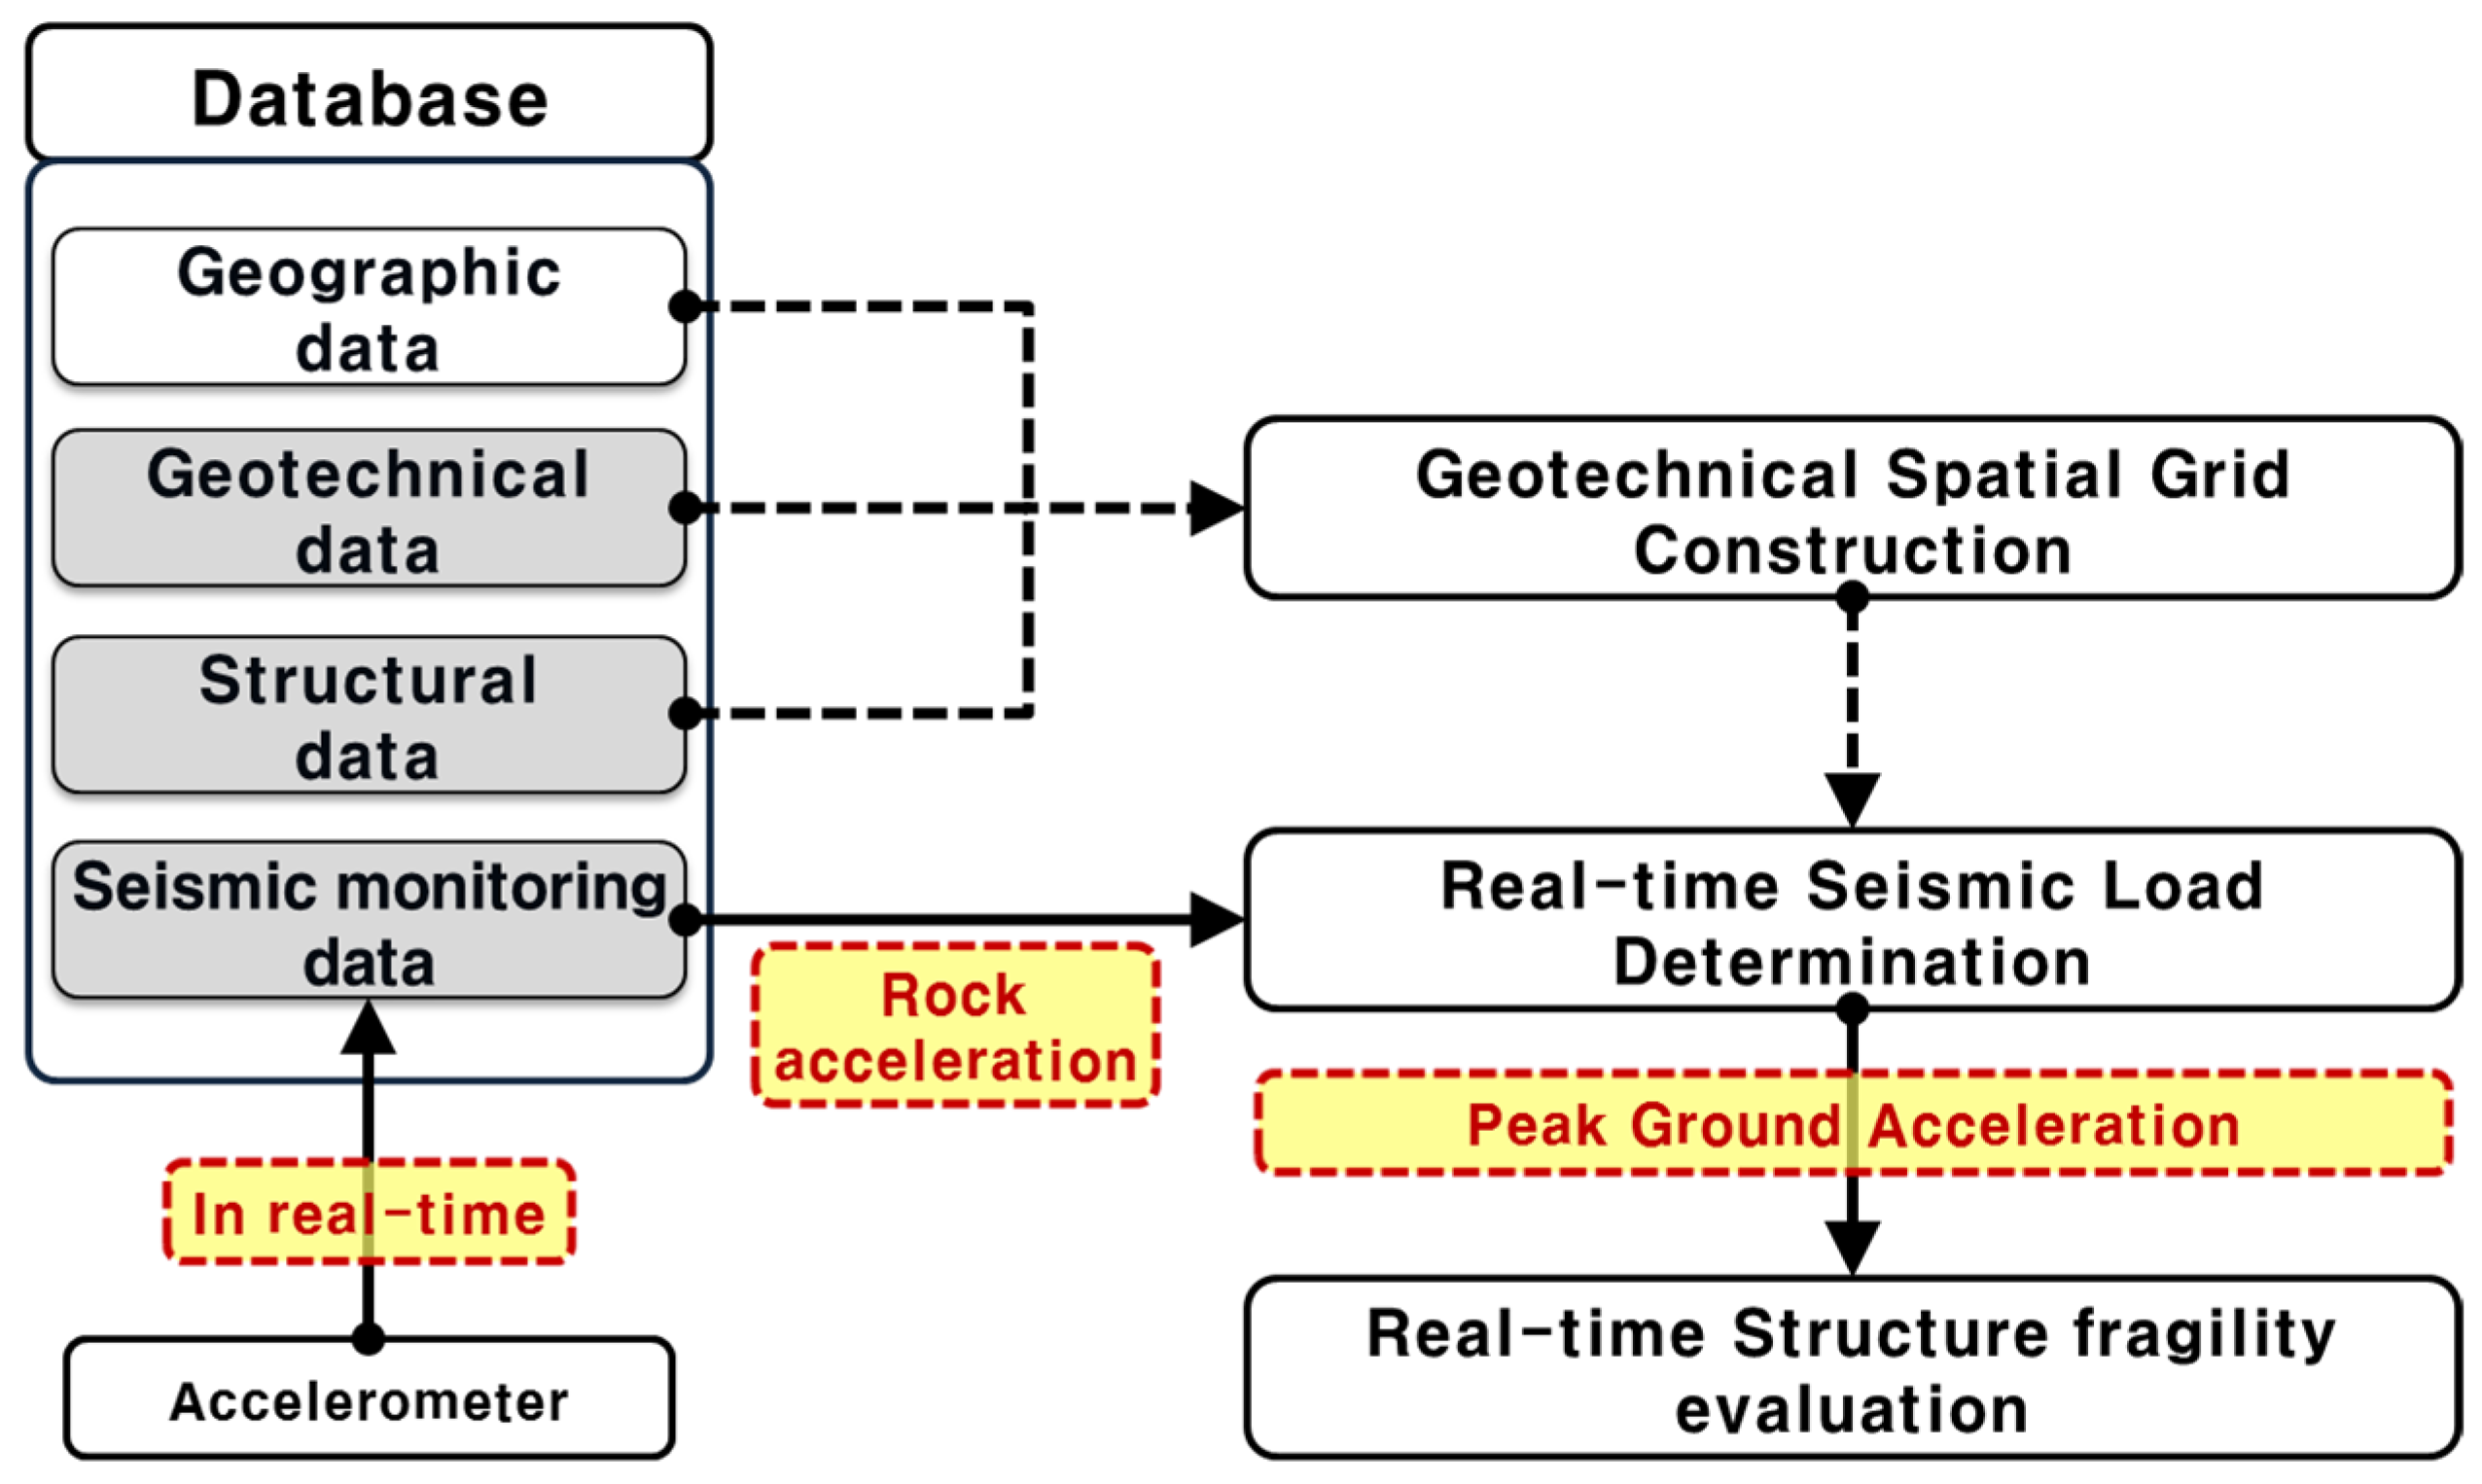
In this study, we developed a systematic procedure for real-time structure seismic fragility assessment that consists of three functional modules within a database (geotechnical spatial grid construction, real-time seismic load determination, and structure fragility evaluation). The datasets for real-time earthquake hazard assessment consist of geographic, geotechnical, structural, and seismic monitoring data for the target site.
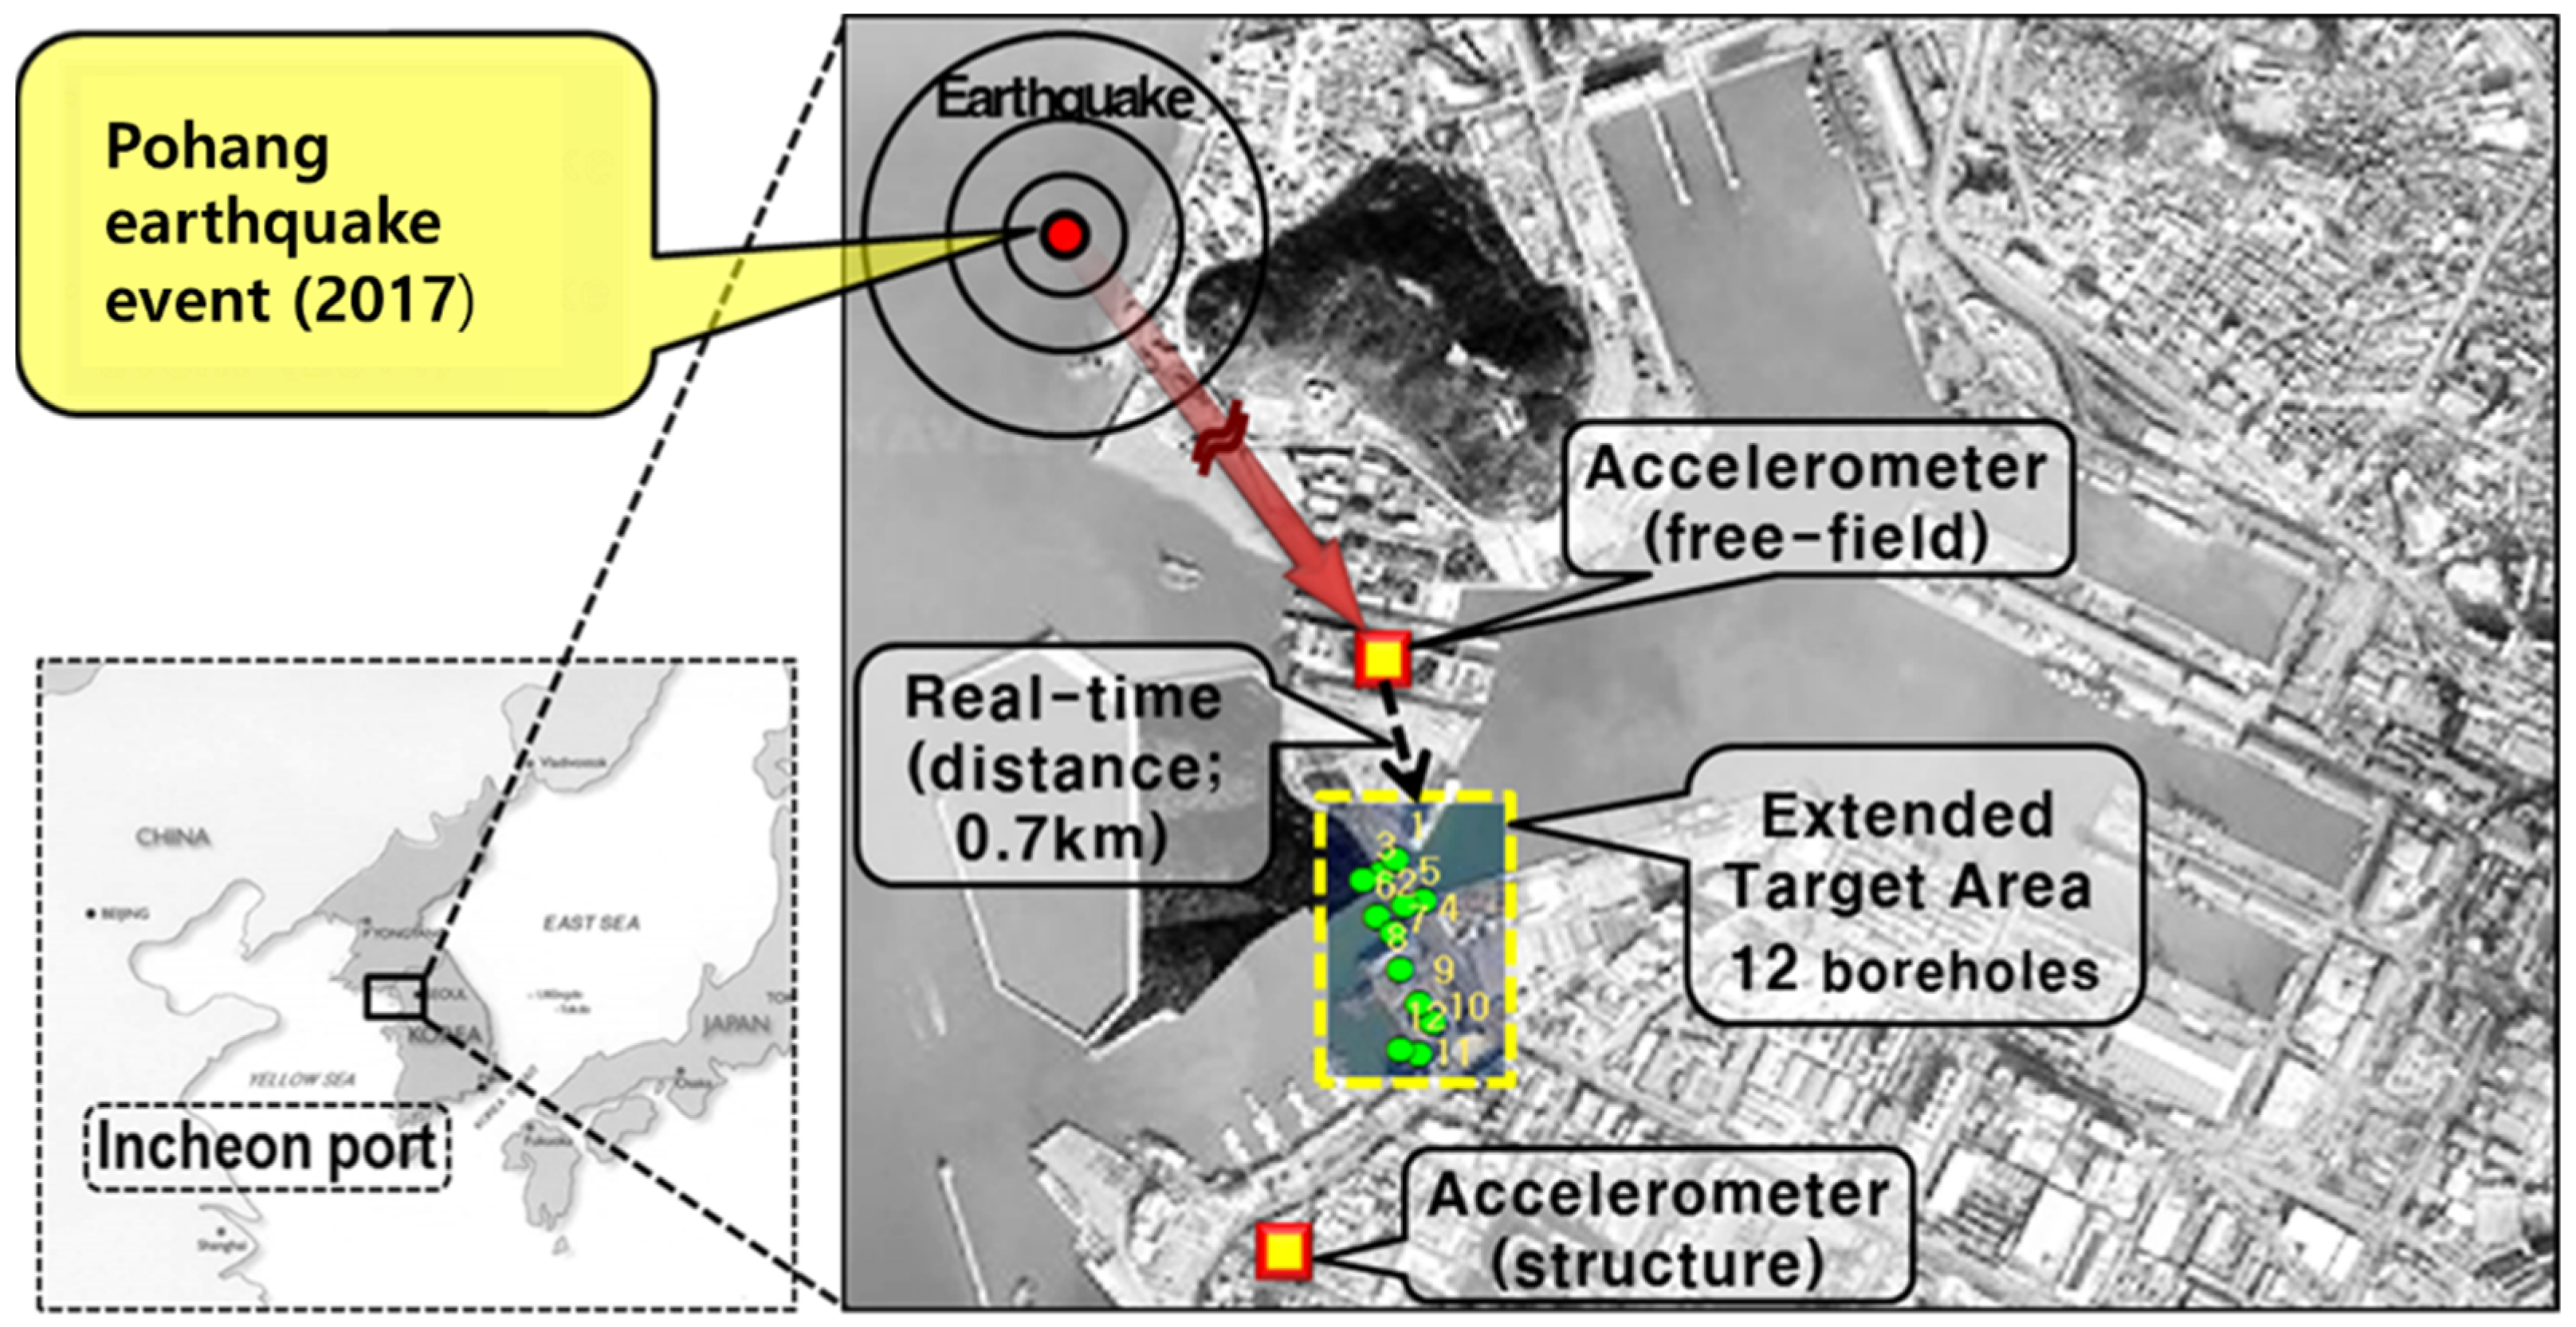
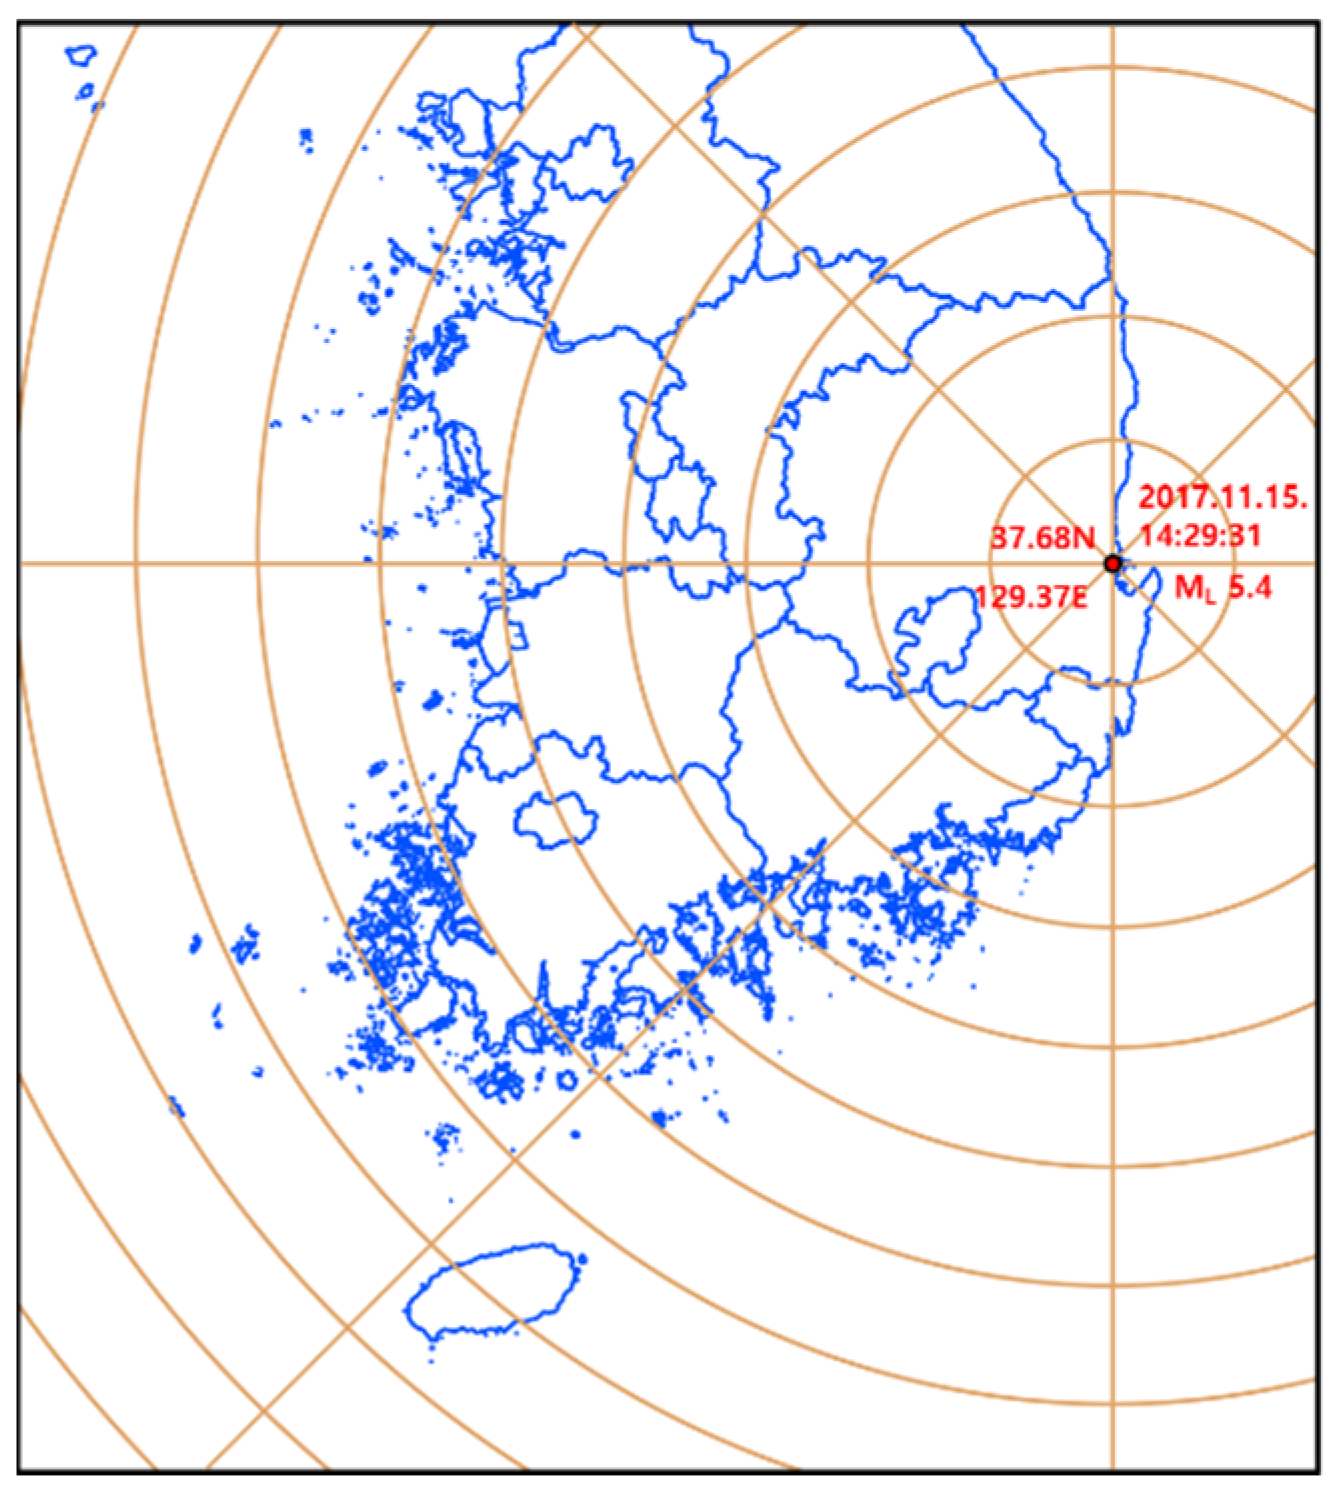
First, the geotechnical spatial grid is constructed based on the geostatistical method to estimate the site-specific site response to be correlated with the earthquake hazard potential. Second, the peak ground accelerations are determined from seismic load correlation and assigned to the geotechnical spatial grid. Third, the damage grade of the structure is determined by calculating the failure probabilities of defined damage levels and integrating the geotechnical spatial grids for the target structure in real time. A simulation of the proposed assessment was specifically conducted at Incheon Port, South Korea, using an actual earthquake event (2017 Pohang Earthquake) and a virtual earthquake scenario.
2. Methods
2.1. Framework Architecture
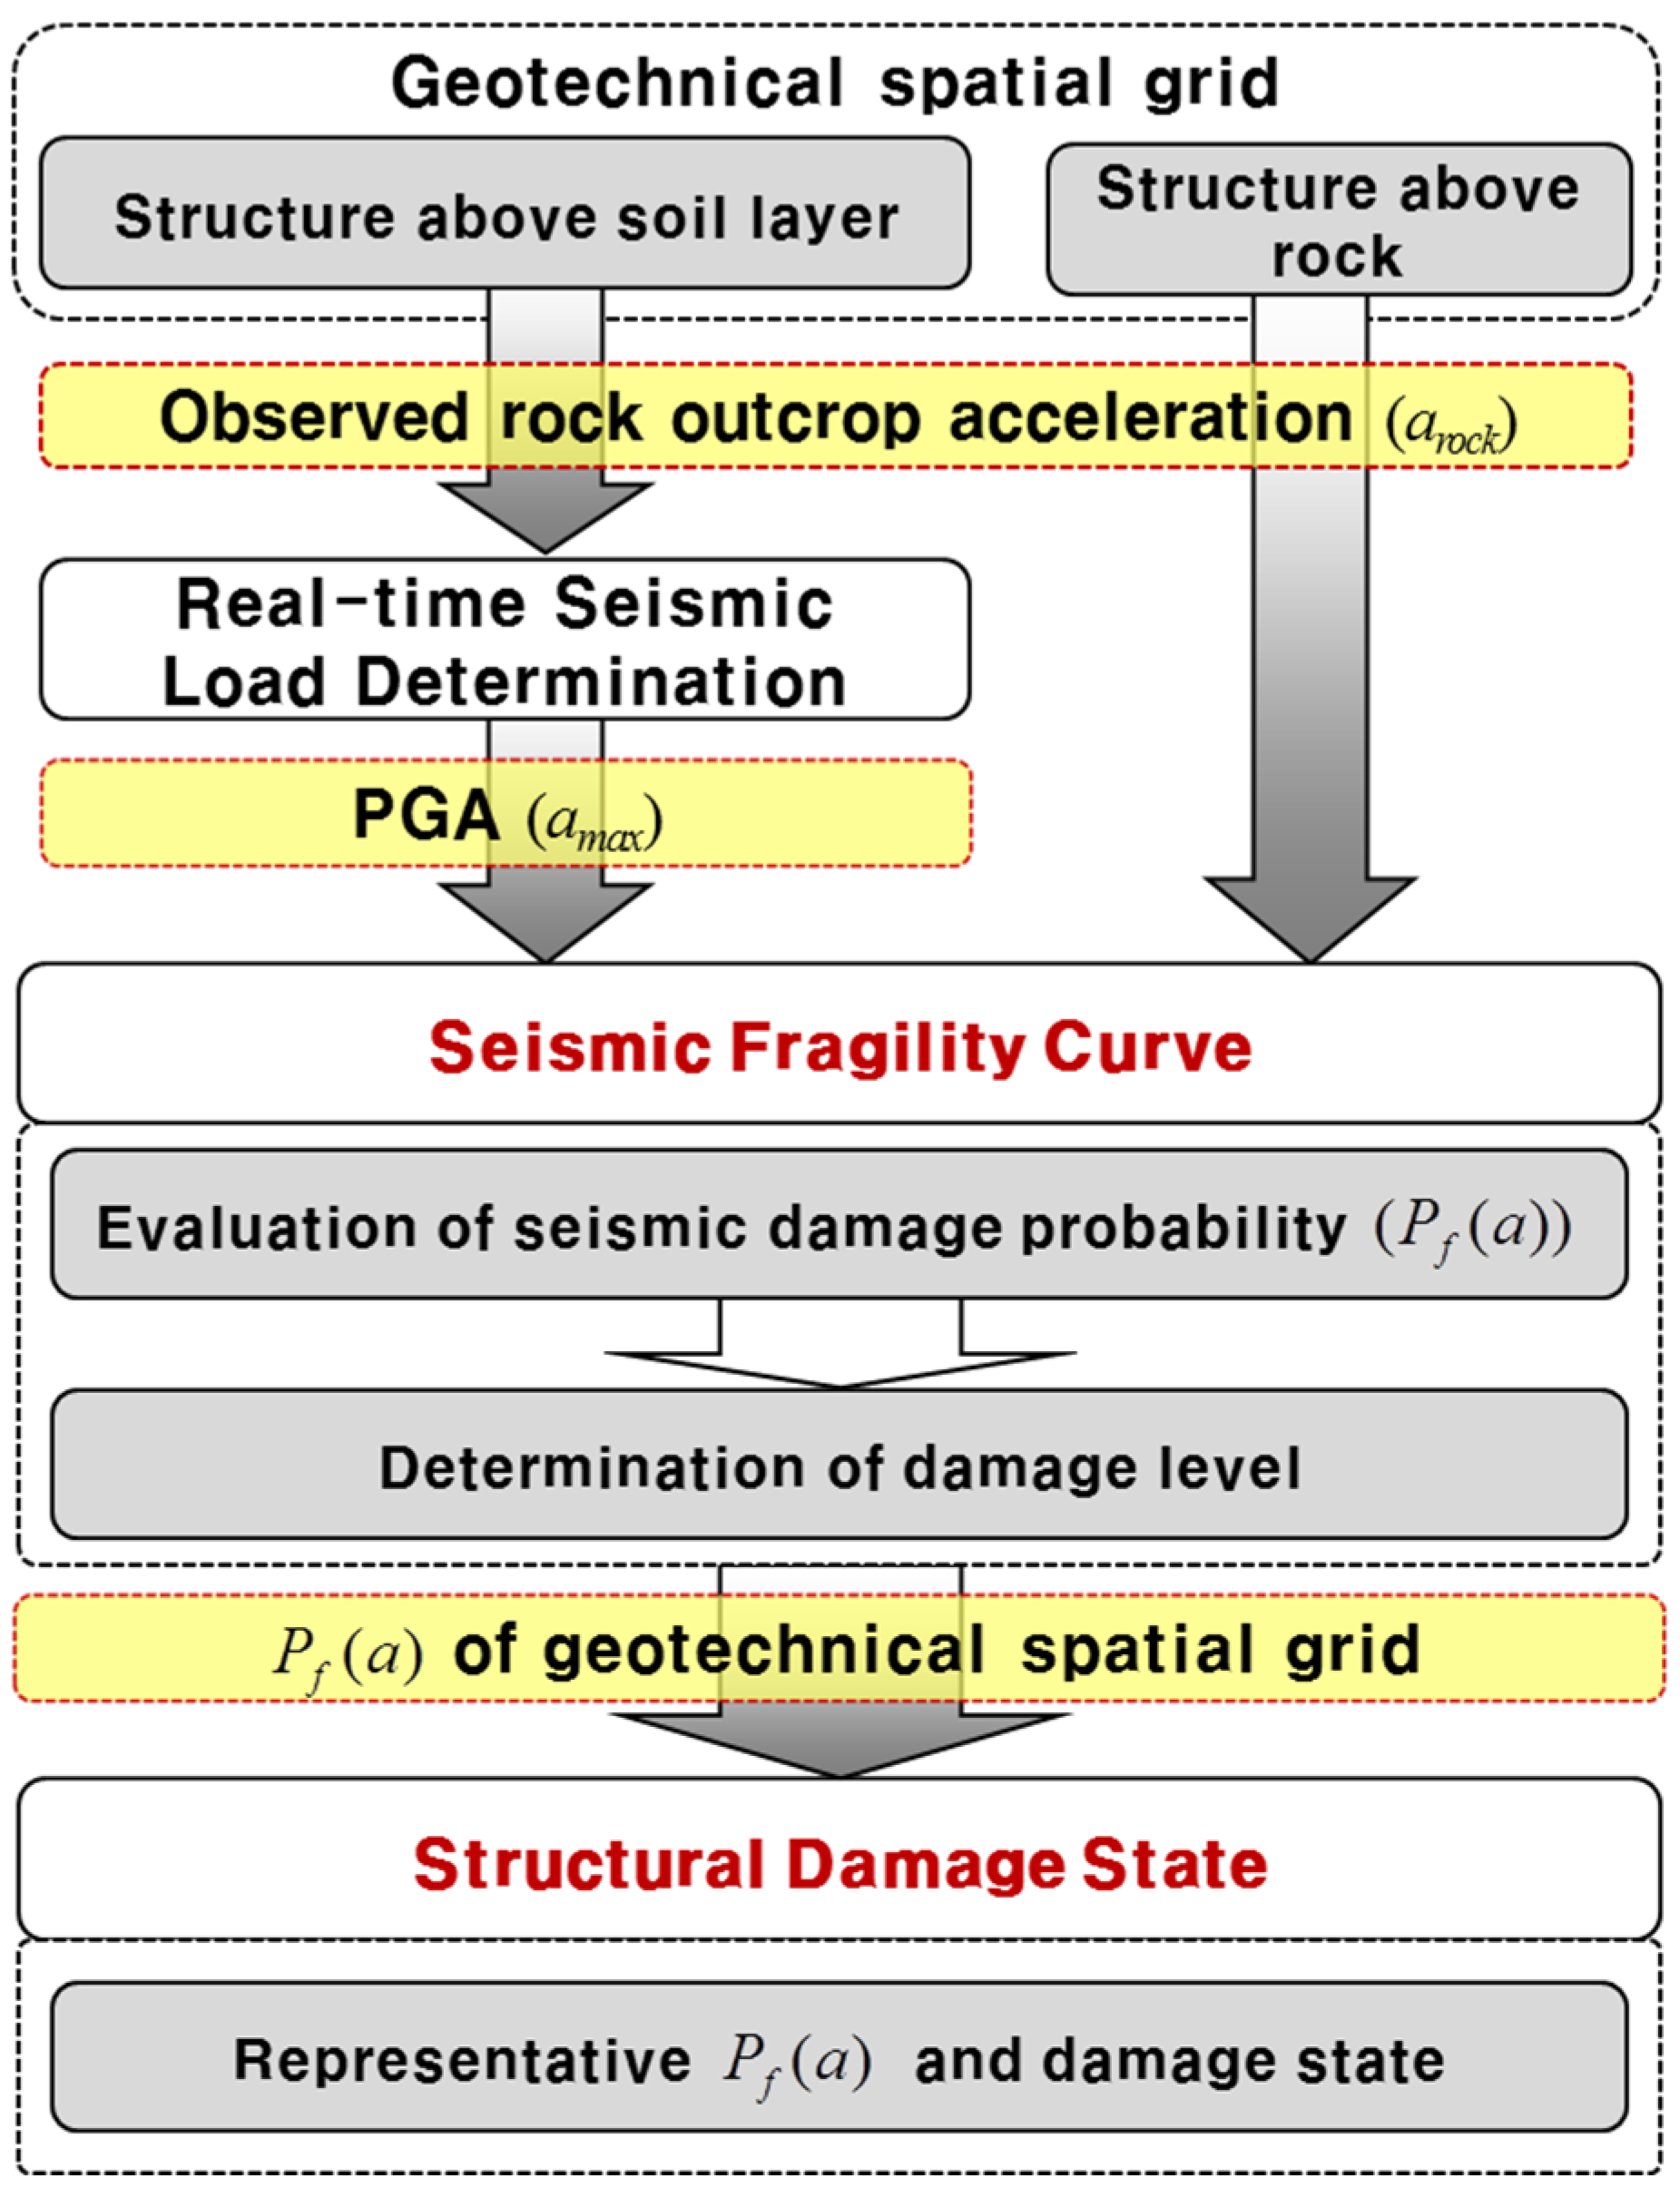
The proposed real-time spatiotemporal assessment framework for structural seismic fragility comprises three interdependent modules (geotechnical spatial grid construction, real-time seismic load determination, and structural fragility evaluation) integrated within a geospatial database environment. These modules are structured to operate in both pre-event preparation and post-event real-time assessment modes (
Figure 1) [
4].
In the first module, a three-dimensional (3D) geotechnical spatial grid is constructed based on geostatistical interpolation techniques. Ordinary kriging is employed using a spherical variogram model to interpolate borehole-derived soil classification and dynamic properties. This module incorporates geographic coordinates, geotechnical profiles (classified using the Unified Soil Classification System (USCS)), dynamic soil properties (shear wave velocity, shear modulus, and damping ratio), and structural attributes of the target infrastructure.
In the second module, seismic load correlations are developed by performing 1D equivalent-linear site response analyses using ProShake, employing recorded and synthetic ground motions across multiple rock acceleration levels (0.04 g to 0.50 g). For each geotechnical grid cell, peak ground acceleration (PGA) values are estimated from bedrock acceleration using a nonlinear regression model. The Box–Lucas exponential model was selected due to its capacity to capture soil nonlinearity. Correlation coefficients (a, b) for each soil layer were calibrated by minimizing the root mean square error (RMSE) between simulated and observed surface PGA values, with R2 values exceeding 0.85 in most cases.
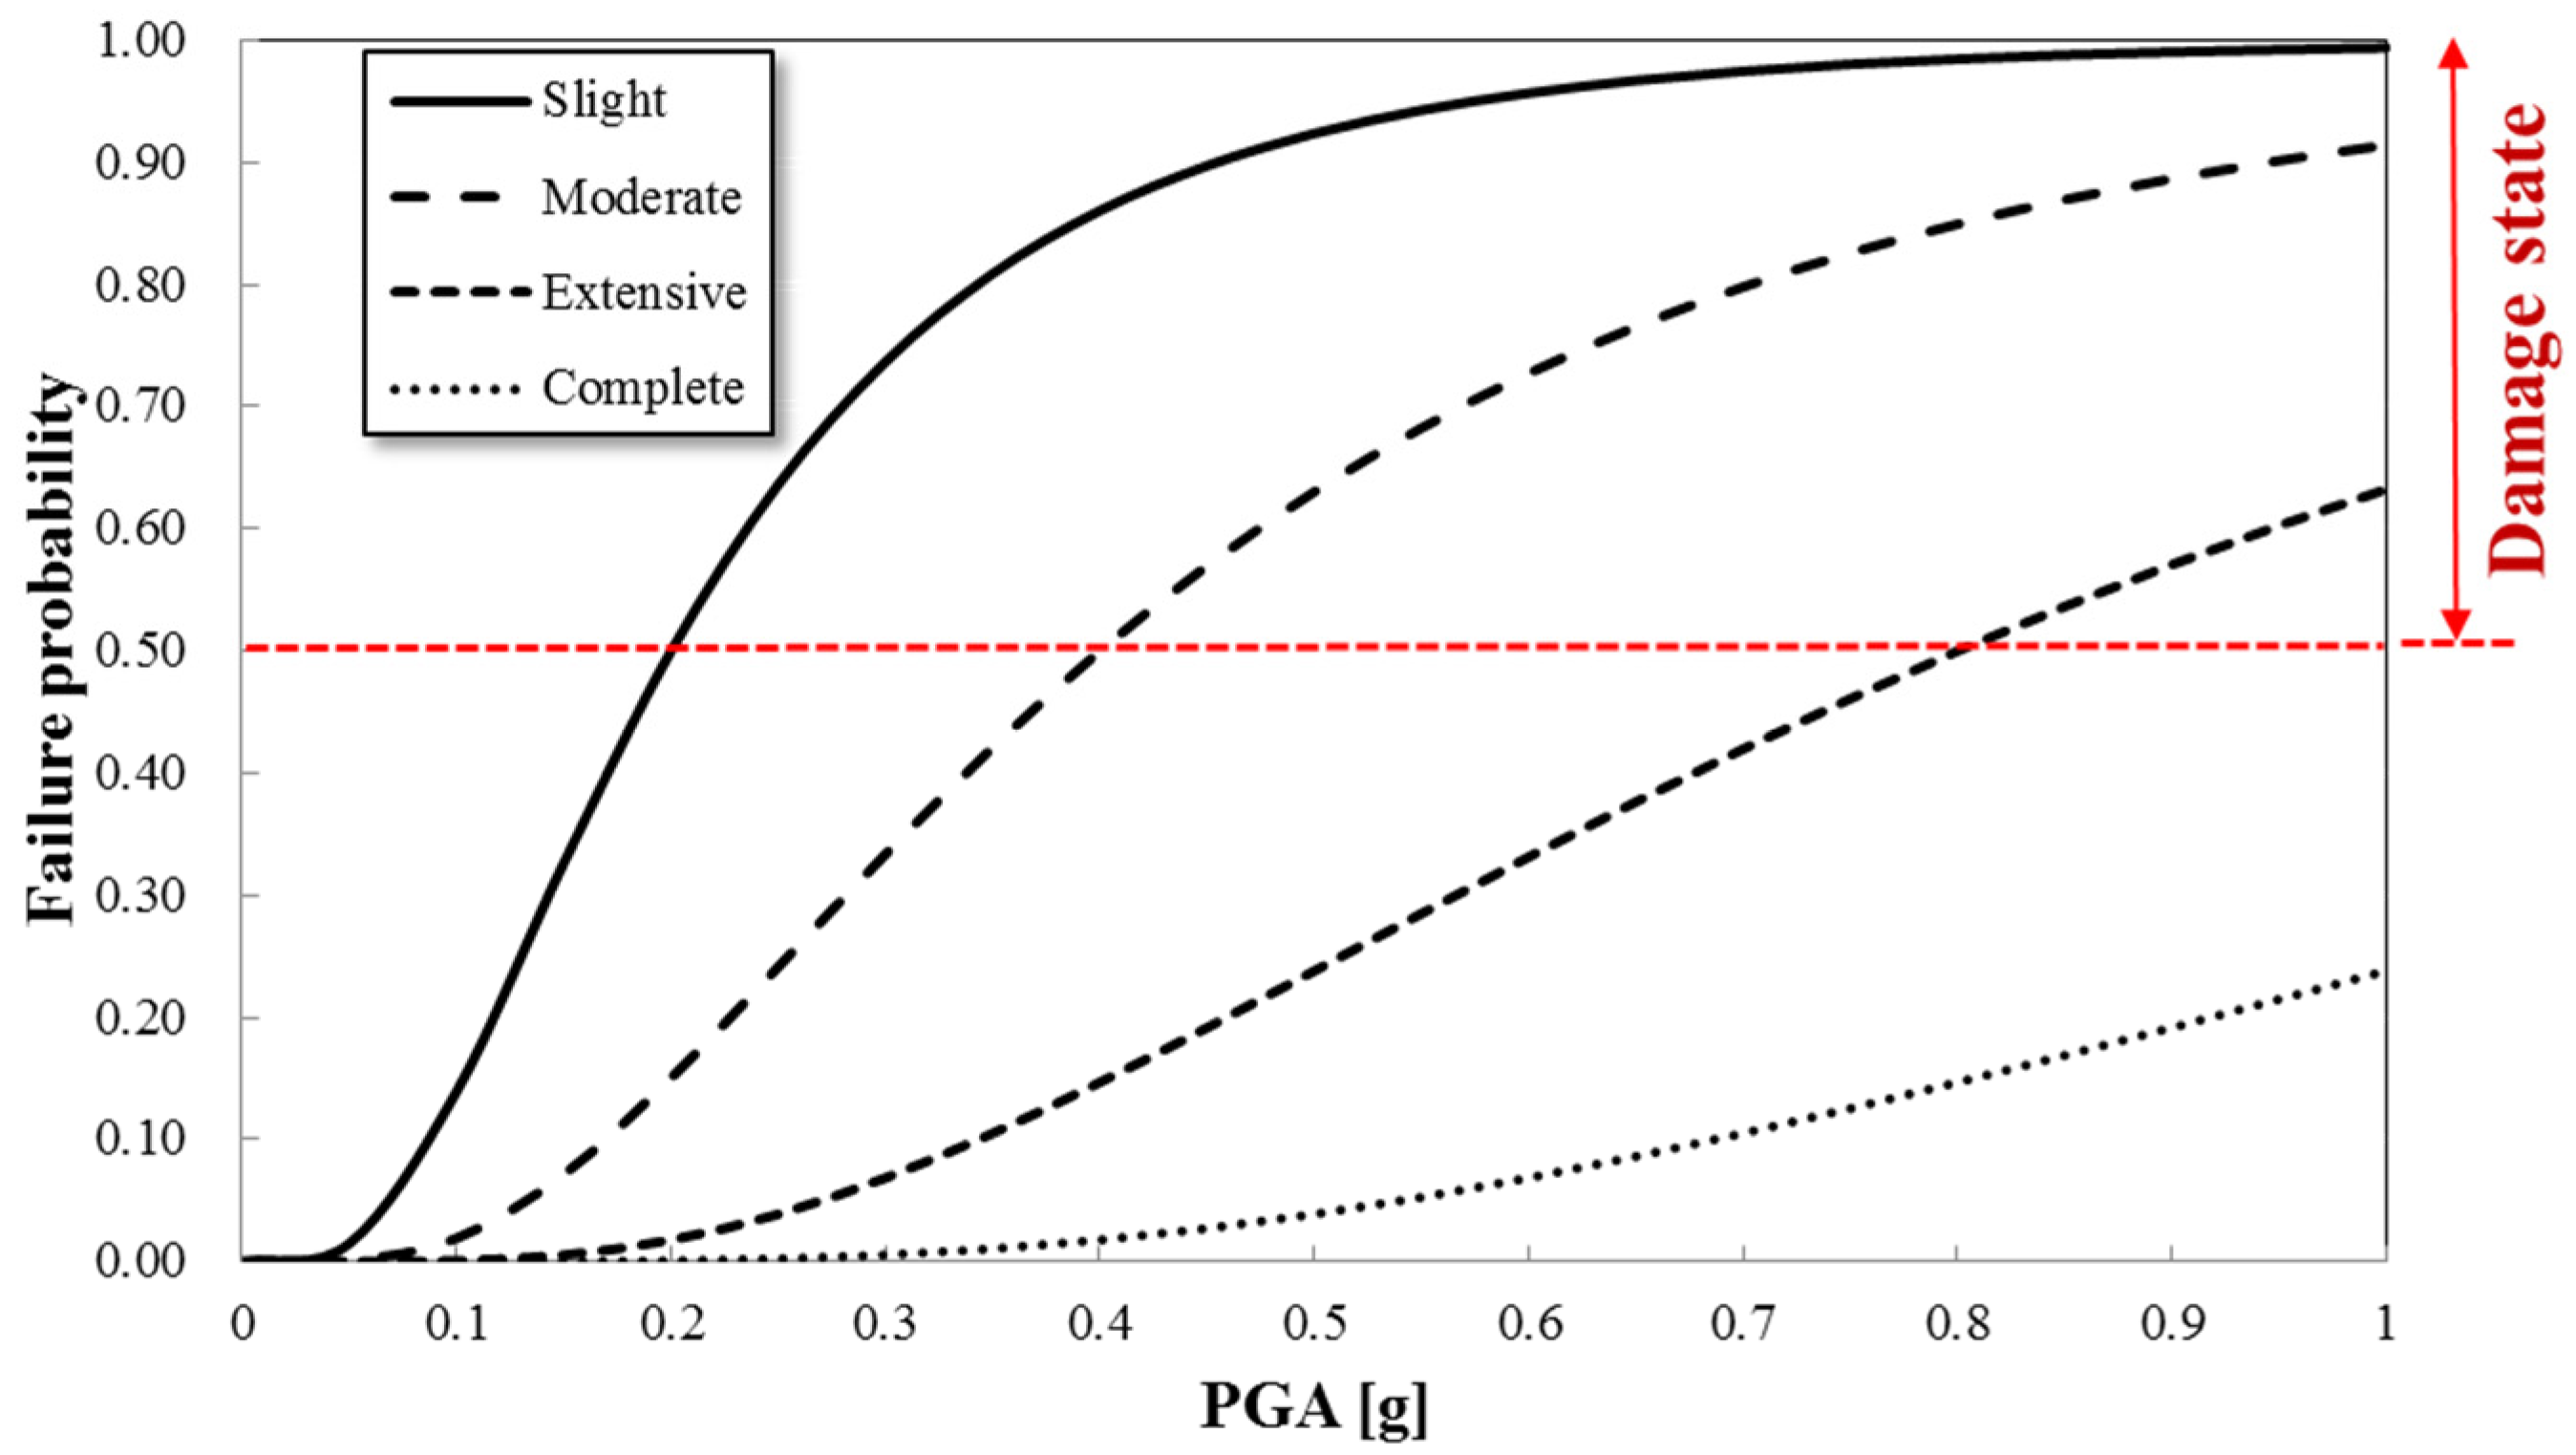
The third module applies seismic fragility curves to evaluate the structural failure probability. PGA values derived in real time are used as input intensity measures. Structures above soil layers utilize site-specific PGAs, while structures founded on bedrock use direct rock outcrop acceleration. Fragility curves are modeled as cumulative lognormal distributions, with median and dispersion parameters derived from empirical studies. Damage states are categorized as Slight, Moderate, Extensive, or Complete, with structural failure defined as exceeding a 50% probability of a damage state.
2.2. Event Triggering and Real-Time Data Exchange Between Seismic Monitoring and Fragility Assessment Systems
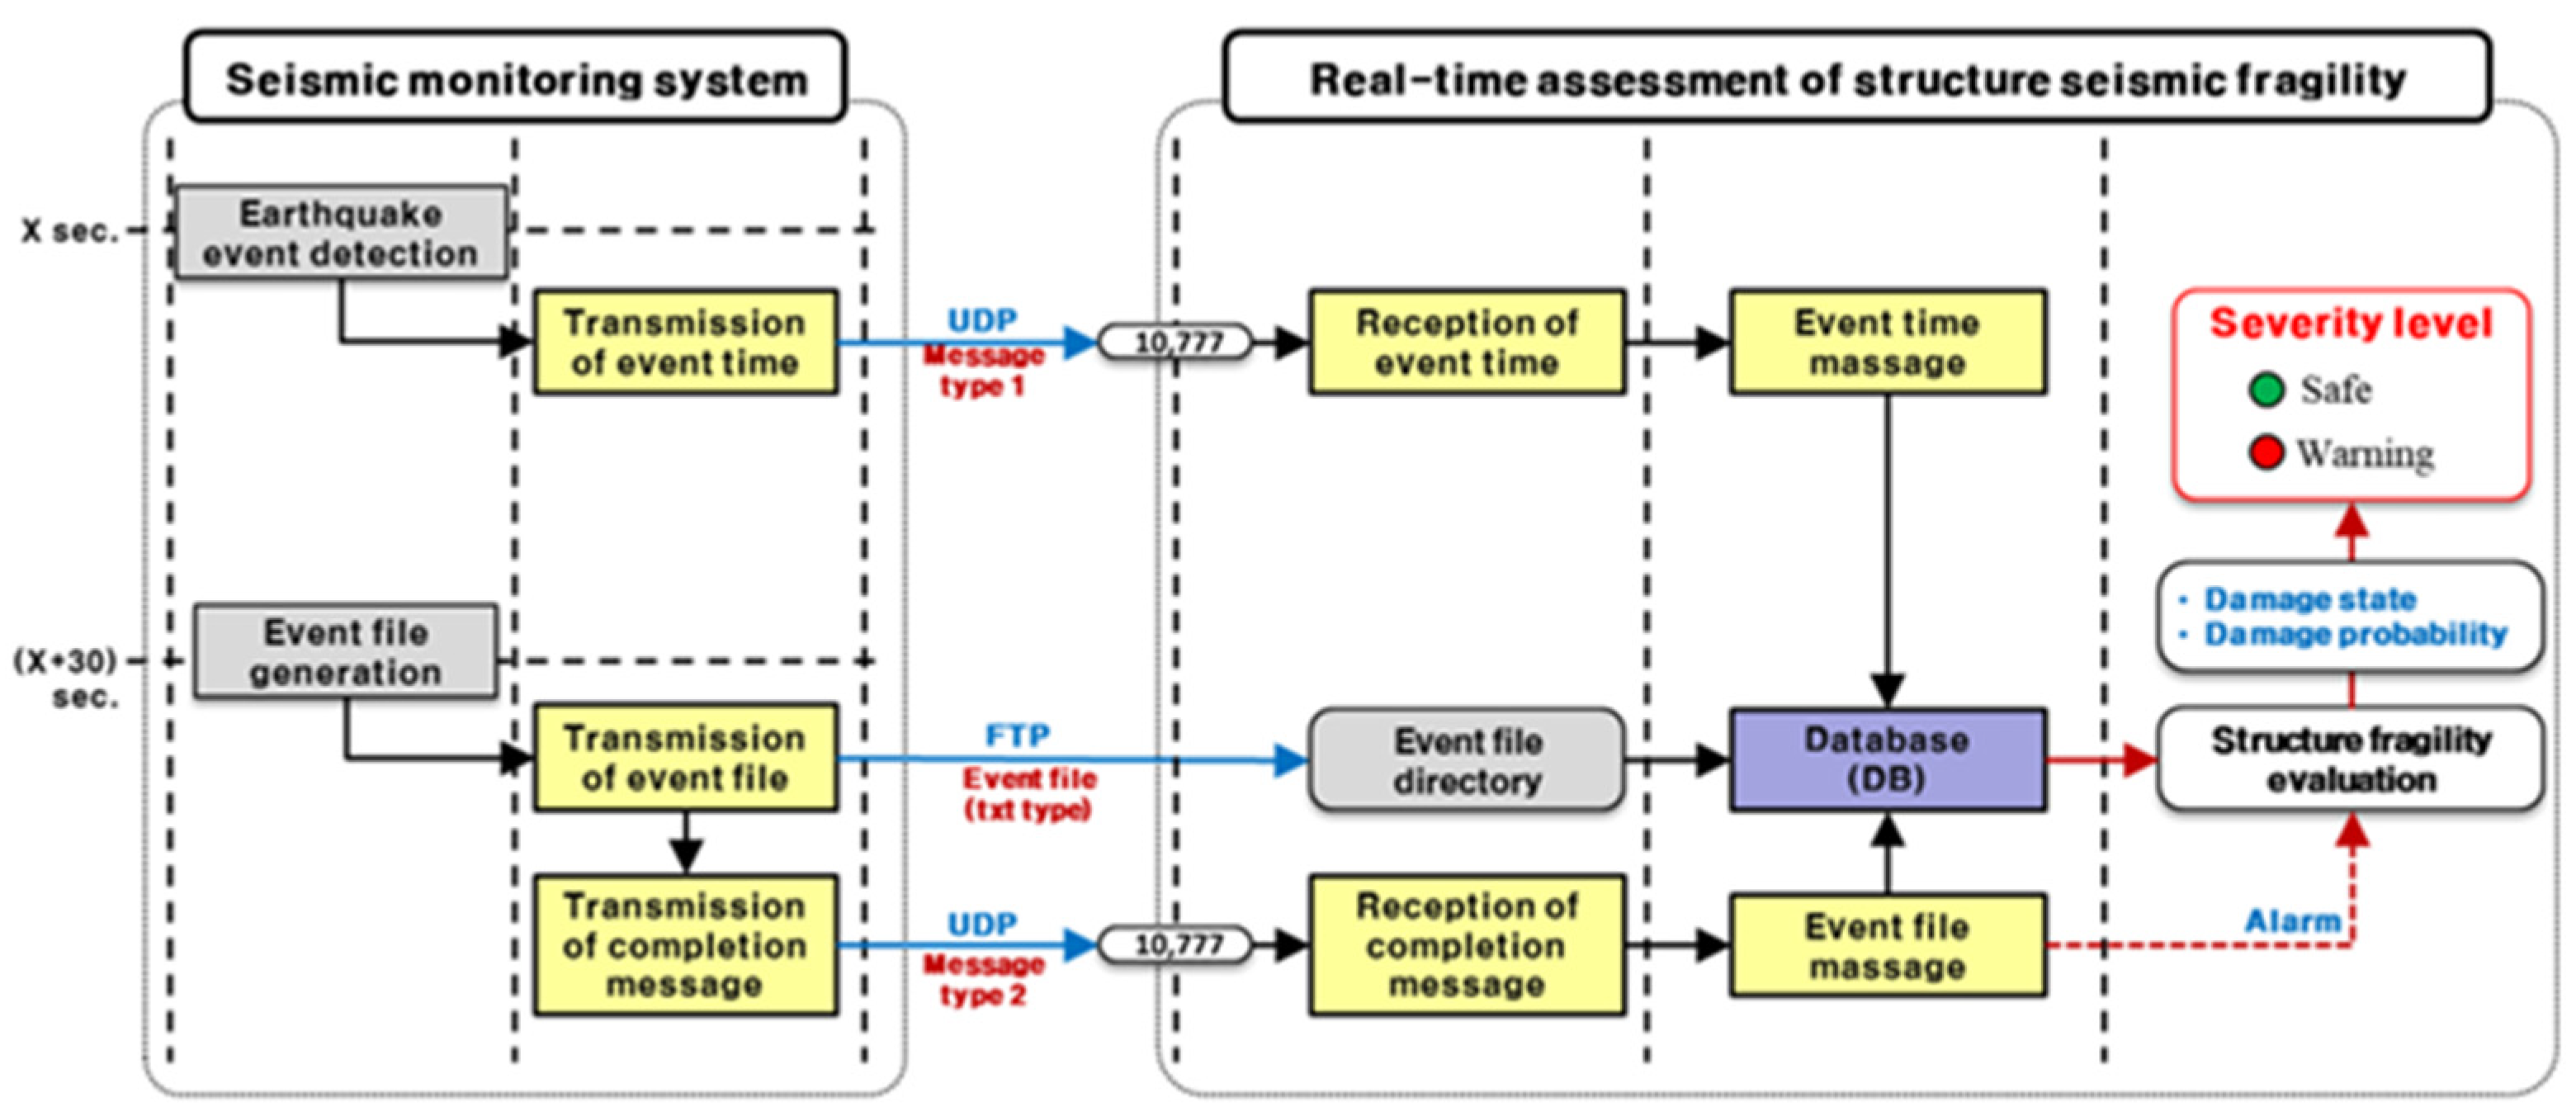
Upon seismic event detection, the monitoring system immediately generates a trigger message containing the event ID, timestamp, and acceleration time history. This message is transmitted via a UDP-based Type I protocol to the real-time structural fragility assessment platform. Concurrently, the corresponding acceleration file is created and transmitted through an FTP-based protocol to the designated event file directory on the assessment server. Following successful data delivery, a completion message is sent using a UDP-based Type II protocol, enabling synchronization across all components (
Figure 2).
The real-time assessment server—equipped with an Oracle-based spatially linked relational database—automatically ingests both the event metadata and raw acceleration files. These inputs initiate a sequence of automated processes including event parsing, seismic load estimation, and structural fragility evaluation. All intermediate steps, such as event time messaging and file registration, are timestamped and verified to ensure data integrity and synchronization.
This tightly integrated system architecture enables the ingestion, processing, and visualization of seismic hazard information to be completed within 50 s of the earthquake’s occurrence. The modular framework consists of sensor instrumentation (triaxial strong-motion accelerometers at the ground surface and structure base levels), digital data acquisition systems, automatic triggering modules, redundant data communication channels, and an uninterrupted power supply (UPS) for resilience during major events. All sensing units are GPS-synchronized to maintain sub-second accuracy in event time tagging, which is critical for correlating bedrock motion with the structural response. Its ability to deliver high-fidelity seismic hazard and structural fragility information within 50 s of an event’s occurrence enables informed and timely decision-making, especially in critical coastal infrastructure systems.
Seismic data are visualized through a GIS-based interface—currently implemented at key Korean ports such as Busan—enabling real-time system status monitoring and damage visualization. The generated fragility assessments are site-specific and use pre-stored geotechnical spatial grids and regression-based PGA estimates to produce hazard maps categorized by severity level (e.g., Safe, Warning).
Unlike general-purpose seismic networks, this system is explicitly designed to support spatiotemporally resolved evaluations of structural integrity by directly linking bedrock acceleration monitoring with surface motion prediction and fragility curve modeling. Its scalable and modular design supports rapid deployment and customization across a wide range of coastal infrastructure systems, offering a robust and resilient backbone for earthquake disaster management.
In summary, the described architecture establishes a reliable and efficient end-to-end workflow from seismic monitoring to real-time structural fragility assessment. Its ability to deliver high-fidelity hazard information within seconds enhances the decision-making capacity for emergency responses and post-earthquake structural verification in high-risk regions.
2.3. Geotechnical Spatial Grid Construction
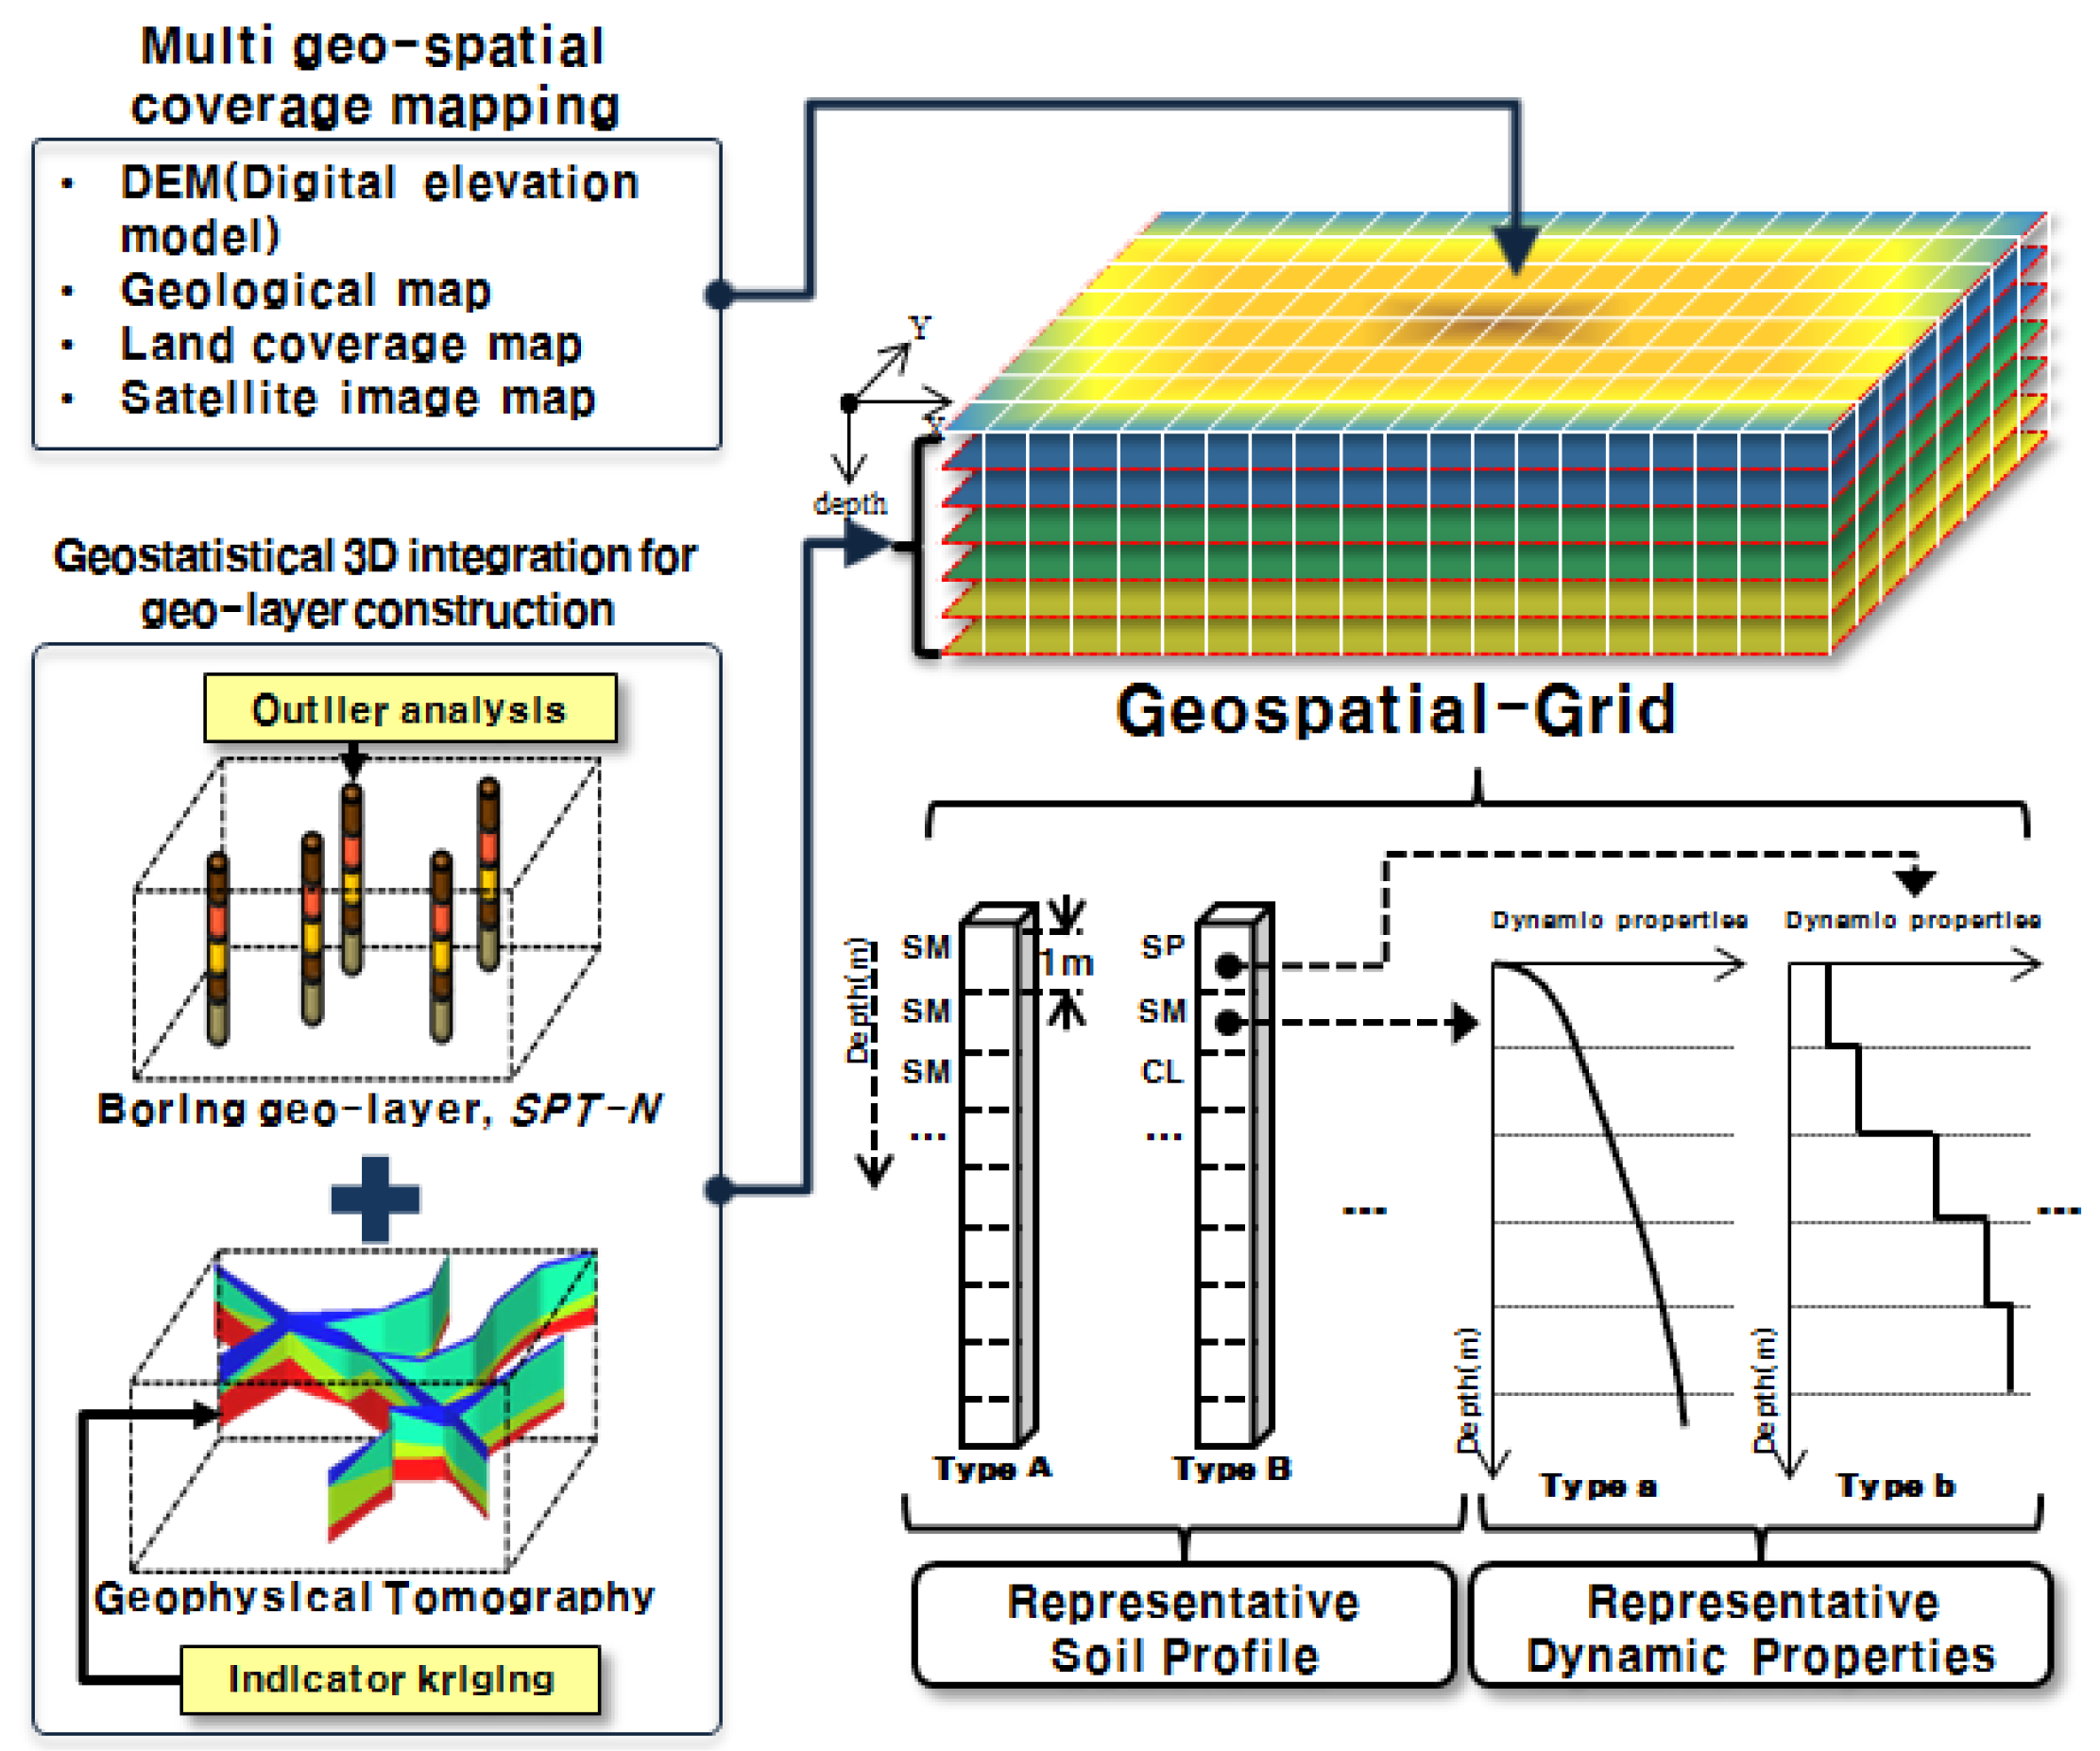
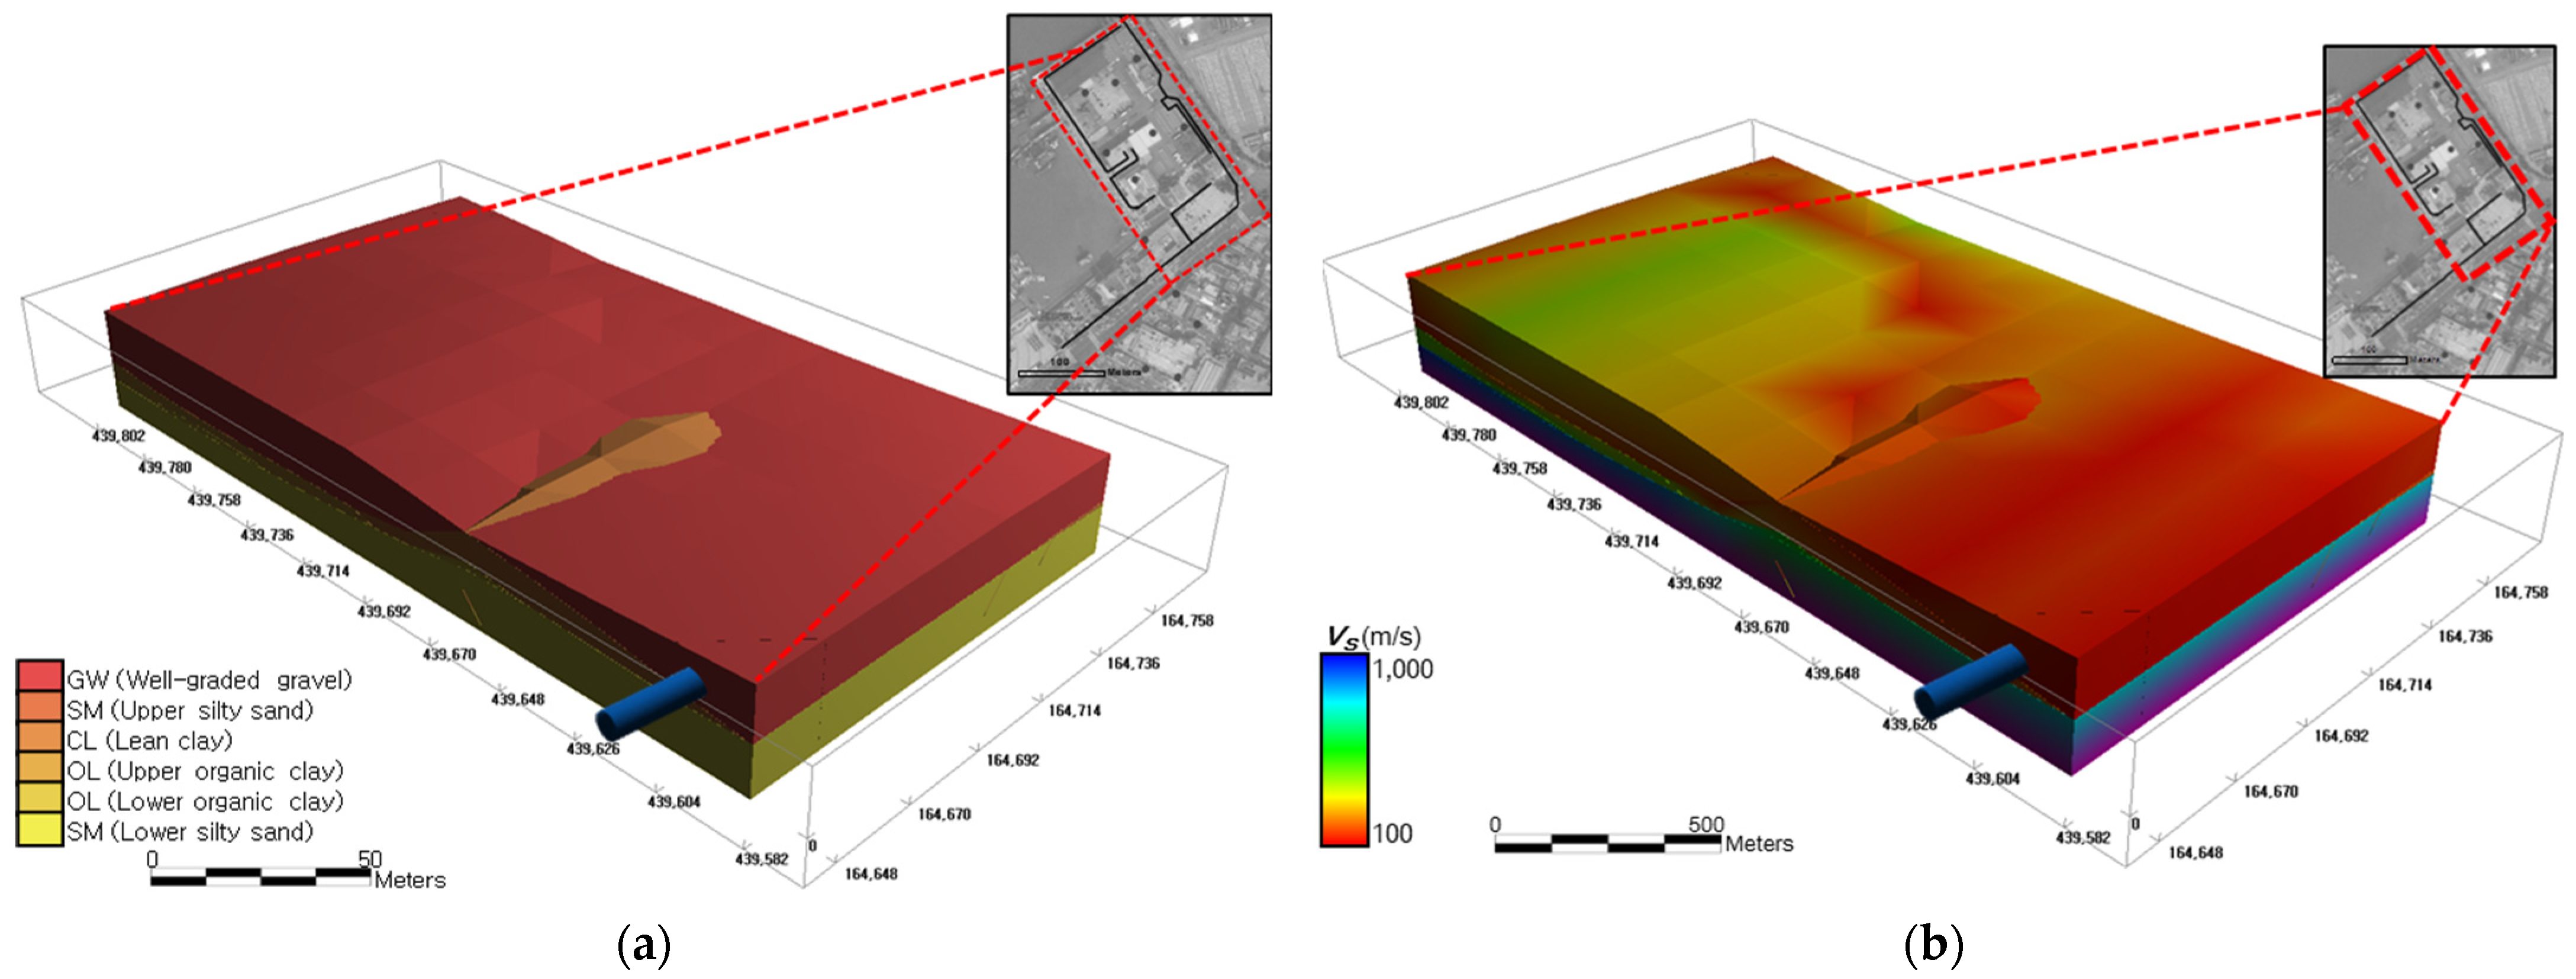
To enable site-specific assessment of seismic fragility, a geotechnical spatial grid is constructed using a geostatistical modeling framework that integrates surface coverage data, borehole logs, and geophysical imaging (
Figure 3). This spatial database stores stratified soil layers and the corresponding dynamic properties in a 3D structure, providing foundational input for ground response and real-time hazard evaluation modules.
Spatial grid construction begins with the incorporation of multiple surface layers, including digital elevation model (DEM), geological map, land cover classification, and satellite imagery layers. These datasets are spatially aligned using a unified coordinate system and digitized to form the upper boundary of the grid. The target area is discretized into uniform volumetric cells measuring 5 m × 5 m × 1 m to ensure a resolution suitable for structural-scale seismic modeling.
Subsurface information is obtained from borehole data and standard penetration test (SPT-
N) results collected across two designated zones. Since these data provide only one-dimensional profiles with limited spatial coverage, three-dimensional kriging interpolation is employed to estimate the lateral and vertical distribution of soil types. Prior to interpolation, outlier analysis is conducted to exclude anomalous data and enhance the statistical robustness of the model [
16]. All soil types are classified based on the USCS, and primary stratigraphic units—such as fill, sandy, clayey, and weathered soils—are delineated accordingly [
20,
21,
22,
23].
In areas with sparse borehole coverage or topographic complexity, such as boundary zones or hill slopes, additional geophysical tomography data are incorporated using indicator kriging to supplement the interpolated results [
3,
14,
15]. This hybrid approach reduces the potential for misclassification, such as predicting rock as soil, and improves the reliability of stratigraphic predictions at the domain edges.
For each classified soil unit in the grid, dynamic geotechnical properties are assigned, including shear wave velocity (
VS), normalized shear modulus, and material damping ratio. These values are obtained from in situ testing data and literature-based correlations. In particular,
VS is estimated by interpolating SPT-
N values through ordinary kriging and applying the empirical correlation proposed by Sun et al. [
17], thereby linking field measurements to seismic response properties.
The final geotechnical spatial grid also includes a surface coverage layer derived from the DEM and thematic maps. These topographic and thematic datasets, such as geological and land use maps, are digitized and aligned with the geotechnical layers to allow for comprehensive spatial querying. All information is stored in a GIS-compatible format, enabling the visualization and retrieval of site-specific data under real-time processing conditions.
Once the geospatial grid is constructed, it is integrated into the central hazard analysis system. During an earthquake, recorded acceleration signals are transmitted to the system, and site-specific ground conditions—stored in the geotechnical spatial grid—are retrieved in real time to compute the site response and structural fragility. This spatial modeling approach significantly improves the resolution and reliability of seismic hazard predictions, especially in data-scarce regions, and establishes a robust basis for adaptive and scalable disaster risk assessment.
2.4. Real-Time Seismic Load Determination
To support immediate estimation of seismic demand following an earthquake, the proposed framework incorporates a real-time seismic load determination module that is directly triggered by seismic event detection through the sensor-based monitoring network described in
Section 2.2. Upon receipt of real-time ground motion data—specifically rock outcrop acceleration values transmitted via the sensor network—the module utilizes pre-established nonlinear regression models to estimate corresponding peak ground accelerations (PGAs) at the surface across the geotechnical spatial grid.
These regression models were calibrated in advance through one-dimensional site response analyses and are stored within the database-linked spatial grid. By referencing these empirical relationships, the system eliminates the need for computationally intensive site response analysis during the event, which is generally infeasible under strict time constraints. As a result, site-specific seismic demand can be rapidly computed and supplied to the structural fragility evaluation module within seconds of event occurrence, thereby enabling spatiotemporally synchronized hazard assessment across the monitoring and response systems [
24].
The correlation models were established through a series of site response analyses performed in advance using the equivalent-linear method implemented in ProShake [
25], a widely accepted 1D site response program. Input ground conditions for the analyses were defined based on the geotechnical spatial grid, including soil classification and dynamic soil properties such as shear wave velocity, shear modulus, and damping ratio.
To represent a wide range of seismic shaking intensities, nine discrete levels of input rock outcrop acceleration were considered, ranging from 0.04 g to 0.50 g. The ground motion inputs included three representative acceleration time histories: Hachinohe (short-period dominant), Ofunato (long-period dominant), and an artificial wave with broadband characteristics [
24,
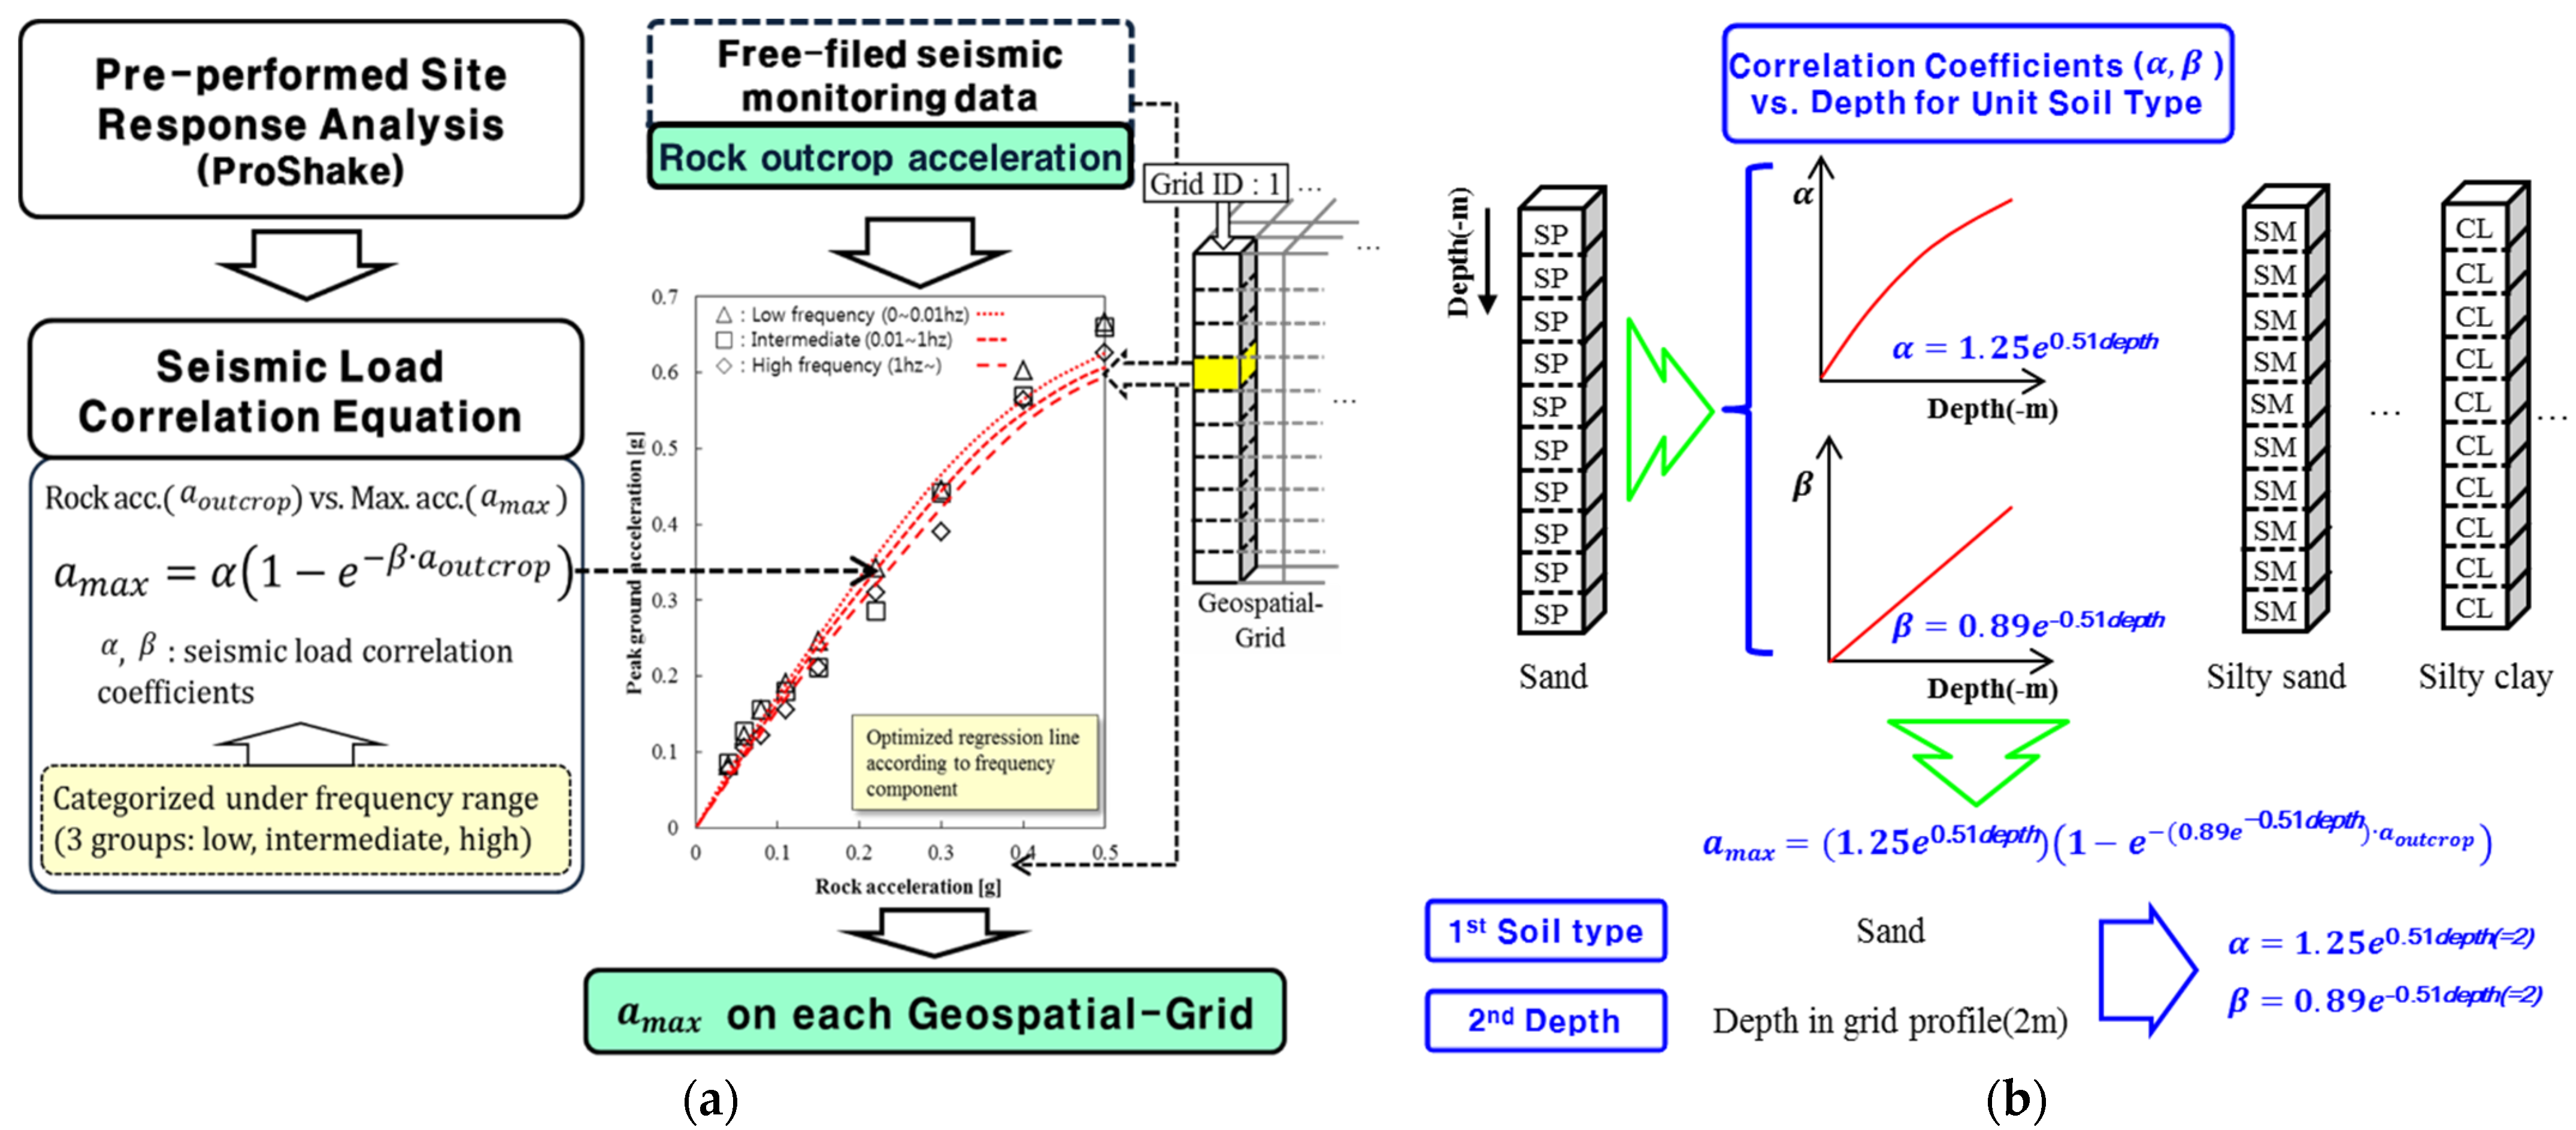
26]. For each geospatial grid cell, 27 site response simulations were conducted (9 acceleration levels × 3 input motions), and corresponding surface PGA values were calculated. These data were then used to develop nonlinear regression models describing the correlation between the input rock acceleration
and the resulting layer peak acceleration
(
Figure 4).
The regression model adopts the Box–Lucas exponential function [
27]:
where
denotes the peak ground acceleration of each layer,
represents the measured rock acceleration, and
and
are correlation coefficients, respectively. The correlation equations are incorporated into the geotechnical spatial grid, enabling real-time determination of PGA from the measured rock acceleration [
3].
To streamline this process for broader-scale applications, and to reduce the computational demand for each individual cell, the regression models were further normalized by soil classification and depth using generalized correlation coefficient functions. Specifically, the variation in
and
with depth was statistically modeled for each USCS soil type using exponential regression (
Figure 4) [
4,
28]:
As a result, once the soil type and depth are identified from the geotechnical grid, the corresponding coefficients and can be immediately computed and applied. This two-step approach—soil-type first, depth second—ensures rapid retrieval of correlation parameters and facilitates scalable real-time seismic load estimation across complex infrastructure networks. This formulation enables rapid, automated calculation of the PGA at each grid cell using only the measured rock outcrop acceleration and local soil profile. The derived correlation equations are stored in the geotechnical spatial grid database and are invoked automatically during real-time operation. When a seismic event occurs, free-field accelerometers measure the rock outcrop acceleration in real time. This input is passed into the grid-based correlation model, returning site-specific PGA values for each geospatial cell, which are then used as the seismic demand in fragility assessment.
2.5. Real-Time Structure Fragility Evaluation
To evaluate structural vulnerability in real time during seismic events, a fragility-based assessment framework was developed that directly links observed or derived ground motion parameters to a structural damage probability. This approach leverages the geotechnical spatial grid system to assign a site-specific seismic loading, which is then propagated through predefined fragility functions to estimate the structural response (
Figure 5).
Structures are broadly classified into two types based on subsurface conditions: those founded on soil layers and those directly on rock. For soil-founded structures, the fragility assessment is based on the site-amplified peak ground acceleration (PGA) derived from the seismic load correlation model. For rock-founded structures, the input motion is the observed rock outcrop acceleration directly transmitted from free-field accelerometers.
The seismic fragility function expresses the conditional probability of structural damage exceeding a certain level, given a specified seismic intensity measure. While several indices, such as spectral acceleration (Sa) and spectral displacement (Sd), are common, PGA was adopted in this study for its simplicity and compatibility with the spatial correlation model. The general form of the fragility function is:
where
is the probability of exceeding damage level
for an earthquake with an intensity of
, D denotes the effect of the load by the earthquake, and
is the strength of the structure for damage level
.
Appropriate indices representing structural damage should be selected. The fragility function follows a cumulative lognormal distribution and is typically expressed as:
where
is the damage probability of the structure at
,
denotes a Gaussian cumulative lognormal distribution function,
is the median of the PGA at the ground surface,
is the PGA of the earthquake, and
is the standard deviation of the log value of the PGA at the ground surface [
4].
Using the real-time seismic load (either the
or grid-based
), the corresponding damage probability
is calculated per geospatial grid cell. The damage grade is then classified based on whether the exceedance probability at each damage level surpasses a predefined threshold (typically 50%). If multiple damage states exceed this threshold, the highest severity state is assigned as the structural condition. For example, if the probabilities for ‘Slight’ and ‘Moderate’ damage are both above 50%, the structure is assigned a ‘Moderate’ grade [
4,
24].
Figure 6 illustrates a representative fragility curve for unreinforced concrete structures, where the relationship between PGA and various damage states (Slight, Moderate, Extensive, and Complete) is plotted. The red dashed line indicates a real-time evaluation of the PGA, which intersects the fragility curves to identify corresponding damage probabilities.
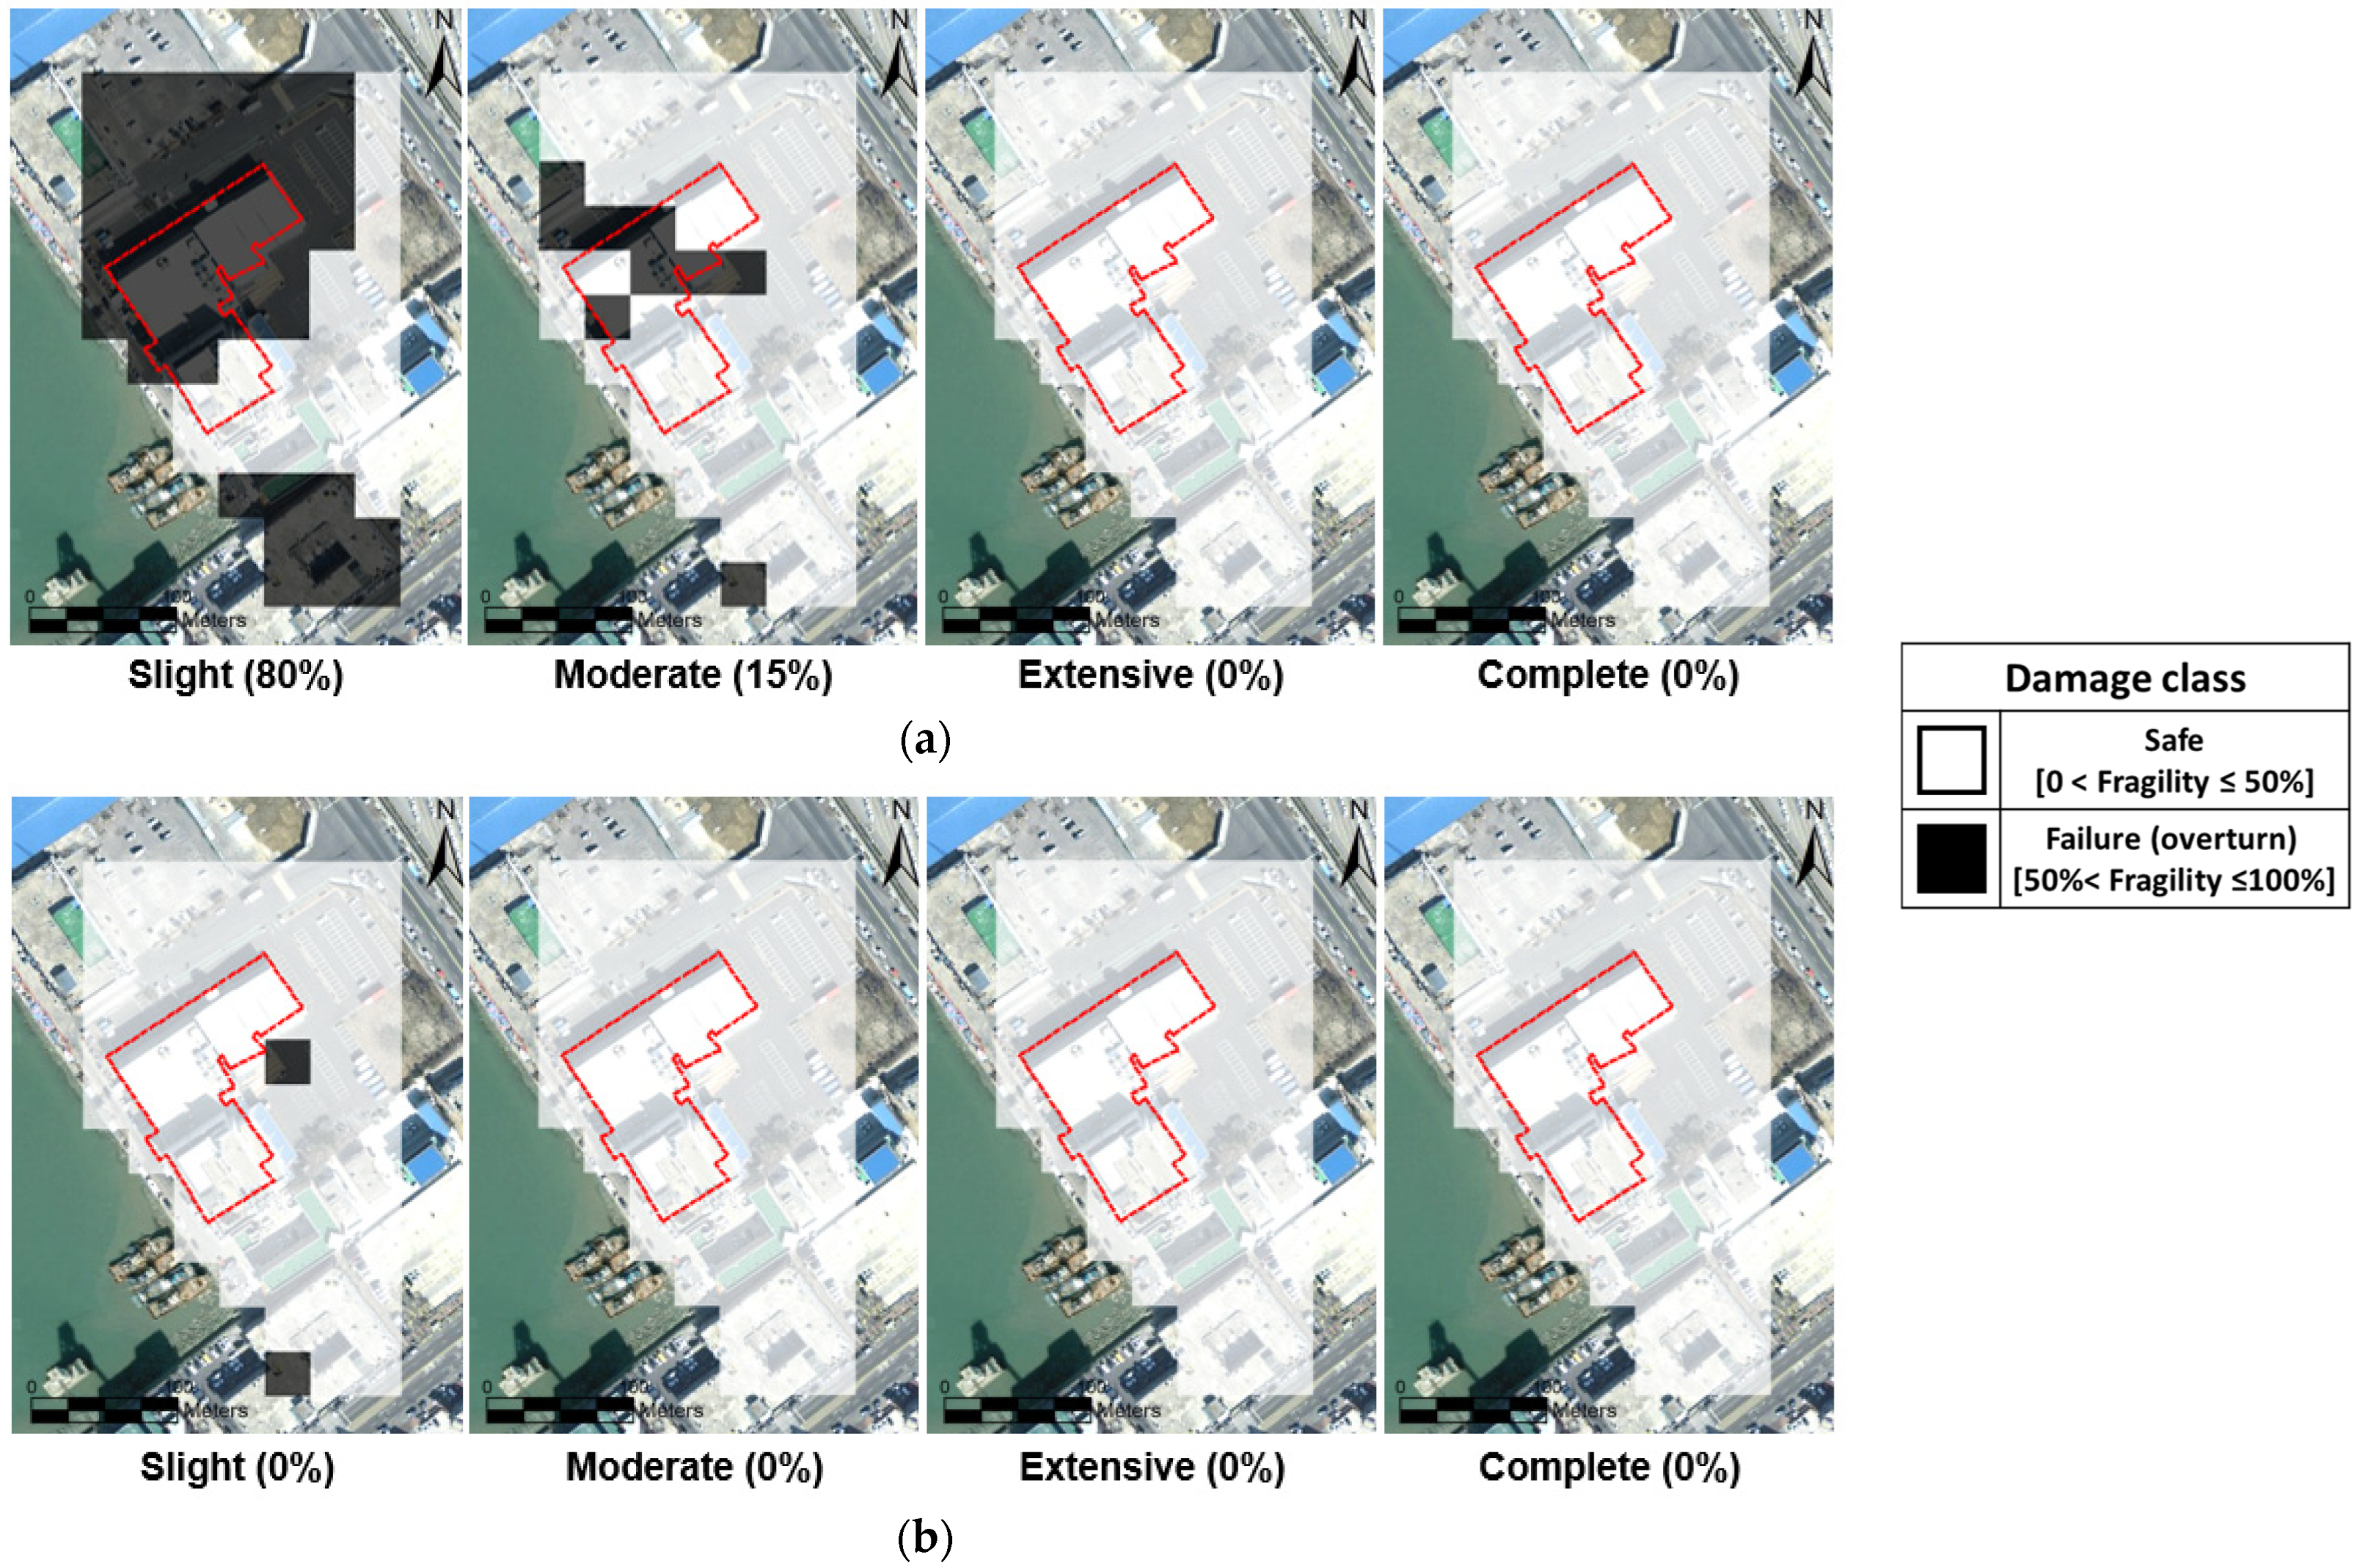
The final structural damage classification for a facility is determined by the areal dominance of critical damage grades across the geotechnical spatial grid. That is, if more than 50% of the total structural footprint is occupied by cells with a damage state exceeding ‘Moderate’, the overall structural state is labeled a ‘Failure’. This spatial aggregation approach allows for a coherent representation of distributed damage and supports decision-making for emergency responses and retrofitting prioritization.
Unlike traditional post-event assessments, this framework enables automated, near-instantaneous estimation of seismic damage by fusing real-time sensor input with pre-parameterized fragility curves and spatial ground condition databases. The methodology is scalable to urban and port infrastructure, and its rule-based interpretation logic is compatible with national seismic monitoring systems.
4. Discussion
The purpose of this study was to develop and validate a real-time assessment framework for the seismic fragility of structures, applied to Incheon Port in South Korea. This framework integrates geotechnical spatial grid construction, real-time seismic load determination, and structure fragility evaluation using a GIS platform. The findings offer several key insights and implications for seismic hazard management and structural safety assessment.
4.1. Interpretation of Key Findings
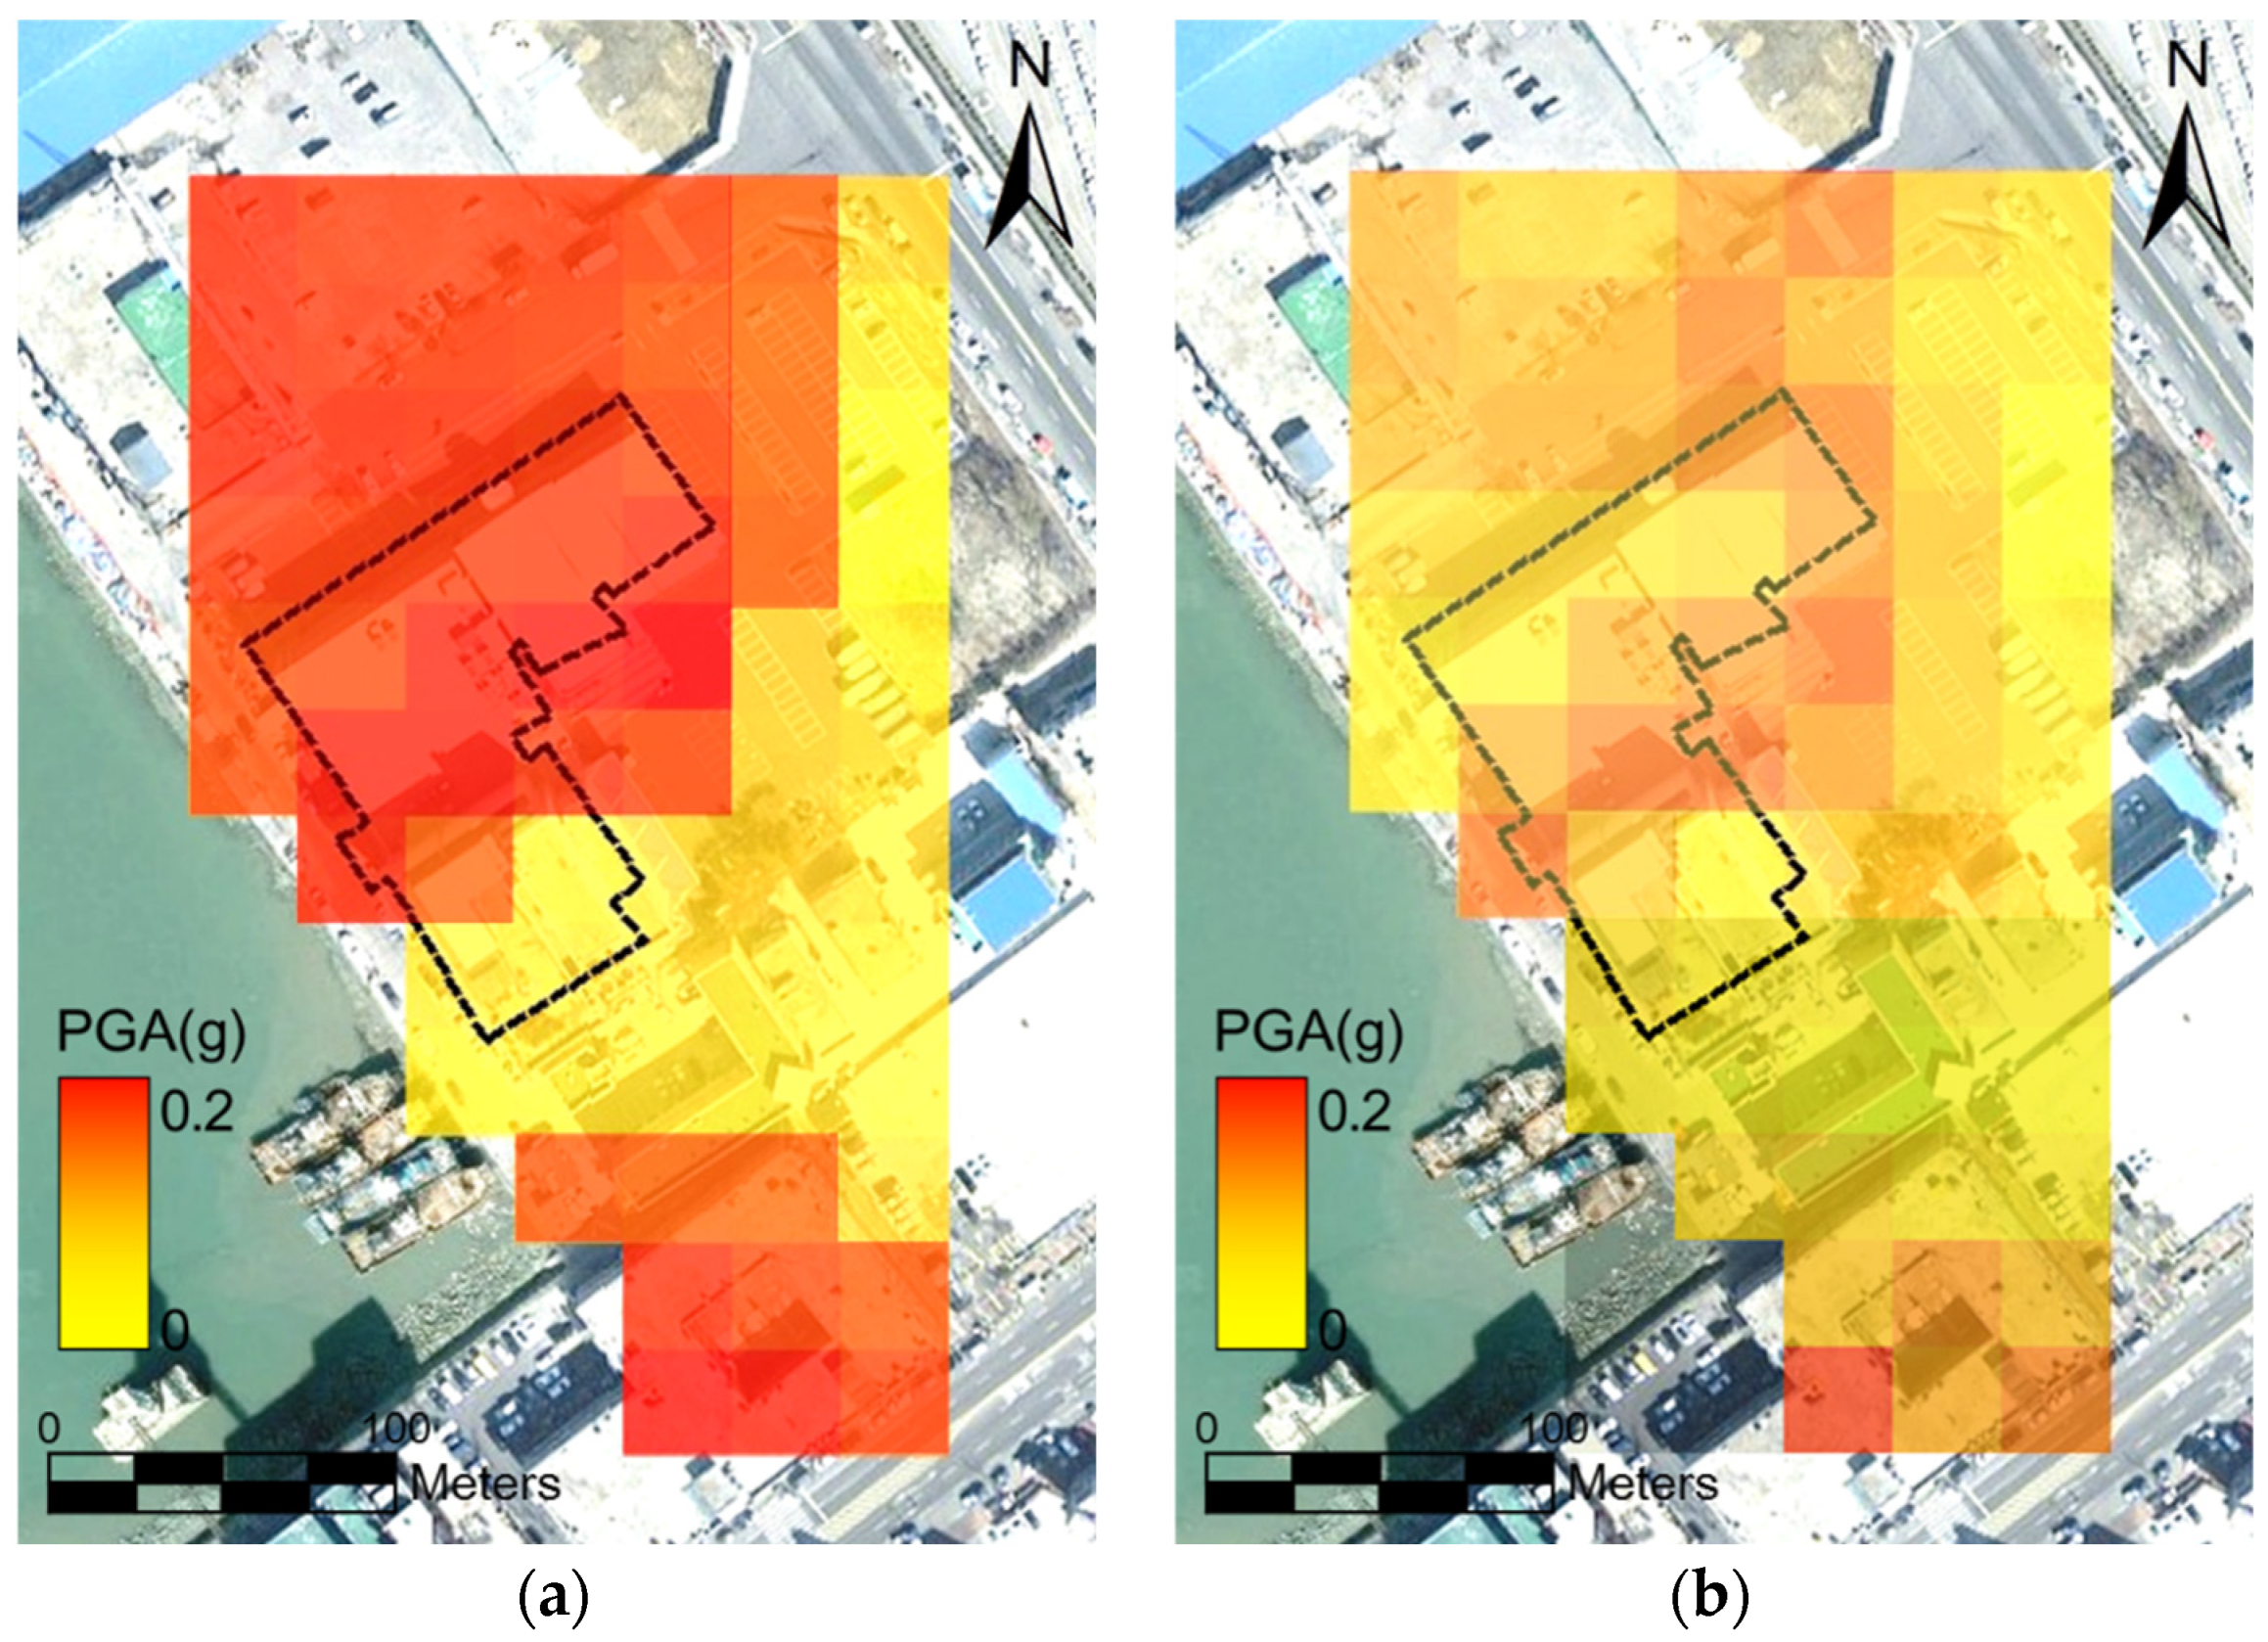
The results demonstrate that the proposed framework effectively assessed the structural fragility of the passenger terminal under both real and hypothetical earthquake scenarios. For the hypothetical Pohang earthquake, the majority of the study area was classified as being in a “Slight” damage state, while the real Pohang earthquake scenario showed no significant structural damage. These findings suggest that the local site-specific conditions, including soil properties and seismic amplification effects, play a crucial role in determining the seismic vulnerability of the structure.
The application of kriging interpolation and geotechnical spatial grids provided a comprehensive understanding of the spatial variation in seismic hazards. By accounting for bedrock depth and soil conditions, the framework captured the amplification effects accurately, leading to more reliable fragility predictions. This highlights the importance of incorporating site-specific geotechnical data into seismic fragility assessments for coastal infrastructure.
4.2. Implications for Structural Safety and Seismic Risk Management
The framework’s ability to generate real-time fragility hazard maps has significant implications for disaster preparedness and risk management. These maps can be used to identify high-risk zones and prioritize structural retrofitting or stabilization efforts. Furthermore, real-time assessments can support rapid decision-making during seismic events, aiding in immediate evacuation planning and post-disaster recovery operations.
The classification of failure probabilities into different damage levels (e.g., “Slight”, “Moderate”, “Extensive”, and “Complete”) enables more precise structural safety evaluations. This approach can also help policymakers and engineers develop more targeted seismic mitigation strategies based on the specific vulnerabilities of each structure.
4.3. Strengths of the Proposed Framework
One of the primary strengths of this framework is its integration of geotechnical, seismic, and structural data in a GIS environment. This integration allows for real-time updates and visualization of seismic fragility across spatially distributed infrastructures. The use of kriging interpolation further enhances the accuracy of seismic hazard assessments by mitigating spatial uncertainties.
Another strength lies in the adaptability of the framework to various earthquake scenarios. By incorporating both real and hypothetical events, the framework can be calibrated for different seismic intensities and soil conditions, ensuring its robustness across diverse geotechnical environments.
4.4. Limitations and Future Directions
Despite its strengths, the study has several limitations that should be addressed in future research. First, the accuracy of the proposed framework heavily relies on the availability and quality of geotechnical and seismic data. Limited borehole data or low-resolution satellite imagery may reduce the reliability of fragility predictions. Expanding the dataset through more extensive ground surveys and integrating high-resolution spatial data—such as UAV- or LiDAR-based measurements—could significantly enhance the spatial resolution and precision of the framework, thereby improving the reliability and applicability of seismic risk assessments in regions lacking sufficient geotechnical information.
Second, the fragility functions utilized in this study were derived from general empirical models. While these models are widely employed and offer useful preliminary assessments, they may not fully capture the unique structural attributes of specific facilities, such as those at Incheon Port. To overcome this, future research should prioritize developing or calibrating site-specific fragility curves tailored to the detailed structural characteristics of individual buildings. This could be achieved through advanced numerical modeling or targeted experimental validation, ultimately enabling more accurate loss estimation and better-informed mitigation strategies.
4.5. Future Applications
The proposed framework has strong potential for extension to other critical infrastructure systems, including bridges, tunnels, and coastal industrial complexes. Notably, components of the modular GIS-based system have already been partially implemented in LNG terminals and KTX rail networks in Korea, demonstrating its adaptability to diverse operational contexts. Future integration with machine learning algorithms could further enhance the framework by enabling automated fragility predictions derived from both real-time event data and historical structural performance records.
In addition, linking this framework to national disaster response networks or early warning systems would substantially improve regional resilience. Such integration would facilitate proactive decision-making and optimized resource allocation before, during, and after seismic events.
It is also worth noting that the present study primarily focused on single seismic events, without explicitly addressing the effects of aftershocks or cumulative structural damage from multiple events. Incorporating multi-event sequences and applying time-dependent reliability analyses could provide a more realistic representation of cumulative damage processes and long-term resilience.
Finally, the robustness of the framework under scenarios involving sensor malfunctions or communication failures during extreme events remains to be examined. Future research should address these limitations by developing effective fail-safe protocols and redundancy strategies to reduce the risks associated with data acquisition disruptions. Such enhancements would improve the reliability, continuity, and operational readiness of structural monitoring systems in critical situations.
