Author Contributions
Conceptualization, F.Y. and L.F.; methodology, F.Y., L.F. and J.Z.; software, F.Y. and L.F.; validation, L.F. and F.Y.; formal analysis, L.F. and F.Y.; investigation, F.Y., L.F. and J.Z.; resources, R.S. and M.W.; data curation, F.Y. and L.F.; writing original draft preparation, L.F. and F.Y.; writing—review and editing, L.F., F.Y. and R.S.; visualization, F.Y. and L.F.; supervision, R.S., M.W. and J.Z.; project administration, R.S. and M.W.; funding acquisition, R.S. and M.W. All authors have read and agreed to the published version of the manuscript.
Figure 1.
After receiving the voice, the software will convert the voice into text and send it to GPT for sentiment analysis. The analysis results are shown in the figure. The software will simulate the emotion analysis results through 3D digital humans and finally form facial expressions and movements.
Figure 2.
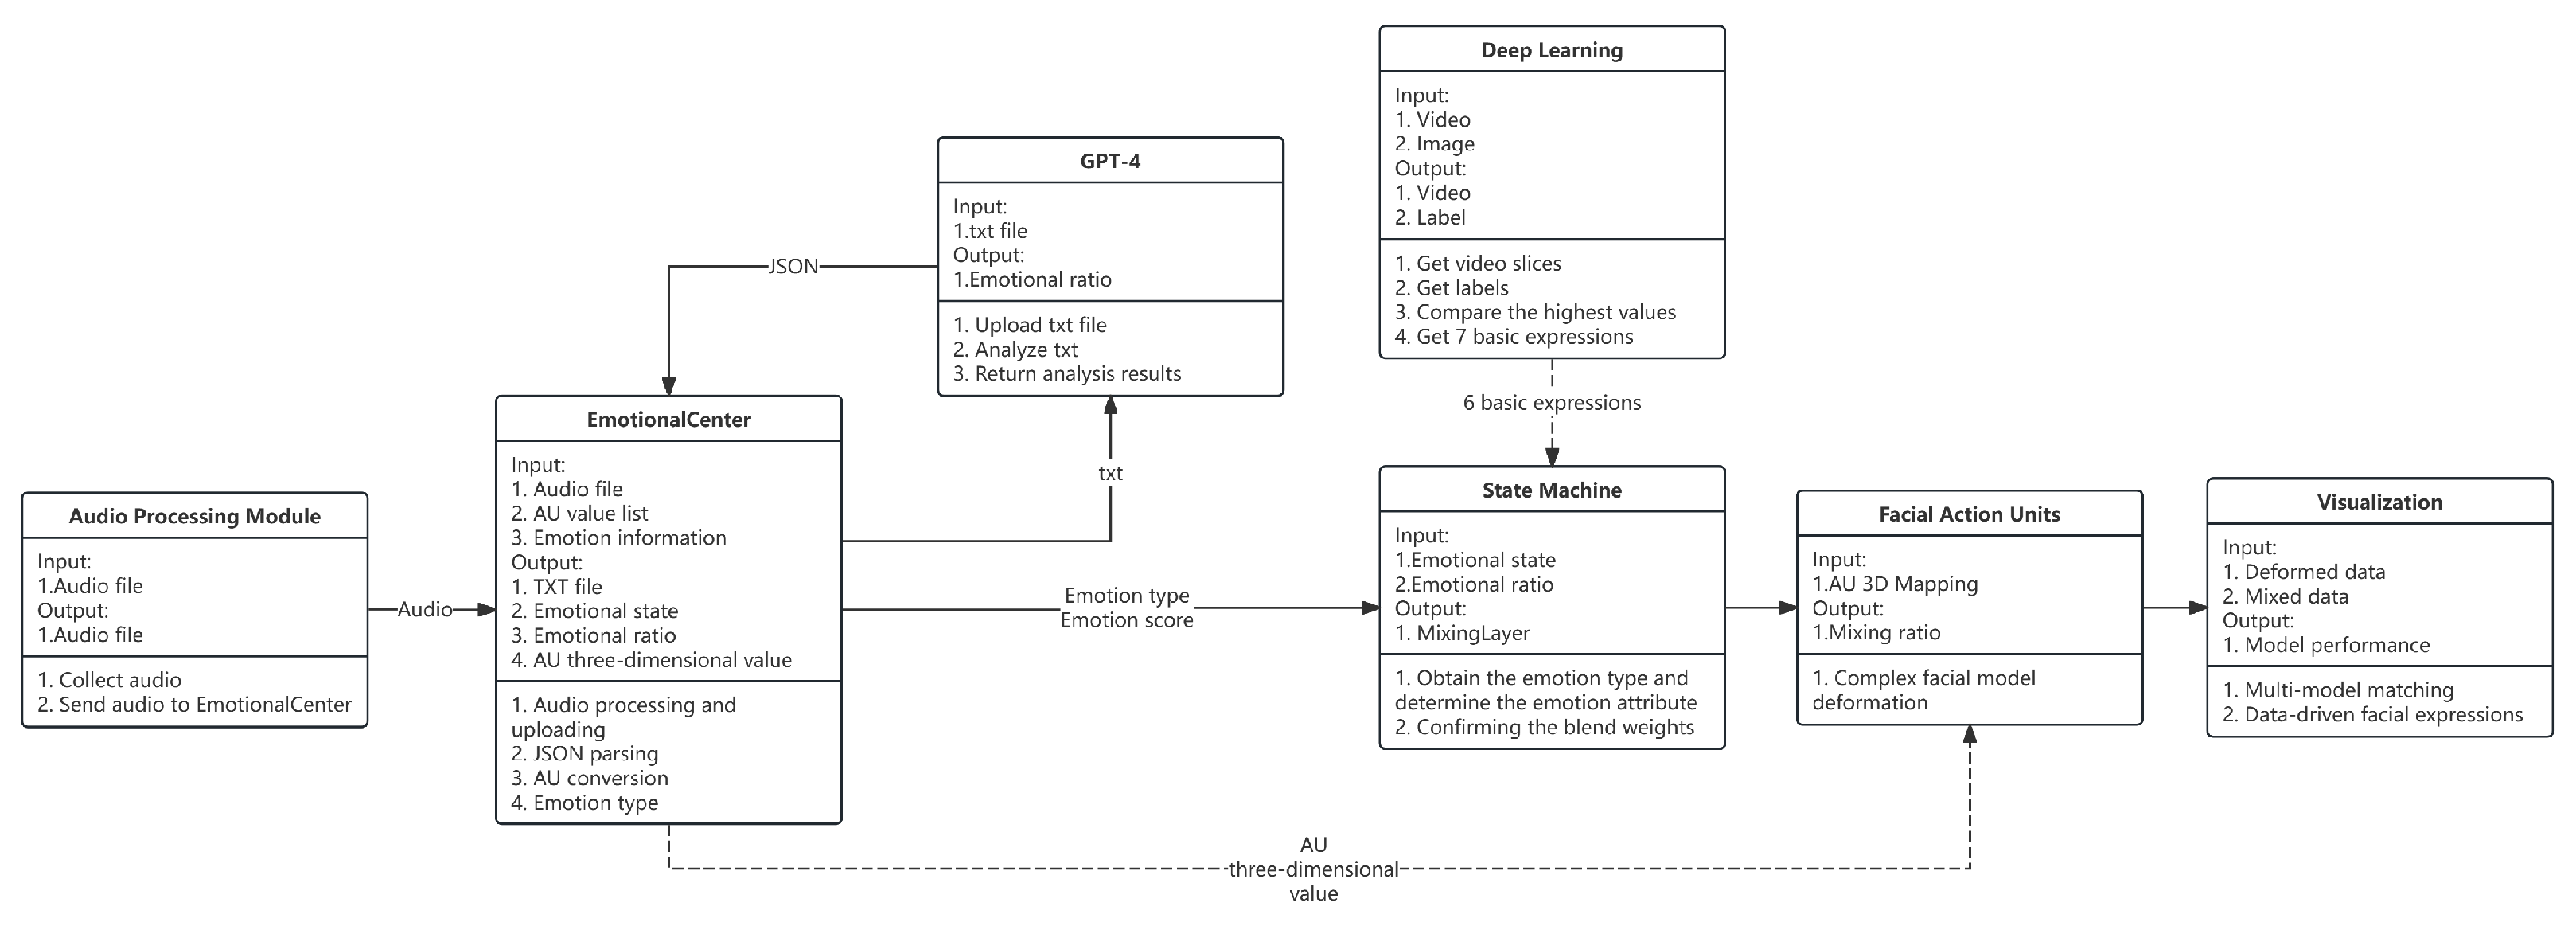
Interaction solution architecture diagram. The system first converts the collected speech into text and uploads it to GPT. GPT processes the text based on the context information, identifies the emotion type, and returns the result. Subsequently, the generated agent module receives and processes the information and distributes it to different modules based on the emotion type. Each module has a clear processing task, which ultimately drives the virtual digital human to show the corresponding expression and presents the data through the UI interface.
Figure 3.
Comparison of AU activation and temporal progression across four emotions: (a) total AU activation energy across selected control curves; (b) dynamic evolution of the same AU curves over time (60 frames). Dynamic expressions show more sustained and distributed activation.
Figure 3.
Comparison of AU activation and temporal progression across four emotions: (a) total AU activation energy across selected control curves; (b) dynamic evolution of the same AU curves over time (60 frames). Dynamic expressions show more sustained and distributed activation.
Figure 4.
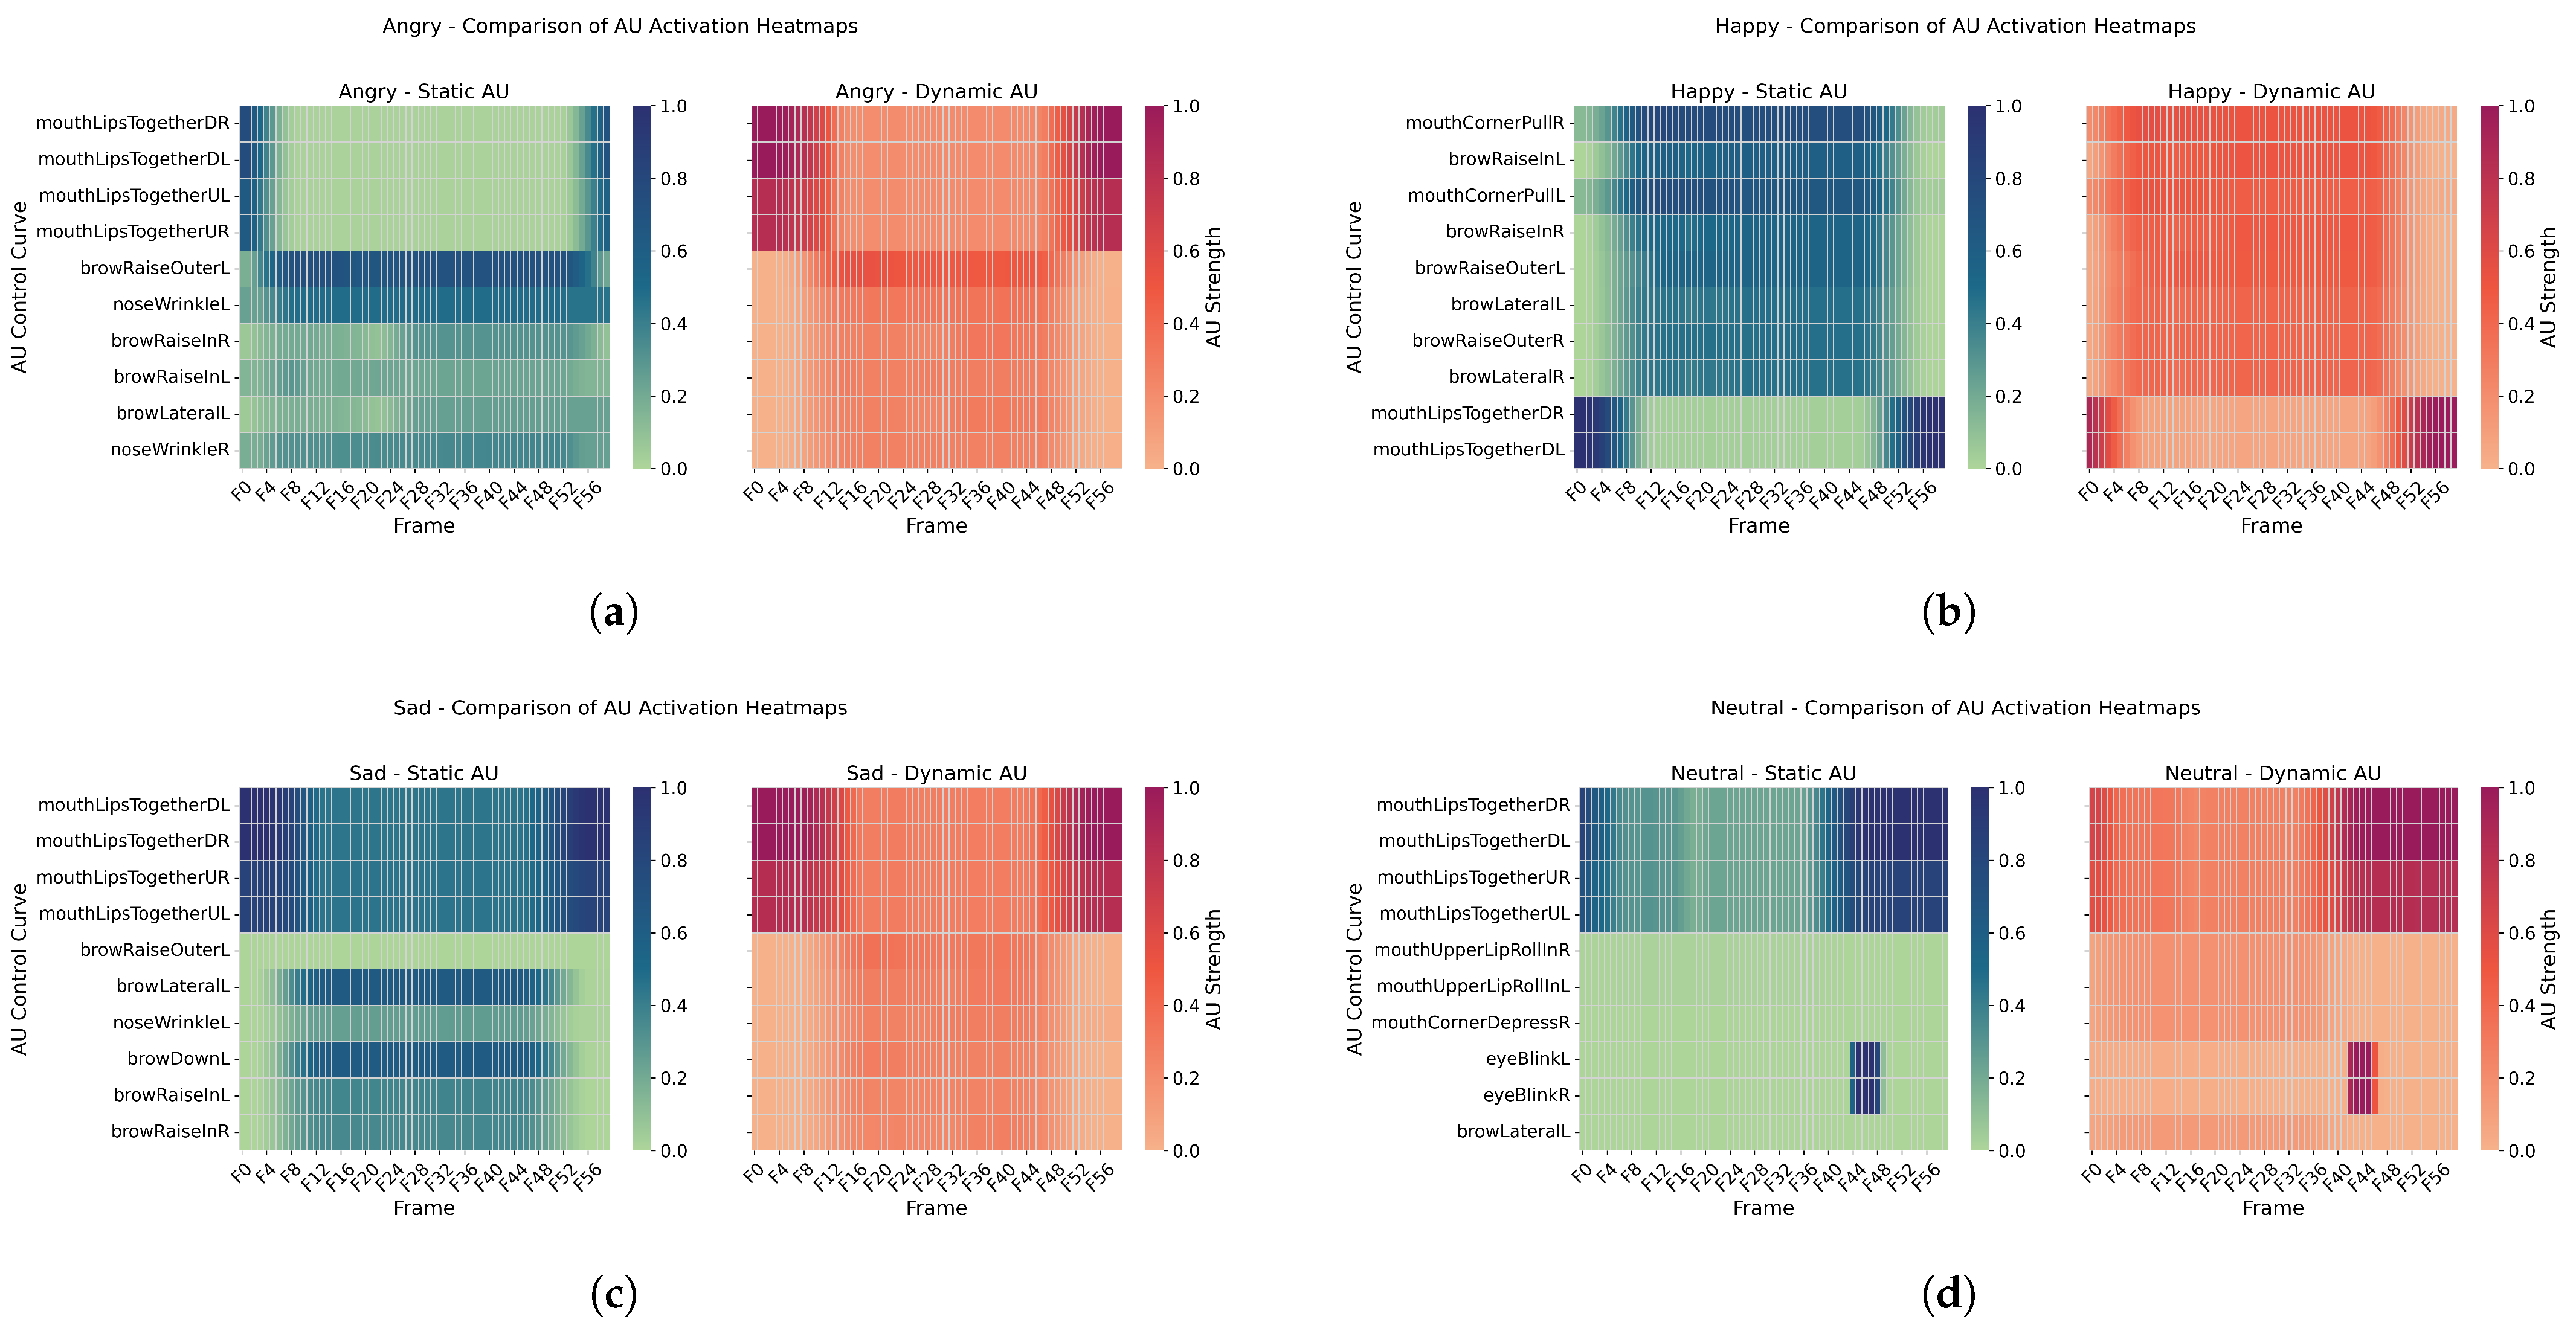
Spatial distribution patterns of AU activations under four emotional conditions. Each subfigure compares static (left) and dynamic (right) AU heatmaps for: (a) Anger, (b) Happiness, (c) Sadness, and (d) Neutral. Static activations are more concentrated in the upper facial region (e.g., brow and eyelid), while dynamic activations involve wider participation from the mouth, cheeks, and chin areas, especially in “Happiness” and “Neutral” expressions.
Figure 5.
Partial effect size heatmap of different predictors and interactions on four subjective ratings. * p < 0.05, ** p < 0.01. Note. ST = SystemType; A3D = Acceptance of 3D Characters; R = Ratings (Naturalness, Congruence, Layering, Satisfaction); Age = Participant Age Group.
Figure 5.
Partial effect size heatmap of different predictors and interactions on four subjective ratings. * p < 0.05, ** p < 0.01. Note. ST = SystemType; A3D = Acceptance of 3D Characters; R = Ratings (Naturalness, Congruence, Layering, Satisfaction); Age = Participant Age Group.
Figure 6.
Moderating effects on naturalness ratings: (a) Interaction plot of Age × System Type on Naturalness ratings. (b) Covariate effect of 3D Acceptance on ratings, where blue dots represent individual participant scores, the red line indicates the fitted regression line, and the shaded area shows the 95% confidence interval.
Figure 7.
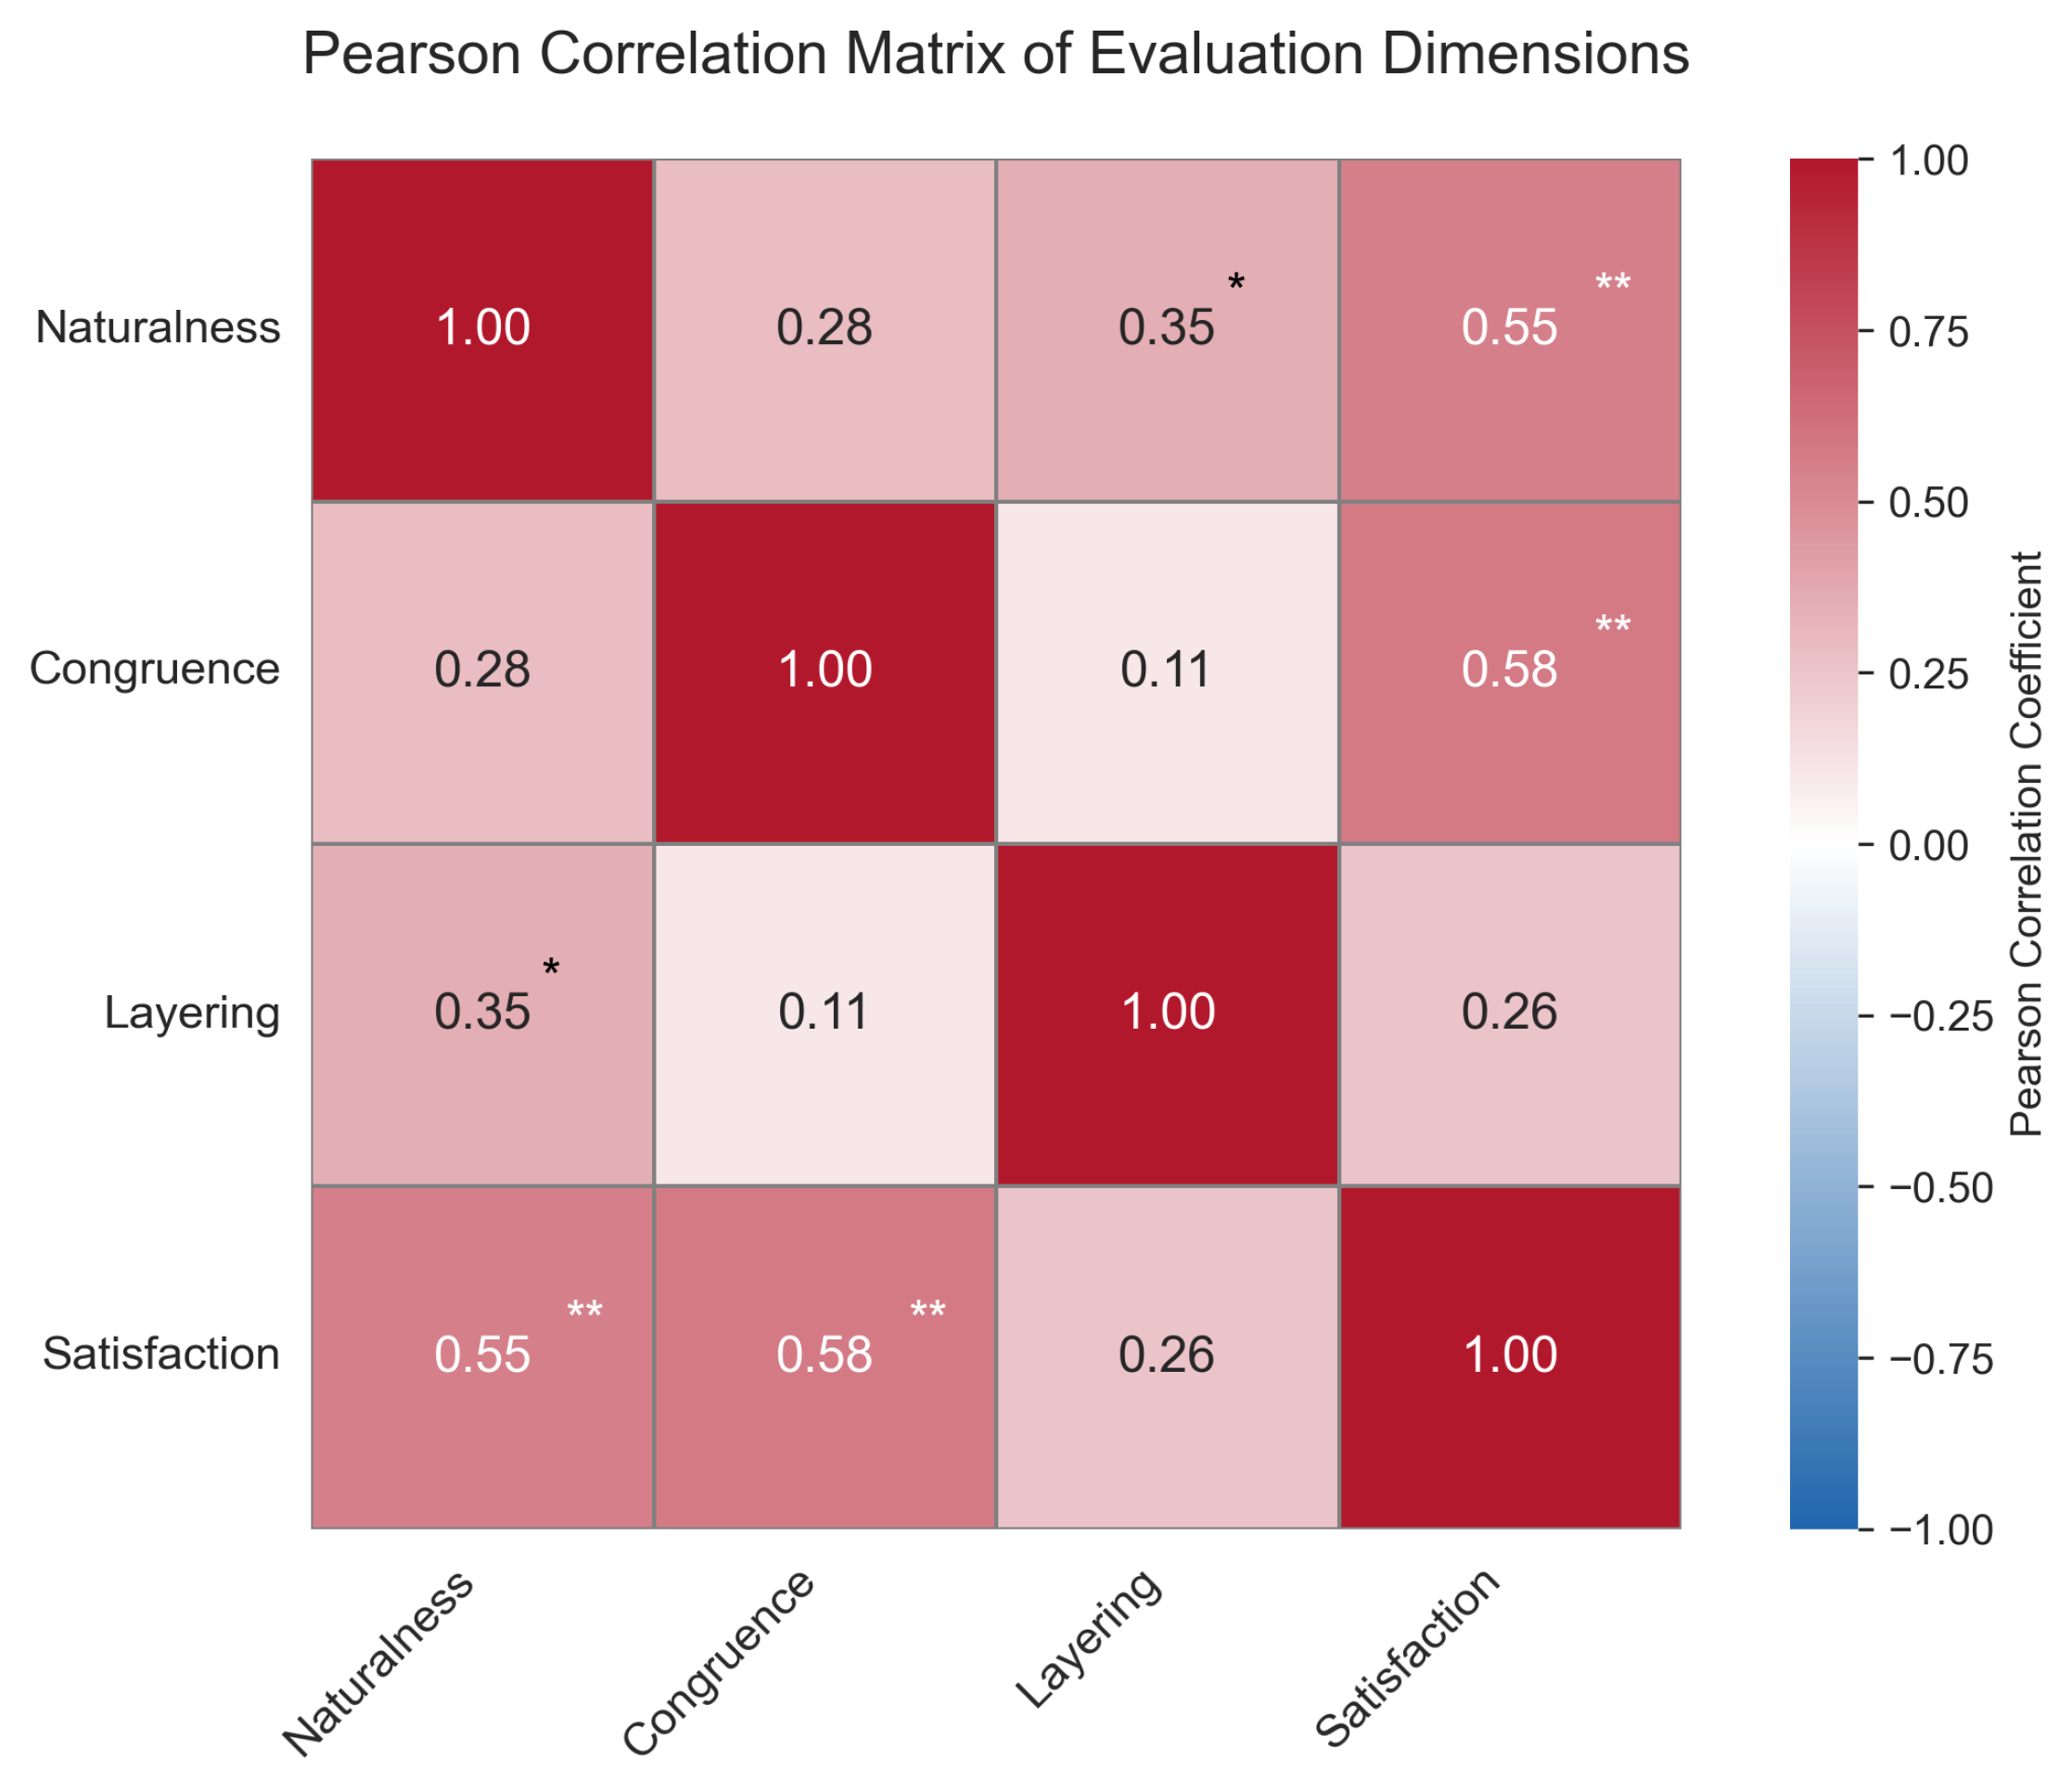
Heatmap showing the Pearson correlation coefficients between four subjective rating dimensions: Naturalness, Congruence, Layering, and Satisfaction. Asterisks indicate significance levels (* , ** ).
Figure 7.
Heatmap showing the Pearson correlation coefficients between four subjective rating dimensions: Naturalness, Congruence, Layering, and Satisfaction. Asterisks indicate significance levels (* , ** ).
Figure 8.
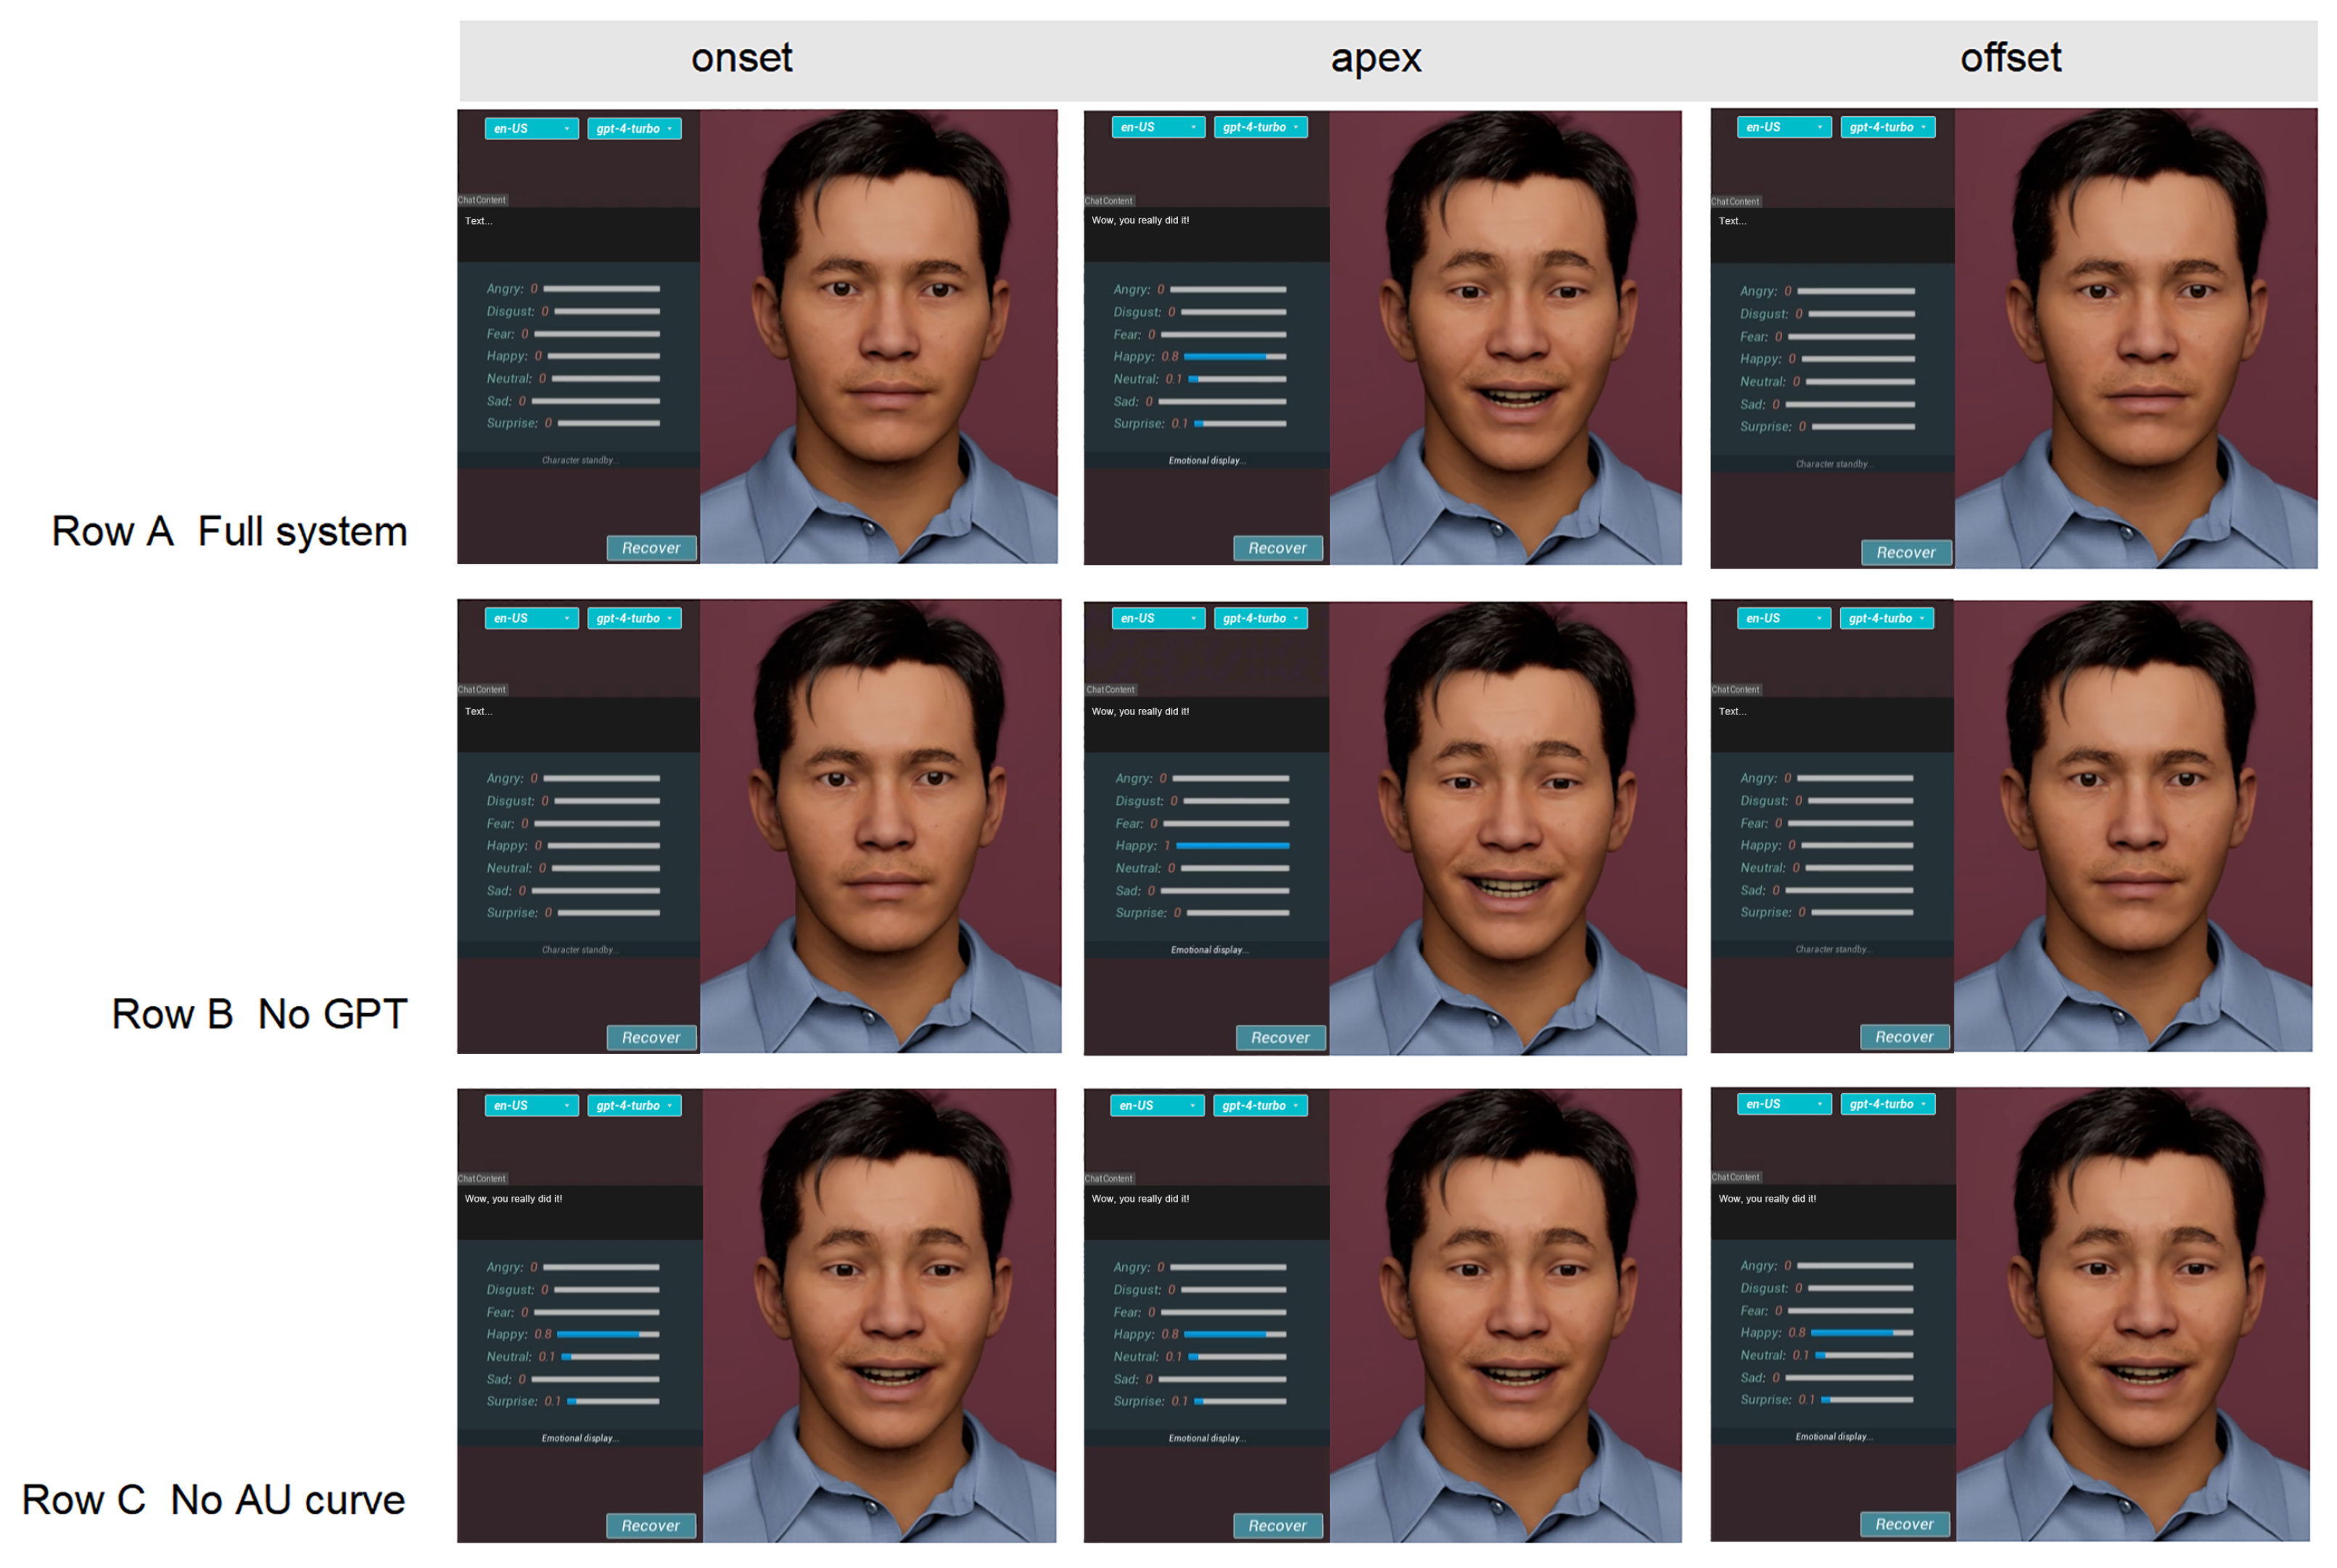
Qualitative impact of key modules. Row A: full system; Row B: no GPT (uniform AU weights); Row C: no AU-curve driver. Columns show onset, apex and offset frames of the utterance “I’m so excited to see you!”. A miniature bar chart beside each frame visualizes the seven-class emotion intensity, highlighting the loss of surprise components without GPT (Row B) and the temporal jerk introduced when curve modulation is removed (Row C).
Figure 9.
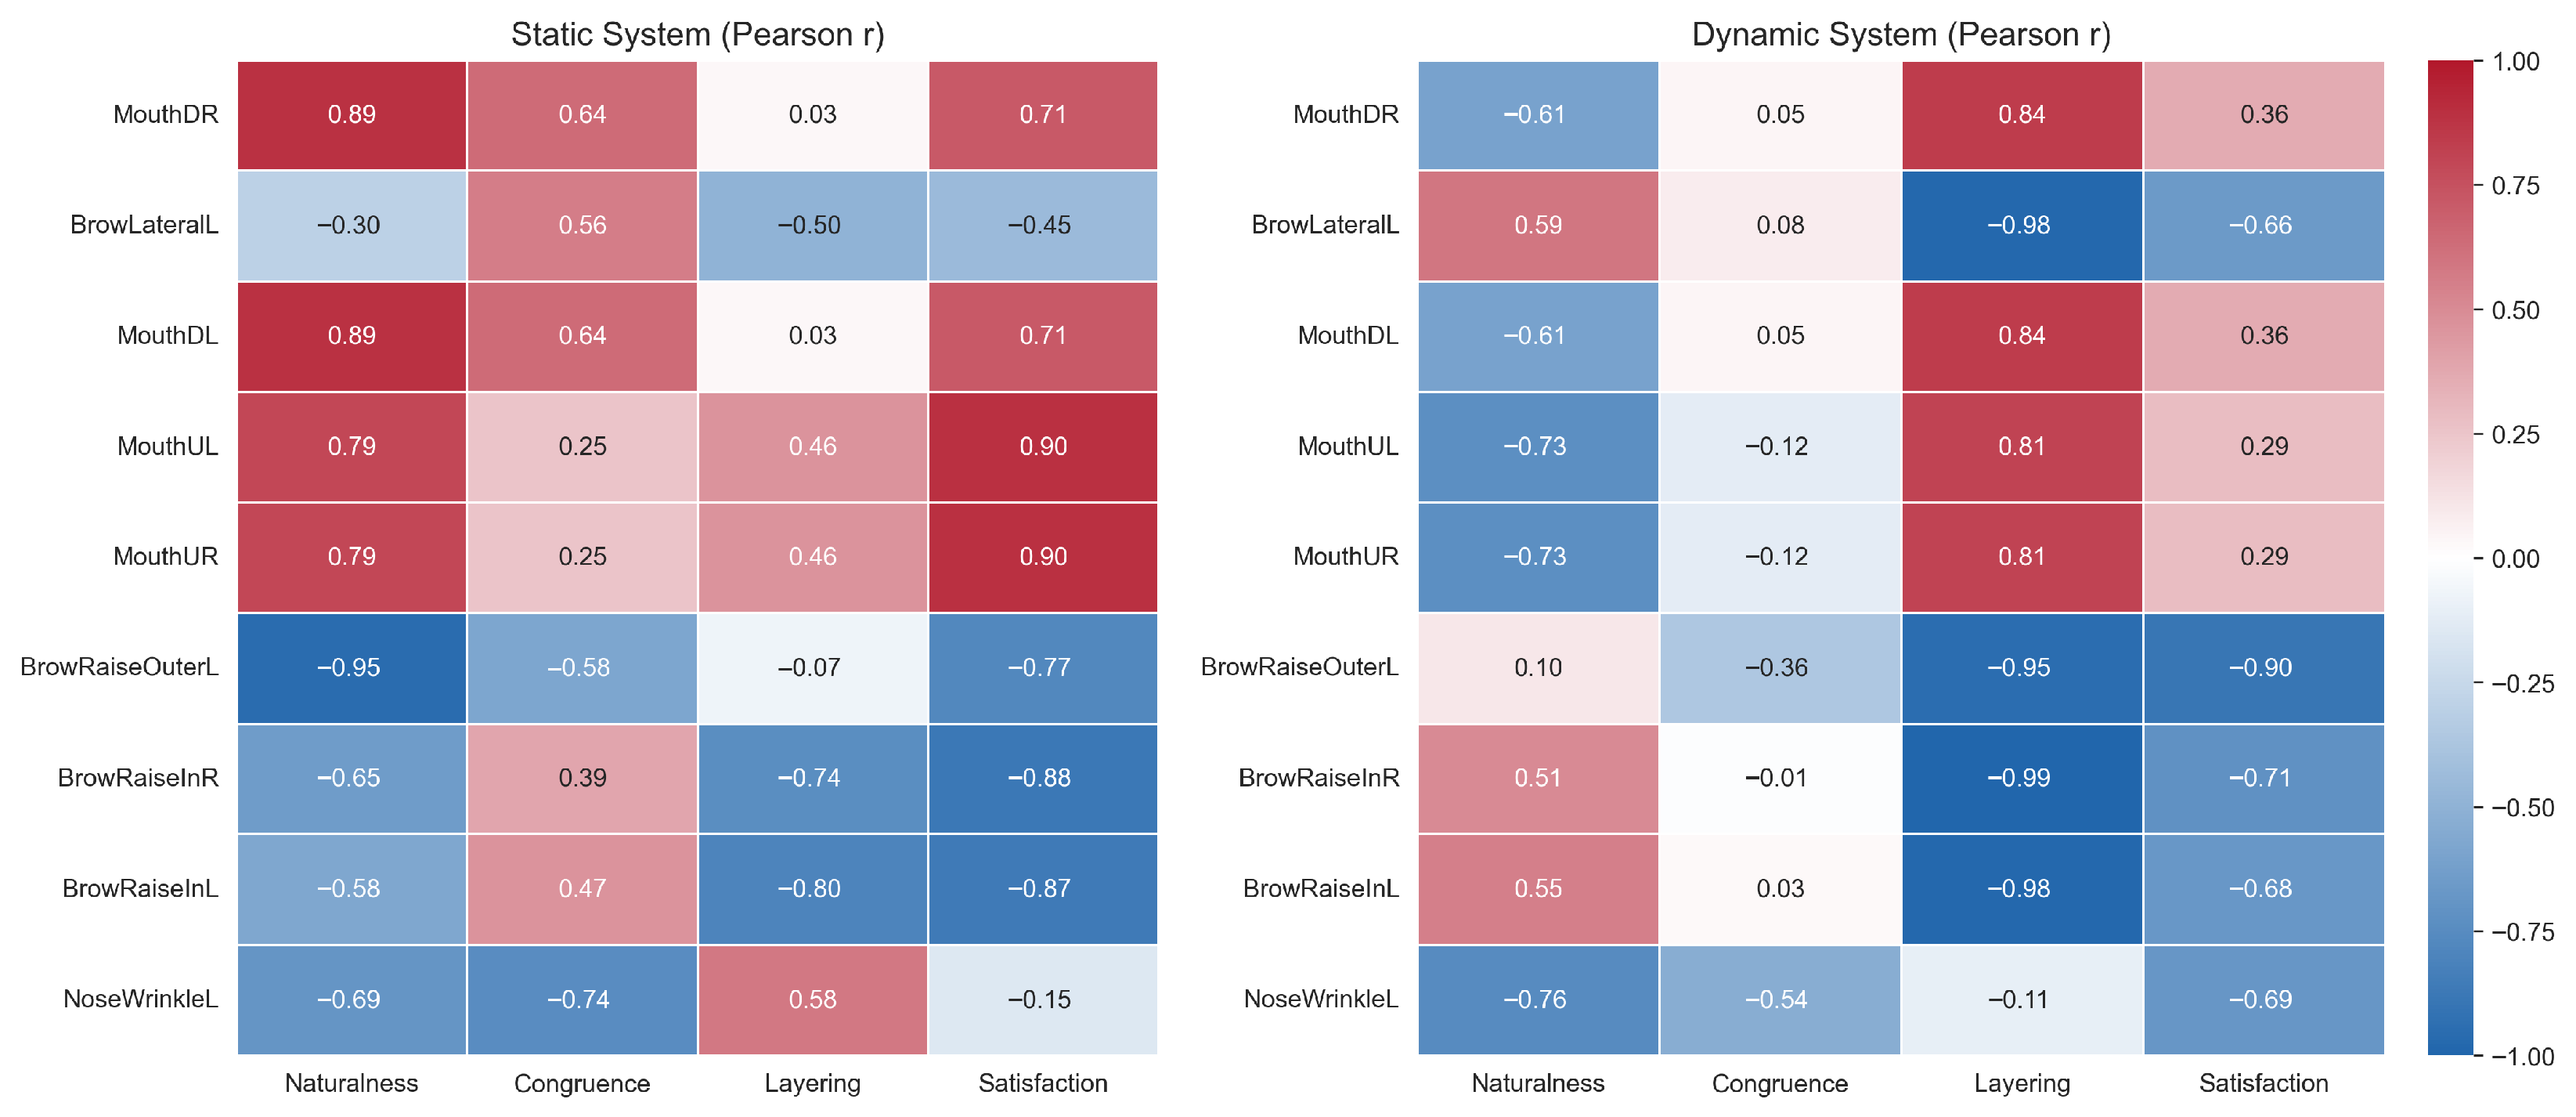
Pearson correlation heatmaps between AU activation features and subjective perceptual ratings across static (left) and dynamic (right) systems. The color indicates the strength and direction of correlation (from to ) between each AU curve and four subjective dimensions: naturalness, emotional congruence, layering, and satisfaction.
Table 1.
Performance Comparison of Classification Models.
Table 1.
Performance Comparison of Classification Models.
| Model | -Score | Accuracy | Inference Time (ms) | Model Size (MB) |
|---|
| MLP [19] | 0.028 | 0.125 | 2.16 | 24.02 |
| MobileNetV2 [17,18] | 0.505 | 0.504 | 5.85 | 8.52 |
| ResNet18 V3-Opt [20,21] | 0.625 | 0.626 | 1.31 | 42.65 |
| ResNet50 [22,23] | 0.539 | 0.536 | 7.76 | 89.70 |
Table 2.
ResNet18-Based Emotion Classifier Architecture.
Table 2.
ResNet18-Based Emotion Classifier Architecture.
| Layer | Kernel Configuration | Output Dimension |
|---|
| Input | RGB image: | |
| Conv1 | , 64 filters, stride | |
| MaxPooling (optional) | , stride | |
| ResBlock1 | , 64 × 2 | |
| ResBlock2 | , 128 × 2 | |
| ResBlock3 | , 256 × 2 | |
| ResBlock4 | , 512 × 2 (fine-tuned) | |
| Global Avg. Pooling | AdaptiveAvgPool2d | |
| Fully Connected (FC) | Linear (512 → 7) | 7 logits |
| Softmax Activation | Softmax over 7 logits | 7-dimensional probability |
| Output | argmax(Softmax)→ predicted label | Label + confidence vector |
Table 3.
Ablation Study of ResNet18 Variants on AffectNet.
Table 3.
Ablation Study of ResNet18 Variants on AffectNet.
| Variant | Data Augmentation | Loss Function | Optimizer + Scheduler | Train Acc (%) | Val Acc (%) | Val F1 |
|---|
| ResNet18 | Flip, rotate, jitter | CrossEntropy | Adam | 90.44 | 54.90 | 0.5438 |
| ResNet18 | Same as v1 | CrossEntropy | Adam | 59.72 | 56.14 | 0.5590 |
| ResNet18 | Flip, rotate, affine, color | CE + Label Smoothing | AdamW + CosineAnnealing | 69.49 | 62.57 | 0.6254 |
Table 4.
Comparison of Top 5 AU Activation Energies between Dynamic and Static Expressions across Emotions.
Table 4.
Comparison of Top 5 AU Activation Energies between Dynamic and Static Expressions across Emotions.
| Emotion | AU Name | Dyn. Energy | Stat. Energy | p-Value | Cohen’s d |
|---|
| Angry | mouthLipsTogetherDL | 28.15 | 6.69 | <0.001 | 1.64 |
| | mouthLipsTogetherDR | 28.15 | 6.69 | <0.001 | 1.64 |
| | mouthLipsTogetherUL | 24.99 | 5.73 | <0.001 | 1.84 |
| | mouthLipsTogetherUR | 24.99 | 5.73 | <0.001 | 1.84 |
| | browRaiseOuterL | 20.67 | 37.94 | <0.001 | −2.11 |
| Happiness | mouthCornerPullR | 25.71 | 34.76 | <0.001 | −1.18 |
| | mouthCornerPullL | 23.37 | 31.70 | <0.001 | −1.18 |
| | browRaiseInL | 23.85 | 25.79 | 0.005 | −0.37 |
| | browRaiseInR | 22.20 | 23.55 | 0.029 | −0.29 |
| | browRaiseOuterL | 22.04 | 23.63 | 0.010 | −0.34 |
| Sadness | browRaiseOuterL | 12.10 | 0.00 | <0.001 | 1.43 |
| | browLateralL | 10.78 | 27.18 | <0.001 | −1.96 |
| | browDownL | 9.92 | 26.80 | <0.001 | −1.96 |
| | browRaiseInL | 9.35 | 16.22 | <0.001 | −1.89 |
| | mouthLipsTogetherDL | 34.19 | 36.93 | 0.007 | −0.36 |
| Neutral | mouthUpperLipRollInL | 6.61 | 0.56 | <0.001 | 1.39 |
| | mouthUpperLipRollInR | 6.61 | 0.57 | <0.001 | 1.39 |
| | mouthCornerDepressR | 6.30 | 0.00 | <0.001 | 1.41 |
| | mouthLipsTogetherDL | 33.45 | 31.10 | <0.001 | 0.48 |
| | mouthLipsTogetherDR | 33.45 | 31.10 | <0.001 | 0.48 |
Table 5.
Main Effects of System Type and Its Interaction with Age on Four Subjective Ratings.
Table 5.
Main Effects of System Type and Its Interaction with Age on Four Subjective Ratings.
| Ratings | Mean (Static) | Mean (Dynamic) | F | p-Value | Partial | Significant Interaction |
|---|
| Naturalness | 3.31 ± 0.94 | 4.02 ± 0.80 | 42.21 | <0.001 | 0.507 | SystemType × Age (p = 0.008) |
| Congruence | 3.41 ± 0.89 | 4.12 ± 0.73 | 34.78 | <0.001 | 0.459 | – |
| Layering | 3.33 ± 0.91 | 4.09 ± 0.72 | 39.65 | <0.001 | 0.492 | – |
| Satisfaction | 3.31 ± 0.93 | 3.95 ± 0.82 | 21.45 | <0.001 | 0.344 | – |
Table 6.
Paired Samples t-Test Results: Static vs. Dynamic System Ratings Across Four Dimensions.
Table 6.
Paired Samples t-Test Results: Static vs. Dynamic System Ratings Across Four Dimensions.
| Dimension | Static (M ± SD) | Dynamic (M ± SD) | t | df | p (2-Tailed) | Cohen’s d | 95% CI (d) |
|---|
| Naturalness | 3.54 ± 0.54 | 3.94 ± 0.41 | −4.43 | 50 | <0.001 | −0.62 | [−0.92, −0.32] |
| Congruence | 3.44 ± 0.61 | 3.80 ± 0.61 | −4.70 | 50 | <0.001 | −0.66 | [−0.96, −0.35] |
| Layering | 3.20 ± 0.42 | 4.08 ± 0.43 | −10.62 | 50 | <0.001 | −1.49 | [−1.88, −1.08] |
| Satisfaction | 3.45 ± 0.41 | 4.11 ± 0.36 | −9.43 | 50 | <0.001 | −1.32 | [−1.69, −0.94] |
Table 7.
End-to-end latency of the real-time emotional-response pipeline.
Table 7.
End-to-end latency of the real-time emotional-response pipeline.
| Step | Processing Module | Mean Latency (s) | Description |
|---|
| 1 | Audio capture and speech-to-text (TTS) | 0.62 | Microphone input to text transcription |
| 2 | GPT-4 prompt and AU parsing | 1.84 | Prompt construction, LLM inference, AU weight parsing |
| 3 | BlendShape update and UE5 rendering | 0.01 | State-machine drive, shape blending, first frame render |
| Total dialog latency | 2.47 | Speech input to first facial frame |
| Supplement: frame-render speed | 9.32 ms/frame (approx. 107 FPS) | Sustained UE5 performance |

