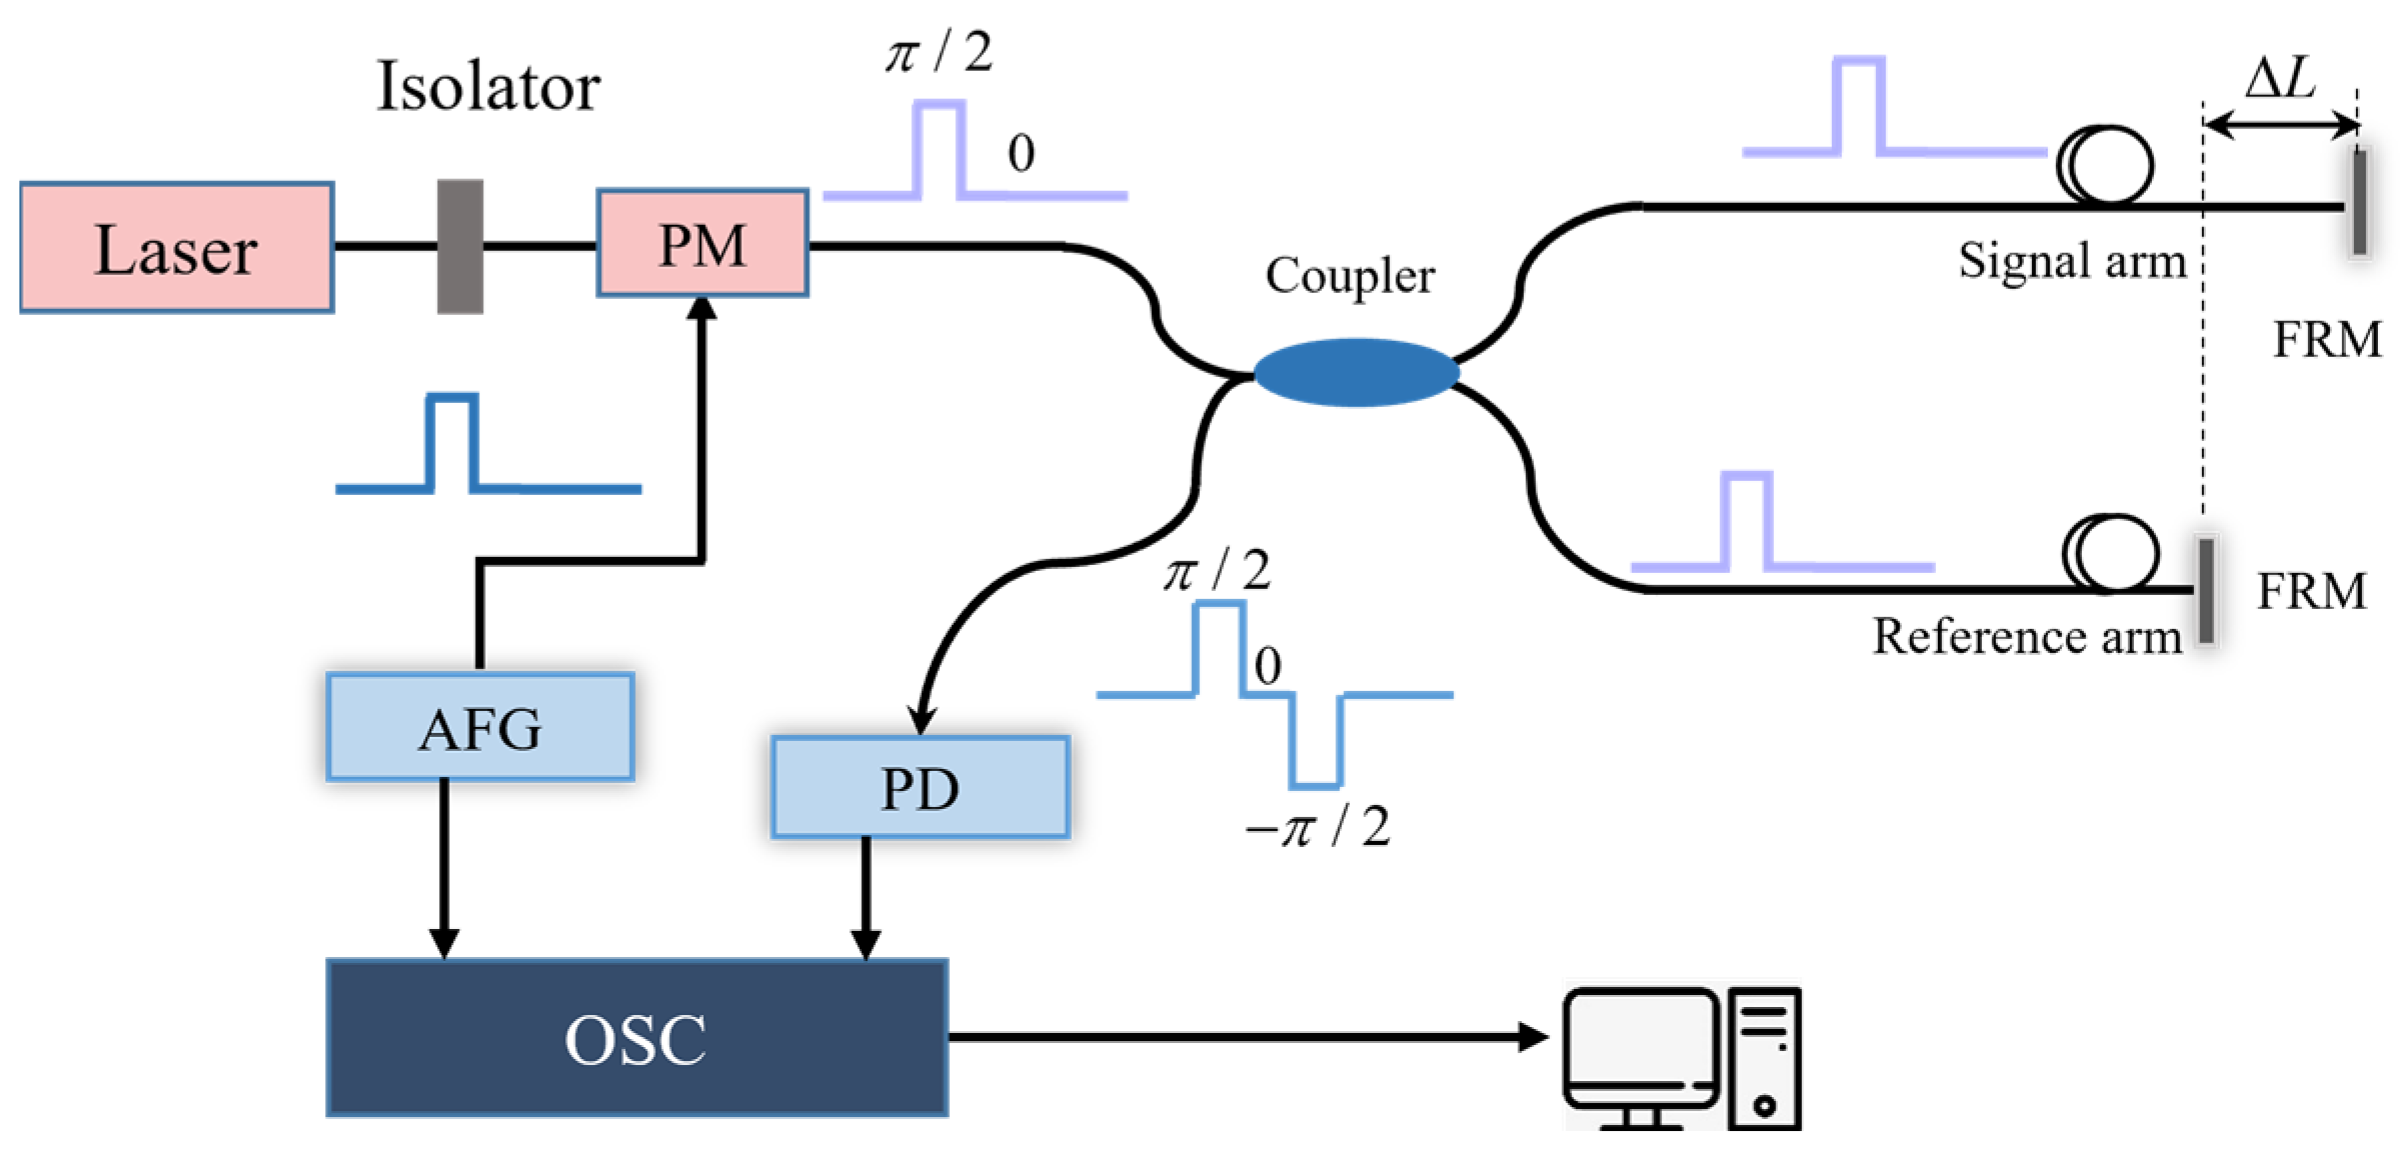
From the analysis of the principle above, it is evident that there exists a sampling interval Δt between the three sampling points P1, P2 and P3, which is ignored in Equation (3). This sampling interval may lead to errors in the demodulation results. Meanwhile, the modulation depth of π/2 in Equation (3) may lead to depth deviation in practical applications, thereby causing demodulation distortion. This section focuses on analyzing the noise associated with these two factors and provides corresponding improvement recommendations based on the results.
3.1. The Error Caused by the Sampling Interval
From the analysis of the above principle, it is evident that there exists a sampling interval Δt between the three sampling points P1, P2, and P3. This sampling interval may lead to errors in the demodulation results.
Considering the sampling interval Δ
t, Equation (3) can be changed as follows:
According to the original arc-tangent algorithm,
can be expressed as follows:
It is evident that there exists a phase error in
caused by Δ
t. Assuming
, the corresponding vibration curve is shown in
Figure 3. It shows that the value of
has the largest change rate at the position
. Therefore, the deviation caused by the sampling interval at point A is the largest. Meanwhile, the change in the vibration signal is approximately linear at point A. Considering this condition with the maximum deviation at point A,
and
can be given by
Substituting Equation (9) into Equation (7),
can be derived as follows:
According to the above equation, D, f, and the sampling interval Δt itself cause the phase demodulation error.
Supposing
and
,
can be changed as
Thus, we calculate the derivative of
:
According to Equation (12), constantly , and we can define that the increase in D, and f and Δt evidently increase the demodulated phase error.
3.3. Simulation Analysis
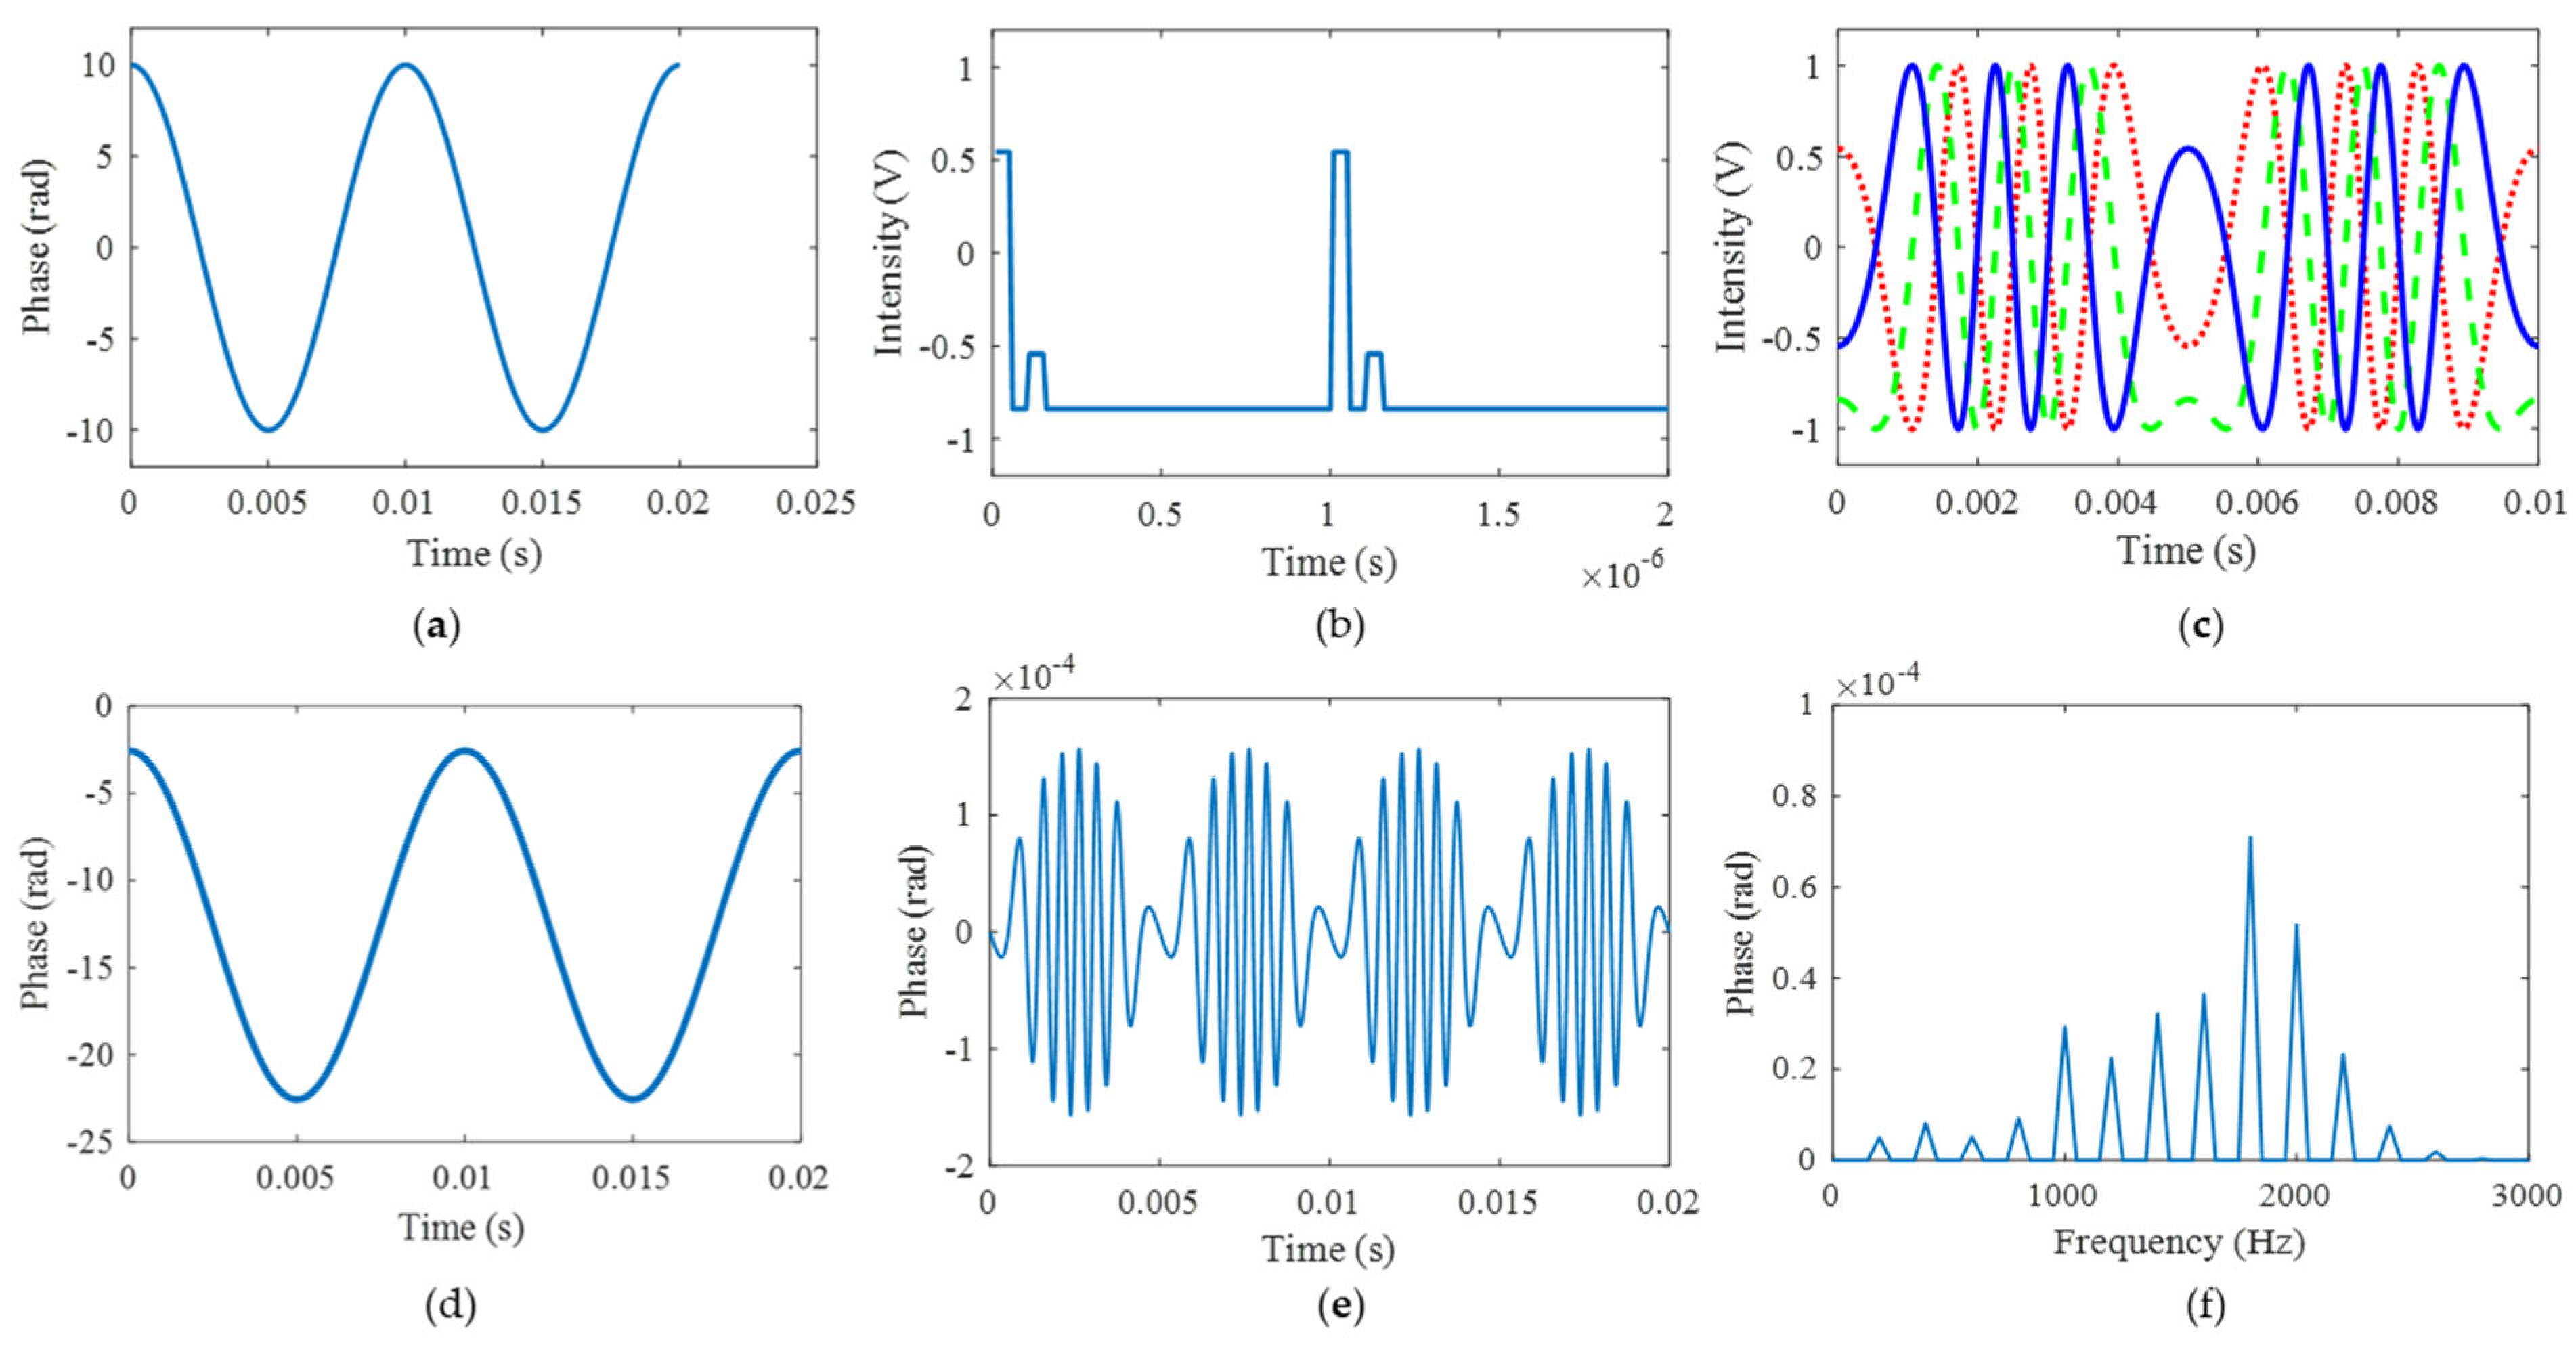
To demonstrate our theory, simulation analysis is carried out in this part. Firstly, the sampling interval error is analyzed. The parameter settings are listed in
Table 1. The theoretical vibration signal and the modulated interference light intensity are shown in
Figure 4a,b. The interference light intensity has three-step [pi/2, 0, −pi/2] phase shifts in one modulation period, which is consistent with the parameter setting. Thus, the obtained three light intensities are shown in
Figure 4c, where the phases satisfy the relationship of [pi/2, 0, −pi/2]. The final demodulated phase using the arc-tangent algorithm is shown in
Figure 4d. The demodulated phase is consistent with the simulated vibration signal. By comparing the simulated vibration signal and demodulated phase, the time and frequency domain errors are depicted in
Figure 4e,f. The maximum time domain error is about 1.56 × 10
−4 rad, and the maximum frequency domain error is about 7.1 × 10
−5 rad. The result shows that the error has little influence on the demodulation results. In order to quantitatively evaluate the demodulation performance, we define the demodulation criteria as follows: (1) the Relative Amplitude Distortion (RAD) is less than 1%; (2) the Minimum Harmonic Distortion (MHD) is more than 40 dB; and (3) the signal-to-noise distortion ratio (SINAD) is at least 30 dB. The RAD, MHR, SINAD here are 0.00000021%, 100.01 dB, and 95.09 dB, respectively, which shows good performance.
To further illustrate the influence of D, f, and Δt, more detailed experiments have been carried out.
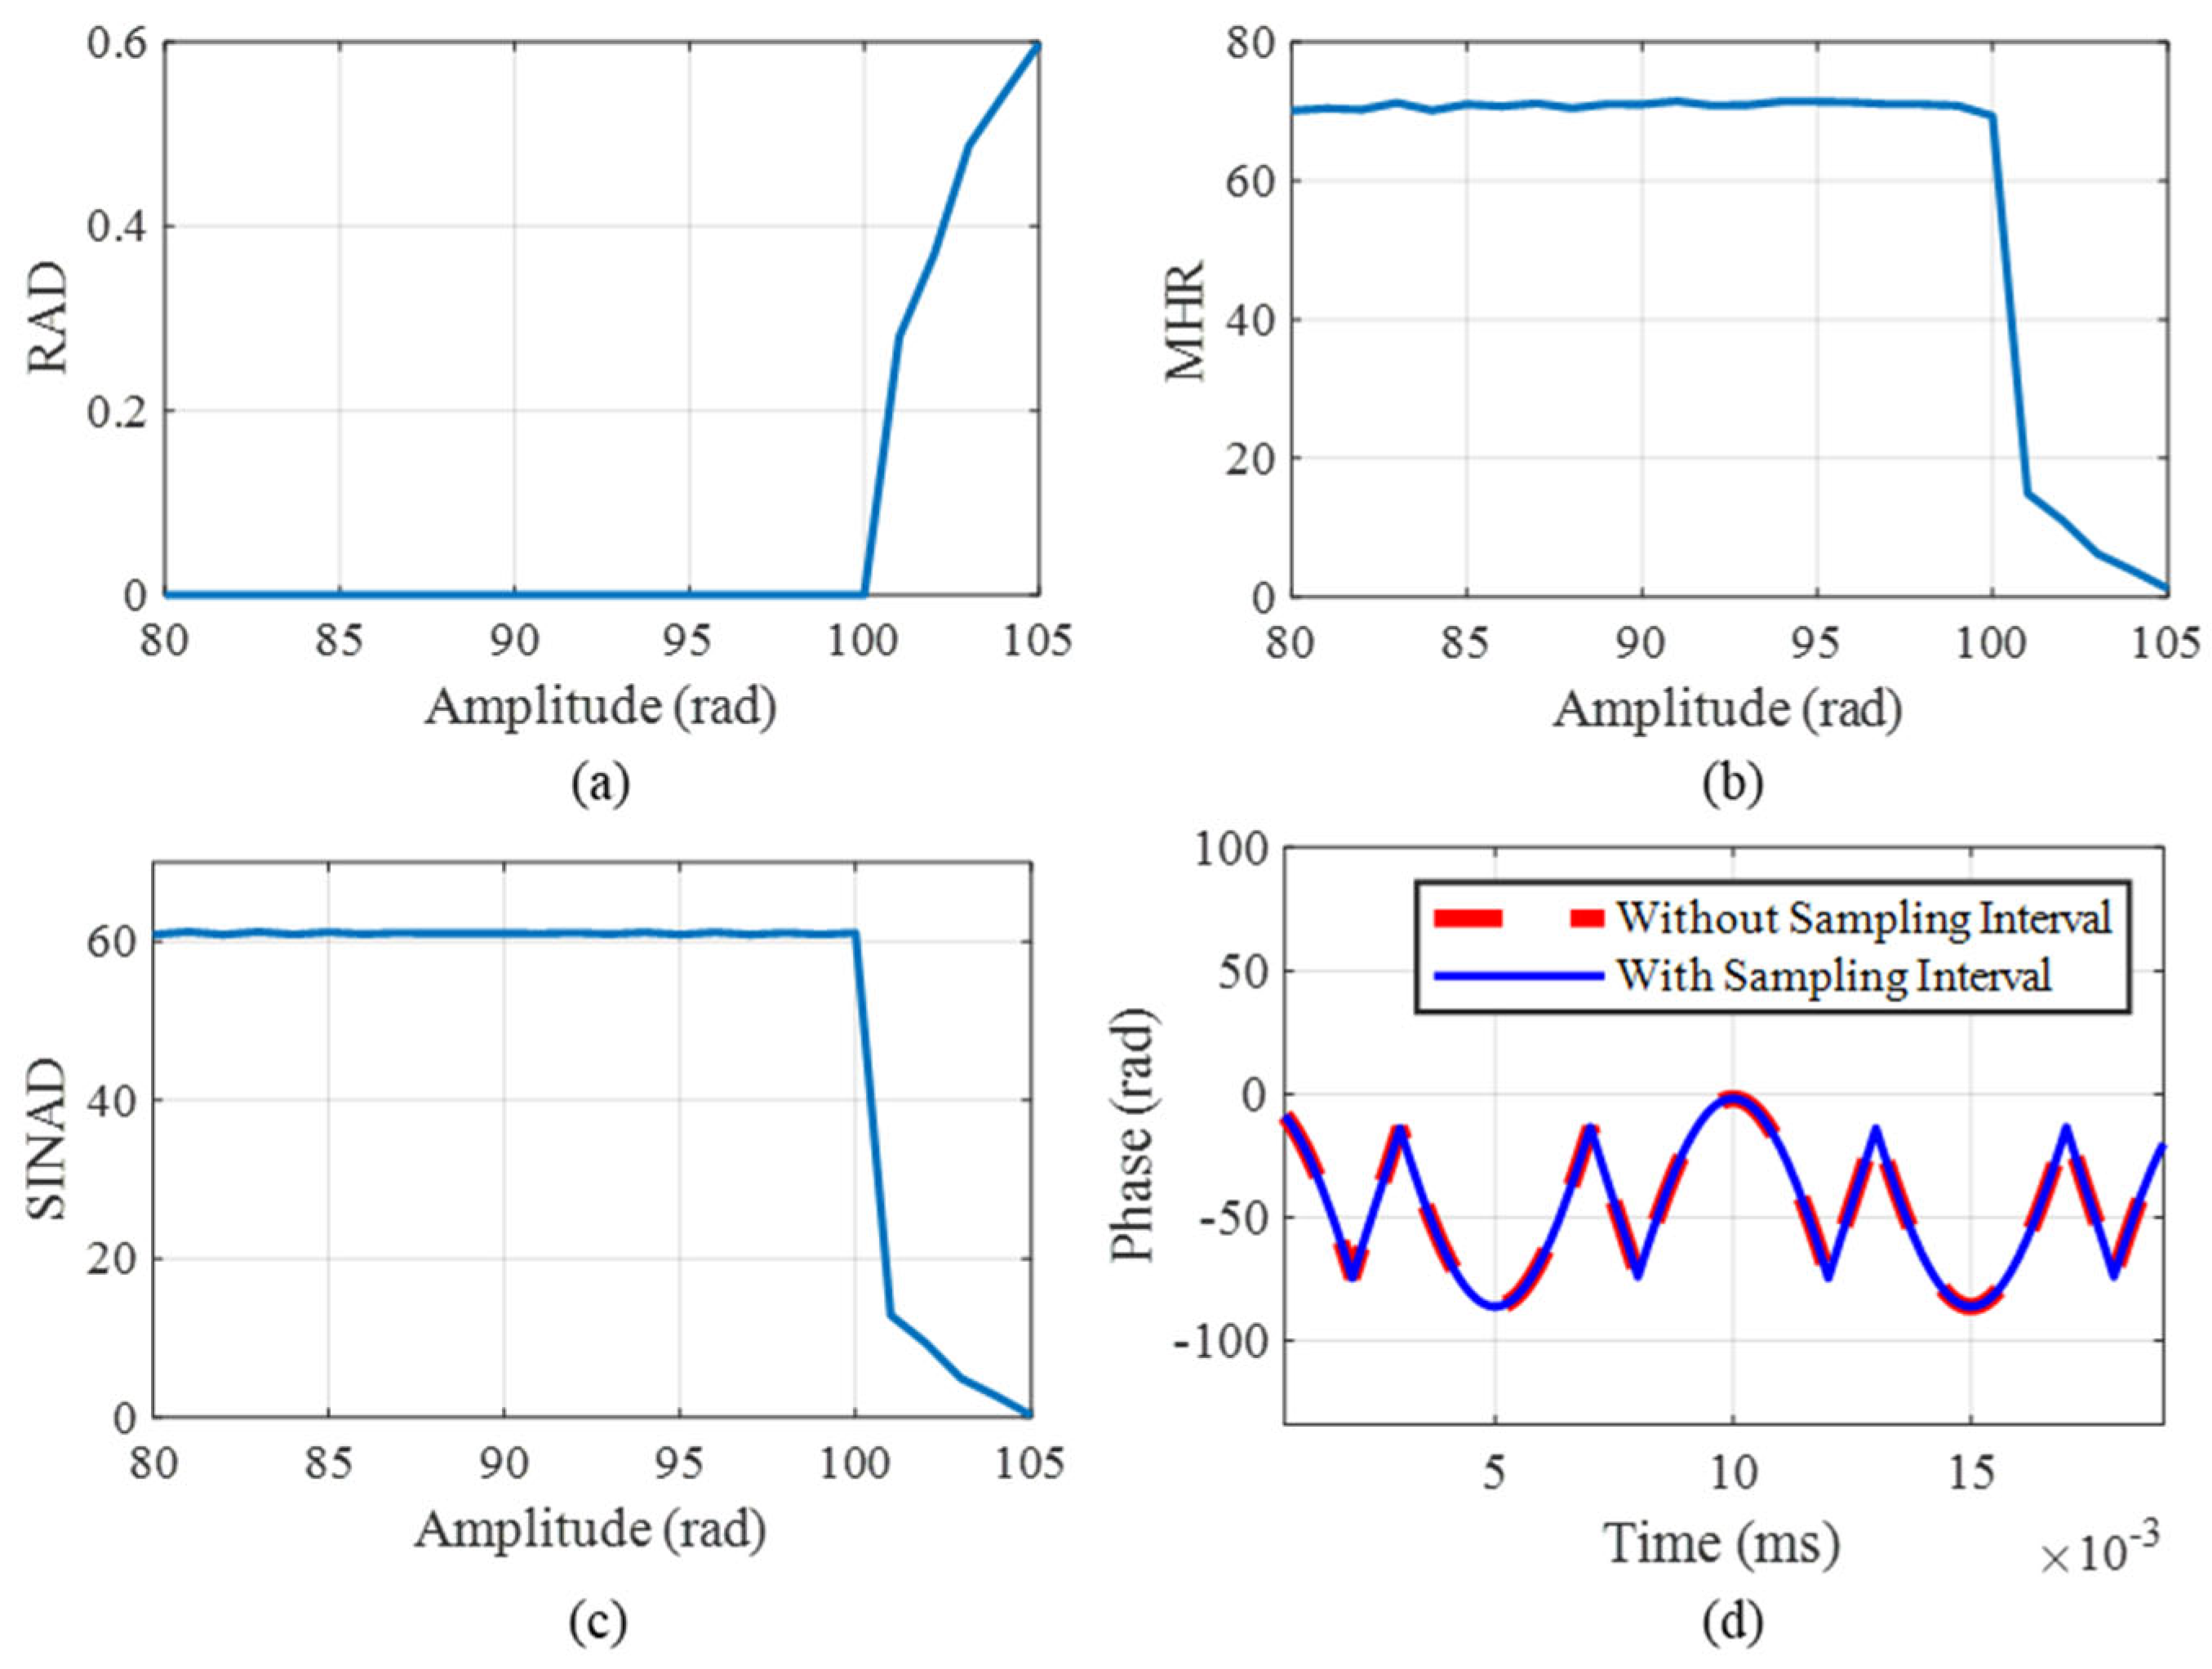
With the sampling rate set to 200 kHz, signal frequency to 1 kHz, and amplitude to 100 rad, multiple modulated signals are generated for each sampling interval, ranging from 250 ns to 900 ns.
Figure 5a–c depict the RAD, MHR, and SINAD results with different sampling intervals. By calculating the RAD, MHR, and SINAD, the demodulation signal is found to be distorted at 900 ns.
Figure 5d shows the comparison results with and without sampling intervals at 900 ns. In detail, the red line represents the phase using the ideal demodulation without a sampling interval, and the blue line represents the result using the RPBPM method with a sampling interval. The comparison result indicates that the sampling interval has led to the distortion of the result.
With the sampling rate set to 200 kHz, vibration frequency to 1 kHz, and sampling interval to 250 ns, multiple modulated signals are generated for each amplitude, ranging from 80 to 105 rad.
Figure 6a–c depict the RAD, MHR, and SINAD results with different amplitudes. The results indicate that, as the amplitude increases, harmonic interference in the demodulated signal becomes more pronounced. Additionally, the SINAD remains relatively high, but below 100 rad, suggesting good signal quality. The demodulation signal is found to be distorted at 101 rad. In order to further analyze the performance of the demodulation algorithm, we compare the result of the ideal demodulation without a sampling interval with that of the RPBPM method with a sampling interval. As illustrated in
Figure 6d, the experimental results demonstrate that the distortion originates from the insufficient satisfaction of the sampling theorem, rather than being attributable to the proposed RPBPM method.
With the sampling rate set to 200 kHz, vibration amplitude to 100 rad, and the sampling interval to 250 ns, multiple modulated signals are generated for each vibration frequency, ranging from 600 to 1001 Hz.
Figure 7a–c depict the RAD, MHR, and SINAD results. The demodulation signal is found to be distorted at 1001 Hz. In order to further analyze the performance of the demodulation algorithm, we compare the result of the ideal demodulation without a sampling interval with that of the RPBPM method with a sampling interval. As illustrated in
Figure 7d, the experimental results demonstrate that the distortion originates from the insufficient satisfaction of the sampling theorem, rather than being attributable to the proposed RPBPM method.
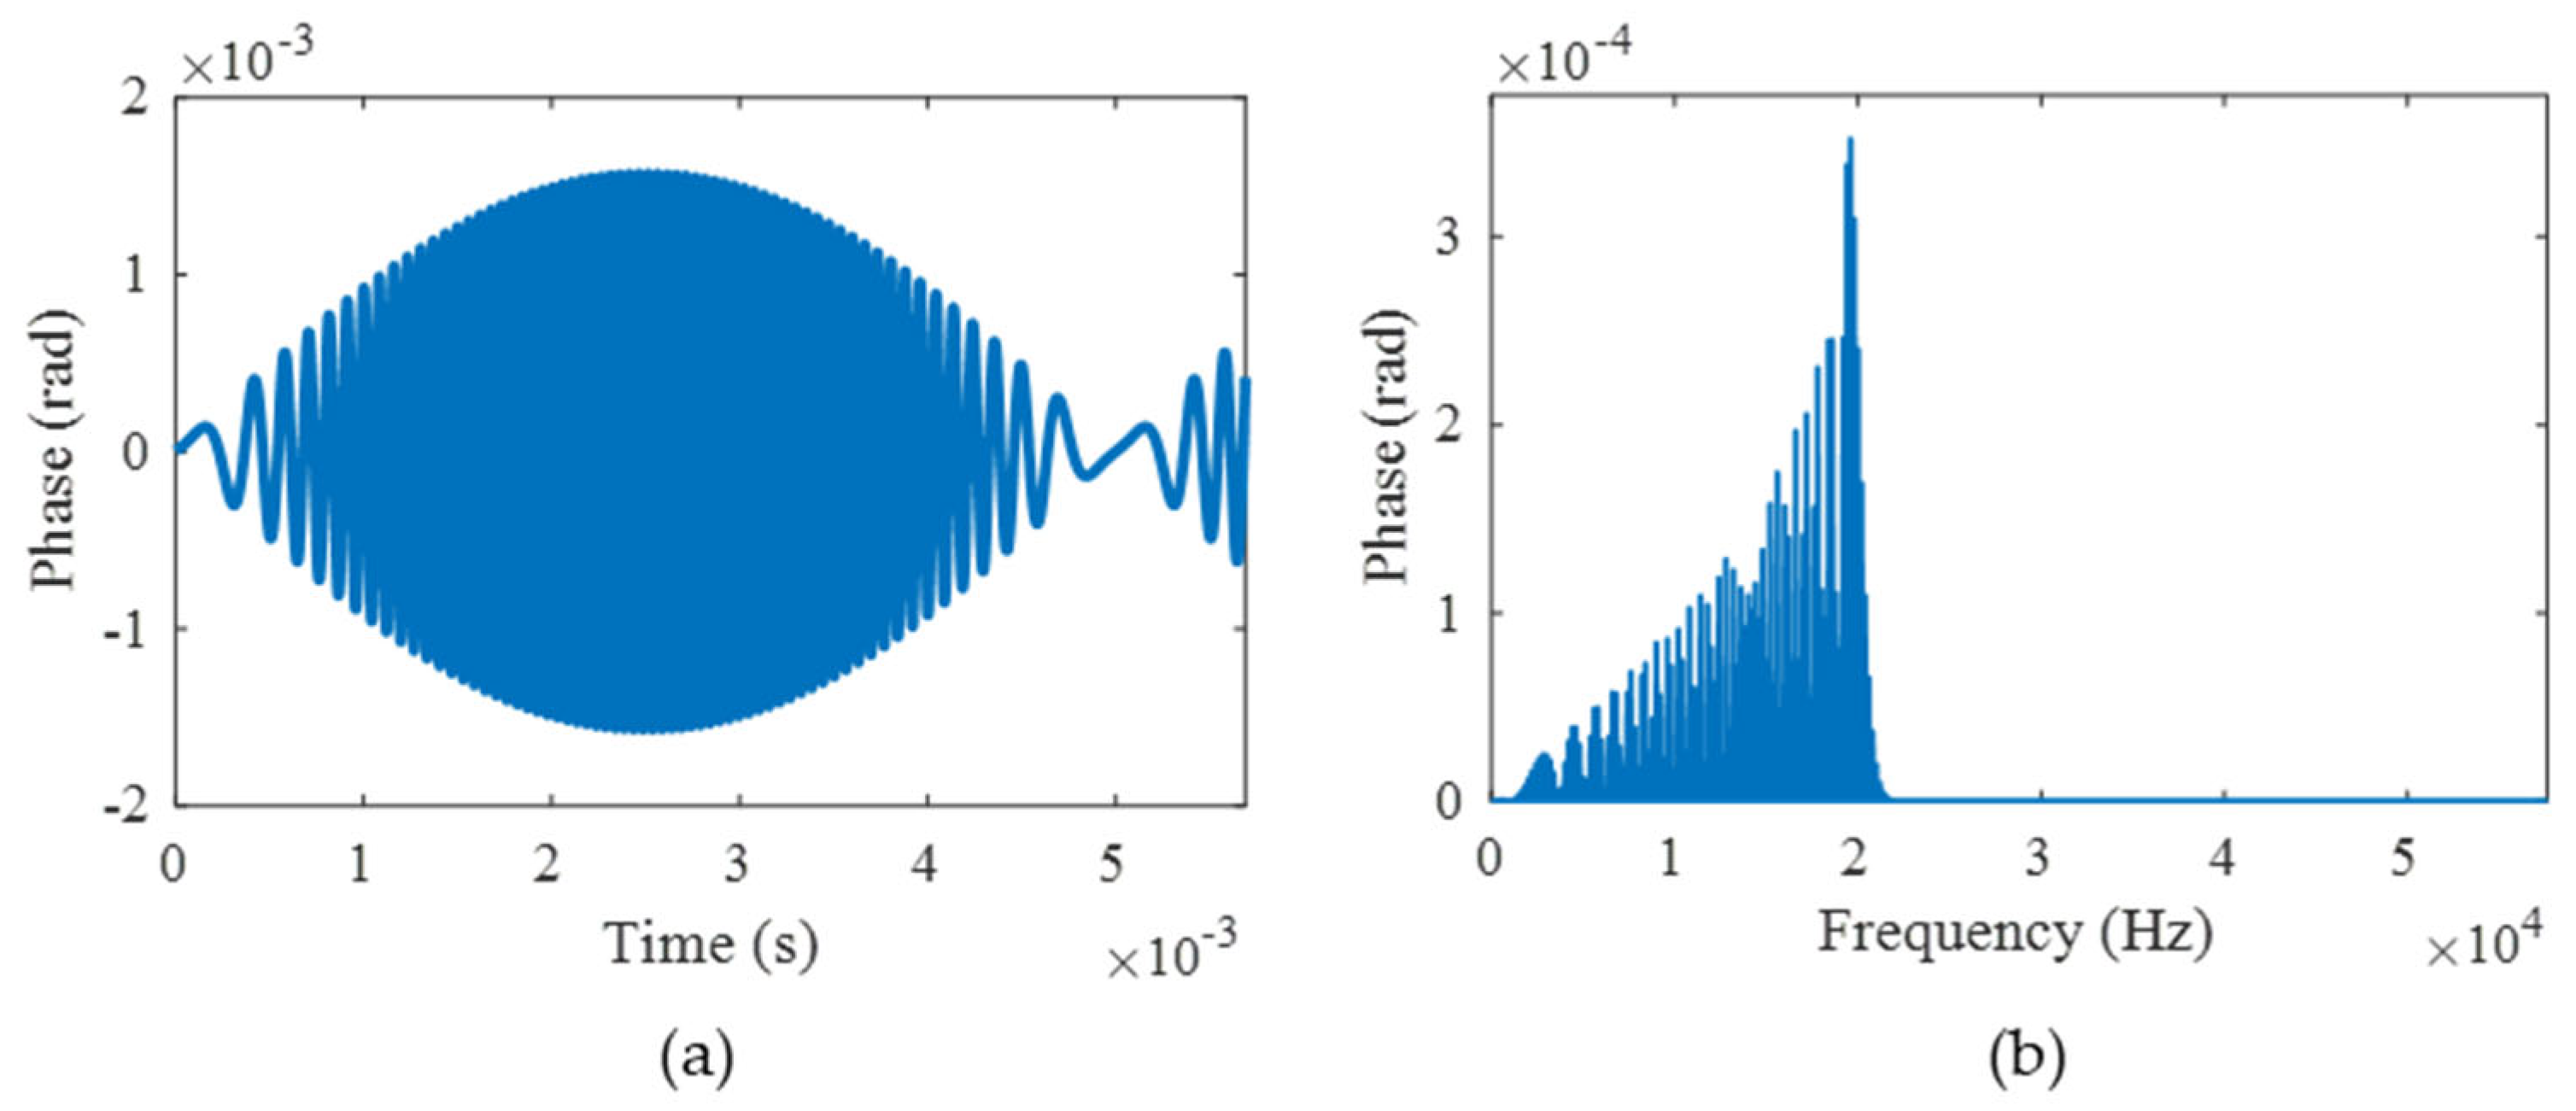
The preceding analysis reveals that the principal cause of demodulation distortion originates from the sampling interval. By selecting appropriate sampling intervals in accordance with specific application requirements, this method demonstrates remarkable adaptability across practical implementations. Finally, assuming Δ
t = 50 ns,
f = 1000 Hz, and
D = 100 rad, as shown in
Figure 8, the time and frequency errors are 0.0016 rad and 0.000353 rad, respectively. The RAD, MHR, and SINAD are 0.0000782%, 85.5 dB, and 75.1 dB. The results evidently accord with the lossless standard. Hence, by setting the sampling interval reasonably, the vibration signal with an upper-limit amplitude of 100 rad and an upper-limit frequency of 1000 Hz can be effectively achieved.
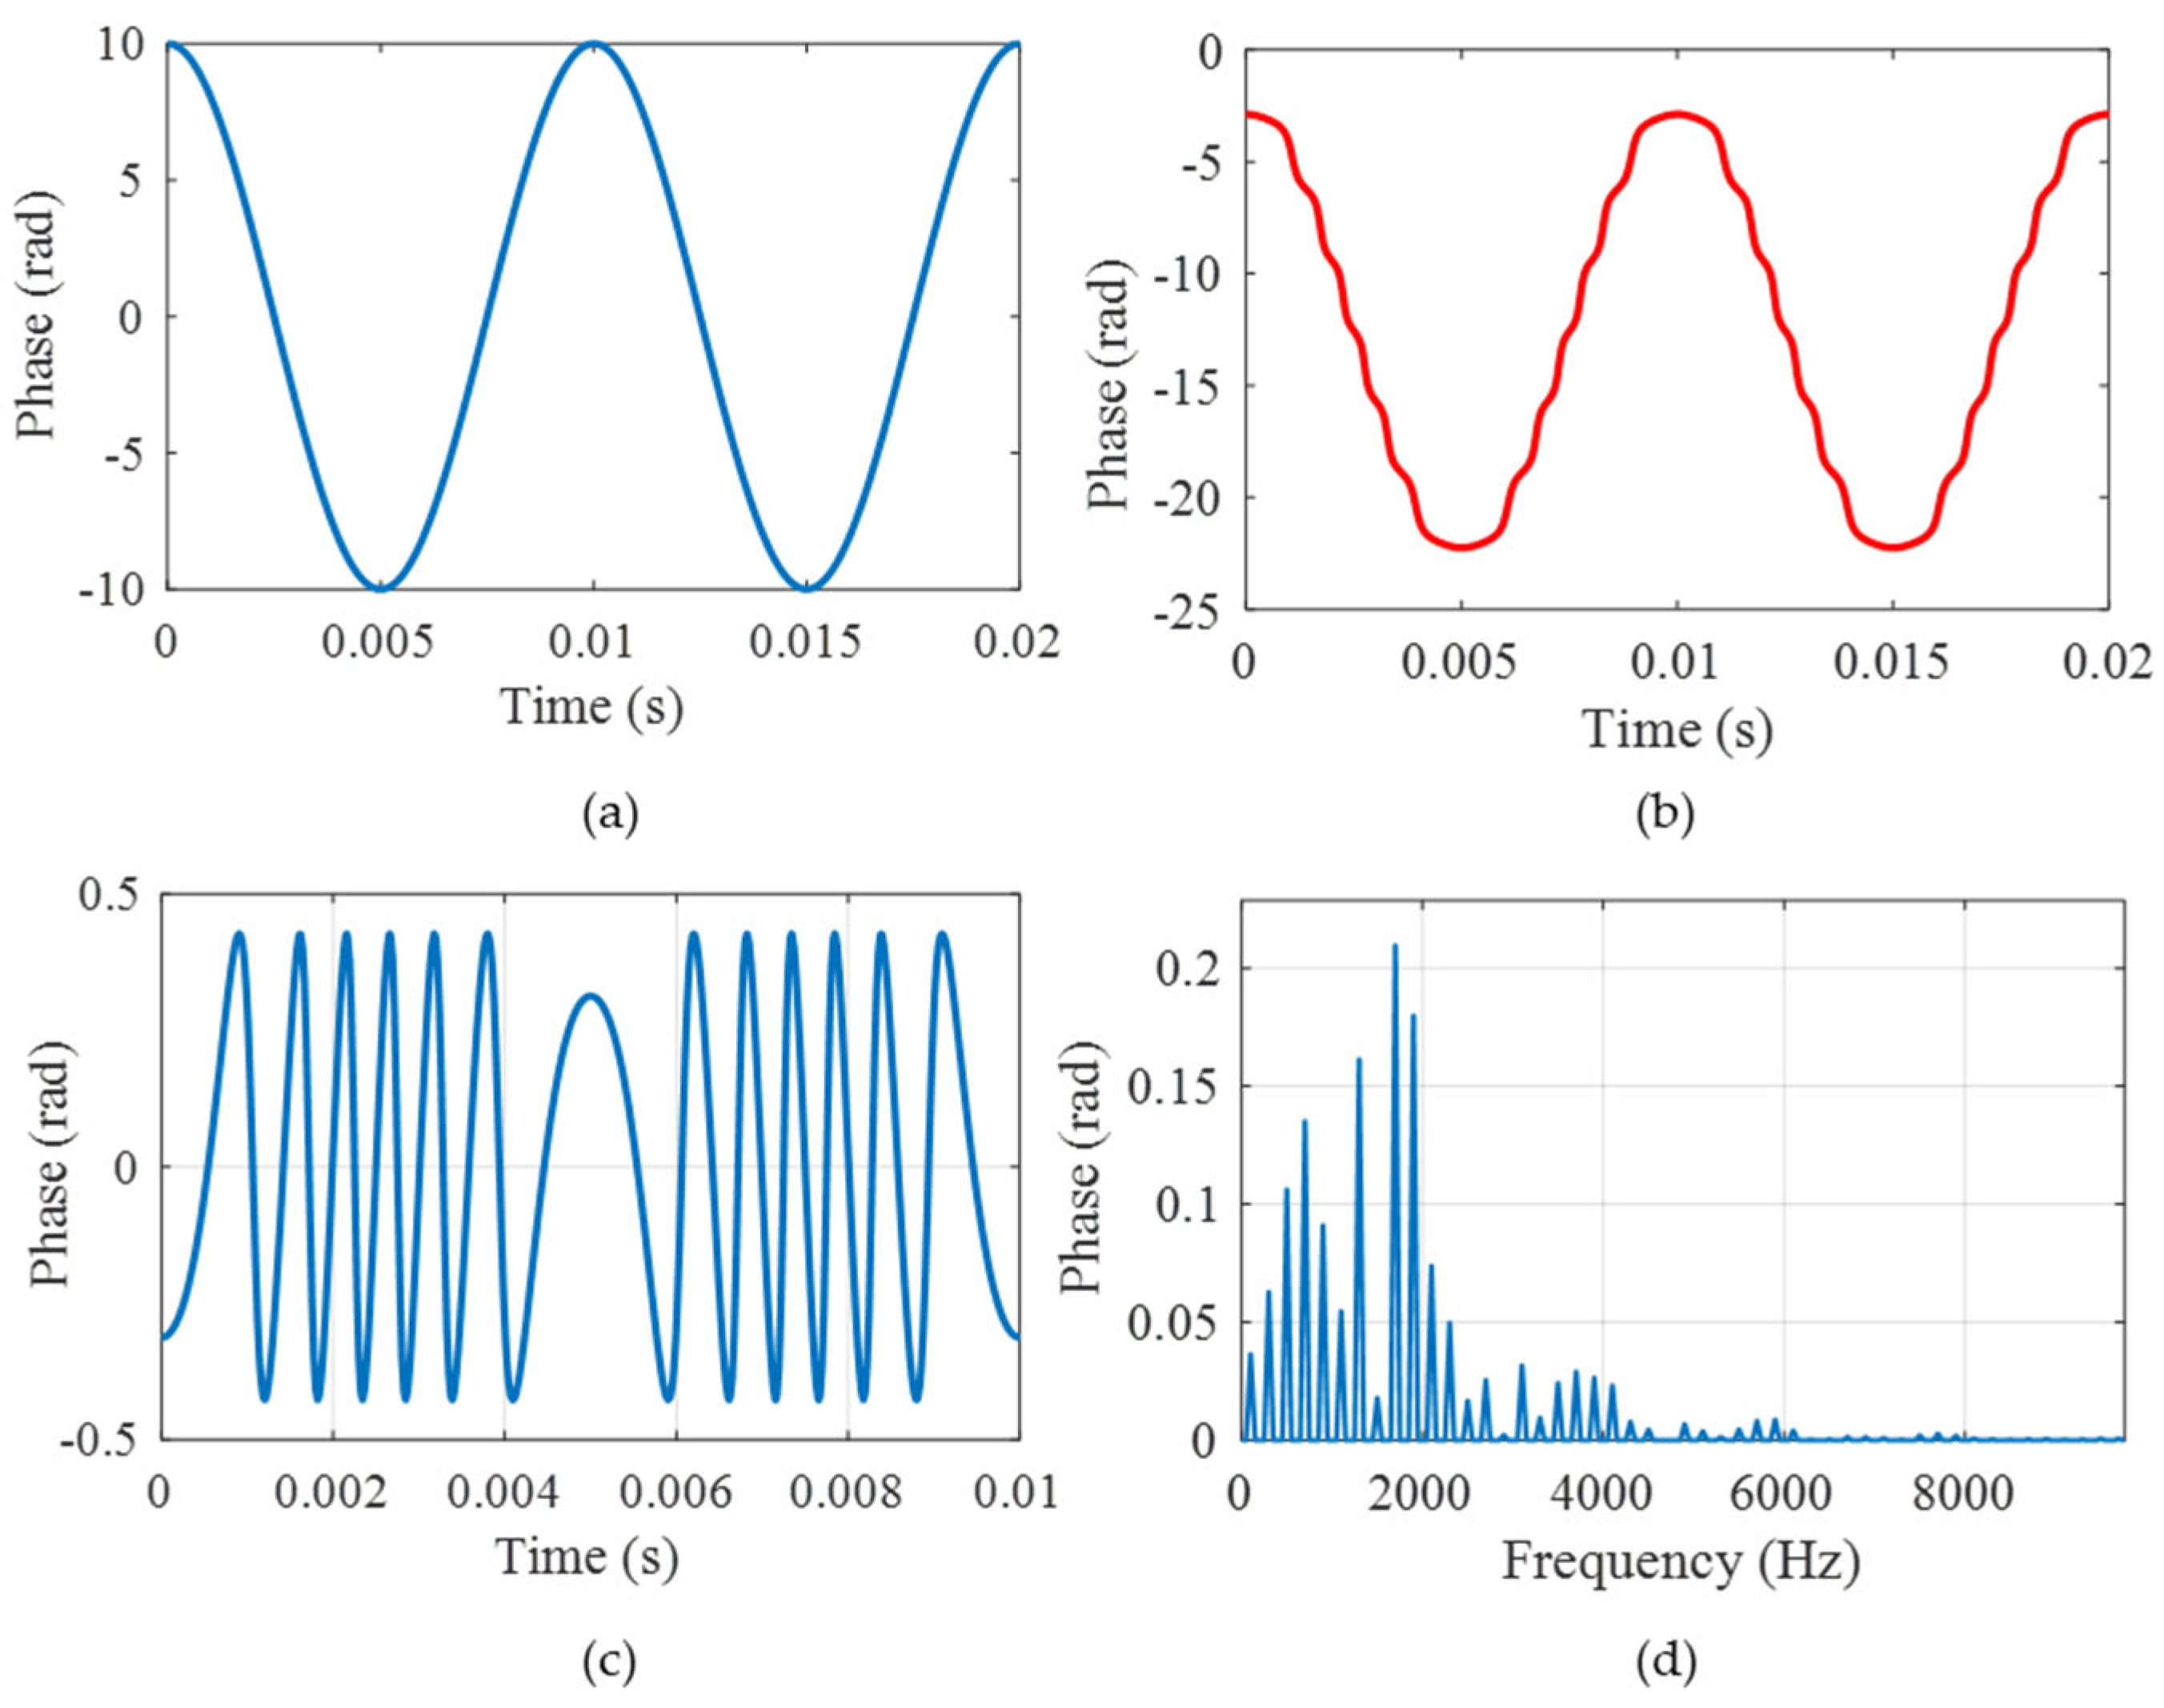
Secondly, the error simulation caused by the modulation depth deviation was carried out. The parameter settings are listed in
Table 2. The theoretical vibration signal is shown in
Figure 9a, and the demodulated phase is shown in
Figure 9b. Comparing the two curves, we observe that the demodulated phase has an obvious distortion. As shown in
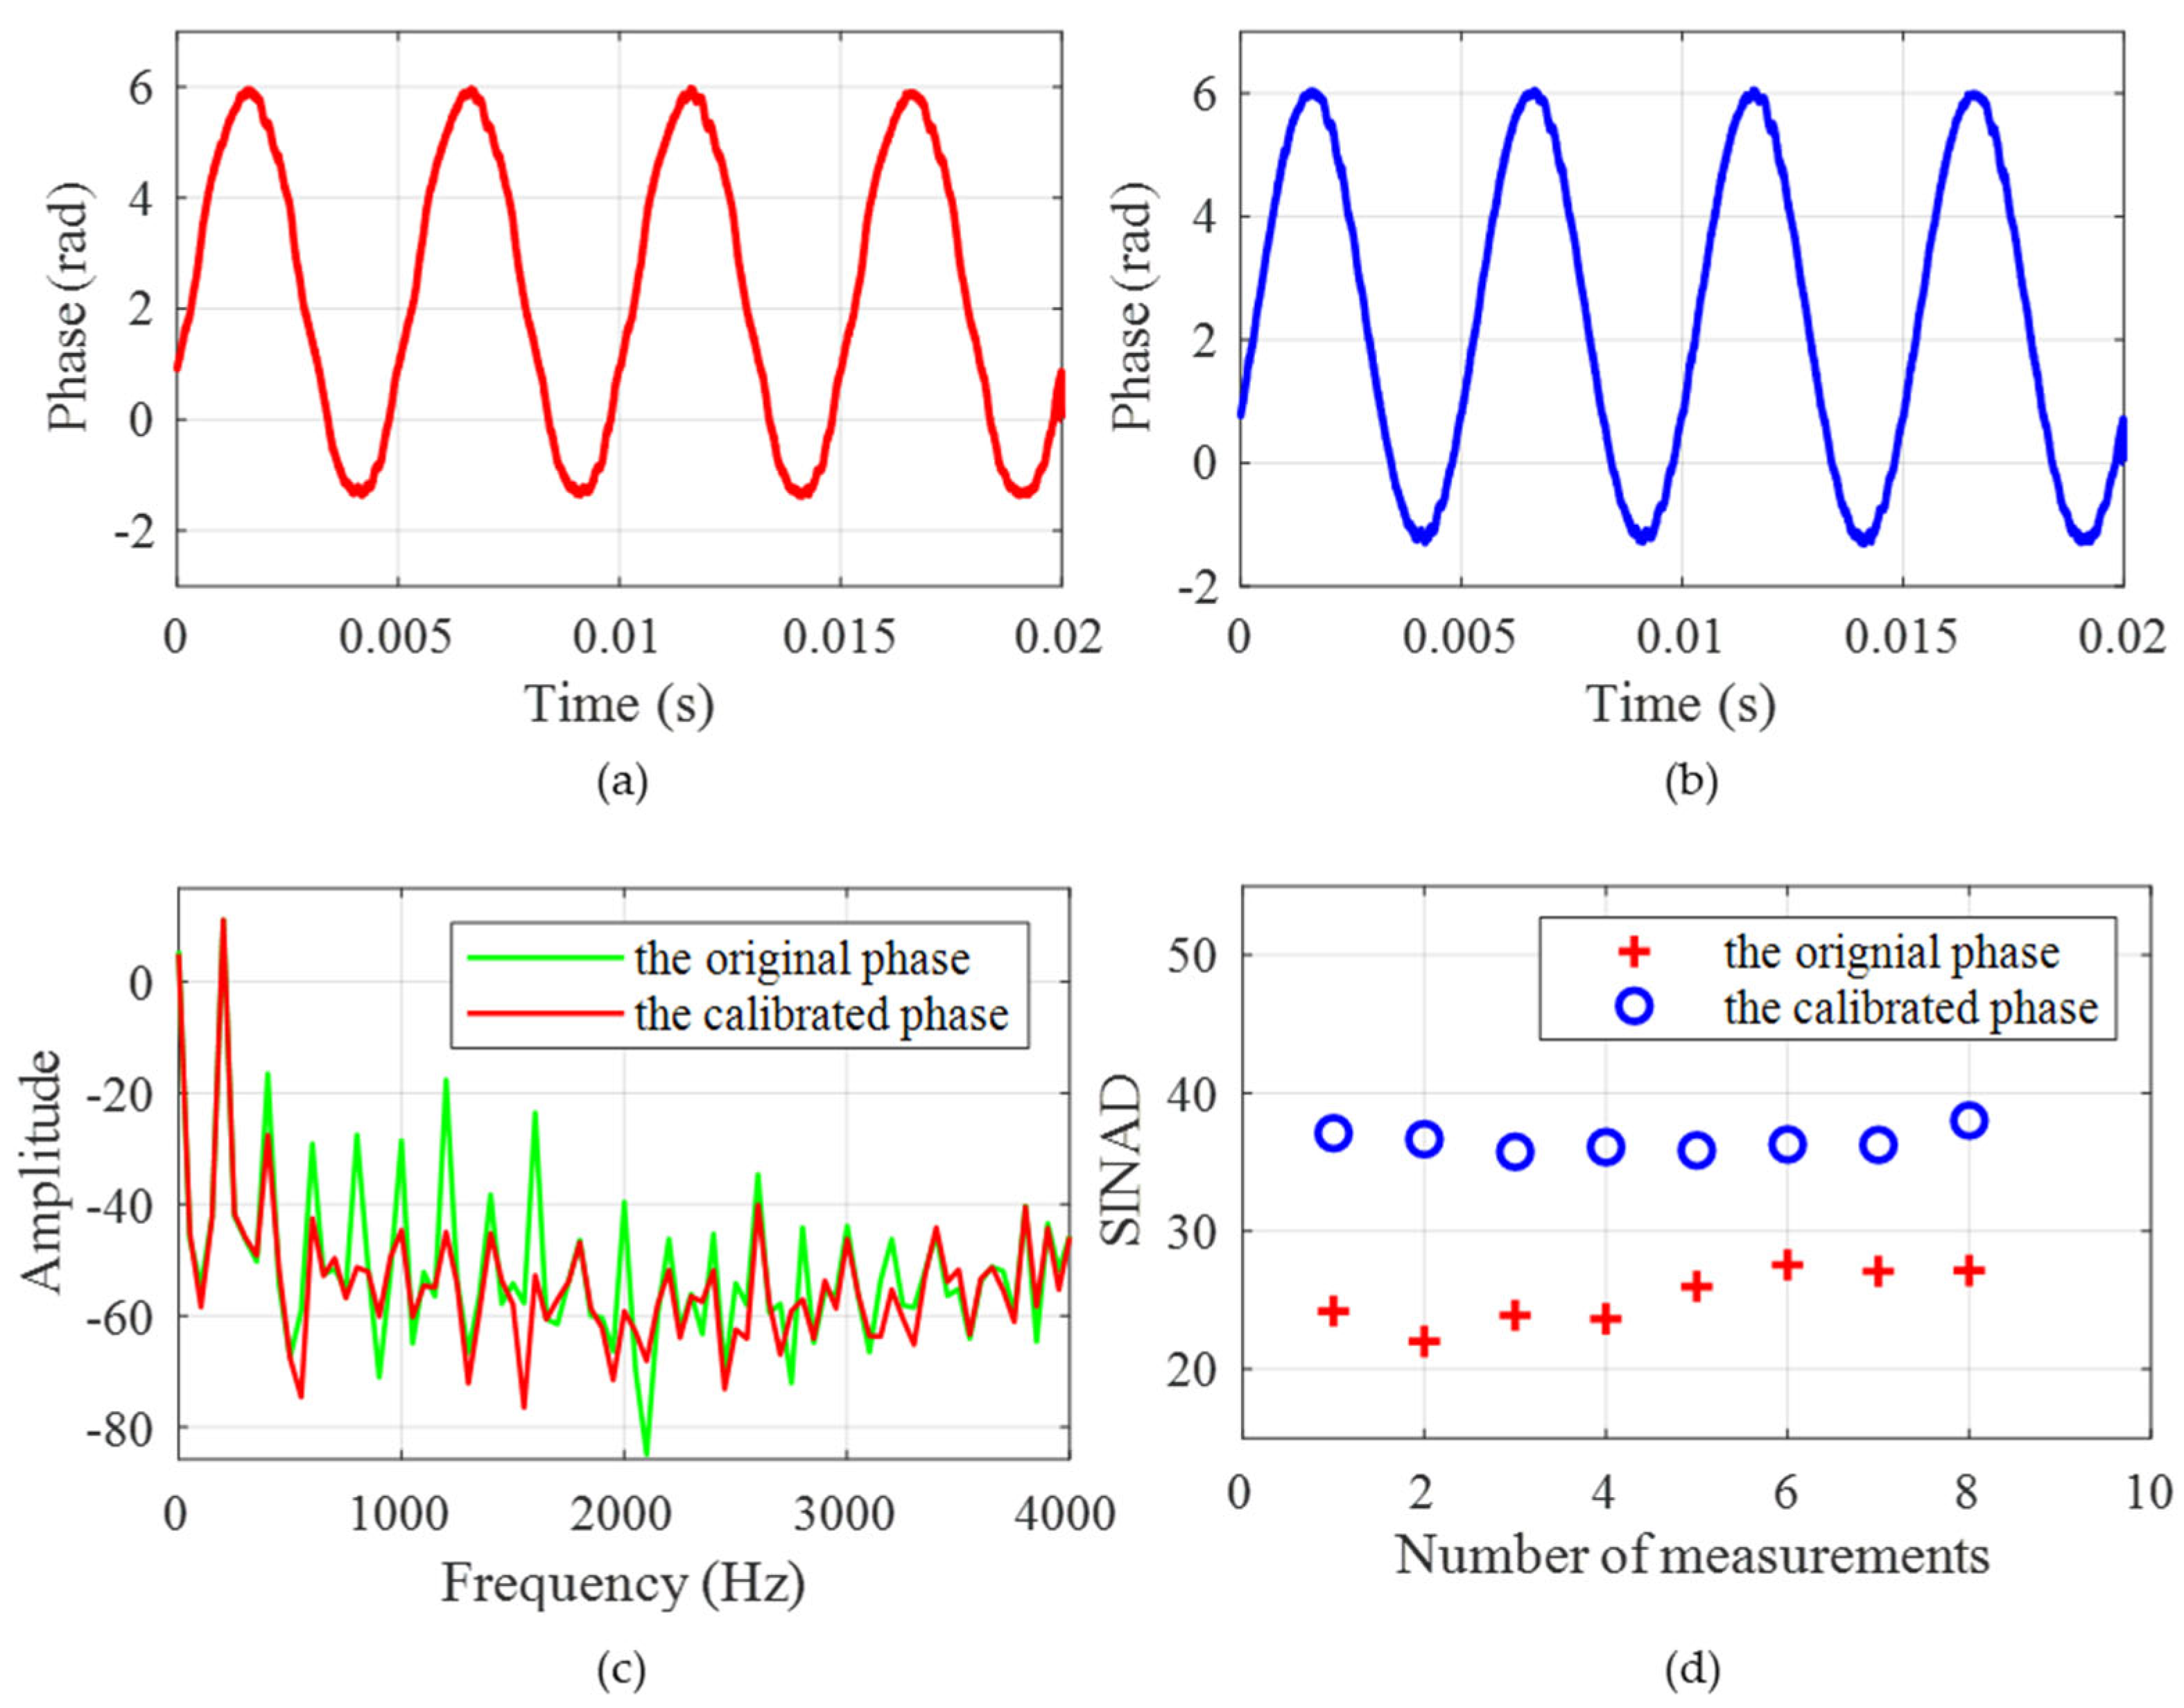
Figure 9c,d, the time and frequency errors are 0.427 rad and 0.210 rad, respectively, and we obtain the RAD, MHR, and SINAD, which are 3.1285%, 33.542 dB, and 27.9183 dB, respectively, resulting in the serious distortion of phase demodulation. Thus, the modulation depth deviation error needs to be compensated for.
